Schools commentary July 2022: schools that require improvement
Updated 22 November 2022
Applies to England

© Crown copyright 2022
This publication is licensed under the terms of the Open Government Licence v3.0 except where otherwise stated. To view this licence, visit nationalarchives.gov.uk/doc/open-government-licence/version/3 or write to the Information Policy Team, The National Archives, Kew, London TW9 4DU, or email: psi@nationalarchives.gov.uk.
Where we have identified any third party copyright information you will need to obtain permission from the copyright holders concerned.
This publication is available at https://www.gov.uk/government/publications/school-inspections-statistical-commentaries-2021-to-2022/schools-commentary-july-2022-schools-that-require-improvement
This commentary draws on school inspection data for the period 1 September 2021 to 30 June 2022.
Out of the 1,600 graded inspections[footnote 1] we carried out this academic year, nearly 600 were of schools previously judged to require improvement (RI).
A higher proportion of the RI schools inspected in 2021/22 have improved than in 2019/20: 70% compared with 56% in 2019/20.[footnote 2]
A higher proportion of primary schools than secondary schools improved (71% compared with 68%). However, the biggest increase was for secondary schools, with an increase of 26 percentage points from 42% in 2019/20.
Inspection outcomes of previously RI primary schools, over time (percentages)
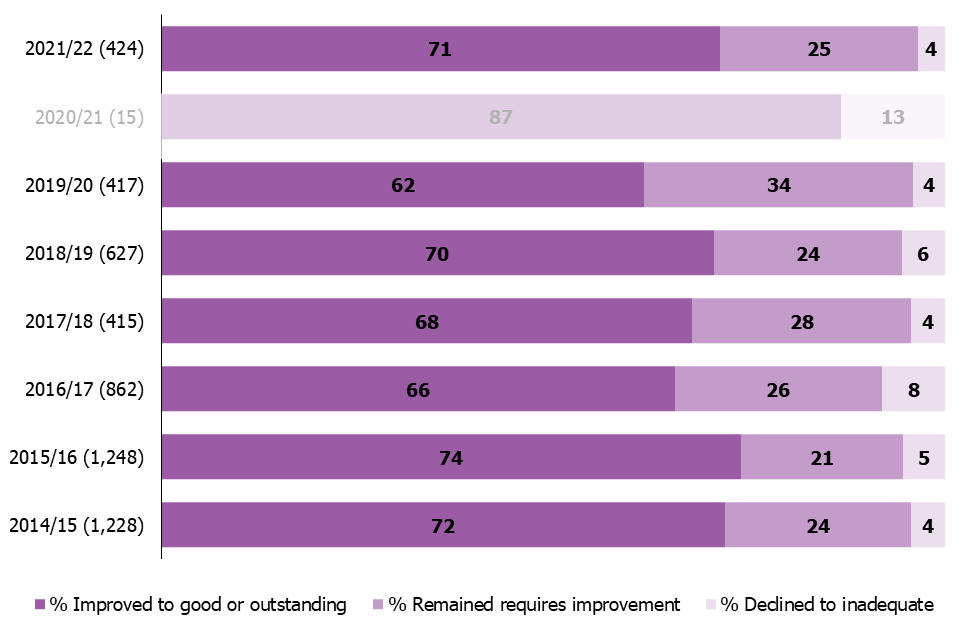
View data in an accessible format.
Inspection outcomes of previously RI secondary schools, over time (percentages)
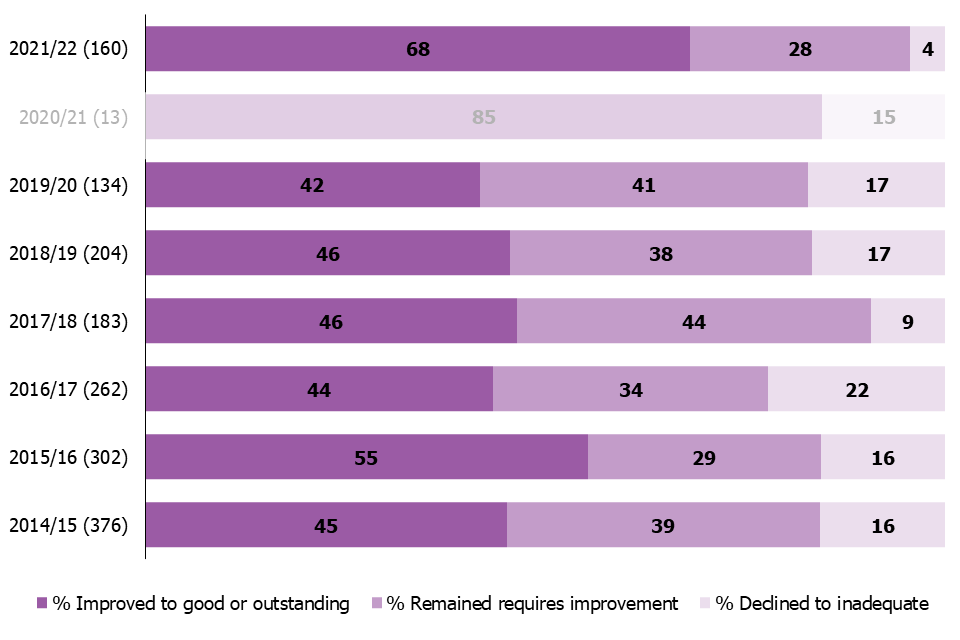
View data in an accessible format.
Time between inspections
Because we paused most inspections in March 2020 due to the COVID-19 pandemic, the length of time between graded inspections of schools that previously required improvement increased considerably, from 2.6 years in 2019/20 to 4.0 years in 2021/22. Most of the schools inspected in 2021/22 had last been inspected between 3 and 4 years ago. We introduced our new education inspection framework (EIF) during this period, in September 2019.[footnote 3]
On average, academies had longer gaps between inspections than schools maintained by the local authority (4.3 compared with 3.8 years). This was usual before the pandemic too. This is because new academies are usually inspected in their third year as a new academy. The last inspection of the predecessor school may also have taken place some time before the school became an academy.
Monitoring visits
Most schools do not have a monitoring visit between their graded inspections unless they had been judged as RI at 2 consecutive inspections.[footnote 4] However, the 21% that did have a monitoring visit had on average 2 visits each, compared with 1 in 2019/20. This is because of the additional monitoring visits carried out during the pandemic, including interim visits[footnote 5] in autumn 2020 and COVID-specific monitoring visits in spring and summer 2021.
Type of school
74% of the academies inspected this year improved compared with 66% of schools maintained by local authorities. Of the academies that improved, 76% were established academies (rather than new ones being inspected for the first time) and the vast majority of these (91%) are in multi-academy trusts.
Regions
In each region at least 6 out of 10 of the RI schools inspected this year improved. Each region also saw an increase in the percentage of RI schools that improved compared with 2019/20, although some were small increases and based on very small numbers.
Inspection outcomes of previously RI schools inspected in 2021/22, by region (numbers)
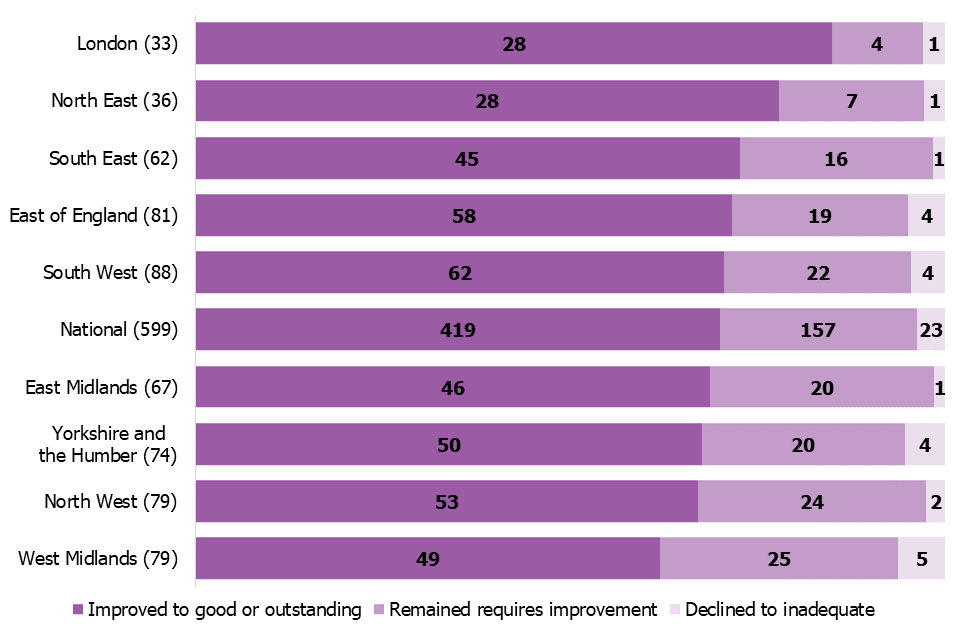
View data in an accessible format.
Data tables for figures
This section contains data for all figures in an accessible table format.
Data for Inspection outcomes of previously RI primary schools, over time (percentages)
| Academic year | % Improved to good or outstanding | % Remained requires improvement | % Declined to inadequate |
|---|---|---|---|
| 2014/15 (1,228) | 72 | 24 | 4 |
| 2015/16 (1,248) | 74 | 21 | 5 |
| 2016/17 (862) | 66 | 26 | 8 |
| 2017/18 (415) | 68 | 28 | 4 |
| 2018/19 (627) | 70 | 24 | 6 |
| 2019/20 (417) | 62 | 34 | 4 |
| 2020/21 (15) | 87 | 0 | 13 |
| 2021/22 (424) | 71 | 25 | 4 |
See Figure: Inspection outcomes of previously RI primary schools, over time (percentages).
Data for Inspection outcomes of previously RI secondary schools, over time (percentages)
| Academic year | % Improved to good or outstanding | % Remained requires improvement | % Declined to inadequate |
|---|---|---|---|
| 2014/15 (376) | 45 | 39 | 16 |
| 2015/16 (302) | 55 | 29 | 16 |
| 2016/17 (262) | 44 | 34 | 22 |
| 2017/18 (183) | 46 | 44 | 9 |
| 2018/19 (204) | 46 | 38 | 17 |
| 2019/20 (134) | 42 | 41 | 17 |
| 2020/21 (13) | 85 | 0 | 15 |
| 2021/22 (160) | 68 | 28 | 4 |
See Figure: Inspection outcomes of previously RI secondary schools, over time (percentages).
Data for Inspection outcomes of previously RI schools inspected in 2021/22, by region (numbers)
| Region | Improved to good or outstanding | Remained requires improvement | Declined to inadequate |
|---|---|---|---|
| London (33) | 28 | 4 | 1 |
| North East (36) | 28 | 7 | 1 |
| South East (62) | 45 | 16 | 1 |
| East of England (81) | 58 | 19 | 4 |
| South West (88) | 62 | 22 | 4 |
| National (599) | 419 | 157 | 23 |
| East Midlands (67) | 46 | 20 | 1 |
| Yorkshire and the Humber (74) | 50 | 20 | 4 |
| North West (79) | 53 | 24 | 2 |
| West Midlands (79) | 49 | 25 | 5 |
See Figure: Inspection outcomes of previously RI schools inspected in 2021/22, by region (numbers).
-
Graded inspections are also known as full Section 5 inspections. ↩
-
Due to the pandemic, the numbers of schools inspected in 2020/21 are too small to compare to other years. ↩
-
For the research evidence underpinning the development of the framework see ‘Education inspection framework: overview of research’, Ofsted, July 2019. For the latest inspection guidance see ‘School inspection handbook for September 2022’, Ofsted, July 2022. ↩
-
Schools which have only been RI at their latest graded inspection do not usually have a monitoring visit. Schools which have been RI at their last two (or more) inspections usually have a monitoring visit, unless their Leadership and Management was judged to be good or outstanding, or the previous inspection was of a local authority school which has since become an academy. For the latest guidance see the ‘School monitoring handbook for September 2022’, Ofsted, July 2022. ↩
-
Interim visits were part of our phased return to routine inspection, and did not make any inspection judgements. They were designed to reassure and inform parents, government and the public about how schools were managing the return to full education for all pupils. They also provided evidence for a research report on the impact of the pandemic. See data and the research report. ↩