Emissions of air pollutants in the UK – Ammonia (NH3)
Updated 19 February 2024

© Crown copyright 2024
This publication is licensed under the terms of the Open Government Licence v3.0 except where otherwise stated. To view this licence, visit nationalarchives.gov.uk/doc/open-government-licence/version/3 or write to the Information Policy Team, The National Archives, Kew, London TW9 4DU, or email: psi@nationalarchives.gov.uk.
Where we have identified any third party copyright information you will need to obtain permission from the copyright holders concerned.
This publication is available at https://www.gov.uk/government/statistics/emissions-of-air-pollutants/emissions-of-air-pollutants-in-the-uk-ammonia-nh3
1. What is ammonia and why are emissions of it estimated?
Ammonia (NH3) is a gas that only stays in the atmosphere for a few hours once emitted. However, when ammonia mixes with other gases in the atmosphere, such as nitrogen oxides and sulphur dioxide, it can form particulate matter (PM) which can exist for several days and be transported large distances. PM formed through this process are classed as secondary pollutants and therefore it is not included in the PM emissions estimations reported in this release. However, there are major health concerns linked to exposure to PM concentrations. Therefore, estimating ammonia emissions is important to help us understand how much secondary PM derived from ammonia contributes to the concentrations.
Deposition of chemical compounds containing ammonia to the environment can also cause significant long-term harm to sensitive habitats by increasing nitrogen concentrations in soil or water. When soil nitrogen levels increase, common plant species that thrive in these conditions can dominate habitats at the expense of other rarer species. This can result in major changes to plant community structure (e.g. affecting the composition and diversity of plant species) which affects associated animal species. Ammonia is also directly toxic to plants and some species of moss and lichen are impacted even at very low concentrations.
The vast majority of ammonia emissions come from agricultural sources, in particular livestock manure, urine and the spreading of inorganic fertilisers. A small portion of ammonia emissions stem from waste and a range of diffuse sources (i.e. wide geographical spread and large variety of emission sources, ranging from composting to domestic pets). The UK aims to reduce emissions of ammonia, particularly from agricultural sources, as there are abatement measures available to reduce emissions from this source.
The National Atmospheric Emissions Inventory (NAEI) and the statistical tables published as part of this release mostly covers ammonia emissions from human activities in the UK, but there are a few exceptions included as memo items, such as emissions from the wastes of wild birds. The national totals referred to in this document only relate to ammonia emissions from human activities in the UK.
The revised Convention on Long Range Transboundary Air Pollution’s amended Gothenburg Protocol (CLRTAP) and National Emission Ceilings Regulations (2018) (NECR) require the UK to reduce ammonia emissions by 8 per cent compared to emissions in 2005 by 2020 and in each subsequent year up to and including 2029. The NECR also requires the UK to reduce ammonia emissions by 16 per cent compared to emissions in 2005 by 2030.
2. Trends in total annual emissions of ammonia in the UK, 1980 to 2022
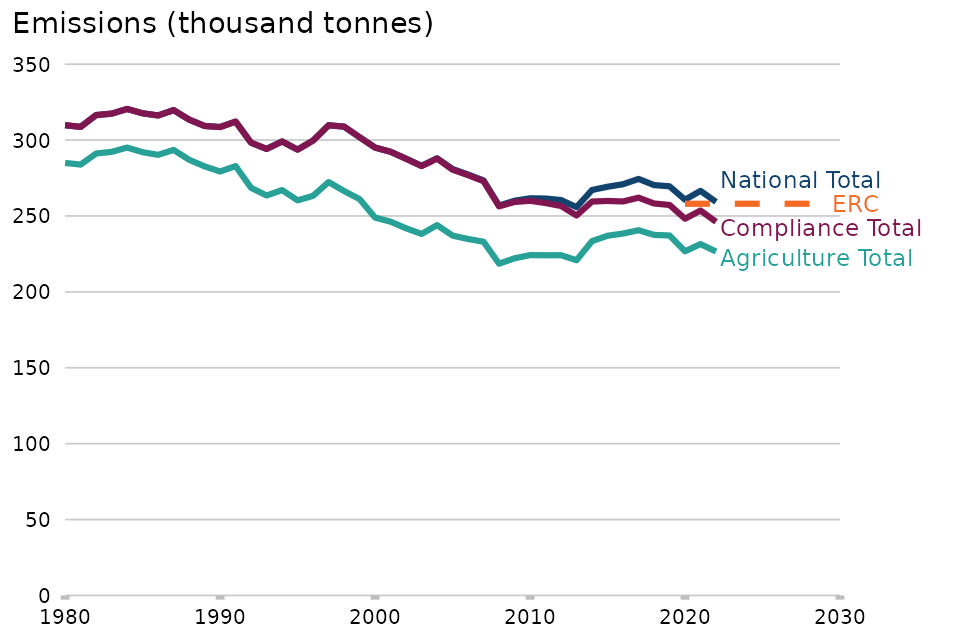
Figure 8: Annual emissions of ammonia in the UK: 1980 to 2022
Notes:
-
‘2020-2029 ERC’ refers to the UK’s emission reduction commitments, set out in the National Emission Ceilings Regulations (2018)/Convention on Long Range Transboundary Air Pollution’s amended Gothenburg Protocol. This applies to the series labelled ‘Compliance Total’.
-
Estimates of ammonia emissions were only included in the inventory from 1980.
Download the data for this chart in CSV format
Emissions of ammonia have decreased by 16 per cent since 1980, to 259 thousand tonnes in 2022. The majority of this reduction occurred between 1980 and 2008. Emissions of ammonia then remained relatively stable from 2008 to 2013. Annual ammonia emissions reached the lowest in the time series in 2013 at 256 thousand tonnes. Since then, emissions have been higher, but have remained below the levels seen prior to the mid-2000s. Changes in the trend of emissions of ammonia are largely driven by changes to farming practices and herd sizes.
Emissions from agriculture contributed 87 per cent of total ammonia emissions in 2022. Emissions have increased slightly from 224 thousand tonnes in 2010 to 227 thousand tonnes in 2022, although emissions have generally fluctuated throughout this period. Recent changes in emissions have been in part driven by annual variations in weather conditions affecting crop planting and fertiliser use, as well as energy prices affecting the use of fertilisers.
For compliance purposes annual total emissions of ammonia are adjusted by removing the contribution of emissions from non-manure digestate spreading from the whole time-series. Considering the adjusted total for compliance, there were 246 thousand tonnes of ammonia emitted in the UK in 2022. Therefore, emissions decreased by 12 per cent since 2005 and the UK is compliant with both the NECR and the CLRTAP 2020-2029 emission reduction commitments.
Adjustments are permitted under the NECR and the 2012 amendment to the Gothenburg Protocol. Where non-compliance with the commitments results from applying improved emission inventory methods, updated in accordance with scientific knowledge, countries can prepare an adjusted inventory to reflect this. The UK prepared an adjusted inventory for ammonia on the basis of improvements to the methodology for calculating emissions from the application of non-manure digestates to land - a new source that has been added to the inventory since the emission reduction commitments were agreed. The UK submitted this adjusted inventory for scrutiny by UNECE experts. The adjusted inventory was approved by the CLRTAP, which brought the UK into compliance with the 2020-29 emission reduction commitments for ammonia in 2020, 2021 and 2022.
3. Major emission sources for ammonia in the UK
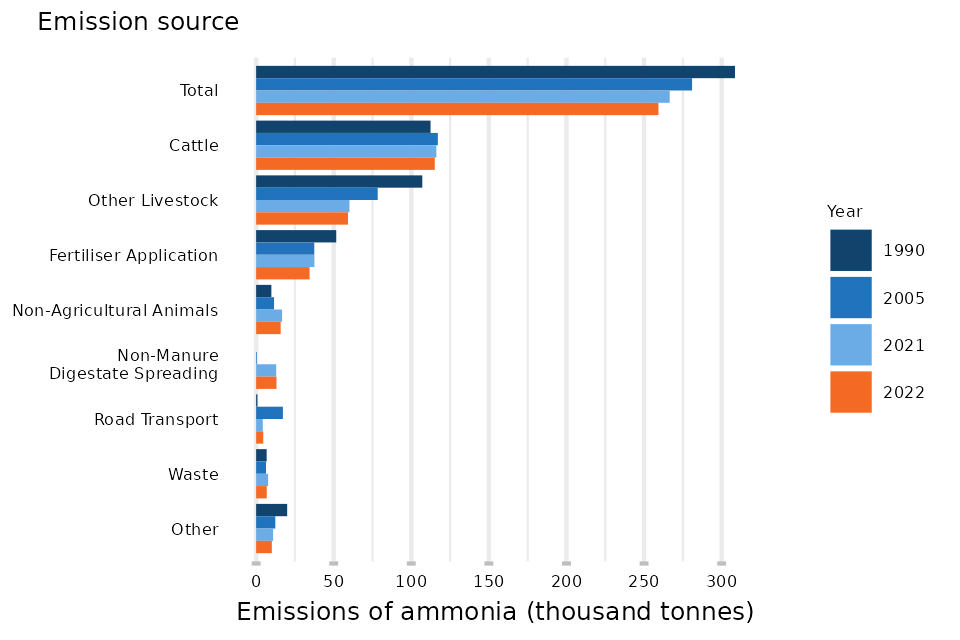
Figure 9: UK annual emissions of ammonia by 2022 major emissions sources: 1990, 2005, 2021 and 2022
Notes:
-
‘Cattle’ refers to both dairy and non-dairy cattle.
-
‘Other livestock’ refers to poultry, pigs, sheep, goats and deer.
-
‘Fertiliser application’ refers to the application of inorganic fertilisers to agricultural soils, including urea and ammonium nitrate. This does not include the spreading of livestock manure, sewage sludge or digestates.
-
‘Non-agricultural animals’ refers to domestic pets and non-agricultural horses.
-
‘Non-manure digestate spreading’. Non-manure digestates are produced from the anaerobic digestion of non-manure feedstocks (food waste, energy crops and crop residues and other organic residues) and are spread as fertiliser onto agricultural soils. This does not include the spreading of manure digestates, which are captured within emission estimates for livestock.
-
‘Road Transport’ refers to exhaust emissions from the combustion of fuels in road transport.
-
‘Waste’ includes composting, landfill, sewage sludge decomposition and waste incineration.
-
‘Other’ includes sewage sludge application to soils, as well as domestic and industrial product use.
Download the data for this chart in CSV format
The largest source of agricultural ammonia emissions is livestock, most notably from the decomposition of urea in animal wastes (and uric acid in poultry wastes). Emissions from livestock derive from the management of manure, the application of manure to soils and manure-based digestate spreading. Emissions from livestock also come from urine and dung deposited in housing, on yards and when grazing.
Cattle are the largest emitters of ammonia, accounting for approximately two thirds of all emissions from livestock in 2022. Emissions from cattle have remained between 110 and 119 thousand tonnes across the last 30 years. Emissions from dairy cattle have risen over the past decade, while emissions from other cattle have fallen. Poultry are the next largest emitting livestock group followed by pigs, sheep, horses, deer and goats. The fall in emissions from livestock other than cattle, especially from the pig and poultry sectors, is the main driver in the gradual fall of overall ammonia emissions since 1990. This can be partly explained by the Pollution Prevention and Control Act (1999) making all new intensive pig and poultry installations subject to ammonia controls through permitting.
The spreading of inorganic fertilisers is a large source of ammonia emissions from agriculture (it contributed 13 per cent of total ammonia emissions in 2022). Emissions from this source decreased by 46 per cent between 1987 and 2008 but then increased by 44 per cent between 2008 and 2016 (although remaining below levels seen in 1992). Emissions from this source decreased by 28 per cent from 2016 to 2022. The trend has been affected by urea-based fertilisers (which emit more ammonia) being more widely used within the agricultural sector. Emissions from urea-based fertilisers have been on an upward trend since the mid-90’s (although they did fall from 2016 to 2020), while emissions from other fertilisers have shown a downtrend trend. There was a decrease in overall emissions from fertilisers in 2022, in part driven by increased energy prices which impacted the costs of fertilisers.
Ammonia can be emitted from vehicle exhausts as a by-product of the catalytic conversion process designed to reduce emissions of nitrogen oxides. Emissions of ammonia from road transport increased up to 2002, when emissions then decreased as new vehicle emission standards were introduced. Road transport now represents a smaller share of total ammonia emissions (contributing 7 per cent of total emissions in 2002 and 2 per cent in 2022).
Emissions from waste contributed 3 per cent of total ammonia emissions in 2022. Most emissions of ammonia from the waste sector are from composting and anaerobic digestion. Ammonia emissions from waste also derive from the treatment and disposal of sewage and other waste material.
Emissions from the storage and spreading of non-manure digestates have increased since the mid-2000s when it contributed around 0.1 per cent of emissions to contribute 5 per cent of emissions in 2022. Digestates are the by-product of anaerobic digestion, which is used to generate biogas from feedstocks such as manures, food waste, crop residues and energy crops. Biogas produced from waste feedstocks provides a more sustainable alternative to natural gas derived from fossil fuels. Digestates are nutrient rich and are spread as fertiliser onto agricultural soils.
Levels and trends in emissions from specific sources are available for the period 1990 to 2022 through the statistical tables that accompany this release.
4. Sections in this release
Emissions of particulate matter (PM10 and PM2.5)
Emissions of non-methane volatile organic compounds
Methods and quality processes for UK air pollutant emissions statistics (PDF)