Emissions of air pollutants in the UK - Summary
Updated 19 February 2024

© Crown copyright 2024
This publication is licensed under the terms of the Open Government Licence v3.0 except where otherwise stated. To view this licence, visit nationalarchives.gov.uk/doc/open-government-licence/version/3 or write to the Information Policy Team, The National Archives, Kew, London TW9 4DU, or email: psi@nationalarchives.gov.uk.
Where we have identified any third party copyright information you will need to obtain permission from the copyright holders concerned.
This publication is available at https://www.gov.uk/government/statistics/emissions-of-air-pollutants/emissions-of-air-pollutants-in-the-uk-summary
1. Emissions of air pollutants in the UK - Summary
This section provides an overview of the information in the full publication. It contains statistics on annual emissions of six air pollutants from 1970 to 2022. The data comes from the National Atmospheric Emissions Inventory which estimates emissions using internationally agreed methods and a wide range of survey and administrative data sources, from both inside and outside of government.
The full publication is available here: Emissions of air pollutants in the UK.
Information on levels and trends in emissions of specific pollutants are available from the following links:
Emissions of particulate matter (PM10 and PM2.5)
Emissions of non-methane volatile organic compounds
UK emissions totals are disaggregated by sector in the accompanying tables. More detailed emissions totals are available on the NAEI website (see Pivot Table viewer) each year in the summer. Emissions maps and emission totals for each of the four administrations of the UK (England, Scotland, Wales, Northern Ireland) are published in the autumn.
2. Contact
Please email us with your feedback, or respond to this short survey to help us make the publication more valuable to you.
Enquiries to: Enviro.Statistics@defra.gov.uk or Tel: 03459 33 55 77
Lead statistician: Ellie Martell
Production team: Alex Mouatt, Neil Ward, Jen Cottingham, Anes Motam
You can also contact us via X (formerly Twitter): @DefraStats
3. Long-term trends in emissions of air pollutants
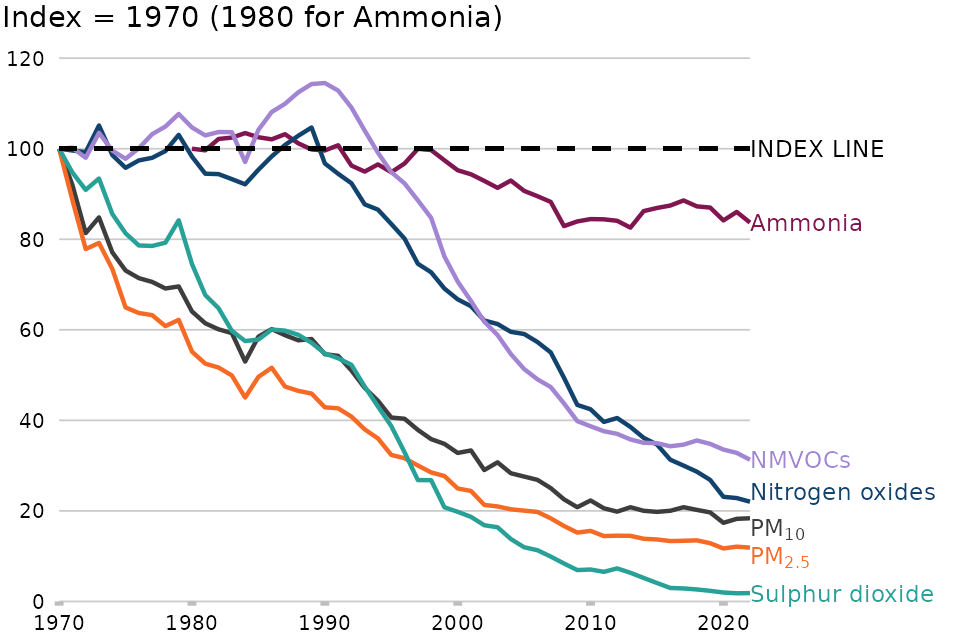
Figure 1: Trends in annual emissions of particulate matter (PM10 and PM2.5), nitrogen oxides, ammonia, non-methane volatile organic compounds, and sulphur dioxide, 1970-2022 (1980-2022 for ammonia)
Notes:
-
The index line shows the level of annual emissions if they had remained constant at 1970 levels (1980 for ammonia) .
-
The values of the y axis represent the percentage of 1970 levels (1980 for ammonia).
-
Data prior to 1990 is not routinely updated, for more information please see the Methods document.
Download the data for this chart in CSV format
There has been a long-term decrease in estimated emissions of all of the air pollutants covered by this statistical release (ammonia, nitrogen oxides, non-methane volatile organic compounds (NMVOCs), particulate matter (PM10, PM2.5) and sulphur dioxide). Estimated emissions of PM10 and sulphur dioxide increased from 2021 to 2022, while estimated emissions of ammonia, nitrogen oxides, NMVOCs and PM2.5 fell from 2021 to 2022.
Many factors are responsible for the long-term decrease in emissions of air pollutants:
-
The reduction in use of coal for domestic heating and power generation has been a major factor in reducing emissions of particulate matter.
-
The change from using coal to gas for power generation and fitting flue gas desulphurisation equipment to existing coal-fired power stations has been responsible for long-term decreases in emissions of sulphur dioxide and nitrogen oxides.
-
Stricter emissions regulation for road transport has led to emissions reductions for nitrogen oxides, NMVOCs and ammonia.
-
Stricter emissions limits placed on industry have reduced emissions from solvents, which particularly affects emissions of NMVOCs.
4. Emission Reduction Commitments
The UK has commitments to reduce annual emissions of air pollutants by a percentage of 2005 levels, set in the National Emission Ceilings Regulations (2018). These are known as emission reduction commitments (ERC), shown in the table below. The UK has met the current domestic and international emission reduction commitments for emissions of ammonia, NMVOCs, nitrogen oxides, PM2.5 and sulphur dioxide. The UK has met the emission reduction commitment for ammonia with the inclusion of an approved adjustment. The UK does not have emission reduction commitments for PM10. For more information on the ERCs please see the Background section of this publication.
Table 1: Compliance against Emission Reduction Commitments in 2022
| Pollutant | 2005 Emissions (thousand tonnes) | 2022 Emissions (thousand tonnes) | 2020-2029 ERC (%) | Percentage Reduction Achieved (%) | Compliance Status |
|---|---|---|---|---|---|
| Ammonia | 280 | 246 | 8 | 12 | Compliant |
| NMVOC | 1123 | 624 | 32 | 44 | Compliant |
| Nitrogen oxides (as NO2) | 1696 | 619 | 55 | 63 | Compliant |
| PM2.5 | 109 | 65 | 30 | 41 | Compliant |
| Sulphur dioxide | 782 | 120 | 59 | 85 | Compliant |
Notes: 2020-2029 ERC (%) refers to the percentage reduction from 2005 levels required between the years 2020 and 2029. There is a 2030 emission reduction too, please see here for more details.
5. Recent trends in emissions of air pollutants
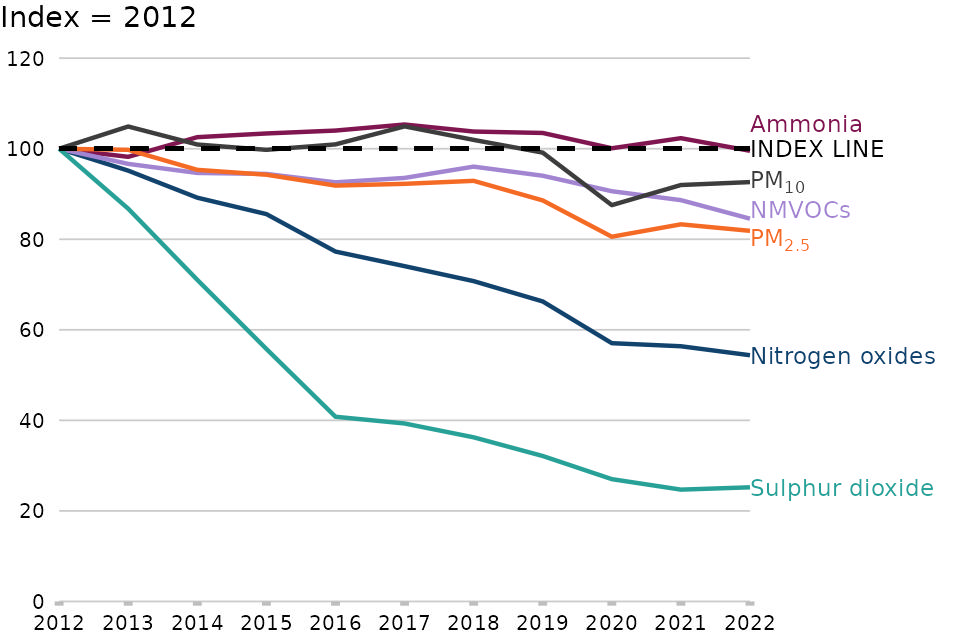
Figure 2: Trends in annual emissions of particulate matter (PM10 and PM2.5), nitrogen oxides, ammonia, non-methane volatile organic compounds (NMVOCs), and sulphur dioxide, 2012-2022
Notes:
- The index line shows the level of annual emissions if they had remained constant at 2012 levels.
- The values of the y axis represent the percentage of 2012 levels.
Download the data for this chart in CSV format
In the most recent ten-year period of emissions estimates, there has been mixed progress in reducing emissions of air pollutants:
-
Emissions of sulphur dioxide and nitrogen oxides have continued to fall in line with the long-term trend with much of the reduction as a result of the decreasing dependence on coal for power generation, although the rate of change has lessened in recent years. Emissions of sulphur dioxide and nitrogen oxides from energy industries have decreased by 90 per cent and 66 per cent per cent respectively between 2012 and 2022.
-
Emissions of nitrogen oxides and NMVOCs from road transport decreased by 49 per cent and 60 per cent respectively between 2012 and 2022. This is largely as a result of tighter emissions standards being introduced for petrol and diesel cars.
-
For particulate matter, decreases in emissions from many sources, particularly from road transport and energy industries, have contributed to a decrease in overall emissions between 2012 and 2022 (18 per cent reduction in PM2.5 emissions and a 7 per cent reduction in PM10 emissions). However, emissions from other sources have increased over this period. Emissions of both PM10 and PM2.5 from domestic combustion have increased by 19 per cent between 2012 and 2022, which reflects the greater popularity of domestic solid fuel appliances like wood-burning stoves. Other notable sources of emissions that have grown over this period include the industrial combustion of biomass based-fuels for PM2.5 and construction for PM10.
-
Total annual emissions of NMVOCs have decreased by 15 per cent between 2012 and 2022, however the sources of these emissions are changing. Emissions from food and beverages production have increased by 27 per cent, whereas fugitive emissions from fuels (for example pipeline leaks and gas flaring from oil production) have decreased by 45 per cent.
-
Annual emissions of ammonia have remained stable between 2012 and 2022. There has been a reduction in emissions from some activities such as road transport (decreased by 47 per cent) and inorganic fertilisers (decreased by 22 per cent). However there have been increased emissions from other sources such as non-manure digestate spreading (increased by 237 per cent), dairy cattle (increased by 15 per cent) and non-agricultural animals (increased by 23 per cent).
6. Notable sources of emissions of air pollutants in 2022
Emissions of particulate matter originate from a wide range of activity sources. Emissions from the domestic combustion of wood contributed 22 per cent of emissions of total PM2.5 and contributed 11 per cent of total PM10 emissions in 2022. Industrial combustion contributed 10 per cent of total PM2.5 emissions and contributed 5 per cent of total PM10 emissions in 2022. This refers to the combustion of fuels on manufacturing and construction sites to generate energy for industrial use, not to combustion in energy industries, which contributed 3 per cent of total PM2.5 emissions in 2022. Non-exhaust sources (that is road wear, brake wear and tyre wear) contribute the most particulate matter emissions from road transport and contributed 15 per cent of total PM2.5 emissions in 2022.
Transport is a major source of emissions of nitrogen oxides. Road transport contributed 30 per cent of emissions of nitrogen oxides in 2022 and other forms of transport (aviation, rail, and shipping) contributed 15 per cent.
Energy production and transformation were still major sources of emissions of sulphur dioxide (contributed 23 per cent) and nitrogen oxides (contributed 19 per cent) in 2022. However, annual emissions from this source have decreased rapidly in recent years as the UK has moved away from using coal for energy production.
Levels and trends in emissions of ammonia are largely driven by activity in the agricultural sector, primarily linked to herd sizes and the extent of fertiliser spreading. This sector contributed 87 per cent of emissions of ammonia in 2022. Other notable sources of ammonia emissions in 2022 are non-agricultural animals (e.g. domestic pets and horses) (contributed 6 per cent) and the waste sector (contributed 3 per cent).
There are many sources of emissions of NMVOCs. Domestic use of solvents (often found in household products such as cleaners, aerosols and cosmetics) contributed 22 per cent to total emissions of NMVOCs in 2022. Emissions from this source peaked in 2020, largely due to increased hand sanitiser use throughout the COVID-19 pandemic, but they have since fallen back to pre-pandemic levels. Emissions from the food and beverages industry have also increased recently and contributed 16 per cent of total emissions in 2022. Emissions from industrial solvent use and chemicals manufacture are still considerable sources of emissions but these have reduced substantially in the long-term.
Levels and trends in emissions from specific sources are available for the period 1990 to 2022 through the statistical tables that accompany this release.
7. Sections in this release
Emissions of particulate matter (PM10 and PM2.5)
Emissions of non-methane volatile organic compounds
Methods and quality processes for UK air pollutant emissions statistics (PDF)