The Children’s People and Nature Survey for England: Summer Holidays 2021 (Official Statistics)
Updated 24 February 2022
Applies to England

© Crown copyright 2022
This publication is licensed under the terms of the Open Government Licence v3.0 except where otherwise stated. To view this licence, visit nationalarchives.gov.uk/doc/open-government-licence/version/3 or write to the Information Policy Team, The National Archives, Kew, London TW9 4DU, or email: psi@nationalarchives.gov.uk.
Where we have identified any third party copyright information you will need to obtain permission from the copyright holders concerned.
This publication is available at https://www.gov.uk/government/statistics/the-childrens-people-and-nature-survey-for-england-summer-holidays-2021-official-statistics/the-childrens-people-and-nature-survey-for-england-summer-holidays-2021-official-statistics
1. Main Findings
Responses were collected from 2,048 children and young people aged 8-to-15 between the 10th and 31st August 2021 for the ‘Children’s People and Nature Survey’ (C-PANS). The survey provides information on how children and young people experience and think about the natural environment. Some of the main findings were:
Most (96%) of children and young people spent time outdoors (in places other than their garden) at least once in the past week and this did not vary based on gender, ethnicity, or income. 86% also said they had spent time noticing nature at least once in the past week.
Most (89%) of children had access to a private garden. However, this picture is mixed and access to a private garden was more likely for white children and those from households with an income >£50k.
More than eight in ten children and young people (85%) agreed that being in nature made them very happy. Those spending time outside at least once a week were more likely to report ‘very high’ levels of happiness, as were those who reported ‘high’ connection to nature.
Children and young people’s connection to nature was comparable to that of adults. Six out of ten children and young people (60%) agreed that they ‘felt part of nature’, compared to 58% of adults across the first year of the adult’s People and Nature Survey.
Concern for the environment was high across all demographic groups, with nearly eight in ten children and young people (78%) agreeing that looking after the environment was important to them. The number of children and young people saying they did not think adults were doing enough to protect the environment increased from 39% in 2020, to 46% in 2021, and 81% said that they wanted to do more to look after the environment.
Despite the on-going COVID-19 pandemic, just 14% of children and young people said that needing to stay away from others because of coronavirus, and 16% said worry around coronavirus stopped them from spending more time outside.
Although overall children and young people show high levels of engagement with nature, this was not always equal between group.
Age: Those aged 8-to-11 were more likely to say they spent time outdoors and noticing nature ‘every day’ or ‘most days’, were more likely to agree that looking after the environment was important to them, and reported a stronger sense of connection to nature (compared to those aged 12-to-15). For those aged 12-to-15, lack of interest was more often given as a reason for not spending more time outdoors (e.g. ‘I just didn’t want to go’, ‘I prefer to spend free time indoors’), and those aged 8-to-11 instead were more likely to say that ability to access nature was a barrier (e.g. ‘I was not allowed to go out on my own and no-one could go with me’).
Income: Children and young people from lower income households were less likely to agree that looking after the environment was important to them, less likely to agree that they ‘feel part of nature’ and more likely to say they did not spend more time outside due to other people making them feel uncomfortable there.
Disability: Disabled children and young people were more likely than the non-disabled to choose several of the reasons for not spending more time outside, including ‘other people there make me feel uncomfortable’, ‘I am worried about coronavirus’, ‘I just didn’t want to go’, and ‘I was ill’. Despite this, disabled children and young people were more likely to say they spent time outdoors and noticing nature ‘every day’ or ‘most days’ (than non-disabled children and young people).
Ethnicity: There were some significant differences when comparing responses between Asian/Asian British, Black/Black British, mixed/multiple ethnic groups and White children and young people. This includes Asian/Asian British children and young people reporting a stronger sense of connection to nature than White children and young people. Black/Black British children and young people were less likely than White children to agree that being in nature made them very happy. Asian/Asian British and Black/Black British children and young people were more likely to cite ‘I was not allowed to go out on my own and no-one could go with me’, being too busy doing homework, and worry about coronavirus as reasons for not spending time outdoors, than White children and young people.
2. Other pages in this release
The People and Nature Survey for England (PANS), led by Natural England, is one of the main sources of data and statistics on how people experience and think about the environment. It began collecting data via an online panel (adults aged 16 years and older) in April 2020, and runs continuously, in line with Government Statistical Service guidance on data collection during the COVID-19 pandemic.
PANS includes questions about children in the household, asking adults about their time in and experiences of nature. To build on this and ensure the views of children and young people (CYP) themselves are represented, the ‘Children’s People and Nature Survey’ (C-PANS) was first completed as a pilot between 6th-18th August 2020. This first pilot offered valuable insights which contributed to our understanding of experiences of nature during the COVID-19 pandemic.
Following this successful pilot, the survey has been adapted for use on an on-going basis both in school holidays and term-time to allow for longitudinal comparison of children’s responses. The first wave of holiday-time data shown in this release was collected between 10th – 31st August 2021 (inclusive). The full survey can be found here.
Alongside this publication, a spreadsheet containing relevant data tables for Wave 1 of the holiday-time survey has been published and raw data is available for use. Data tables have been generated using the specific C-PANS weight (see Methodological note).
This release contains some comparisons between the Wave 1 (August 2021) children’s survey and the pilot survey completed in August 2020. This comparison allows us to look at whether CYP’s attitudes and experiences have changed over the course of a year but should be interpreted in light of the differences in COVID-19 pandemic restrictions at these two time-points.
3. Official Statistics
Initial releases from PANS and C-PANS (such as the interim monthly indicators and indicators and the pilot of C-PANS) were released as Experimental Statistics. This status highlighted to users at the time that these Official Statistics are in the National Statistics testing phase and that Natural England is still working on further developing the methodologies used in their production whilst ensuring adherence to the Code of Practice for Statistics (the Code).
Releases from PANS and C-PANS that use the specific weighting method (as opposed to the interim weighting method) are designated as Official Statistics. For justifications behind this designation, please see our brief statement and technical report . Natural England have developed the methodologies used in the production of these statistics whilst ensuring adherence to the Code of Practice for Statistics.
4. The survey in context
Research establishing the links between engagement with nature and human health and well-being, and also pro-environmental behaviours has grown in recent years. This supports growing recognition of the interconnection between our own and our planet’s health.
In 2018, Defra released their 25 year environment plan and set out goals for improving the environment within a generation. The plan set out aims to promote the closeness of children and young people (CYP) to nature for their health and well-being, and to increase CYP’s engagement in social action for the environment. There was a particular focus on increasing engagement among CYP from a wider range of backgrounds, such as those from lower income households and ethnic minorities.
The 2019 Year of Green Action aimed to better engage a broader range of children in social action for the environment, and the 2019 Landscapes Review proposed ‘a night under the starts for every child’. Recent initiatives to connect children with nature at schools includes community forest and outreach projects and nature friendly schools. More broadly, there has been a growth in initiatives such as forest schools and green social prescribing (including care farms and green gyms).
Nationally representative surveys that aim to understand and monitor people’s engagement with and care for the environment include: 1) the Monitor of Engagement with the Natural Environment survey (MENE) led by Natural England in partnership with Defra, for people aged 16+ between 2009 and 2019; 2) Natural England’s People and Nature Survey (PANS) for people aged 16+, from 2020 (ongoing); and 3) Defra’s Survey on Attitudes to the Environment for adults aged 18+, from 2019 (ongoing). MENE and PANS have asked about the experiences of CYP indirectly through adults, but representative surveys of CYP under the age of 16 have not previously asked CYP themselves about their attitudes and behaviours in relation to the natural environment.
The ‘Children’s People and Nature Survey’ (C-PANS) for England was established to provide a representative sample of CYP aged 8-to-15 years old, to find out how they interact with, think and feel about the natural environment. This provides insights from a much younger age group than has previously responded to these kinds of questions.
Following a 2020 pilot of this survey, the current report summarises the 2021 (Wave 1) data for the C-PANS survey, completed during CYP’s school holidays. Due to this, CYP were only asked about the time they had spent outdoors and noticing nature outside of the school setting. We will also be conducting a 2021 term-time survey with additional questions about engagement with nature in the school context. Both surveys have the potential to be repeated on a yearly basis to look at changes over time and differences between CYP’s experiences during term-time and school holidays.
It is clear from the MENE survey and adult PANS that there are differences in the way some groups engage with nature. This may indicate some level of social injustice, but this will be part of a more complex picture of cultural differences, and differences in access to the ‘tools’ needed to participate (e.g. finance, location, personal characteristics, motivations and health etc.). Throughout this report, responses are therefore compared between groups to examine any potential differences in attitudes and experiences based on age, gender, ethnicity, level of disability, region, and income. All differences are shown in the data tables and the methods for these group-based comparisons explained in the methodological note . Key patterns observed between groups are drawn out within this report.
5. Environmental concern and action
In a survey of 16-75 year olds across the G20 countries during April and May 2021, 74% agreed that the ‘government should communicate directly with people about restoring nature in a way similar to how they have communicated about the COVID-19 crisis’. A smaller 26% agreed that now was not the time to be talking about restoring nature due to the worries people still had about the pandemic. This shows both the opportunities and potential challenges to engaging people at this time in issues around environmental protection and restoration.
Delivery of policy and practice aiming to protect and restore natural environments—such as those set out in the 2020 Environment Bill to improve air quality, waste management, and restore nature—rely on understanding and shaping people’s interactions with the natural environment. As the future custodians of the natural environment, better understanding young people’s attitudes and behaviours in relation to the natural environment, as well as understanding how they engage with environmental issues, is important.
5.1 Concern for the environment
Nearly eight in ten CYP (78%) in this survey agreed that looking after the environment was important to them and 81% said they wanted to do more to look after the environment. CYP’s views on the importance on protecting or looking after the environment had not changed from our pilot survey delivered in August 2020 (78%).[footnote 1]
5.2 Actions for the environment
Almost half of CYP (46%) disagreed that adults are doing enough to protect the environment. This is more than in August 2020 when 39% of CYP disagreed with the statement.
Most children and young people (76%) said that they knew what they could do to look after the environment and they most often said that they undertook actions such as recycling (73%), turning off taps (63%) and lights (58%), picking up litter (53%), walking, cycling, or taking public transport as much as they can (44%), and doing things in the garden to help wildlife (41%).
Social actions to look after the environment that involve others were less common (Figure 1), such as talking to friends and family about looking after the environment (26%), volunteering time (8%), raising awareness by posting online (8%), and trying to change what our leaders are doing (e.g. signing petitions, demonstrating, or writing to them; 7%).
5.3 Group differences
Although a high proportion of children and young people said that looking after the environment was important to them, those aged 8-to-11 year olds were more likely to agree with this (81%) compared to those aged 12-to-15 (76%). This was also the case when asked about whether they wanted to do more to look after the environment, with 84% of those aged 8-to-11 agreeing and 78% of those aged 12-to-15.
There were differences in children’s behaviours and social actions for the environment based on age, largely showing those aged 12-to-15 were more likely to take actions that are reliant on greater independence and control (Figure 1). For example, those aged 12-to-15 were more likely to report eating less meat (older 22%, younger 17%), thinking about the environment when buying things (older 20%, younger 13%), raising awareness by posting online (older 10%, younger 6%) and trying to change what leaders are doing (e.g. signing petitions, demonstrating, or writing to them) (older 9%, younger 5%). Those aged 8-to-11 were instead more likely to pick up litter (older 49%, younger 57%) and do things in the garden to help wildlife (older 37%, younger 46%).
Children in higher income households (82% with household income >£50k) were more likely to agree that looking after the environment was important to them compared to lower income households (68% of those with household income <£15k) Due to the limited independence and control of CYP over household emissions, these environmental attitudes may not be equivalent to their environmental impact. In fact, a 2013 Joseph Rowntree Foundation report showed that the top 10% of households for disposable income in the UK emit three times more carbon (twice as much when excluding transport emissions) than the bottom 10%.
Figure 1: Proportion of children and young people reporting different behaviours and social actions to look after the environment, split by age group
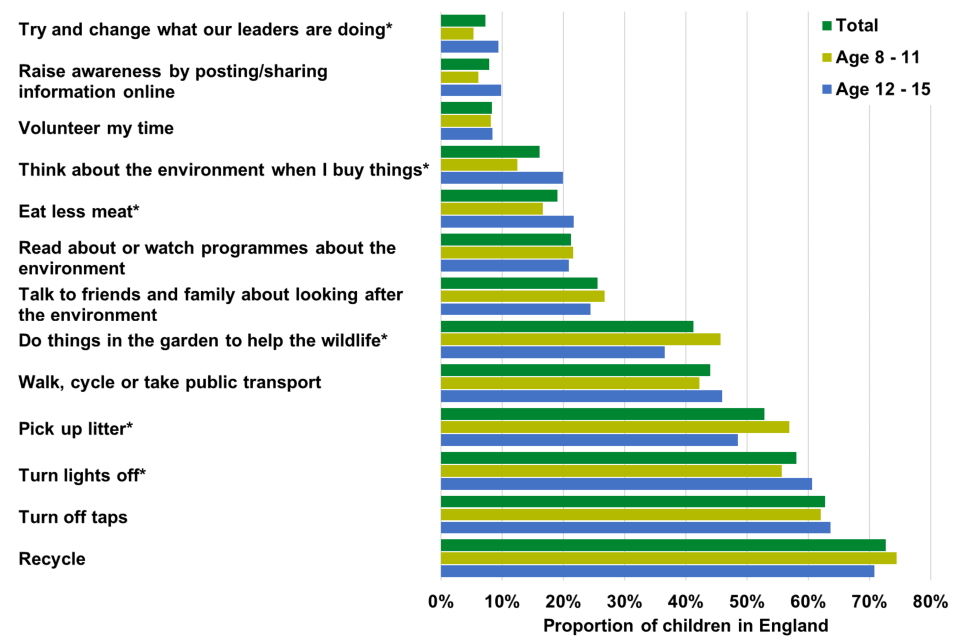
Figure notes:
(1) *Indicates a significant difference between age groups.
(2) Base: All respondents (2048)
Source:
CS_Q10 Which of the following things do you do to look after the environment? There are lots of options but they may not all apply to you or all make sense. Only pick the ones you understand and do yourself to look after the environment. Please choose one or more options
Response option wording: Recycle my waste; Turn the tap off while I brush my teeth; Turn lights off; Pick up litter; Walk, cycle or take public transport as much as I can; Do things in the garden to help the wildlife (e.g. feed birds, grow plants that insects like, make homes for wildlife); Talk to friends and family about looking after the environment; Read about (online or in books) or watch programmes about the environment; Eat less meat (including vegetarian or vegan); Think about the environment when I buy things; Volunteer my time (e.g. litter pick, planting, raising awareness); Raise awareness by posting/sharing information online; Try and change what our leaders are doing (e.g. sign petitions, demonstrate, or write to them).
6. Nature and well-being
Our health and well-being is closely connected to the natural environment around us. For CYP, there is an association between access to and proximity of green and natural spaces, nature-based activities, outdoor education, nature play, and connection to nature, and beneficial outcomes such as physical health, psychological well-being, cognitive development, and social and learning outcomes.
6.1 Perceived benefits
In line with earlier PANS research, 85% of CYP agreed that being in nature made them very happy (2% disagreed and 13% neither agreed nor disagreed). This was consistent with findings from our pilot survey in August 2020 (83%) and also with reports from adults across the first year of the adult’s PANS (where 82% adults agreed, 5% disagreed, and 12% neither agreed nor disagreed). This shows a strong affiliation with nature among CYP but also an acknowledgement of its benefits for mental well-being.
Overall being in nature made the vast majority of CYP happy, but differences were found between groups. Children aged 8-to-11 were more likely to agree that being in nature makes them very happy (89%) than children aged 12-to-15 (80%). White children were also more likely to agree that being in nature made them very happy (86%) than Black children (75%), but no other statistically significant differences between ethnic groupings were found.
6.2 Happiness, anxiety, and loneliness
In this survey, CYP were asked about their happiness, anxiety and loneliness as indicators of well-being. Differences in these well-being outcomes were then looked at between groups of CYP with different levels of access to green and natural spaces, time spent outside and connection to nature (Table 1).
CYP were asked which green and natural spaces they could walk to easily from their home (either by themselves of with someone else) to determine levels of access to green and natural spaces. Well-being was then compared between those with one or no green/natural space nearby and those with two or more green/natural spaces nearby. Similarly, CYP were asked how frequently they had spent time outside in places other than their garden in the past week. Well-being was compared between those spending time outside at least once a week and those who had not spent time outside at all. Finally, CYP’s connection to nature (defined in section 8. Connection to nature ) was either categorised as ‘high’, ‘moderate’ and ‘low’ to allow for comparisons in well-being based on nature connection among CYP.
Levels of happiness were split into ‘very high’ (40% of all CYP), ‘high’ (45%), ‘medium’ (14%), and ‘low’ (2%) in accordance with ONS guidance. CYP reporting two or more green/natural spaces nearby were less likely to rate their happiness at the lowest level than those with one or no green/natural space nearby (‘medium’ was the lowest level looked at due to too few people reporting ‘low’ happiness). CYP spending time outside at least once a week were more likely to report ‘very high’ levels of happiness, as were those who had ‘high’ connection to nature.
Levels of anxiety were split into ‘high’ (19% of all CYP), ‘medium’ (13%), ‘low’ (24%), and ‘very low’ (44%) in accordance with ONS guidance, and similarly showed differences based on access and engagement with nature. CYP with two or more green/natural spaces nearby were more likely to rate their level of anxiety as ‘low’ or ‘very low’, than those with one or no green/natural space nearby. Additionally, CYP spending time outside at least once a week were more likely to rate their anxiety as ‘low’.
CYP either said they were lonely ‘often/always’ (5% of all CYP), ‘some of the time’ (20%), ‘occasionally’ (26%), ‘hardly ever’ (37%) or ‘never’ (12%). Very few CYP said they were ‘often/always’ lonely (5%), but of those that said they were lonely ‘some of the time’, they were more likely to say they had ‘low’ nature connection and access to one or no green/natural space nearby. Reports of loneliness among CYP did not differ between those spending more or less time outdoors.
Table 1: Statistically significant differences found in happiness, anxiety, and loneliness dependent on: 1) green and natural spaces nearby, 2) time spent outside (excluding garden) in the past week, and 3) nature connection (marked with ‘X’ if significant differences between groups).
Happiness (very high, high, medium, or low)
| Variable | Sig. | Finding |
|---|---|---|
| Green and natural spaces nearby | X | CYP reporting one or no green/natural space nearby were more likely to report ‘medium’ levels of happiness (22%) than those with two or more green/natural spaces nearby (12%) |
| Frequency of time outside | X | CYP who spent time outside at least weekly were more likely to rate their happiness as ‘very high’ (40%) and less likely to rate it as ‘medium’ (13%), compared to those who never spent time outside (‘very high’- 23%, ‘medium’- 30%). |
| Nature connection | X | CYP with ‘high’ nature connection were more likely to report ‘very high’ levels of happiness (51%) and less likely to rate it as ‘medium’ (9%), than those with ‘low’ nature connection (‘very high’- 32%, ‘medium’- 20%). |
Anxiety (high, medium, low, or very low)
| Variable | Sig. | Finding |
|---|---|---|
| Green and natural spaces nearby | X | CYP’s anxiety increased as access to green/natural space decreased. For example, CYP who reported access to two or more green/natural spaces nearby were more likely to rate their level of anxiety as ‘low’ (25%) or ‘very low’ (45%), than those with one or no green/natural space nearby (18% and 36% respectively). |
| Frequency of time outside | X | CYP who spent time outside at least weekly were more likely to rate their anxiety as ‘low’ (25%), compared to those who never spent time outside (14%). |
| Nature connection | No significant differences found |
Loneliness (often/always, some of the time, occasionally, hardy ever or never)
| Variable | Sig. | Finding |
|---|---|---|
| Green and natural spaces nearby | X | CYP reporting one or less green/natural spaces nearby were more likely to feel lonely ‘some of the time’ (27%) than those with two or more green/natural spaces nearby (19%). |
| Frequency of time outside | No significant differences found | |
| Nature connection | X | CYP with ‘low’ nature connection were more likely to say they felt lonely ‘some of the time’ (25%) compared to those with ‘high’ nature connection (17%). |
Table notes:
(1) There were no significant differences in wellbeing when considering garden access in this survey and so this has not been included within the table.
(2) All statistically significant differences between groups can be found in the data tables. Some of these statistically significant differences are not reported in this table where reporting would only confirm trends already noted.
Source:
CS_Q4 Which of these places can you walk to easily from your home (either by yourself or with someone else)? Please choose one or more options Average (mean) number of green/blue spaces calculated and split into ‘low’ (0-1 options chosen) and ‘high’ (2+ options chosen).
CS_Q6B Now thinking about when you were not at school in the last week, how often have you spent time outside in places that are not your garden? [split into ‘low’ (never) and ‘high’ (once a week or more).
CS_Q11 How connected do you feel to nature? Please choose the picture that best describes your relationship to nature [split into ‘low’ (chose diagrams A, B or C), ‘moderate’ (chose diagram D) and ‘high’ (chose diagrams E, F, or G).
Happiness, anxiety and loneliness were measured using ONS recommended measures.
CS_Wellbeing_happy How happy were you feeling yesterday? Please answer on a scale where 0 is not at all happy and 10 is completely happy Very high (9-10), High (7-8), Medium (5-6) and Low (0-4).
CS_Wellbeing_anxious How anxious were you feeling yesterday? Please answer on a scale where 0 is not at all anxious and 10 is completely anxious High (6-10), Medium (4-5), Low (2-3), Very low (0-1).
CS_Wellbeing_lonely How often do you feel lonely? Please select one answer only.
7. Access and time spent outdoors
The number of people residing in urban areas is increasing, and with competing demands for land use, this may threaten equitable access to green space. A recent report recommends that local government “Consider local green (and blue) space to be critical assets for maintaining and supporting health and wellbeing in local communities”.
Access to local green and natural spaces however does not always equate to time spent outdoors. This is apparent in the changes seen in CYP’s time spent outdoors seen in recent years. The MENE survey asked adults in England about the time that children in their household were spending outside. This reduced from 81% in 2013/14 to 74% in 2018/19. This decline was particularly marked when looking at time spent outside without adults.
7.1 Access
Only 2% of children and young people in the current survey did not have access to an outdoor space, such as a private or shared garden or other outdoor space (e.g. allotment or balcony). Choosing one or more of the options, 89% of CYP said they had access to a private garden, 7% had access to a private outdoor space that was not a garden (for example, a balcony, yard, or patio area), and 5% had access to a shared garden.
When asked which green and natural spaces they could easily walk to from their home either by themselves or with someone else (described as ‘access to green/natural spaces nearby’), most said they could walk to a park (79%) or a garden (theirs or someone else’s; 79%) and around 6 in 10 (59%) could get to grassy areas in the streets near them, 3 in 10 (31%) woods and forests, and less than a quarter could get to rivers, lakes or canals (23%), fields, farmland or countryside (20%), grassy areas you pay to go to (16%), beaches or seaside (10%), and hills, mountains or moorland (10%).
7.2 Time spent outdoors and noticing nature
Of those who had a garden, more than two in 10 (22%) reported spending time in it every day in the last week and a further seven in 10 (69%) did this at least once a week but not every day (5% had spent no time in their garden in the past week; Figure 2).
More than one in 10 (14%) of CYP reported spending time outside in places other than their own garden every day in the last week and a further eight in 10 (83%) did this at least once a week but not every day, and 4% had spent no time outside (beyond their own garden) in the past week (Figure 2).
Just over one in 10 (11%) of CYP said they had spent time noticing nature every day in the past week and just under eight in 10 (76%) had done this at least once a week but not every day (14% had spent no time at all noticing nature in the past week; Figure 2).
Figure 2: Time spent in gardens, other places outside and noticing nature in the past week
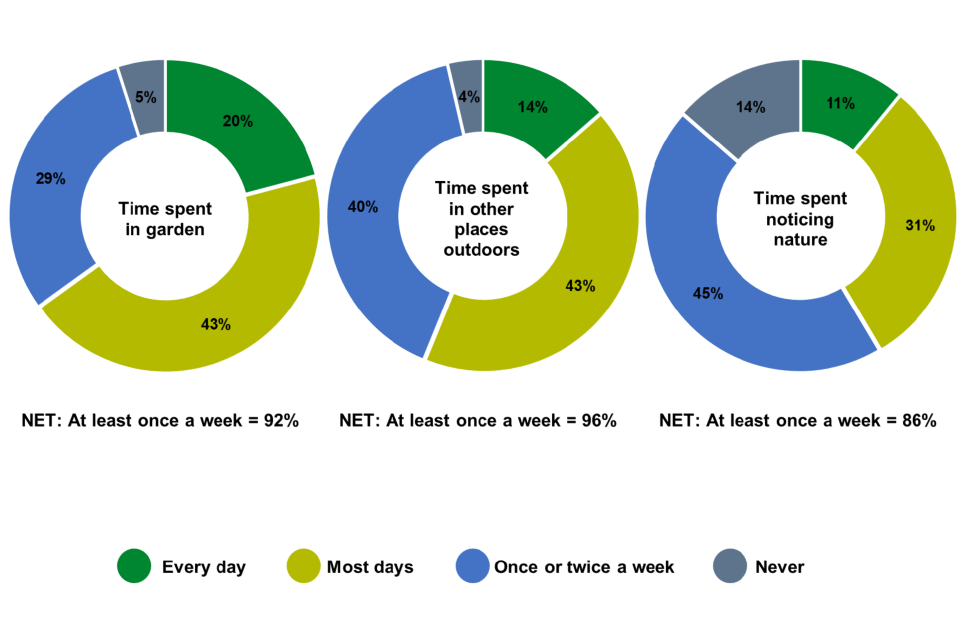
Figure notes:
(1) Base: All respondents (2048)
Source:
CS_Q6A Now thinking about when you were not at school in the last week, how often have you spent any time in your own garden if you have one)? This includes any garden that you share with your neighbours.
CS_Q6B Now thinking about when you were not at school in the last week, how often have you spent time outside in places that are not your garden?
CS_Q6C Now thinking about when you were not at school in the last week, how often have you spent time noticing nature? (e.g. looking, listening, experiencing it).
CYP were most likely to report visits in the past week to places typically found within built-up areas. This included gardens (theirs or other peoples; 62%), parks, playing fields or playgrounds (57%), and grassy areas in the streets nearby (25%). However, 28% of CYP also stated they had visited a beach or the seaside in the last week (Table 2).
The health and well-being benefits of visiting open green and natural spaces, such as National Parks and Areas of Outstanding Natural Beauty are often recognised, but the C-PANS findings show that CYP more often find themselves in green and natural spaces in more built-up areas. Young people have expressed in previous research how nature in urban settings can provide feelings of escape, connection, and care. This highlights the need to better understand how green and natural environments in more built-up areas can be beneficial to CYP and what they value and benefit from in these different settings.
Table 2: Green and natural places visited in the last week.
| Place | Percent |
|---|---|
| Garden (mine or someone else’s) | 62% |
| Park / playing field / playground | 57% |
| Beach or seaside | 28% |
| Grassy areas in the streets near me (e.g. by the roadside, a green or pathway) | 25% |
| Woods / forest | 21% |
| Grassy areas you pay to go to (e.g. gardens of a big house, the zoo, or city farm) | 15% |
| Rivers / lakes / canals | 12% |
| Fields / farmland / countryside | 10% |
| Hills/ mountains/ moorland | 10% |
Table notes:
(1) Base: All respondents (2048)
Source:
CS_Q3 Have you spent time in any of these places in the last week? You can include visits of any length of time (including short trips to the park, dog walking etc.). Please do not include any trips made abroad. Please choose one or more options.
7.3 Group differences
Children aged 12-to-15 were more likely to report access to a private garden (91%) than children aged 8-to-11 (87%) but were also more likely to report that they could easily walk to several other green and natural spaces beyond the garden, easily from their home. This included grassy areas in streets near them (older 65%, younger 53%), grassy areas you pay to go to (older 18%, younger 13%), the beach or seaside (older 12%, younger 8%), and hills/mountains/moorland (older 11%, younger 8%).
Despite reporting more access to green and natural spaces among the older age group, those aged 8-to-11 were more likely to spend time in their own garden every day (24%) and other places outdoors (16%) as well as noticing nature most days (34%), compared to those aged 12-to-15 (16%, 11% and 27% respectively). This dip in time spent outdoors in teenage years is consistent with findings from parent and guardian reporting in the MENE survey.
Although differences in access were not found based on gender, boys were more likely to spend time in their garden everyday (22%) than girls (18%), and girls were more likely to spend time noticing nature on most days (33%) than boys (28%).
Non-disabled CYP were more likely to say they could easily access parks, playing fields and playgrounds (81%) than disabled CYP (69%). Despite this, disabled CYP were more likely to spend time outside in places other than their own garden every day (22%) and noticing nature every day (21%), than non-disabled CYP (12% and 10% respectively).
CYP from households with an income >£50k were more likely to have access to a private garden (95%) than those in households with an income between £15k and £50k (88%), and those in households <£15k (73%). In line with this, CYP from higher income households were also more likely to more frequently spend time in gardens. No differences in how easily they could walk to green and natural spaces from their home were found based on income.
There were also some income-based differences in the time CYP spent outside and engaging with nature. CYP from households with an income >£50k were more likely to spend time in their garden every day (26%) and noticing nature every day (15%), than those in households with incomes of £15k to £50k (18% and 9% respectively), and those in households with incomes <£15k (17% and 7% respectively).
White CYP were more likely to have access to a private garden (91%) than mixed or multiple ethnicity CYP (85%), Asian or Asian British CYP (85%), and Black or Black British CYP (77%). White CYP were also more likely to say they were able to easily walk to woods or forests (33%), fields, farmland, or countryside (23%), and rivers, lakes, or canals (25%) from their home compared to Asian or Asian British CYP (22%, 8%, 12% respectively) and Black or Black British CYP (18%, 8%, 13% respectively). Despite this, differences were not found in CYP’s time spent in gardens or other places outdoors, or time spent noticing nature based on ethnicity.
8. Connection to nature
Connection to nature is more than just the time CYP spend in nature. It has been described as an individual’s subjective sense of their relationship with the natural world, and among CYP this may be reflected in how they think and feel about nature (e.g. whether they see nature and humanity as one), and how they experience it (e.g. to what extent they enjoy spending time in nature and benefit from it).
Children’s connection to nature is relevant due to its association with a range of positive outcomes. A meta-analytic review of 20 studies (only one including children) in this area concluded that people who are more connected to nature are also more likely to show higher eudaimonic well-being (feeling life is worthwhile). Research has begun to look at the role of nature connection in children’s health and well-being, showing some positive associations with health and life satisfaction. Additionally, a stronger sense of connection to nature in some studies has been associated with greater incidence of pro-environmental behaviours among adults and CYP.
8.1 Nature Connection
Using questions from the Nature Connection Index, 6 in 10 (60%) CYP agreed that ‘I feel part of nature’ (11% disagreed and 29% neither agreed nor disagreed). By comparison, 58% of adults said they agreed with this statement (14% disagreed and 26% neither agreed nor disagreed) across the first year of the adult’s PANS, showing similarity with CYP. Reported earlier, 85% of CYP also agreed that being in nature made them very happy.
CYP were also shown a range of images taken from the illustrated Inclusion of Nature in Self Scale. Seven diagrams were shown to CYP (Figure 3), each containing two circles, one with the outline of a person and saying ‘me’ and the other with a nature-filled scene. In each diagram, the closeness of the two circles got progressively more until they fully overlapped. CYP were asked to choose the diagram which best showed how connected they felt to nature.
Using the Inclusion of Nature in Self Scale most CYP felt highly connected (44%, diagrams E to G), and less felt moderately connected (27%, diagram D), or low levels of connection to nature (29%, diagrams A to C) (Figure 3).
Figure 3: Percentage of CYP choosing images from the ‘Inclusion of Nature in Self’ scale indicating how connected they feel to nature, split as low, medium, and high.
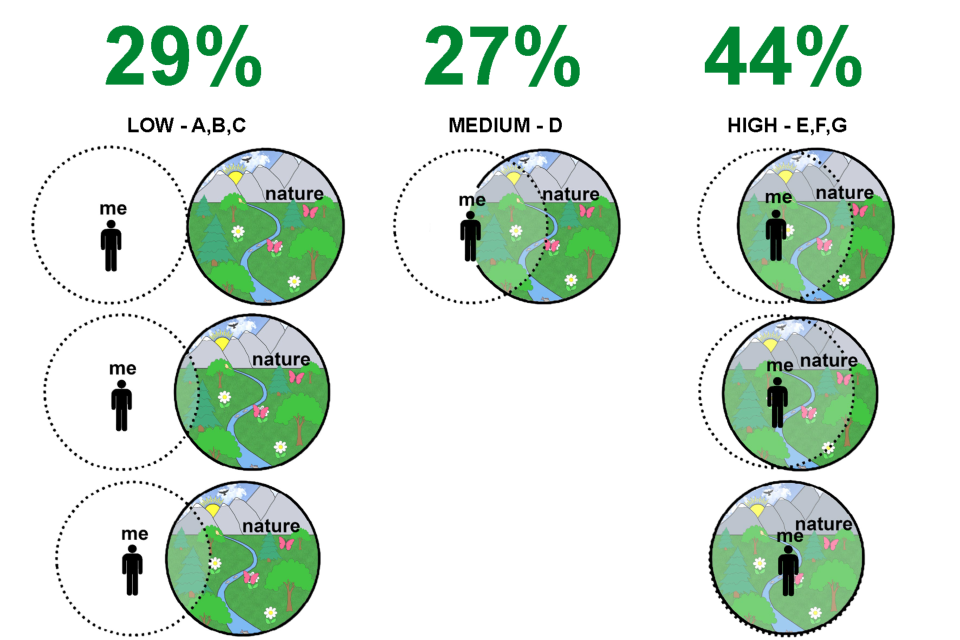
Figure notes:
(1) Base: All respondents (2048)
Source:
CS_Q11 How connected do you feel to nature? Please choose the picture that best describes your relationship to nature. (Response options: image A, B, C, D, E, F, or G).
8.2 Group differences
CYP aged 8-to-11were more likely to agree that they felt part of nature (64%), and more likely to choose nature connection images that indicated high connection to nature (51%) than those aged 12-to-15 (57%, 36%).
CYP in households with income >£15k were more likely to agree they feel part of nature (66% of those with a household income >£50k, and 60% with a household income between £15k and £50k) than those with a household income <£15k (49%). In line with this, CYP in households with an income >£50k were more likely to choose nature connection images that indicated high connection to nature (48%) than those in households with an income between £15k and £50k (42%) and <£15k (43%).
Asian or Asian British CYP were also more likely to agree that they felt part of nature (72%) than White CYP (59%). No other significant differences in nature connection were found between ethnic groups.
9. Motivations and barriers to spending time outdoors
A recent overview of equity in access to urban nature highlighted that barriers are not just about differences in access to nature. Childhood experiences are discussed as determining people’s familiarity and likelihood of engaging with nature, as are the differences that some groups including girls and ethnic minorities might feel in terms of safety in these spaces, and the accessibility of nature for groups such as disabled CYP. Understanding childrens’ motivations and barriers to getting outdoors, as well as how this differs between groups is important to promote equity in access.
When asked about what they most enjoyed about spending time outside, CYP most commonly chose the options ‘spending time with friends’ (56%) and ‘spending time with family or the people I live with’ (55%), along with ‘being out in the fresh air’ (53%; Figure 4).
In the earlier C-PANS pilot in August 2020 ‘having quiet time/relaxing/time away from schoolwork’, ‘being able to do exercise’, and ‘having fun or playing’ were instead the three most chosen options [footnote 2]. Although ‘being able to do exercise’ and ‘having fun or playing’ were also commonly listed by CYP in 2021, they did not rank as highly one year later when compared to spending time with friends and family.
Figure 4: What CYP most like about spending time outside
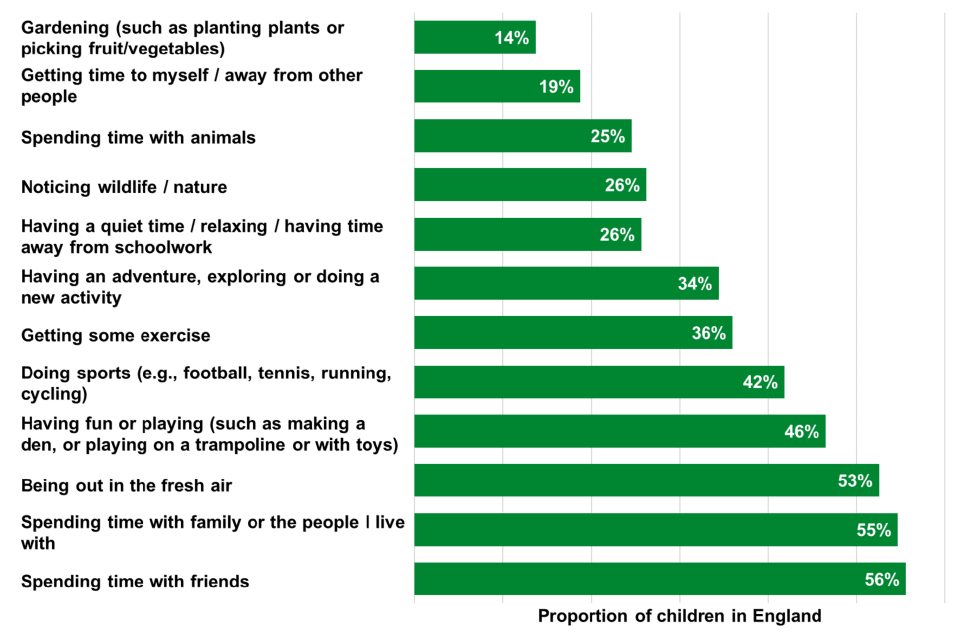
Figure notes:
(1) Base: All respondents (2048)
Source:
CS_Q7 What do you most like about spending time outside? Please choose one or more options.
CYP were asked to choose their favourite places to spend time. Almost two-thirds (65%) of CYP chose ‘indoors’. However, a similar proportion reported parks, playing fields and playgrounds (63%), and the beach or seaside as their favourite place to spend time (63%). In contrast, in August 2020, the three most chosen places were the beach or seaside; parks, playing fields and playgrounds; and gardens and indoors ranked as fourth most chosen place.[footnote 2]
Overall, CYP most often said bad weather was their reason for not spending more time outside (63%), followed by several barriers that demonstrate lack of interest, including ‘I prefer to spend free time indoors’ (31%), ‘I just didn’t want to’ (31%) and saying there is ‘nothing fun to do in the places nearby’ (28%; Figure 5).
Despite the on-going COVID-19 pandemic, just 14% of CYP said that needing to stay away from others because of coronavirus, and 16% said worry around coronavirus stopped them from spending more time outside. Although not directly comparable due to changes in response options [footnote 2], this is a contrasting picture to the last C-PANS survey in August 2020 when ‘I was worried about catching/spreading coronavirus’ was the most common reason given by 48% CYP for not spending more time outside.
Figure 5: Things that have stopped CYP from spending more time outside in the last week
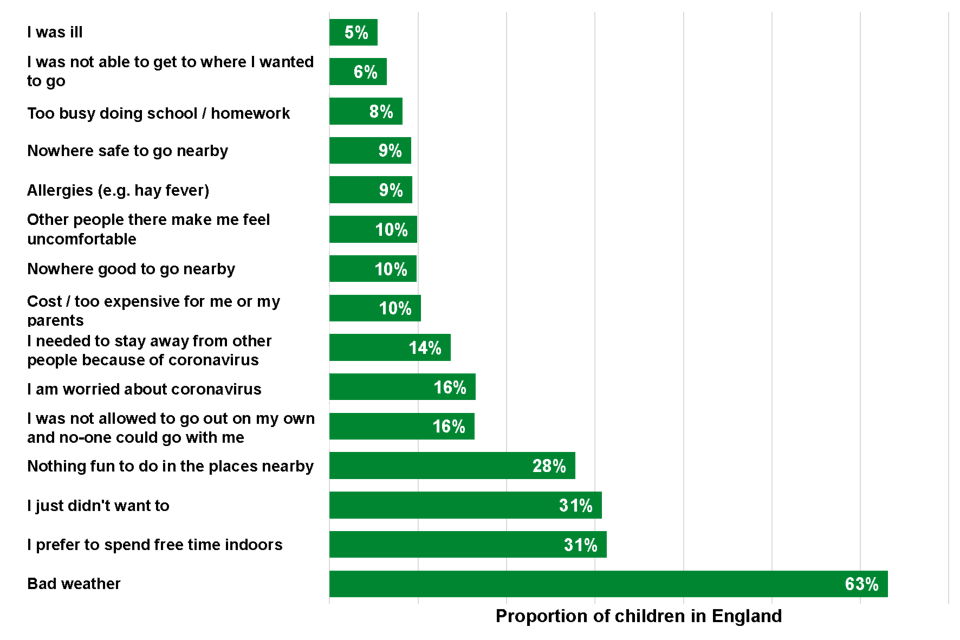
Figure notes:
(1) Base: All respondents (2048)
Source:
CS_Q8 What things have stopped you from spending more time outside in the last week?
Please choose one or more options.
9.1 Group differences
Those aged 12-to-15 were more likely to list indoors as one of their favourite places to spend time (69%) compared to those aged 8-to-11 (60%). The reasons CYP provided for not spending more time outdoors again provides evidence of less engagement with nature among those aged 12-to-15, but less ability to access nature for those aged 8-to-11. CYP aged 12-to-15 were more likely to cite not wanting to go outside (38%) and a preference for spending time indoors (35%) as reasons for not spending more time outdoors (compared to those aged 8-to-11, 24% and 28% respectively). Those aged 8-to-11 were instead more likely to cite that they were not allowed to go out alone, that there was no one to go with them (21%), or bad weather (68%) than those aged 12-to-15 (11% and 58% respectively).
CYP from households with an income >£50k were more likely to cite being too busy doing homework as a barrier to spending more time outside (13%) and less likely to say it was too expensive (7%), compared to those in households with an income between £15k and £50k (6% and 11% respectively) and <£15k (4% and 17% respectively). CYP in households with an income <£15k were instead more likely to say they did not spend more time outside due to other people there making them feel uncomfortable (19%) compared to children in households with incomes between £15k and £50k (9%) and >£50k (10%).
Some ethnicity-based differences were also found. CYP from mixed or multiple ethnic groups were more likely to report indoors as one of their favourite places to spend time (73%) than CYP from Asian or Asian British backgrounds (56%). Asian or Asian British CYP and Black or Black British CYP were more likely to cite not being allowed to go out on their own or not having someone to go with (23% and 24%) compared to white CYP (14%). Asian or Asian British CYP and Black or Black British CYP were also more likely to be too busy doing homework (18% and 16%) compared to white CYP (6%) and were more worried about coronavirus (32% and 29%) compared to white CYP (13%).
Disabled CYP were more likely to report that several barriers stopped them from spending more time outside, including: other people making them feel uncomfortable (29%), that they were worried about coronavirus (24%), there was nowhere good to go nearby (18%), they couldn’t get where they wanted to go (17%), that there was nowhere safe to go nearby (16%) or that they were ill (15%), than CYP without disabilities.
Girls were more likely to say that they did not spend more time outside due to others making them feel uncomfortable (12%) and bad weather (67%) than were boys (8% and 60% respectively).
10. Other results
This report summarises just some of the findings from this survey. For more detail on the full range of questions, see the questionnaire and spreadsheets accompanying this report.
11. Methodological note
This survey was conducted using an online panel. Consent for participation was obtained from both parent and child. Information about the survey’s methodology can be found on the methodology and technical details page, including links to the Technical Report and further information about the strengths and limitations of an online panel survey.
Due to base sizes, we were not always able to compare between ethnic minority sub-groups or disability.
For each of the questions asked in this survey, responses given were compared between different groups to assess whether there are differences in the way people engage with nature based on: age, gender, ethnicity, level of disability, region, and income (Table 3).
Table 3: Demographic variables used to look at differences in the way CYP engage with nature
| Breakdown | Groupings |
|---|---|
| Age (in years) | 8 to 11 12 to 15 |
| Gender[footnote 3] | Male Female |
| Ethnicity[footnote 4] | White (including White minorities) Mixed or Multiple ethnicities Asian or Asian British Black or Black British Any other ethnic background |
| Disability[footnote 5] | Yes No |
| Region | North Midlands South |
| Income (total annual household income before tax) |
<£15,000 £15,000 to £49,999 ≥£50,000 |
Throughout the terminology ‘disabled person’ has been used in line with Government guidance.
Results are attempts to estimate “true values” in a wider population. Therefore all survey statistics come with an associated margin of error within which the “true” population measure is expected to lie. All differences between groups in this report have been tested for statistical significance; that is, the difference between two compared values is significant even after we have accounted for the margins of error.
Differences between groups were tested using Chi-square tests. Unless otherwise specified, all commentary in the report focuses exclusively on differences that are statistically significant at a 95 per cent confidence level. This means that if the survey was conducted 100 times, a finding of the same nature would be found in at least 95 cases.
Bespoke weights for C-PANS have been applied to this statistical release. These bespoke weights have been generated using regression modelling and include region, age, and ethnicity. Applying weights to data, while tending to make the quoted figures more representative of the population of interest, has the effect of reducing the effective sample size of the data. As such, the effective base size, which is used in any statistical testing, is smaller than the unweighted base size and this has the effect of increasing the confidence intervals around the survey estimates. This effect has been taken into account when determining whether or not differences between survey estimates described throughout the report are statistically significant. Therefore, while the base sizes reported throughout this report are the actual base sizes, the statistical analysis is based on the effective base.
12. Glossary
Green and natural spaces are defined in this survey as green and blue spaces in towns and cities (e.g. parks, canals); the countryside (e.g. farmland, woodland, hills and rivers); the coast (e.g. beaches, cliffs) and activities in the open sea; visits of any duration (including short trips to the park, dog walking etc.). They do not include: gardens; outside spaces visited as part of someone’s employment; spaces outside the UK. Additional questions are asked about private gardens.
95% confidence interval is a range of values around a calculated statistic (e.g. the mean) that you are 95% certain contains the true value of that statistic. For example, where there is a mean value of 49 with a 95% confidence interval of 2, we would be 95% certain that the true mean of the population was in the range of 47-51 (i.e. 49 -2 and 49 + 2). Please note that PANS/C-PANS use quota sampling and confidence intervals here were calculated as if the data were generated from a random probability sample.
13. Contact
Natural England welcomes feedback on these monthly indicators, questions, and suggestions for analysis for future releases. Please contact the team by email: people_and_nature@naturalengland.org.uk
If you would like to receive further information on the survey, including data releases, publications and survey changes, then visit our User Hub and sign-up to the mailing list at the bottom of the page (best viewed in Google Chrome). After signing up, if you do not receive a confirmation email please check your ‘Junk’ or ‘Spam’ folder.
The Senior Responsible Officer for this publication is Dr Katherine Burgess.
14. Pre-release access
This CYP and Nature Survey is a set of Experimental Official Statistics, produced in accordance with the Code of Practice for Statistics and its key principles of Trustworthiness, Quality and Value.
Pre-release access was granted allowing a limited number of ‘eligible people’ access for a strict 24-hour period before the statistics were published. The pre-release access list for these statistics comprises the following:
- Natural England Chief Executive
- Natural England Head of the People and Nature Programme
- Natural England Stakeholder & Communication Lead for the People and Nature Programme
- Senior External Press Officer for Natural England
- Senior Communications lead for Natural England
- Natural England Senior Digital and Social Content Lead
15. Related links
Coronavirus - guidance on accessing green spaces safely: Latest government guidance on using green spaces and protecting yourself and others.
Natural England operational update: Coronavirus information on how Natural England is facing the challenges posed by Coronavirus.
People and Nature questionnaire: Includes link to People and Nature Survey questions.
People and Nature Survey information: Further information on the People and Nature Survey for England.
Coronavirus (COVID-19): safer public places - urban centres and green spaces: Guidance for the owners and operators of urban centres and green spaces to help social distancing.
The Countryside Code Statutory guidance on respecting, protecting and enjoying the outdoors.
-
In 2020, the question asked, “How important is protecting the environment to you?”, whilst the question text was updated to “How important is looking after the environment to you?” in 2021. ↩
-
Three questions that were asked in both 2020 and 2021 were given additional response options or amendments to response option in 2021. Therefore, direct comparisons of percentages of CYP choosing each option cannot be made, however, ranking of items that featured in both 2020 and 2021 surveys have instead been made. This applies to the following questions: CS_Q2 Where are your favourite places to spend time? Please choose one or more options; CS_Q7 What do you most like about spending time outside? Please choose one or more options; CS_Q8 What things have stopped you from spending more time outside in the last week? Please choose one or more options ↩ ↩2 ↩3
-
Parents/guardians could also answer ‘Other’ for their child’s gender. However, sample sizes are not large enough for those that answered ‘Other’ to be able to conduct robust analysis. ↩
-
‘Any other ethnic background’ was not included in comparisons between ethnic groups due to a small sample size for this group. ↩
-
Long-term illness and its impact on day-to-day functioning were measured using the Government Statistical Service standard measure for disability. This measure was split into two categories, those with and those without a disability. Those who did not have a long-term illness or who had one but it did not impact their day-to-day activities were classed as not having a disability, those with a long-term illness which impacted them a little or a lot were classed as having a disability. ↩