
The Norwegian Vehicle Electrification Policy and Its Implicit Price of Carbon


Institute of Transport Economics (TØI), NO-0349 Oslo, Norway
Sustainability 2021, 13(3), 1346; https://doi.org/10.3390/su13031346
Submission received: 30 December 2020
/
Revised: 20 January 2021
/
Accepted: 25 January 2021
/
Published: 28 January 2021
(This article belongs to the Special Issue Ensuring Sustainable Development at the Light of New Mobility Trends and Challenges)
Abstract
:The rapid market uptake of battery and hybrid electric cars in Norway is unparalleled. We examine the fiscal policy instruments behind this development. In essence, the Norwegian policy consists in taxing internal combustion engine vehicles rather than subsidizing electric ones. There are 14 different fiscal incentives in place bearing on vehicles, fuel, or road use. All of them are in some way CO2-differentiated. In the tradition of positive economics, we derive the price of carbon implicit in each policy instrument and in the total package of taxes and subsidies. The price of carbon characterizing the trade-off between conventional and battery electric cars in Norway as of 2019 exceeds €1370 per ton of CO2. For light and heavy-duty commercial vehicles the corresponding prices have been conservatively estimated at €640 and €200 per ton of CO2, respectively. In addition, the penalty incurred by automakers for not meeting their 2020/2021 target under EU Regulation 2019/631 corresponds to a carbon price of the order of €340 per ton of CO2. As compared to the price of emission allowances in the European cap-and-trade system, the price of carbon paid by automakers and Norwegian motorists is one or two orders of magnitude higher.
1. Introduction
In 1987, the World Commission on Environment and Development published their report “Our Common Future” [1], widely known as the “Brundtland report”, whereby the Commission popularized the term “sustainable development”. Recognizing anthropogenic climate change as a major threat to humanity and to the planet’s ecosystem, the Commission identified greenhouse gas (GHG) mitigation as a key prerequisite for sustainability.
Almost three decades later, all nations expressed their commitment to limit the increase in the global average temperature to less than 2 °C above pre-industrial levels, preferably to not more than 1.5 °C. By the Paris agreement [2], the signatories are invited to present, enforce, and gradually reinforce their “Intended Nationally Determined Contributions” (INDC) toward the 1.5 °C target.
According to Stern [3], “climate change is the greatest market failure the world has ever seen”. There is widespread agreement among economists that generalized carbon pricing would be the most cost-efficient way to achieve large-scale reductions of CO2 emissions. There is less agreement, however, regarding the choice of specific carbon pricing policy instruments, some supporting carbon taxes and others favoring cap-and-trade mechanisms [4]. In essence, both of these imply market correction by means of a financial penalty.
The European Union (EU) has implemented a cap-and-trade system for GHG emissions, known as the European Union Emissions Trading System (EU ETS) [5]. The system applies in the entire European Economic Area (EEA), encompassing Norway, Iceland, and Liechtenstein in addition to EU Member States. It covers somewhere in excess of 40 percent of all GHG emissions on EEA soil, including intra-EEA aviation, most of the manufacturing industry and all power plants with an installed effect of at least 20 megawatts.
The sectors not covered by EU ETS are encompassed by the European Effort Sharing Regulation [6], including transportation, buildings, agriculture, non-ETS industry, and waste. Of these, transportation is the largest in terms of GHG emissions. An estimated 25 percent of all GHG emissions in the EU originate from transportation (including intra-EEA aviation, covered by the EU ETS) [7]. Close to one half of these emissions come from private cars. With the global motor vehicle fleet heading toward two billion units by 2030 [8], there is an unequivocal need for large-scale GHG abatement in road transportation. Sperling and Gordon [8] insist that “The principal solution is electric-drive technology.” Alternative strategies, such as efficiency improvements to the internal combustion engine (ICE), enhanced mass transit supply, or substitution of biofuel for fossil fuel, cannot bring about the amount of GHG reductions called for.
To curb GHG emissions in transportation, the EU has mandated, since 2015, maximum CO2 emission targets for new passenger cars sold in EU Member States. For each calendar year from 2020 to 2030, EU Regulation 2019/631 [9] specifies target CO2 emission rates for each pool of manufacturers bringing new passenger cars or light commercial vehicles (LCVs) to the EEA market. The target in 2020 and 2021 is 95 gCO2/km, as weighed together over all manufacturers selling passenger cars in the EEA.
More lenient targets are set for manufacturers producing heavier than average vehicles. For passenger cars, the 2020/2021 target increases by 1 gCO2/km for every 30 kg vehicle weight above the reference mass of 1379.88 kg. For each car and each gCO2/km in excess of the target value (as evened out over all cars sold in a given calendar year), the manufacturer incurs an “excess emissions premium” of €95. As a matter of “phase-in”, automakers are allowed to keep 5 percent of their cars out of the calculation in 2020. From 2021 onwards, every car sold counts toward the manufacturer’s target.
Cars emitting less than 50 gCO2/km by the New European Driving Cycle (NEDC), the type approval test procedure in use until 2019 in the European Union, give rise to “supercredits”, meaning that in 2020, each of these cars is counted twice. The supercredit multiplicator reduces from 2 to 5/3 cars in 2021 and to 4/3 cars in 2022. From 2023 onwards, each zero or low emission car will be counted as one.
This supranational regulation is likely to substantially alter the supply of automobiles in the EEA in the years to come, in terms, primarily, of its split between energy technologies (powertrains). Until 2019, however, the automobile markets of the various EEA countries have been affected first and foremost by the respective national taxation systems and fiscal incentives. A wide variety of automobile taxation systems are in place in Europe [10,11,12]. Many EEA Member States levy some kind of registration or circulation tax; their structures and levels differ considerably. Some countries grant subsidies and bonuses to buyers of battery, fuel cell or hybrid electric cars. Other countries apply CO2-graduated purchase or ownership taxes. Some, like France and Sweden [13,14], practice feebates, i.e., bonus-malus systems, to shift market demand from high to zero and low emission vehicles.
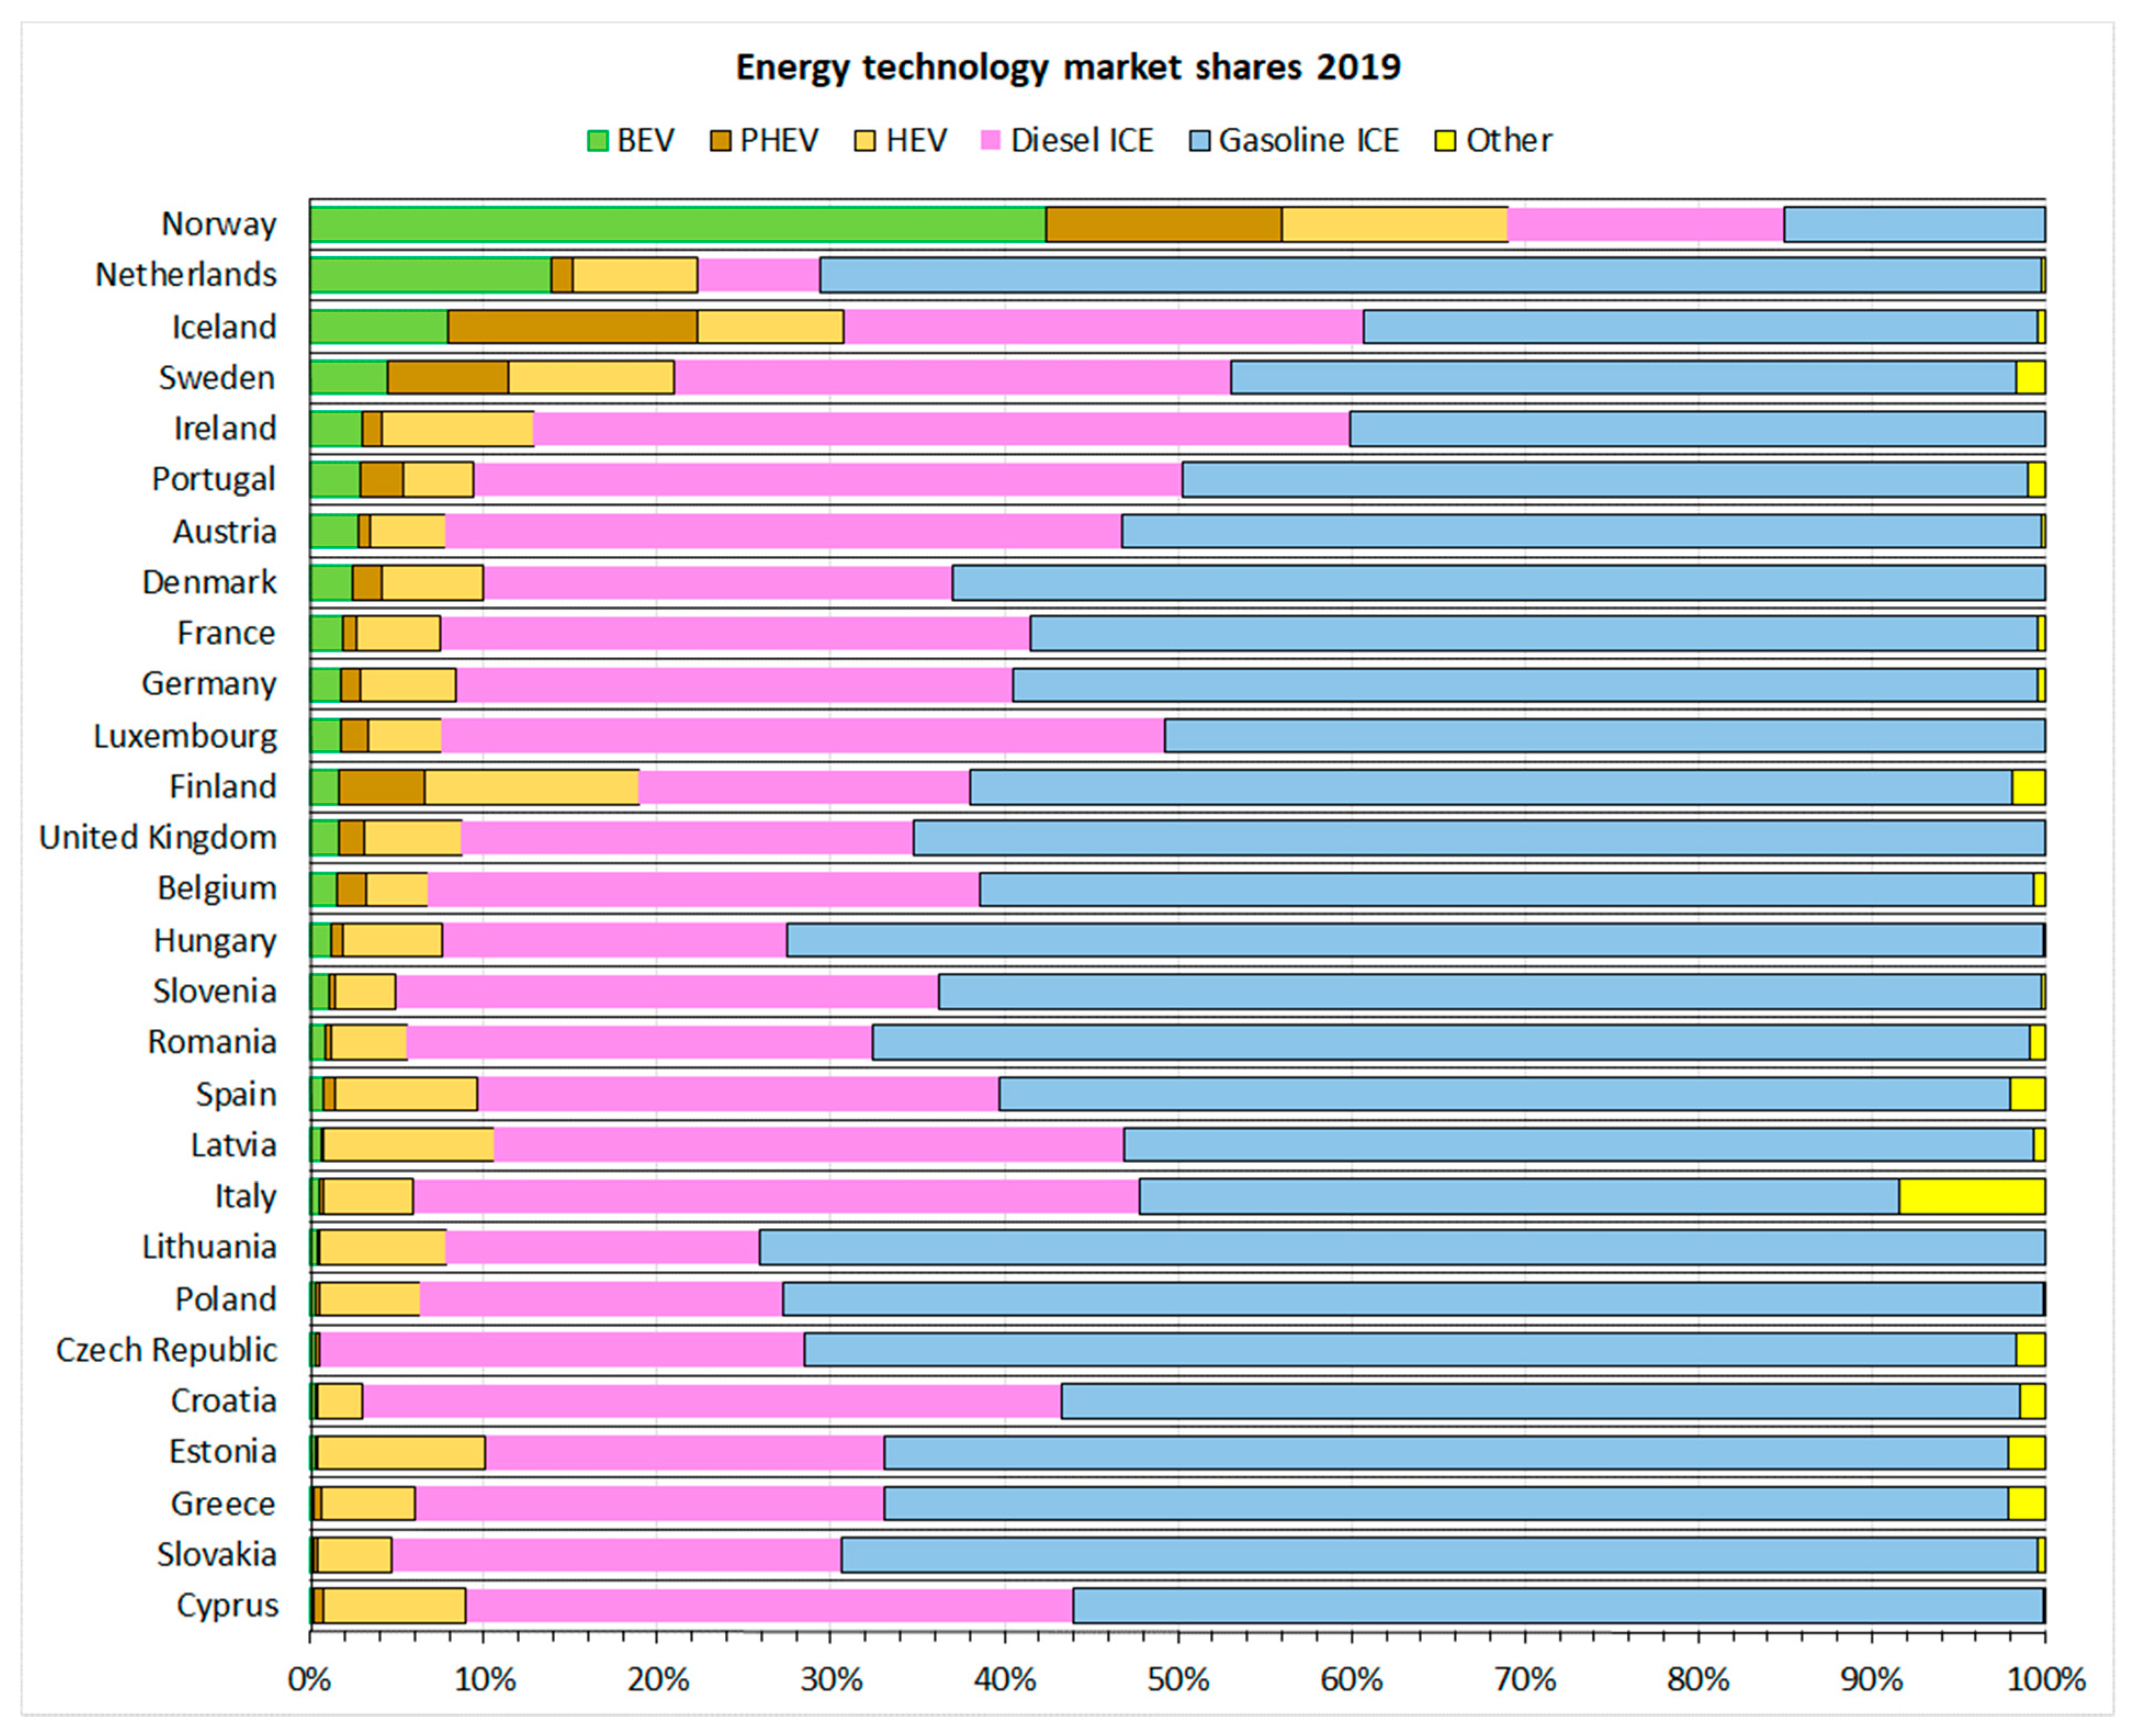
An overview of the resulting markets for new passenger cars in the EEA countries as of 2019 is presented in Figure 1, where countries are sorted in descending order in terms of the battery electric vehicle (BEV) market share.
Norway is on top, with its 42.4 percent BEV share and its 13.6 percent plug-in hybrid electric vehicle (PHEV) share. These high shares of zero and low emission automobiles come as a result of an enduring, no-nonsense government policy, consisting in a series of fiscal and regulatory incentives which directly or indirectly favor zero emission vehicles (ZEVs), be they battery or fuel cell electric cars [16].
This paper sets out to examine the fiscal policy instruments in place in Norway and, for maximum transparency, to derive the price of carbon implicit in the various types of tax and in their combination. As a point of reference, note that for a passenger car with a life-time mileage of 200,000 km, the one-off €95 per gCO2/km “excess emissions premium” payable, under EU regulation 2019/631, by an automaker that fails to reach his target, corresponds to a nominal carbon price of €475 per ton of CO2, or €475/1.4 = €339 per ton if we assume real world emissions to be roughly 40 percent higher than at the NEDC type approval laboratory test [17]. In comparison, one may note that the price of emission allowances in the EU ETS was a mere €26.76 per ton of CO2 equivalents as of 20 November 2020.
The United Nations’ Intergovernmental Panel on Climate Change (IPCC) has developed GHG “mitigation pathways” compatible with the 1.5 °C target [18]. For 2030, the global price of carbon consistent with these pathways ranges from US$ 135 and upwards, with a median value around US$ 266 = €235 per ton of CO2 as measured in 2019 dollars and euros. Note, however, that this carbon price is consistent with the 1.5 °C target only on the condition that it be imposed globally, i.e., in all sectors and all jurisdictions.
The literature abounds with studies of the “social cost of carbon” and with normative analyses aiming to derive an “optimal” price on carbon emissions [3,19]. Few authors have examined the issue from the angle of positive economics: How much do consumers and businesses actually pay for their CO2 emissions? How much tax expenditure could they avoid by choosing zero or low emission vehicles and transportation modes? This is where the present paper aims to make a contribution.
One example of positive economic analysis is the comprehensive report published in 2016 by the OECD [20], where they derived, for 41 countries, “effective carbon rates, the price of carbon emissions resulting from taxes and emissions trading systems”. They found that only 10 percent of all emissions were priced at an effective carbon rate equal to or exceeding €30 per ton of CO2. Road transportation was found to have “comparatively high effective carbon rates”, with 46 percent of CO2 emissions priced above €30 per ton.
2. The Norwegian Automobile Market and Fiscal Policy Instruments
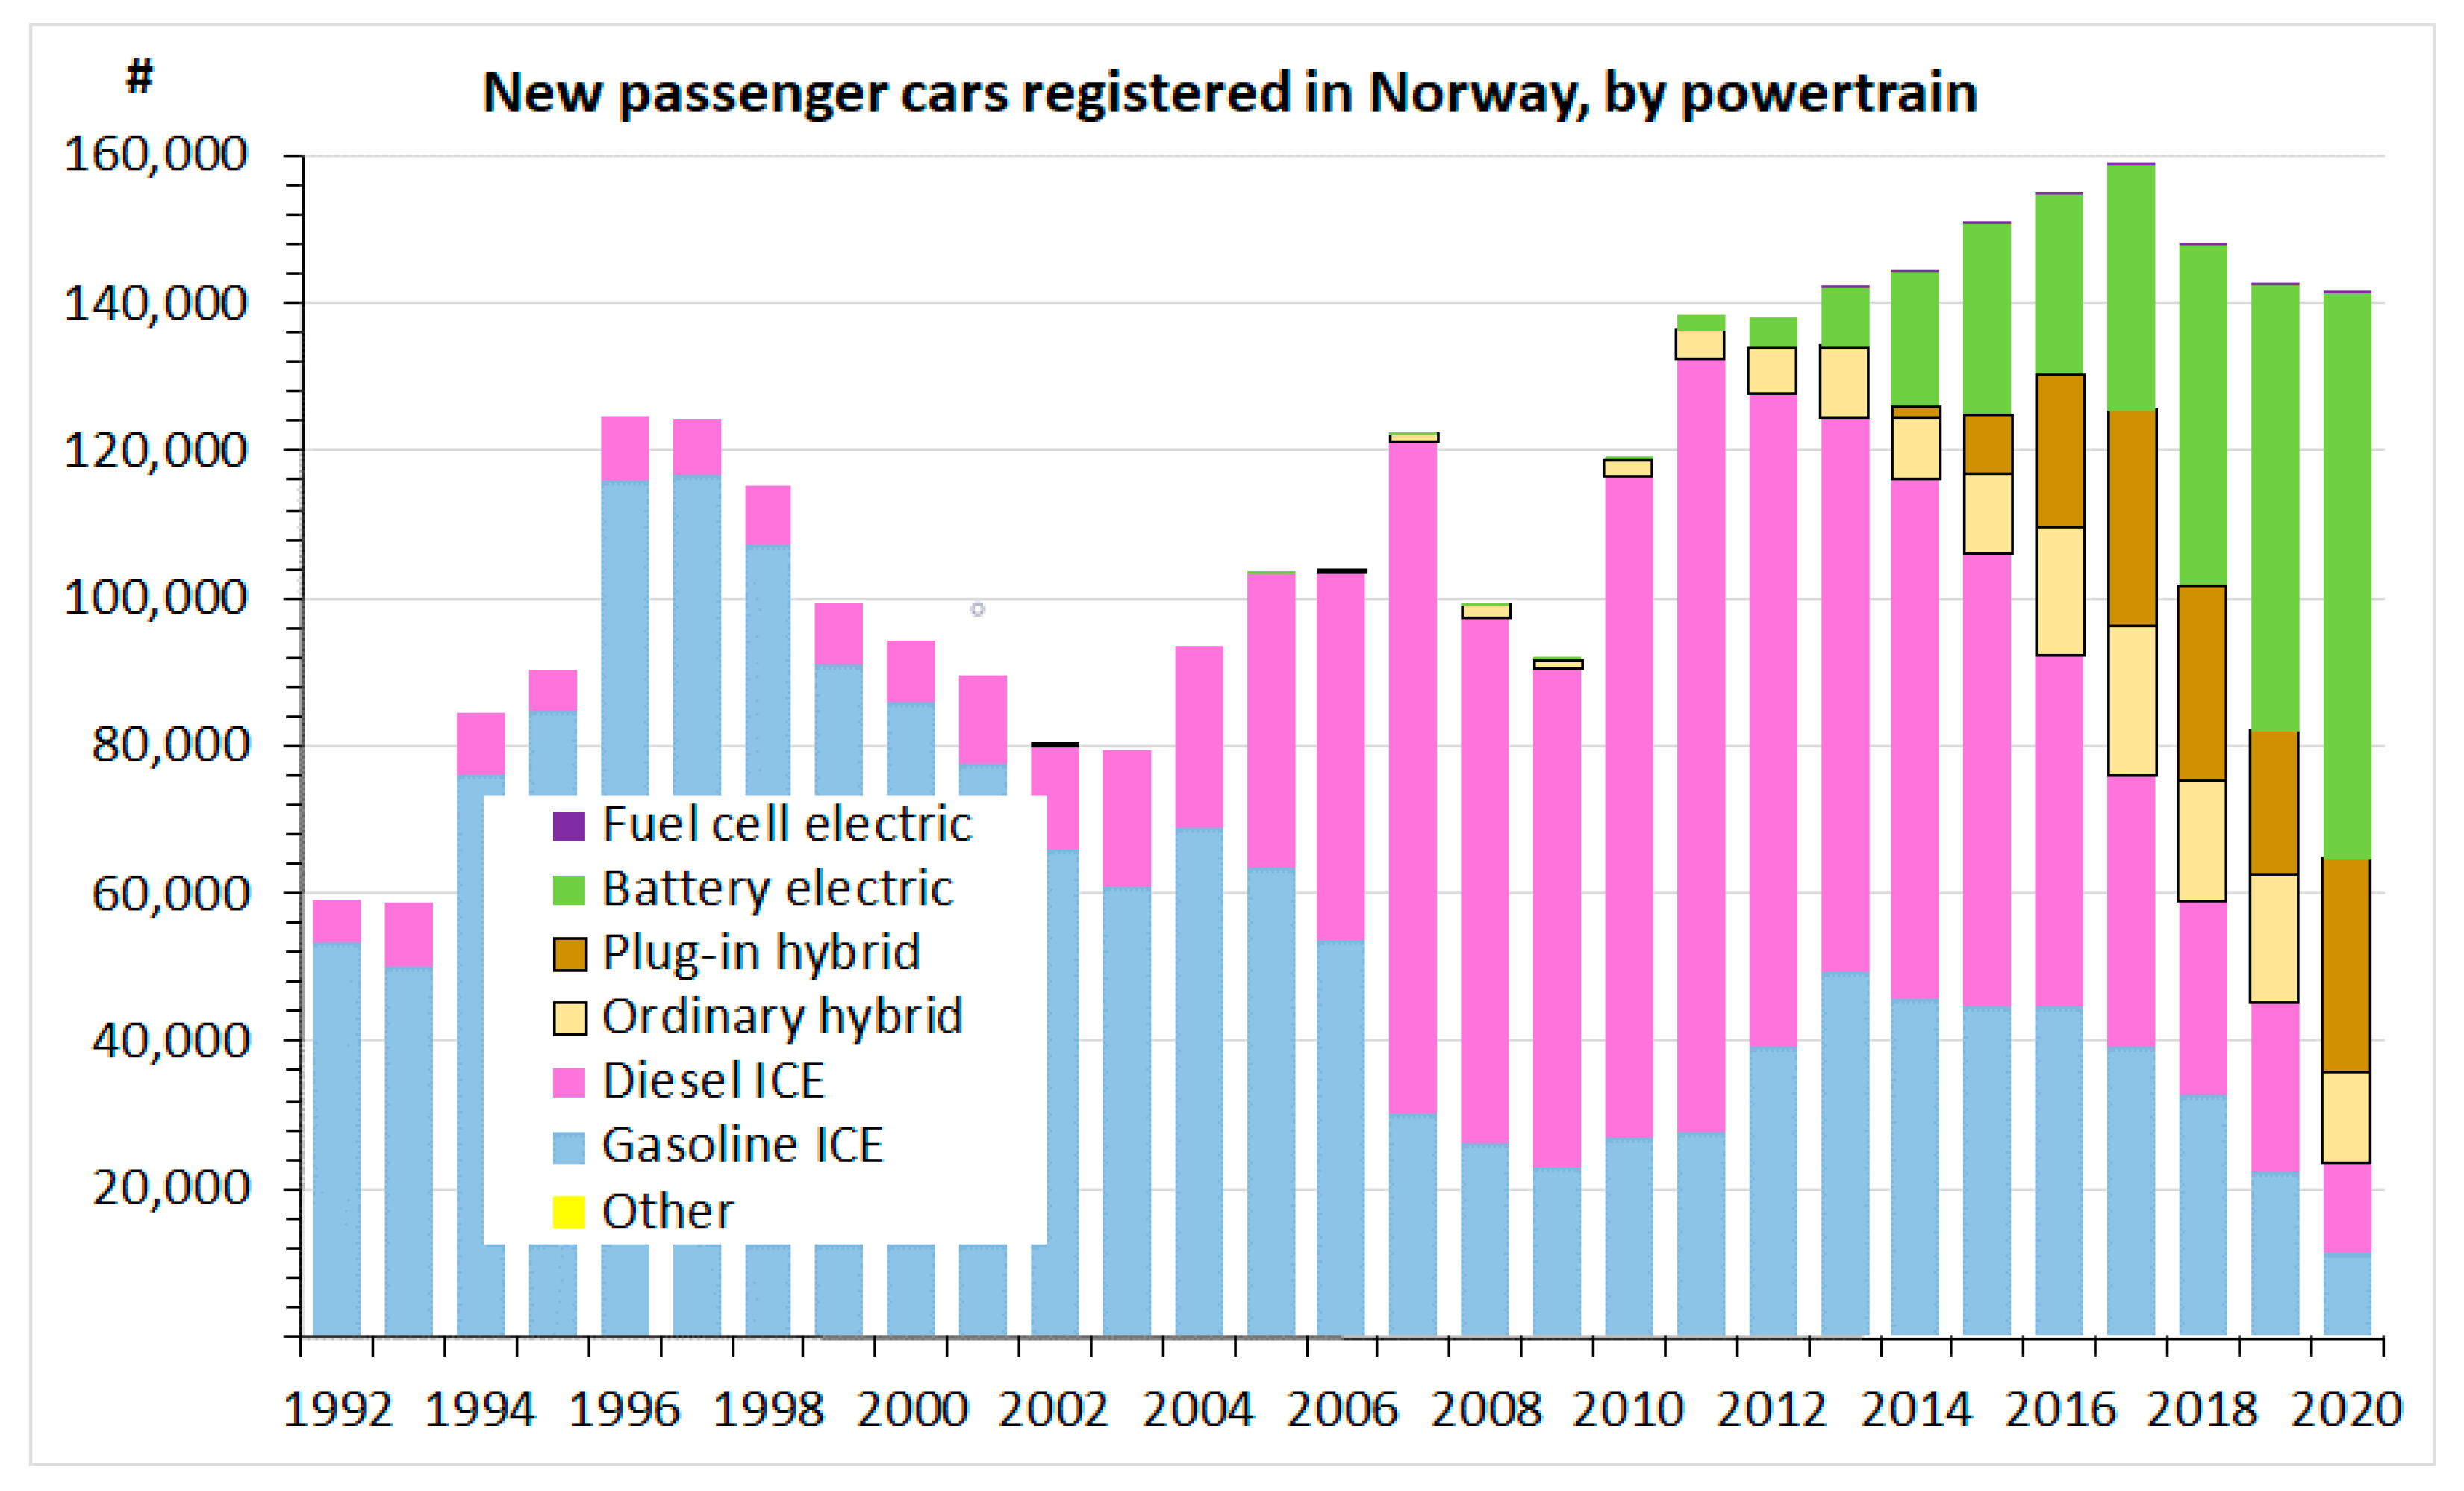
The rapid uptake of battery and hybrid electric cars in Norway is unparalleled. The BEV and PHEV market shares have grown almost continuously since 2010 (Figure 2), at the expense of gasoline and diesel cars. The latest figures (Source: www.ofv.no), covering the calendar year 2020, show BEV and PHEV market shares of 52.3 and 20.4 percent, respectively.
While in the European Union the (NEDC) type approval rates of CO2 emissions from new cars went up from 118.1 gCO2/km in 2016 to 122.4 gCO2/km in 2019, the rate has been steeply falling in Norway, to a mean of 60 gCO2/km in 2019 and 45 gCO2/km in 2020, the latter figure being calculated by the new and stricter WLTP procedure (Figure 3).
A common misunderstanding is that the increasing sale of BEVs in Norway is due to massive subsidization, facilitated by the country’s petroleum wealth. But in fact, only a negligible share of the Norwegian incentives is made up by subsidies. In essence, the policy consists in taxing internal combustion engine (ICE) vehicles.
There are 14 different fiscal incentives in place bearing on vehicles, fuel, or road use. All of them are in some way CO2-differentiated. Zero exhaust emission vehicles (ZEVs), i.e., battery and fuel cell electric cars, are wholly or partially exempt of the first nine of these:
- Graduated, one-off registration tax on passenger cars and LCVs, with ZEVs fully exempt;
- Reregistration tax on second hand sales of passenger cars and LCVs, with ZEVs fully exempt;
- Annual circulation (ownership) tax on passenger cars and LCVs, with ZEVs fully exempt;
- Fuel tax, not applicable to ZEVs;
- Road toll, with ZEVs fully or partially exempt;
- Ferry fares, with strongly reduced rates for ZEVs;
- Public parking fees, often with full exemption for ZEVs;
- Income tax on private use of company cars, with lower rates for ZEVs;
- Value added tax (VAT), with ZEVs fully exempt;
- Weight and Euro-class-graduated annual ownership tax on heavy-duty freight vehicles;
- Government support for fast charging and hydrogen refueling facilities;
- Free recharging of BEVs at public parking lots;
- Subsidy on new battery or fuel cell electric light commercial vehicles;
- Subsidies on zero emission heavy-duty vehicles and machinery.
3. Calculating the Implicit Price of Carbon: Method and Results
The fuel tax rate in 2019 was 6.43 Norwegian kroner (NOK) = €0.637 per liter of gasoline and NOK 5.16 = €0.488 per liter of diesel, corresponding to NOK 2770 = €286 and NOK 1940 = €200 per ton of CO2, respectively, all figures being net of (25 percent) value added tax (VAT). (We convert NOK to Euros at the exchange rate effective as of 1 July 2019, i.e., €1 = NOK 9.70. The tax rates used for calculation in this paper can be found on the Norwegian government’s website [22].)
An even more important incentive in Norway is the CO2-differentiated, one-off vehicle registration tax (“purchase tax”), payable upon first registration of any passenger car or light commercial vehicle with an internal combustion engine (ICE). Its effects on BEV and PHEV market shares and on the average CO2 emission rate of new cars have been studied by several authors [14,16,23,24,25].
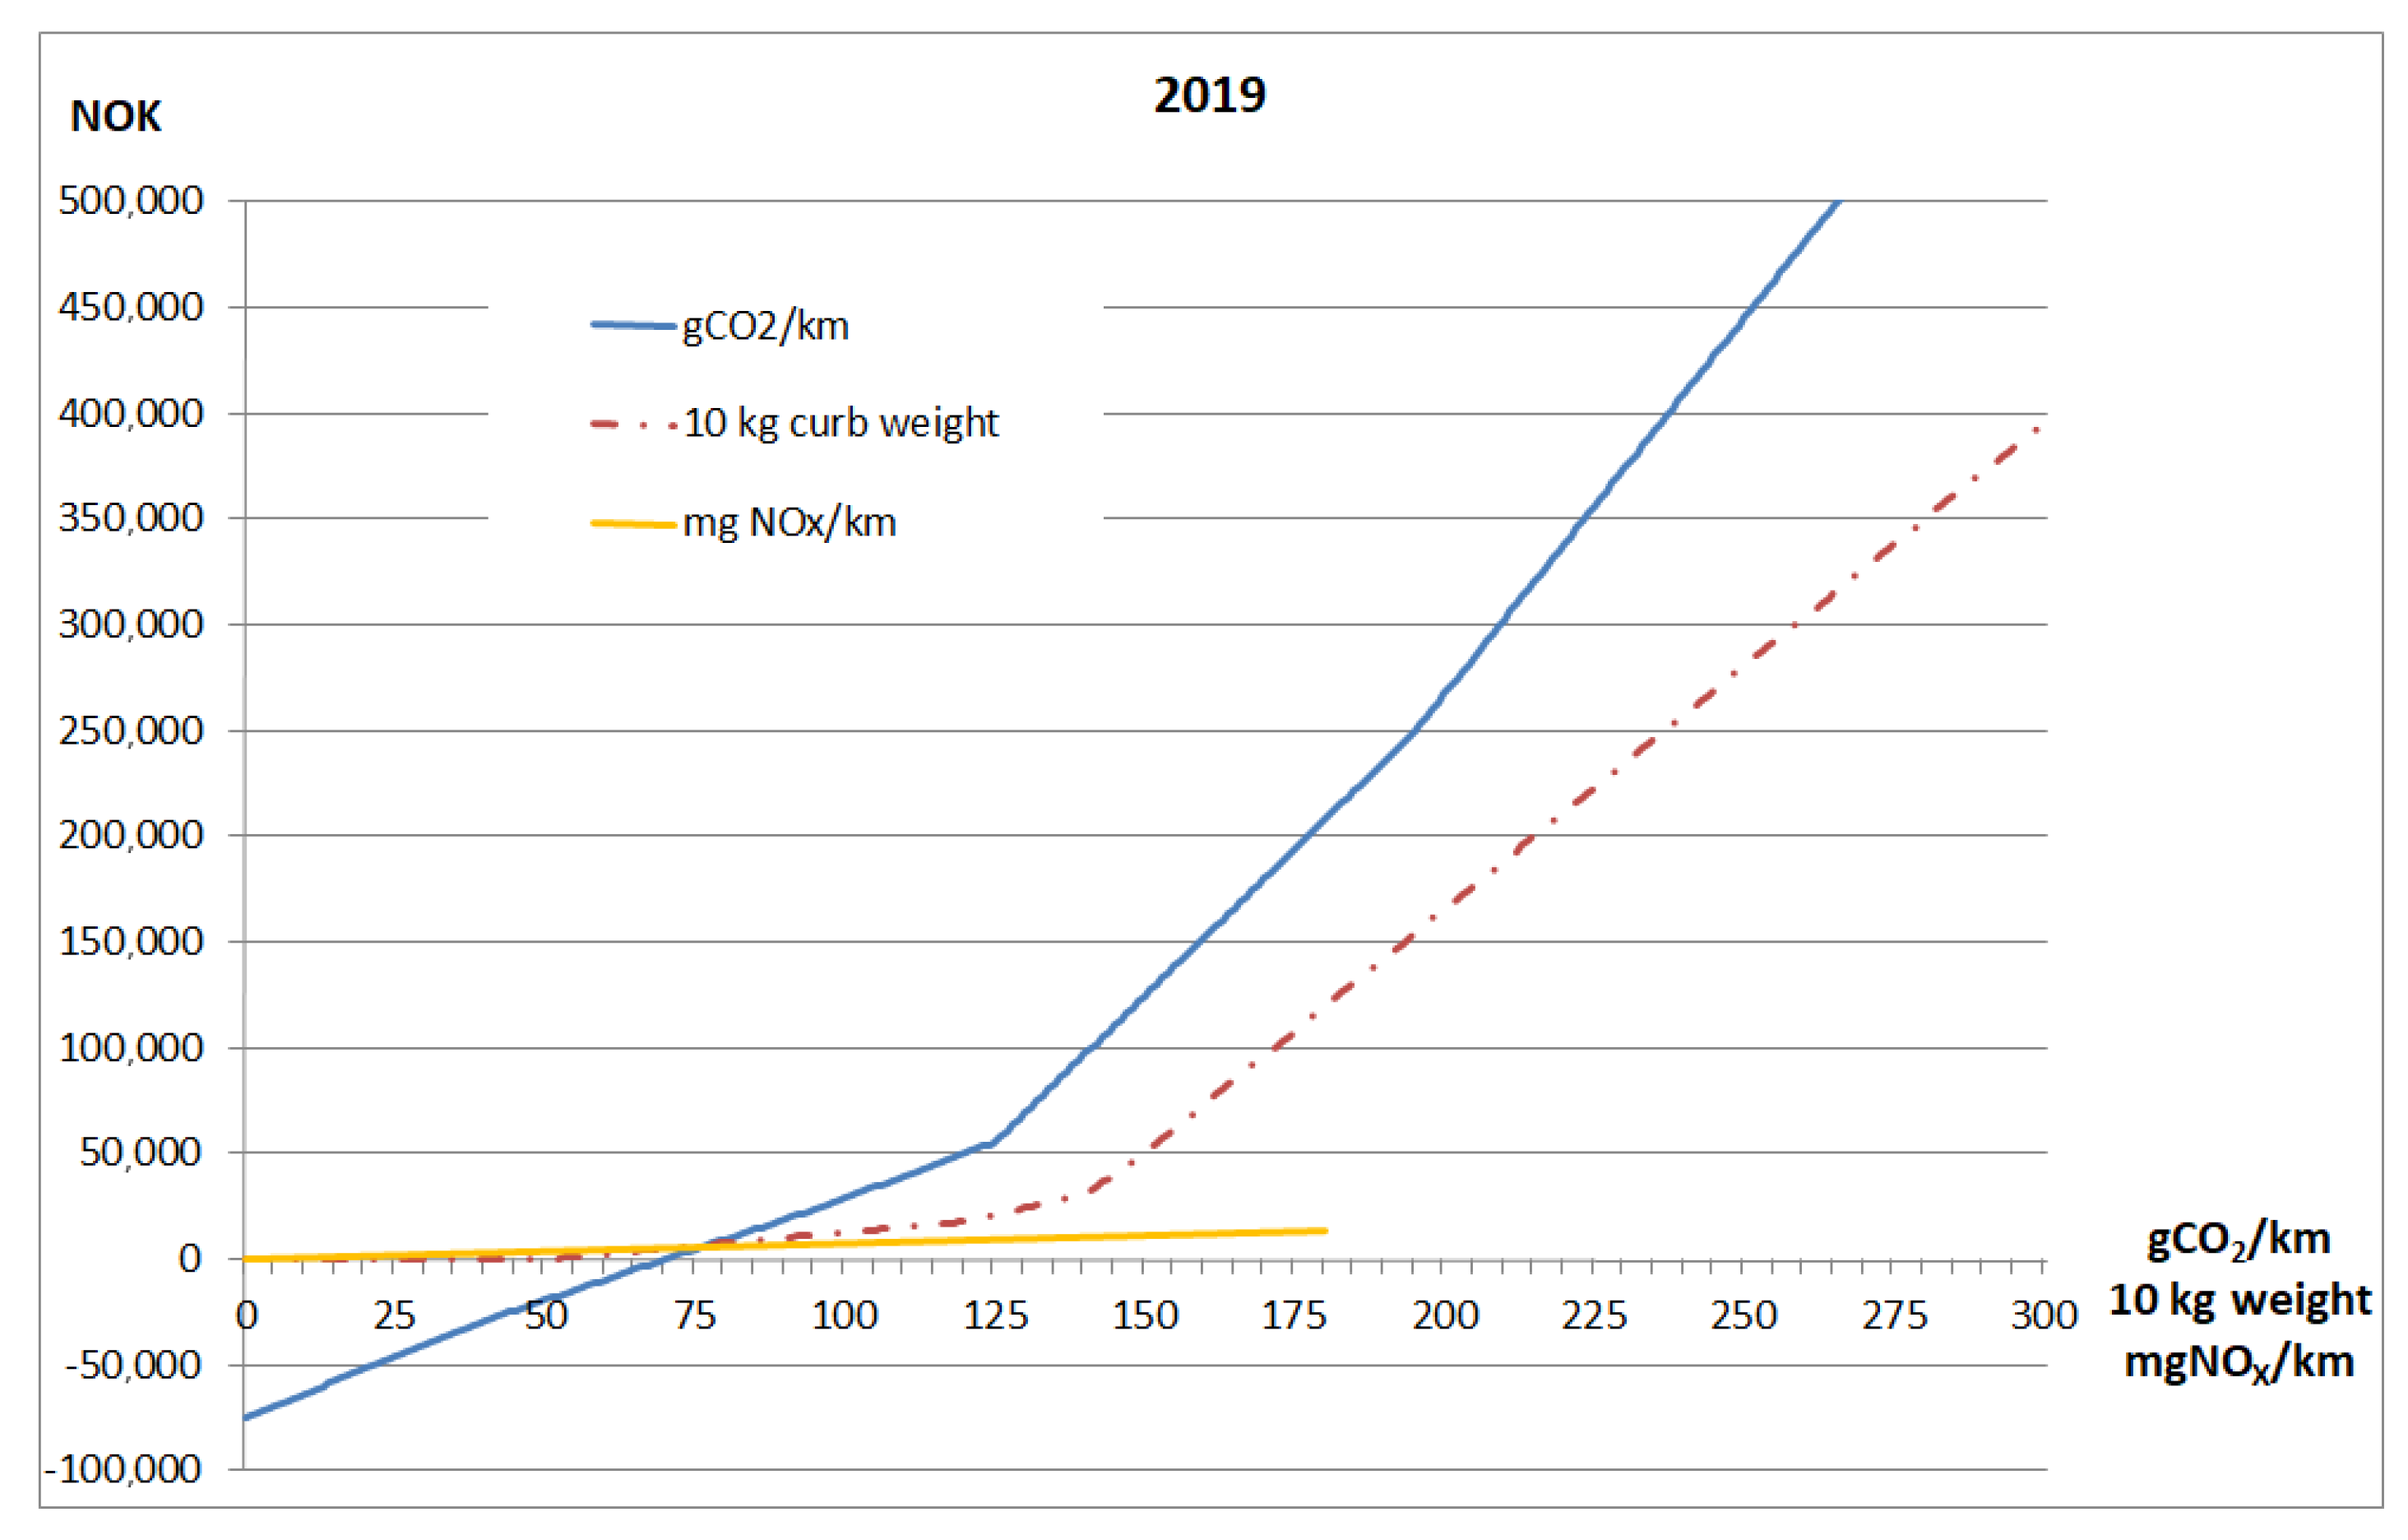
The purchase tax is the sum of three separate components. In Figure 4, all of these components are shown graphically, as functions of 10 kg curb weight, gCO2/km or mgNOX/km type approval emission rates, respectively, each of them plotted along the same horizontal axis. Note that the CO2 component is negative and hence deductible below 70 gCO2/km.
As an illustration, consider a couple of examples. For a hypothetical car weighing 1500 kg (including 75 kg driver), with type approval emission rates of 50 gCO2/km and 50 mgNOX/km, the purchase tax components in 2019 would sum to NOK 50,260 − 19,330 + 3657 = NOK 34,587, corresponding to €3566 at the mid-2019 exchange rate. As a second example, a car weighing 2000 kg, with type approval emission rates of 150 gCO2/km and 50 mgNOX/km, would incur purchase tax components of NOK 165,375, NOK 124,540 and NOK 3657, summing to NOK 293,572, or €30,265, i.e., a more than eight times higher tax than in the previous example. The convex weight and CO2 components mean that heavy, gas guzzling cars are subject to a disproportionately higher purchase tax than are smaller and leaner vehicles.
The minimum purchase tax in Norway is zero. Even if the negative CO2 component should be larger in absolute value than the sum of the two positive components, the total purchase tax rate would not turn into a subsidy, as in the French and Swedish bonus-malus systems [12,13,14].
Certain special tax breaks apply to plug-in hybrid vehicle (PHEVs). The taxable curb weight of a PHEV is reduced by up to 23 percent prior to calculating the weight component. This essentially means that for PHEVs, every point on the red curve in Figure 4 is shifted up to 29.9 percent to the right (since 1/(1 − 0.23) = 1.299). Only cars exhibiting an all-electric driving range of at least 50 km are eligible for a full 23 percent weight reduction. If the range is r < 50 km, the weight deduction is set at 23∙r/50 percent.
To convert the CO2 curve shown in Figure 4 into a price on carbon, we compute the mean slope between 0 gCO2/km and some point in the upper range of automobiles sold. For gasoline cars such a point is 150 gCO2/km, while for (the generally larger) diesel cars we use 200 gCO2/km as our numerical example. This results in a slope of NOK 1328 = €137 per gCO2/km for gasoline cars and NOK 1708 = €176 per gCO2/km for diesel cars.
Assuming a life-time mileage of 260,000 km for each car and a 40 percent higher rate of emissions in real traffic than in the laboratory [17], these figures translate into tax rates for gasoline and diesel cars, respectively, of NOK 3650 = €376 and NOK 4690 = €484 per ton of CO2. A conservative ballpark number for passenger cars in general would be €400 per ton of CO2.
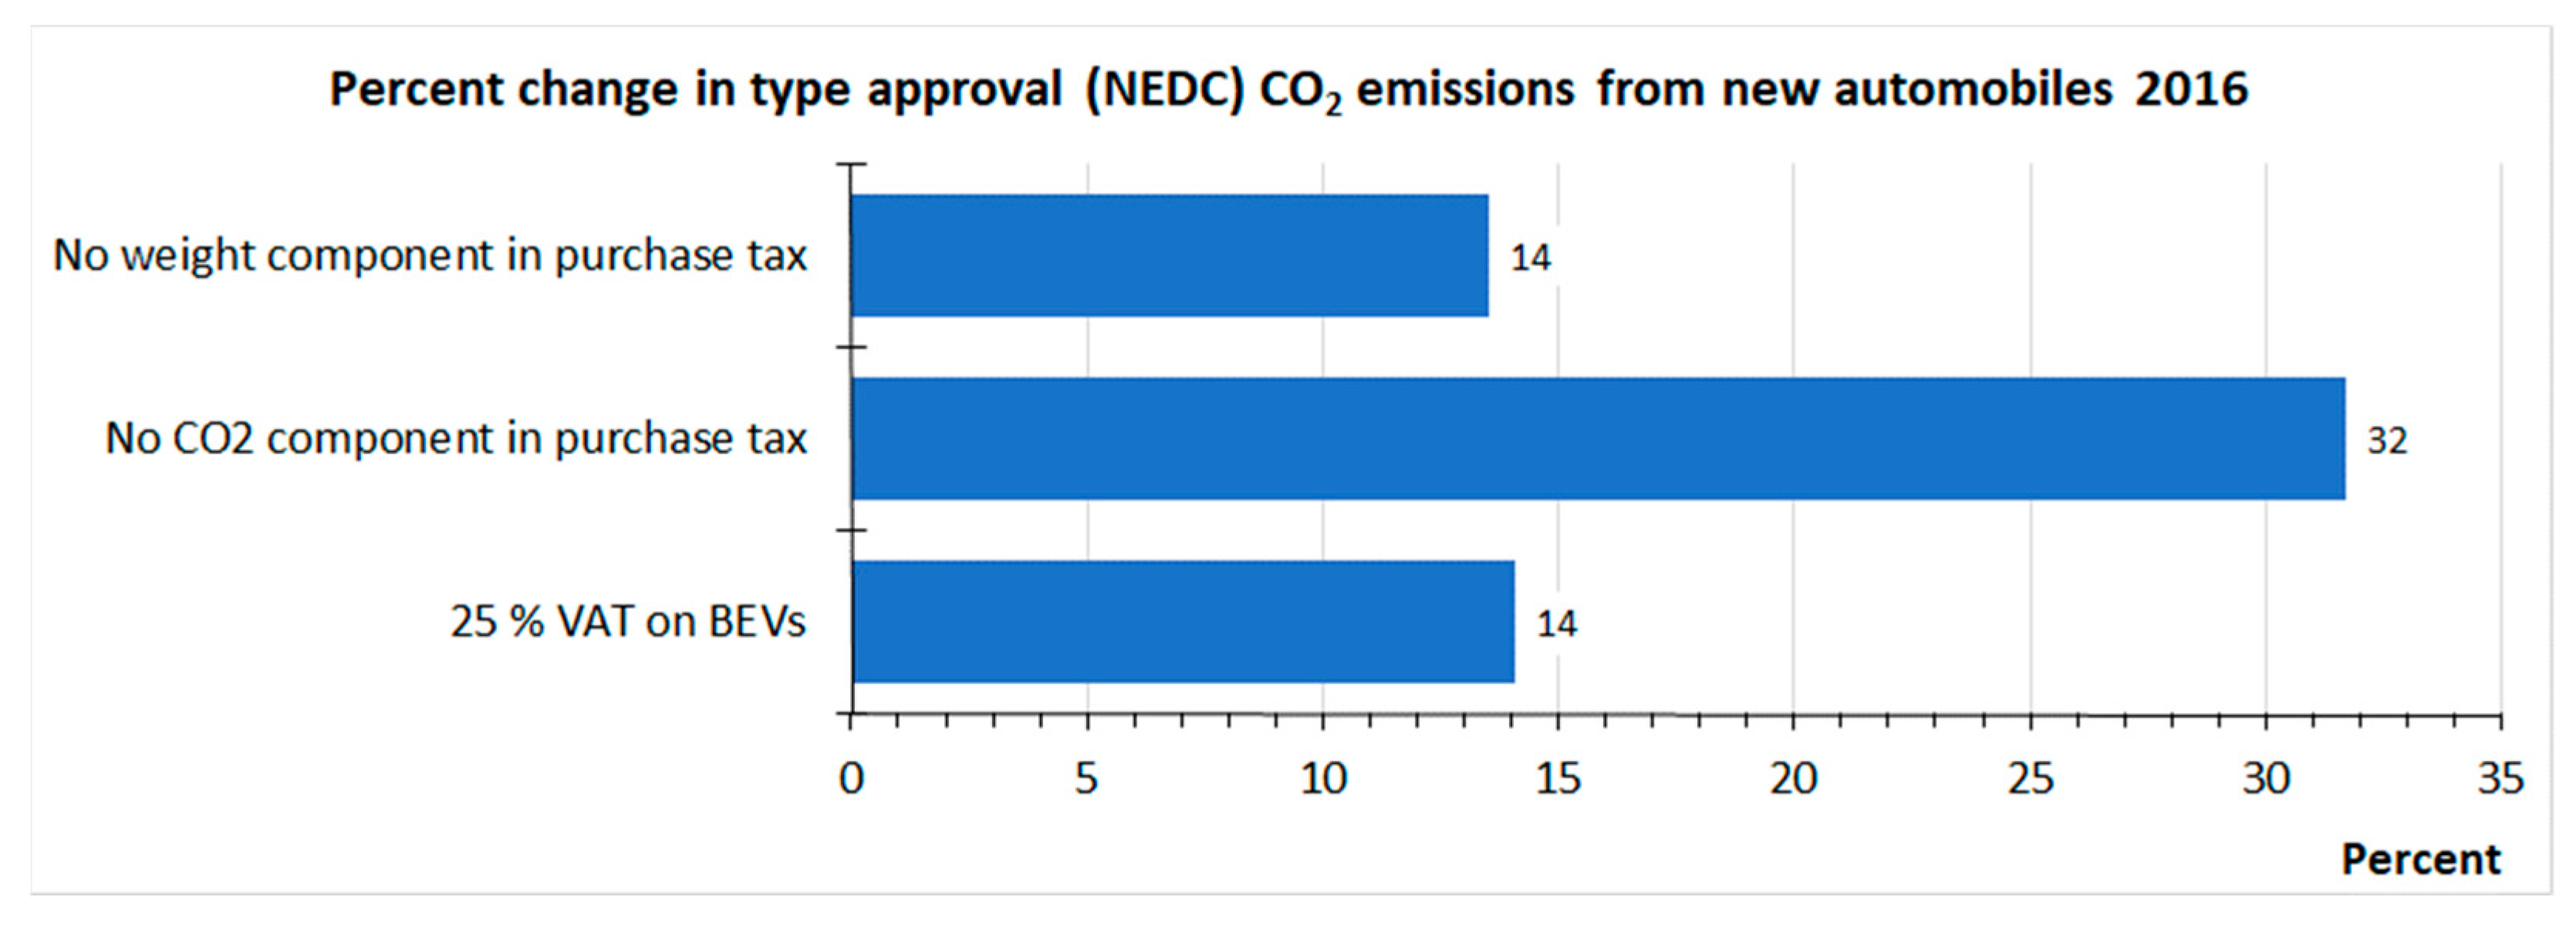
To assess the impact of the weight component of the registration tax, we invoke certain previous analyses [23], which show an about 14 percent increase in the mean type approval rate of new passenger cars in the event of an abolished weight component. This compares to a 32 percent estimated effect of dropping the CO2 component (Figure 5). Thus we estimate the carbon price associated with the weight component at €400∙14/32 = €180 per ton of CO2.
To calculate the carbon price implicit in the VAT exemption for ZEVs, we relate the average amount of VAT paid on internal combustion engine (ICE) vehicles (NOK 75,862) to their average mean type approval emission rate (104 gCO2/km). These figures are calculable on the basis of data made public by the Norwegian Ministry of Finance [27] and by the Norwegian Road Federation (www.ofv.no). We arrive at NOK 75,862/104 = NOK 728 per gCO2/km, which translates into €200 per ton of CO2 through a vehicle’s life-time.
3.1. Passenger Cars
Taken together, the purchase tax incentives for passenger cars, i.e., the one-off registration tax and the VAT exemption, amount to a carbon price of €400 + 180 + 200 = €780 per ton of CO2 (Table 1).
The ownership (circulation) tax amounts to NOK 2909 = appr. €300 per annum for most ICE cars. With an estimated average CO2 emission of 2.145 tons per ICE vehicle per annum [23], we calculate the carbon price implicit in the ZEVs’ exemption from car ownership tax at NOK 2909/2.145 = NOK 1350 = €140 per ton of CO2.
According to the Norwegian Ministry of Finance [28], the aggregate amount of toll revenue foregone on account of the full exemption for ZEVs in 2018 was NOK 1.2 billion, corresponding to appr. NOK 5300 per ZEV in the stock at mid-year, or NOK 5300/2.145 = NOK 2480 = €250 per ton of CO2. As of 2019, the full ZEV exemption from toll has been replaced, in some places, by a 50 percent discount for BEVs. Hence we reduce the estimated carbon price due to tolling to a ballpark figure of €200 per ton of CO2.
According to the same source [28], the ferry fare discounts for ZEVs totaled NOK 45 million = appr. €4.6 million in 2019, or about €21 per ZEV per annum. This translates into a carbon price of about €21/2.145 = €10 per ton of CO2 avoided. Also, by the same source, the ZEVs’ exemption from reregistration tax on second hand sales amounted to NOK 185 million in 2019, translating into NOK 820 = €85 per vehicle per annum, i.e., €85/2.145 = €40 per ton of CO2.
The preferential treatment of ZEVs when it comes to taxing the fringe benefit of a company owned car used for private purposes amounts to NOK 200 million in 2019 [28], translating into an average of NOK 890 = €92 per BEV per annum, i.e., €92/2.145 = appr. €43 per ton of CO2. This average is, however, not very representative, since the tax incentive addresses only a small percentage of all automobiles sold: those acquired by a private or public enterprise and put at the disposal of an employee. In these few cases, however, the tax advantage is considerable. For a less than 3-year-old car selling at, e.g., €40,000 as new, the annual fringe benefit is valued, by the tax authorities, at €11,241 in the case of an ICE vehicle and at €6745 in the case of a BEV [29]. For an employee with a marginal income tax rate of 40 percent, the tax differential is worth around €1800 per year, translating into appr. €840 per ton of CO2. For the more expensive vehicle segments typical of company cars, the CO2 price due to fringe benefit taxation could easily reach €1000 per ton of CO2.
The government support for fast charging and hydrogen refueling infrastructure amounted to around €4 million in 2017, but only €0.7 million in 2019, corresponding to about €2.5 per BEV in the vehicle stock, or a negligible €1 per ton of CO2 [30].
Disregarding the relatively minor incentives due to the reduced parking fees for ZEVs, and the preferential tax treatment of zero emission company cars, we arrive at a total carbon price for passenger cars of at least €1370 per ton of CO2.
For company cars put at the disposal of an employee, one might add another €500–1000 to the estimated implicit price of CO2, depending on the automobile retail price level and on the user’s marginal income tax rate. In this case, the CO2 bill is split between employer and employee. The registration tax, the value added tax, the ownership tax, and perhaps also the fuel tax, the ferry fares and the toll bill, could be paid by the employer rather than by the car user.
The total carbon price shown at the bottom of Table 1 is relevant when comparing an ICE vehicle to a zero exhaust emission vehicle (ZEV), or to another emission free alternative, such a walking, bicycling, or abstaining from travel. For comparison between different ICE vehicles, however, only the three uppermost entries in the table apply, as suggested by the asterisks. Thus the price of carbon incurred when choosing a gas guzzler over, e.g., a low emission PHEV is of the order of €780 per ton of CO2.
3.2. Light Commercial Vehicles
Most light commercial vehicles (LCVs) are diesel driven and hence subject to the same fuel tax as diesel driven passenger cars—€200 per ton of CO2.
LCVs are subject to a set of registration tax rules that are, roughly speaking, 25 percent of the rates applicable to passenger cars. Thus for these vehicles, we estimate the CO2 and weight components of the one-off registration tax at roughly €100 and €50 per ton of CO2.
The VAT exemption for ZEVs is of almost no consequence for LCVs, since most LCV buyers are VAT-registered companies. The ownership tax and toll rates are the same for LCVs as for passenger cars. However, their ICE emission rates are generally higher, resulting in lower carbon prices, of roughly €100 and €150 per ton of CO2, respectively. The reregistration tax on second hand sales of LCVs is about one-third of the rate applicable to passenger cars, hence around €10 per ton of CO2.
Since August 2019, a subsidy scheme is in place for zero emission LCVs. The subsidy varies between NOK 15,000 = €1550 and NOK 50,000 = €5150, depending on the power of the electric motor. As compared to a diesel van, with an assumed life-time CO2 emission of, say, 50 tons, the subsidy corresponds to a carbon price of at least €30 per ton of CO2.
In total, the carbon price for LCVs is at least €640 per ton of CO2 (Table 1).
3.3. Heavy-Duty Freight Vehicles
For heavy-duty trucks, the only important tax is the fuel tax, amounting to approximately €200 per ton of CO2. The weight and Euro-class-graduated annual ownership tax is too small to have much impact on the choice of heavy-duty freight vehicle technology. The subsidy scheme for zero emission heavy-duty vehicles and machinery allows for an up to 50 per cent reimbursement of the extra costs incurred by converting to zero emission technology. But there are, so far, no statistics available that allow us to calculate the price of carbon implicit in this scheme. Anyway, its present scope is limited.
4. Uncertainties and Qualifications
The figures shown in Table 1 are, generally speaking, rather cautious estimates. There are at least six factors that give rise to uncertainty on the upside, and one source of inaccuracy on the downside.
The downside source of inaccuracy is the electricity tax, which should be taken account of whenever ICE vehicles are compared to BEVs. In Norway in 2019, the electricity tax was NOK 0.1583 = appr. €0.016 per kWh. It translates into about €20 per ton of CO2, lowering the differential fuel tax component of the carbon price by about 10 percent and the total carbon price for passenger cars by 1.6 percent.
More important are the following factors, the neglect or conservative assessment of which serves to underestimate the implicit price of carbon:
- Biofuel blend-in;
- The European Union Emissions Trading System (EU ETS);
- EU regulation 2019/631 on CO2 emission standards for new passenger cars and LCVs;
- Discrepancy between type approval and on-the-road emissions per km;
- Life-time vehicle mileage;
- Parking fee exemptions and discounts.
In Norway as of 2019, motor vehicle fuel suppliers are required to sell a minimum share of biofuel. Suppliers comply with the mandate by blending a certain amount of biofuel into the fossil fuel sold. In 2019, the share was approximately 16 percent. To the extent that this biofuel share is deemed to be climate neutral, the total amount of greenhouse gas (GHG) emissions from road transportation is up to 16 percent lower than assumed in our calculations. This would make the real price per ton of CO2 up to 16 percent higher than the €1370, €640, and €200 estimated for passenger cars, LCVs and heavy-duty trucks, respectively.
Virtually all thermal plants generating power for BEVs are covered by the EU ETS. Thus, electrifying the vehicle fleet means moving the sources of emission into the cap-and-trade system, without simultaneously raising the cap. In principle, CO2 emissions are therefore reduced by the full amount of gasoline and diesel combustion avoided when an ICE vehicle is replaced by a BEV. Hence our calculations are based on the assumption that, on account of the EU ETS, the marginal GHG emission from driving a battery or fuel cell electric car is zero.
However, with the recent introduction into the EU ETS of a “market stability reserve” (MSR), the cap is no longer entirely exogenous, or fixed. From 2023 onwards, when the MSR exceeds a certain threshold, some surplus allowances will be permanently canceled [31,32]. This introduces uncertainty regarding the final GHG abatement effect of electric vehicles. Large-scale vehicle electrification in Europe will probably mean that fewer allowances will be banked and canceled. Hence the final, long-term GHG abatement effect of vehicle electrification will be smaller than the full amount of gasoline and diesel combustion avoided [33]. This, again, means that we underestimate the price per effective ton of CO2 avoided.
Norway is not an EU member. But since January 2019, EU regulation 2019/631 is incorporated in the EEA agreement, meaning that new vehicle sales in Norway do count toward the fulfilment of targets laid down for each automaker. The high shares of BEVs and PHEVs sold in Norway allow manufacturers to market fewer zero and low emission vehicles elsewhere in the EEA, without incurring higher penalties. Thus, on account of this overlapping EU regulation, the net effect of the zero and low emission vehicle incentives in Norway may be somewhat smaller, in terms of global or European GHG emissions, than recorded for Norway alone. A reduced CO2 abatement effect means a correspondingly higher price per ton of CO2 emissions avoided.
At least this might be true in the long term, if and when automakers succeed in bringing their average emission rates down to the specified goal. In the short term, i.e., for 2020 and 2021, such a scenario is less likely, since most automakers appear to be falling short of their targets, as judged by their performance during January through October 2020 [34]. These automakers will probably prefer to reduce their penalties rather than to ease up the reins on BEV and PHEV marketing in other EEA Member States than Norway.
Our assumption that on-the-road emissions exceed type approval (NEDC) laboratory measurements by 40 percent is probably on the high side. This figure, relying on Tietge et al. [17], is roughly representative of driving inside the European Union. Driving in Norway is slower, less congested, and probably more energy efficient than on EU highways and in EU cities. This, too, serves to overestimate the life-time amount of CO2 emissions from an ICE car in Norway and hence to underestimate the price per ton of CO2.
The same applies to our assumption regarding the mean life-time mileage of a passenger car: 260,000 km may be a bit on the high side. Hence the carbon price implicit in the purchase taxes—VAT and registration tax—may be somewhat understated.
The price of carbon implicit in parking fee exemptions and free recharging for BEVs has not been quantified in our summary Table 1. The amounts are unknown, but probably quite small.
5. Opportunities and Limits to Generalizability
In essence, the Norwegian electrification policy consists in taxing internal combustion engine (ICE) vehicles rather than subsidizing electric ones. In every EEA country except Denmark, introducing a Norwegian style set of fiscal incentives in place of the present automobile taxation and subsidization regime would probably bring massive amounts of new revenue into the public treasury [14]. Public finance constraints are, in other words, no argument against the Norwegian incentives. They could, in principle, be replicated by any country, rich or poor.
But the introduction of electric vehicles in Norway is facilitated by several circumstances not necessarily present in other countries [16]: cheap and abundant electricity, strong grids, (semi-)detached housing with garage or driveway, ample roadside space for fast charging facilities, slow roads, strong governance, and widespread tolling and ferrying.
The absence, in a given country, of all or some of these “drivers” is susceptible to delay the market uptake of BEVs and PHEVs. It would make the transition to electromobility slower, more controversial, and more challenging, but not impossible. Increasing economies of scale are expected to make BEV manufacturing steadily less expensive, and technological innovation is believed to gradually enhance the energy density of batteries, allowing for progressively higher range [35,36,37]. The battery electric cars being three to four times more energy efficient than conventional (ICE) vehicles, it is generally believed that the operating costs of BEVs will break even with those of ICE vehicles in a few years’ time, well before 2030, even without preferential tax treatment.
In the EEA countries, the transition to electromobility is helped by EU regulation 2019/631. As of January through October 2020, the combined BEV + PHEV market share had grown to 36 percent in Sweden, to 28 percent in the Netherlands and to 18 percent in Germany [34].
Of particular concern to policymakers considering fiscal instruments is the unpopular extra burden of taxation involved and its perceived impact on equity and fairness. But in most economies, introducing new, CO2-differentiated vehicle taxation would affect the low income groups less than the well-to-do population segments, especially if the vehicle purchase tax curve is made convex, in which case the buyers of large and powerful luxury cars would incur a disproportionately higher tax than those who can afford only smaller and leaner cars. Also, since low income citizens are strongly overrepresented among those not owning or using a car at all, these groups would, by and large, be less affected than the more affluent by stiff road, fuel or vehicle taxation. Finally, the equity effects of road, fuel and vehicle taxation could be further improved by smart redistribution schemes, e.g. by spending the added tax revenue to reduce VAT on comestibles, subsidize mass transit, or introduce tax relief in the lower income brackets [24,38]. Communicating the fairness and wisdom of vehicle taxation to the general public might, nevertheless, represent a challenge.
High vehicle registration taxes in any one country may tempt citizens to circumvent the tax by registering their vehicle abroad. To close this and other loopholes, strong governance may be needed. In Denmark and Norway, two countries with high and convex vehicle purchase tax rates [14], residents are not allowed to drive a foreign registered passenger car in their own country, except in a few special cases.
In small countries with extensive cross-border commuting and interaction, such restrictions may be viewed as impractical and at odds with the free flow of people, goods and services. In these cases, there is an obvious argument for internationally concerted fiscal governance.
In some countries, governance may not be strong enough to ensure fair and efficient taxation. In many less developed economies, this might constrain the feasibility of fiscal incentive schemes. But the equity argument is even stronger here than in the case of more developed economies: Poor families rarely own their own car, and taxing vehicles and fuel would not, in general, run counter to equity concerns.
In poorer countries, where transportation may still be far from fully motorized, the opportunity may exist to leapfrog ICE vehicle technology altogether [39], in a way similar to how modern mobile phones have made old-fashioned landline telephone infrastructure nearly redundant. At best, a parallel development may occur in the power sector, allowing solar panels to leapfrog grid infrastructure [40,41]. Certain synergies can perhaps be reaped, in terms of cost as well as GHG mitigation, if and when inexpensive photovoltaic technology replaces thermal plants, allowing private households to become energy “prosumers” [42,43,44], who recharge their vehicles by means of self-produced electricity in a decentralized, “green” power generation system.
The final GHG mitigation effect of vehicle electrification will depend on the source of power and on its regulation. For a maximum mitigation effect, electricity generation should either be fully decarbonized or cap-and-trade regulated in a way that minimizes carbon leakage.
CO2-differentiated road, fuel, and vehicle taxation is not only a financially sustainable way to ensure a high effective price of carbon. It also helps reduce other external costs of road use, such as congestion, noise, road wear, and ambient air pollution, simply because road use demand is reduced. But over time, some of these market correction effects—especially congestion relief—will be weakened as a result of the tax itself. As vehicle buyers respond to the high price of carbon, an increasing share of cars will become electrified and hence benefit from low energy costs and zero or low tax rates.
6. Policy Conclusions
A lot of studies exist on the “social cost of carbon” and on the normative question of an “optimal” charge on carbon emissions. Our perspective is different. In the tradition of positive economics, we ask how much economic agents actually pay for their CO2 emissions. How much tax expenditure could consumers and businesses avoid by choosing zero or low emission vehicles and transportation modes? How can this price be calculated? As our numerical example, we examine the fiscal policy instruments behind the record fast market uptake of electric vehicles in Norway.
It is a sobering and educational fact that the price of carbon facing Norwegian automobile owners and users exceeds €1370 per ton of CO2. For light and heavy-duty commercial vehicles, the corresponding prices have been conservatively estimated at €640 and €200 per ton of CO2. These carbon prices probably come a long way to explain the record fast market uptake of zero exhaust emission passenger cars in Norway, the slower penetration of electric LCVs, and the relative lack of innovation within the heavy-duty freight vehicle segment. Fiscal incentives work.
The high carbon prices in Norwegian road transportation result from the fact that virtually all taxes and subsidies bearing on road use, fuel consumption, or vehicle choice are CO2-differentiated. The most important of these are the one-off vehicle registration tax, the value added tax, the fuel tax, the annual car ownership tax, and the road toll.
Compared to the automobile taxation systems in force in all EEA countries except Denmark, the Norwegian fiscal recipe brings large amounts of revenue into the public treasury. It can, in principle, be replicated by almost any country, irrespective of national public finance constraints. In practice, certain circumstances favoring BEV ownership and use in Norway may not, or to a much smaller degree, be present elsewhere: cheap and abundant electricity, strong grids, (semi-)detached housing, ample space, slow roads, strong governance, and widespread ferrying and toll charges, of which BEVs might be exempted. The absence of several of these factors may constrain the effectiveness and applicability of the Norwegian fiscal incentives as an internationally enforceable strategy for sustainable transportation.
But the transition to electromobility will probably be helped by the impending economies of scale in BEV manufacturing, by the improving energy density of batteries, and—in the EEA—by EU regulation 2019/613. The “excess emissions premium” incurred by automakers not meeting their 2020/2021 target under this regulation corresponds to a carbon price of the order of €340 per ton of CO2. This penalty comes in addition to the carbon price paid by automobile owners and users through the road, fuel, and vehicle taxation system. To some extent the two policy instruments overlap, increasing the total abatement effect, but reducing the marginal effect of either instrument, thus yielding an even higher price per ton of CO2 avoided. As compared to the price of emission allowances in the European cap-and-trade system as of November 2020, the price of carbon paid by automakers and Norwegian motorists is one or two orders of magnitude higher.
An economically efficient strategy for sustainability would, in principle, impose the same price of carbon on all sectors and jurisdictions. But in the case where such a strategy be politically infeasible, certain sectors may have to endure higher than economically optimal carbon prices, in order for the GHG mitigation goals laid down in the Paris agreement and in the European Effort Sharing Regulation to be attainable.
Subsequent research might usefully examine a wider set of jurisdictions, allowing for more comprehensive and systematic comparisons between the motor vehicle taxation systems in force in different areas and countries. The implicit price of carbon is a relatively straightforward and effective metric for summarizing and comparing GHG mitigation strategies. Revealing and comparing the respective prices of carbon in various sectors and jurisdictions may provide valuable insights.
Funding
This research was funded by the Norwegian Public Roads Administration, by the Research Council of Norway (grants 280989 “Integrated Transport and Energy Modelling”, 267942 “Driving Towards the Low-Emission Society”, and 295789 “PLATON–a Platform for Open and Nationally Accessible Climate Policy”), and by the Institute of Transport Economics (TØI Project S-4330).
Informed Consent Statement
Not applicable.
Data Availability Statement
The data used in this study are openly available in various publications and websites, as indicated in the reference list.
Acknowledgments
Thanks are due to Paal Brevik Wangsness for stimulating discussions and professional advice, and to the editor and three anonymous reviewers for their helpful comments and suggestions.
Conflicts of Interest
The author declares no conflict of interest. The funders had no role in the design of the study; in the collection, analyses, or interpretation of data; in the writing of the manuscript, or in the decision to publish the results.
References
- World Commission on Environment and Development. Our Common Future; Oxford University Press: Oxford, UK, 1987. [Google Scholar]
- United Nations. Adoption of the Paris Agreement. Framework Convention on Climate Change; FCCC/CP/2015/L.9/Rev.1; UN: Paris, France, 2015. [Google Scholar]
- Stern, N. The Economics of Climate Change. The Stern Review; Cambridge University Press: Cambridge, UK, 2007. [Google Scholar]
- Stavins, R.N. The future of US carbon-pricing policy. Environ. Energy Policy Econ. 2020, 1, 8–64. [Google Scholar] [CrossRef]
- Ellerman, A.D.; Buchner, B.K. The European Union Emissions Trading Scheme: Origins, allocation, and early results. Rev. Environ. Econ. Policy 2020, 1, 66–87. [Google Scholar] [CrossRef]
- European Union. Regulation (EU) 2018/842 of the European Parliament and of the Council of 30 May 2018 on binding annual greenhouse gas emission reductions by Member States from 2021 to 2030 contributing to climate action to meet commitments under the Paris Agreement and amending Regulation (EU) No 525/2013. Off. J. Eur. Un. L 2018, 156, 26–42. [Google Scholar]
- Eurostat. Greenhouse Gas Emission Statistics–Emission Inventories. Available online: https://ec.europa.eu/eurostat/statistics-explained/pdfscache/1180.pdf (accessed on 30 November 2020).
- Sperling, D.; Gordon, D. Two Billion Cars. Driving Toward Sustainability; Oxford University Press: Oxford, UK, 2009. [Google Scholar]
- European Union. Regulation (EU) 2019/631 of the European Parliament and of the Council of 17 April 2019 setting CO2 emission performance standards for new passenger cars and for new light commercial vehicles, and repealing regulations (EC) No 443/2009 and (EU) No 510/2011. Off. J. Eur. Un. L 2019, 111, 13–53. [Google Scholar]
- Dineen, D.; Ryan, L.B.; Ó Gallachóir, B. Vehicle tax policies and new passenger car CO2 performance in EU member states. Clim. Policy 2018, 18, 396–412. [Google Scholar] [CrossRef]
- Hauff, K.; Pfahl, S.; Degenkolb, R. Taxation of electric vehicles in Europe: A methodology for comparison. World Electr. Veh. J. 2018, 9, 30. [Google Scholar] [CrossRef] [Green Version]
- Wappelhorst, S.; Mock, P.; Yang, Z. Using Vehicle Taxation Policy to Lower Transport Emissions. An Overview for Passenger Cars in Europe; International Council on Clean Transportation: Berlin, Germany, 2018. [Google Scholar]
- D’Haultfoeuille, X.; Givord, P.; Boutin, X. The environmental effect of green taxation: The case of the French bonus/malus. Econ. J. 2013, 124, F444–F480. [Google Scholar] [CrossRef] [Green Version]
- Østli, V.; Fridstrøm, L.; Kristensen, N.B.; Lindberg, G. Comparing the Scandinavian automobile taxation systems and their CO2 mitigation effects. Int. J. Sustain. Transp. 2021. submitted. [Google Scholar]
- Tietge, U.; Mock, P.; Dornoff, J. CO2 Emissions from New Passenger Cars in Europe: Car Manufacturers’ Performance in 2019; International Council on Clean Transportation: Berlin, Germany, 2020. [Google Scholar]
- Fridstrøm, L.; Østli, V. Direct and cross price elasticities of demand for gasoline, diesel, hybrid and battery electric cars: The case of Norway. Eur. Transp. Res. Rev. 2021, 13, 3. [Google Scholar] [CrossRef]
- Tietge, U.; Díaz, S.; Mock, P.; Bandivadekar, A.; Dornoff, J.; Ligterink, N. From laboratory to road. A 2018 Update of Official and “Real-Word” Fuel Consumption and CO2 Values for Passenger Cars in Europe; International Council on Clean Transportation: Berlin, Germany, 2019. [Google Scholar]
- Rogelj, J.; Shindell, D.; Jiang, K.; Fifita, S.; Forster, P.; Ginzburg, V.; Handa, C.; Kheshgi, H.; Kobayashi, S.; Kriegler, E.; et al. Mitigation pathways compatible with 1.5 °C in the context of sustainable development. In Global Warming of 1.5°C. An IPCC Special Report on the Impacts of Global Warming of 1.5°C above Pre-Industrial Levels and Related Global Greenhouse Gas Emission Pathways. The Context of Strengthening the Global Response to the Threat of Climate Change, Sustainable Development, and Efforts to Eradicate Poverty; Masson-Delmotte, V., Zhai, P., Pörtner, H.-O., Roberts, D., Skea, J., Shukla, P.R., Pirani, A., Moufouma-Okia, W., Péan, C., Pidcock, R., et al., Eds.; United Nations’ Intergovernmental Panel on Climate Change: New York, NY, USA, 2018. [Google Scholar]
- Nordhaus, W.D. Revisiting the social cost of carbon. Proc. Natl. Acad. Sci. USA 2017, 114, 1518–1523. [Google Scholar] [CrossRef] [Green Version]
- OECD. Effective Carbon Rates. Pricing CO2 through Taxes and Emissions Trading Systems; OECD Publishing: Paris, France, 2016. [Google Scholar]
- ICCT. European Vehicle Market Statistics; Pocketbook 2019/20; International Council on Clean Transportation: Berlin, Germany, 2020. [Google Scholar]
- Norway. Avgiftssatser 2019. Available online: https://www.regjeringen.no/no/tema/okonomi-og-budsjett/skatter-og-avgifter/avgiftssatser-2019/id2614443/ (accessed on 8 December 2020).
- Fridstrøm, L.; Østli, V. Etterspørselen Etter nye Personbiler Analysert ved Hjelp av Modellen BIG; TØI Report 1665/2018; Institute of Transport Economics: Oslo, Norway, 2018. [Google Scholar]
- Steinsland, C.; Østli, V.; Fridstrøm, L. Equity Effects of Automobile Taxation; TØI Report 1463/2016; Institute of Transport Economics: Oslo, Norway, 2016. [Google Scholar]
- Yan, S.; Eskeland, G.S. Greening the vehicle fleet: Norway’s CO2-differentiated registration tax. J. Environ. Econ. Manag. 2018, 91, 247–262. [Google Scholar] [CrossRef]
- Fridstrøm, L. Dagens og Morgendagens Bilavgifter; TØI Report 1708/2019; Institute of Transport Economics: Oslo, Norway, 2019. [Google Scholar]
- Norwegian Ministry of Finance. Midterm Review Zero Rate VAT for Electric Vehicles. Appendix A: Price Data for New Passenger Cars. 2020. Oslo: Ministry of Finance. Available online: https://www.regjeringen.no/contentassets/8d7fb046f10d4890ad09dba061c143a1/appendix_a_price_data_new_passenger_cars.pdf (accessed on 8 December 2020).
- Norwegian Ministry of Finance. Notification of Zero Rate VAT for Electric Vehicles. Letter to the EFTA Surveillance Authority, 10 November 2020. Available online: https://www.regjeringen.no/contentassets/4caf291e88db48f4a5ff61865521608b/notification-of-zero-rate-vat-for-electric-vehicles.pdf (accessed on 8 December 2020).
- Norway. Car Rates–Company Cars. Available online: https://www.skatteetaten.no/en/rates/car-rates---company-cars/?year=2019 (accessed on 8 December 2020).
- Enova. Annual Report 2019. Trondheim: Enova SF. Available online: file:///C:/Users/lef/AppData/Local/Temp/CE63635DD03C4B04A84297FBE8C62DF4.pdf (accessed on 8 December 2020).
- Perino, G. New EU ETS Phase 4 rules temporarily puncture waterbed. Nat. Clim. Chang. 2018, 8, 260–271. [Google Scholar] [CrossRef]
- Rosendahl, K.E. EU ETS and the waterbed effect. Nat. Clim. Chang. 2019, 9, 734–735. [Google Scholar] [CrossRef]
- Fridstrøm, L. Who will bell the cat? On the environmental and sustainability risks of electric vehicles: A comment. Transp. Res. Part A 2020, 135, 354–357. [Google Scholar] [CrossRef]
- Mock, P.; Tietge, U.; Wappelhorst, S.; Bieker, G.; Dornoff, J. Market Monitor: European Passenger Car Registrations, January–October 2020. Berlin: International Council on Clean Transportation. Available online: https://theicct.org/sites/default/files/publications/MarketMonitor-EU-nov2020.pdf (accessed on 8 December 2020).
- Nykvist, B.; Nilsson, M. Rapidly falling costs of battery packs for electric vehicles. Nat. Clim. Chang. 2015, 5, 329–332. [Google Scholar] [CrossRef]
- Un-Noor, F.; Padmanaban, S.; Mihet-Popa, L.; Mollah, N.M.; Hossain, E. A comprehensive study of key electric vehicle (EV) components, technologies, challenges, impacts, and future direction of development. Energies 2017, 10, 1217. [Google Scholar] [CrossRef] [Green Version]
- Harvey, L.D.D. Cost and energy performance of advanced light duty vehicles: Implications for standards and subsidies. Energy Policy 2018, 114, 1–12. [Google Scholar] [CrossRef]
- Fridstrøm, L.; Minken, H.; Moilanen, P.; Shepherd, S.; Vold, A. Economic and Equity Effects of Marginal Cost Pricing in Transport. Case Studies from Three European Cities; VATT Research Reports 71, 2000; Government Institute for Economic Research: Helsinki, Finland, 2000. [Google Scholar]
- Wang, H.; Kimble, C. Leapfrogging to electric vehicles: Patterns and scenarios for China’s automobile industry. Int. J. Automot. Technol. Manag. 2011, 11, 312–325. [Google Scholar] [CrossRef]
- Zhang, F. Can solar panels leapfrog power grids? The World Bank experience 1992–2009. Renew. Sustain. Energy Rev. 2014, 38, 811–820. [Google Scholar] [CrossRef]
- Levin, T.; Thomas, V.M. Can developing countries leapfrog the centralized electrification paradigm? Energy Sustain. Dev. 2016, 31, 97–107. [Google Scholar] [CrossRef] [Green Version]
- Kotler, P. The prosumer movement: A new challenge for marketers. Adv. Consum. Res. 1986, 13, 510–513. [Google Scholar]
- Schill, W.-P.; Zerrahn, A.; Kunz, F. Prosumage of solar electricity: Pros, cons, and the system perspective. Econ. Energy Environ. Policy 2017, 6, 7–31. [Google Scholar] [CrossRef] [Green Version]
- Green, R.; Staffell, I. “Prosumage” and the British electricity market. Econ. Energy Environ. Policy 2017, 6, 33–49. [Google Scholar] [CrossRef]
Figure 1.
Energy technology market shares for new passenger cars in the European Economic Area 2019, by country. BEV = battery electric vehicle; PHEV = plug-in hybrid electric vehicle; HEV = ordinary hybrid electric vehicle; ICE = internal combustion engine. Data source: [15].
Figure 1.
Energy technology market shares for new passenger cars in the European Economic Area 2019, by country. BEV = battery electric vehicle; PHEV = plug-in hybrid electric vehicle; HEV = ordinary hybrid electric vehicle; ICE = internal combustion engine. Data source: [15].

Figure 2.
New passenger cars registered in Norway 1992–2020, by energy technology. Source: [16].
Figure 2.
New passenger cars registered in Norway 1992–2020, by energy technology. Source: [16].


Figure 4.
Norwegian automobile registration tax 2019, in Norwegian kroner (NOK) per vehicle, as a function of curb weight and type approval CO2 and NOX emission rates. As of July 1, 2019, €1 = NOK 9.70. Source: [26].
Figure 4.
Norwegian automobile registration tax 2019, in Norwegian kroner (NOK) per vehicle, as a function of curb weight and type approval CO2 and NOX emission rates. As of July 1, 2019, €1 = NOK 9.70. Source: [26].

Figure 5.
Estimated responses to hypothetical changes in the Norwegian automobile taxation system, in terms of mean type approval rate of CO2 emissions for new passenger cars as of 2016. Source: [23].
Figure 5.
Estimated responses to hypothetical changes in the Norwegian automobile taxation system, in terms of mean type approval rate of CO2 emissions for new passenger cars as of 2016. Source: [23].


Table 1.
Calculated components of the price of carbon facing Norwegian motorists. Euros per ton of CO2 as of 2019.
Table 1.
Calculated components of the price of carbon facing Norwegian motorists. Euros per ton of CO2 as of 2019.
| Passenger Cars | LCVs | Heavy-Duty Trucks | |
|---|---|---|---|
| Fuel tax | >200 | 200 | 200 |
| Registration tax: CO2 component | >400 | 100 | 0 |
| Registration tax: weight component | 180 | 50 | 0 |
| VAT exemption for ZEVs * | 200 | ≈0 | 0 |
| Ownership tax * | 140 | 100 | ≈0 |
| Toll * | 200 | 150 | >0 |
| Ferry fares * | 10 | >0 | >0 |
| Income tax on company car use * | [0, 1000] | ≈0 | 0 |
| Reregistration tax * | 40 | 10 | 0 |
| Government subsidies * | ≈0 | >30 | ≈0 |
| Sum | >1370 | >640 | >200 |
* Irrelevant for comparison between different ICE vehicles.
Publisher’s Note: MDPI stays neutral with regard to jurisdictional claims in published maps and institutional affiliations. |
© 2021 by the author. Licensee MDPI, Basel, Switzerland. This article is an open access article distributed under the terms and conditions of the Creative Commons Attribution (CC BY) license (http://creativecommons.org/licenses/by/4.0/).
Share and Cite
MDPI and ACS Style
Fridstrøm, L. The Norwegian Vehicle Electrification Policy and Its Implicit Price of Carbon. Sustainability 2021, 13, 1346. https://doi.org/10.3390/su13031346
AMA Style
Fridstrøm L. The Norwegian Vehicle Electrification Policy and Its Implicit Price of Carbon. Sustainability. 2021; 13(3):1346. https://doi.org/10.3390/su13031346
Chicago/Turabian StyleFridstrøm, Lasse. 2021. "The Norwegian Vehicle Electrification Policy and Its Implicit Price of Carbon" Sustainability 13, no. 3: 1346. https://doi.org/10.3390/su13031346
Note that from the first issue of 2016, this journal uses article numbers instead of page numbers. See further details here.