
Microplastics in Surface Waters and Sediments from Guangdong Coastal Areas, South China
by
 ,
,
Yizheng Li
1, 
Yindan Zhang
1,
Guanglong Chen
1,
Kaihang Xu
1,
Han Gong
1,
Kai Huang
2,*,
Muting Yan
1,* and
Jun Wang
1,2,3,* 1
Joint Laboratory of Guangdong Province and Hong Kong Region on Marine Bioresource Conservation and Exploitation, College of Marine Sciences, South China Agricultural Universtiy, Guangzhou 510641, China
2
National Engineering Research Center for Non-Food Biorefinery, Guangxi Key Laboratory of Bio-Refinery, Guangxi Academy of Sciences, 98 Daling Road, Nanning 530007, China
3
Guangdong Laboratory for Lingnan Modern Agriculture, South China Agricultural University, Guangzhou 510642, China
*
Authors to whom correspondence should be addressed.
Sustainability 2021, 13(5), 2691; https://doi.org/10.3390/su13052691
Submission received: 4 January 2021
/
Revised: 22 February 2021
/
Accepted: 22 February 2021
/
Published: 2 March 2021
Abstract
:Microplastic is an emerging global pollutant that have attracted a great deal of attention from researchers and the public. Guangdong Province has a large population and a relatively well-developed economy, but lacks a modern pollution control system. Guangdong has a long coastline with varying levels of pollution, and little research has been conducted on microplastics. Therefore, we investigated the level of microplastic pollution in coastal areas of Guangdong Province, and the abundance of microplastics in surface waters and sediments at 13 sampling sites. The abundance of microplastics in surface water and sediment samples ranged from 850 to 3500 items/L and 433.3 to 4166.3 items/kg, respectively. Fiber is the main type of microplastics in both surface water and sediment. The sampled microplastics were typically transparent. Raman results show that the surface water sample mainly includes rayon (38.2%), polyethylene terephthalate (16.4%), and ethylene/vinyl acetate copolymer (12.7%). This study used the pollution load index method to evaluate the pollution risk of microplastics along the coast of Guangdong, and provided the basis for the formulation of environmental policy.

1. Introduction
Plastics have been produced on a large scale and used widely since the early 1950s. Due to their malleability, low cost, and resistance to water and light, plastics can be molded to create a wide range of products of different sizes and shapes [1]. After World War II, the production of plastics surpassed that of all the other synthetic material [2], and plastic products became necessities for daily life. As the majority of plastic products are designed for single use, global solid waste production also increased rapidly (>10-fold from 1960 to 2005) in both developing and developed countries. The most common plastics, such as polypropylene, are difficult to degrade in the environment, not only because of their high molecular weight, hydrophobicity, and high surface roughness, but also because some of their additives are aimed at stabilizing the polymers [3,4].
Microplastic (MP) is defined as an organic synthetic polymer with a particle size of less than 5 mm [5,6,7,8], and MPs pollution has been considered an important emerging environmental problem in recent years due to its pervasiveness and persistence [9]. Such particles are already highly prevalent in freshwater [2,10,11], terrestrial [2,12,13] or marine environments [14], and atmospheric fallout [15]. In addition, a large number of studies have investigated microplastics in bottled water [16], and found that it tends to contain higher levels of microplastics than tap water [17], although the latter has been the subject of a limited number of studies. Global plastic production in 2016 exceeded 330 million tons [18]. The data analysis shows that about 2 million tons of plastic enter the marine environment every year [19]. Microplastic particles are carriers of harmful substances including pathogenic bacteria and potential invasive species [20], their small size enables them to spread from one marine environment to another [21]; they can also be ingested by a wide range of organisms [22,23] and release toxic chemicals used as additives during the production process [24], which may cause oxidative stress, endocrine disorders, impaired reproductive function [25,26,27], neurotoxic effects [28,29,30], and other harmful physiological effects.
MPs arise from two main sources. Primary MPs, which are manufactured at the MP scale, are typically found in personal care products and enter water bodies in the course of human use [31]. Secondary MPs are MP fragments originating from the degradation of larger plastic fragments, both in the ocean and on land [32,33]. Fragmentation occurs when physical, chemical, and biological processes damage the structural integrity of plastic fragments [34]. The small size of MPs complicates cleanup and recycling efforts [35]. Due to natural forces such as wind and ocean currents, MPs migrate and spread throughout the ocean, which inevitably leads to increasing MP levels in the environment over time [35].
Guangdong Province is located in the southernmost part of mainland China with a population of more than 110 million. Since 1994, Guangdong Province has output the most plastic products nationally. Guangzhou, the capital city of Guangdong Province, is a hotspot of marine microplastics pollution due to its large coastal population and lack of a modern waste management system [36]. In 2015, Guangzhou produced more than 1.6 billion tons of wastewater [37], from which MPs were released into the Pearl River through sewage discharge, runoff, and industrial wastewater [38]. The amount of plastic waste discharged annually from the Pearl River into the South China Sea is estimated to be about 136,000 tons [18].
In this study, we investigated the abundance, shape, and size of MPs along the Guangdong coast of southern China. Although studies have been conducted to investigate MP pollution along the coast of Guangdong, in many places, especially densely populated areas [36,38], information on MP pollution is still lacking. This study aims to fill this knowledge gap by investigating microplastic abundance in surface waters and sediments, and thus elucidate the pollution status of MPs the Guangdong coast. In addition, although some studies have been conducted to assess the risk of MPs in Shanghai [39], Guangdong, China’s largest economic province and a populous province, still lacks such information. Based on the risk assessment model, this paper discusses the risk of MPs pollution in the surface water, which helps the environmental management department to understand and predict the ecological influencing factors and possible ecological consequences, thus providing the basis for environmental decision-making in various regions.
2. Materials and Methods
2.1. Description of the Study Area
2.2. Water and Sediment Sampling
All containers were rinsed with ultrapure water prior to sampling. A 5-L stainless-steel water sampler was used to collect the water samples at a depth of about 45 cm [41], a total of 60 L of water was collected at each sampling site, and three duplicate samples were required. After filtering the water sample through a 48-μm steel sieve [42], residue on the filter was flushed with deionized water into a 100-mL glass bottle. In addition, 1 kg of sediment was randomly collected with a stainless steel shovel from a random 1 × 1 m quadrat (upper 5 cm) at every sampling site. The sediment was then placed in an aluminum foil bag and preserved at 4 °C [43].
2.3. Sample Pre-Treatment
Prior to laboratory treatment, 15 mL of 30% hydrogen peroxide solution was added to the water samples to digest organic material [44,45]. The samples were stored away from light for 24 h. The water samples were filtered through 0.45-μm microporous filter membranes to collect all suspected MP particles. During this process, no plastic products should be used and the walls of containers should be moistened with ultra-pure water to ensure that no particles remain. Blank test was performed to prevent ambient pollution. Ultrapure water (200 mL) was processed according to the steps described above, and the number of microplastics in the blank water sample was 0.8 ± 0.4 items per filter membrane, which indicated that the MP pollution can be neglected during the experiment. From each sampling point, 1 kg of sediment was collected and dried at 60 °C for 48–72 h. After drying, three 30 g sediment samples were collected at each sampling site as replicates and then suspended in 80 mL ZnCl2 solution (1.58 g/cm3). After stirring well, the mixture was transferred to a 120 mL funnel device and left for 24 h. The supernatant was transferred to a beaker until there was no matter floating in the supernatant. An appropriate amount of 30% hydrogen peroxide was added to the supernatant. The supernatant was stored away from light for 24 h and then filtered through a 0.45-μm microporous filter membrane to collect all suspected MP particles.
2.4. Microscopic Inspection and Identification
Petri dishes containing the microporous filter membranes were observed under a stereomicroscope. In this study, fiber, pellet, foam, and fragment were the four major MP categories, based on morphology [35,44]. The physical characteristics of microplastics should be known before visual observation. MPs are considered to be particles with uniform shape and color, which are not easily damaged by tweezers and do not contain cells or tissue structures [46]. In addition to calculating the number of MPs on each filter, the color, size, and morphology of each suspected MP were recorded during visual examination [47].
Raman spectroscopy (Thermo Fisher Scientific DXR2, 532 nm laser, Raman shift 50–3500 cm−1) and micro-Fourier transformed infrared spectroscopy (μ-FTIR) (Nicolet iN10, Thermo Fisher Scientific, Waltham, MA, USA) were used to identify the polymer components. The excitation power of Raman spectroscopy was 10 mW, the exposure time was 0.01 s; and the infrared spectrum in the range of 4000–400 cm−1 was collected when the suspected MPs were identified by μ-FTIR.
2.5. Statistical Analysis
SPSS software (ver. 25.0; SPSS Inc., Chicago, IL, USA) was used to analyze the data. One-way analysis of variance (ANOVA) and the Kruskal–Wallis test were used to compare the samples. Pearson correlation analysis was used to test the correlation between MP abundance in sediments and surface waters. Descriptive data (maximum, mean, and standard deviation values) were also obtained regarding the abundance of MPs in water and sediment samples.
3. Results and Discussion
3.1. Abundance and Distribution of MPs
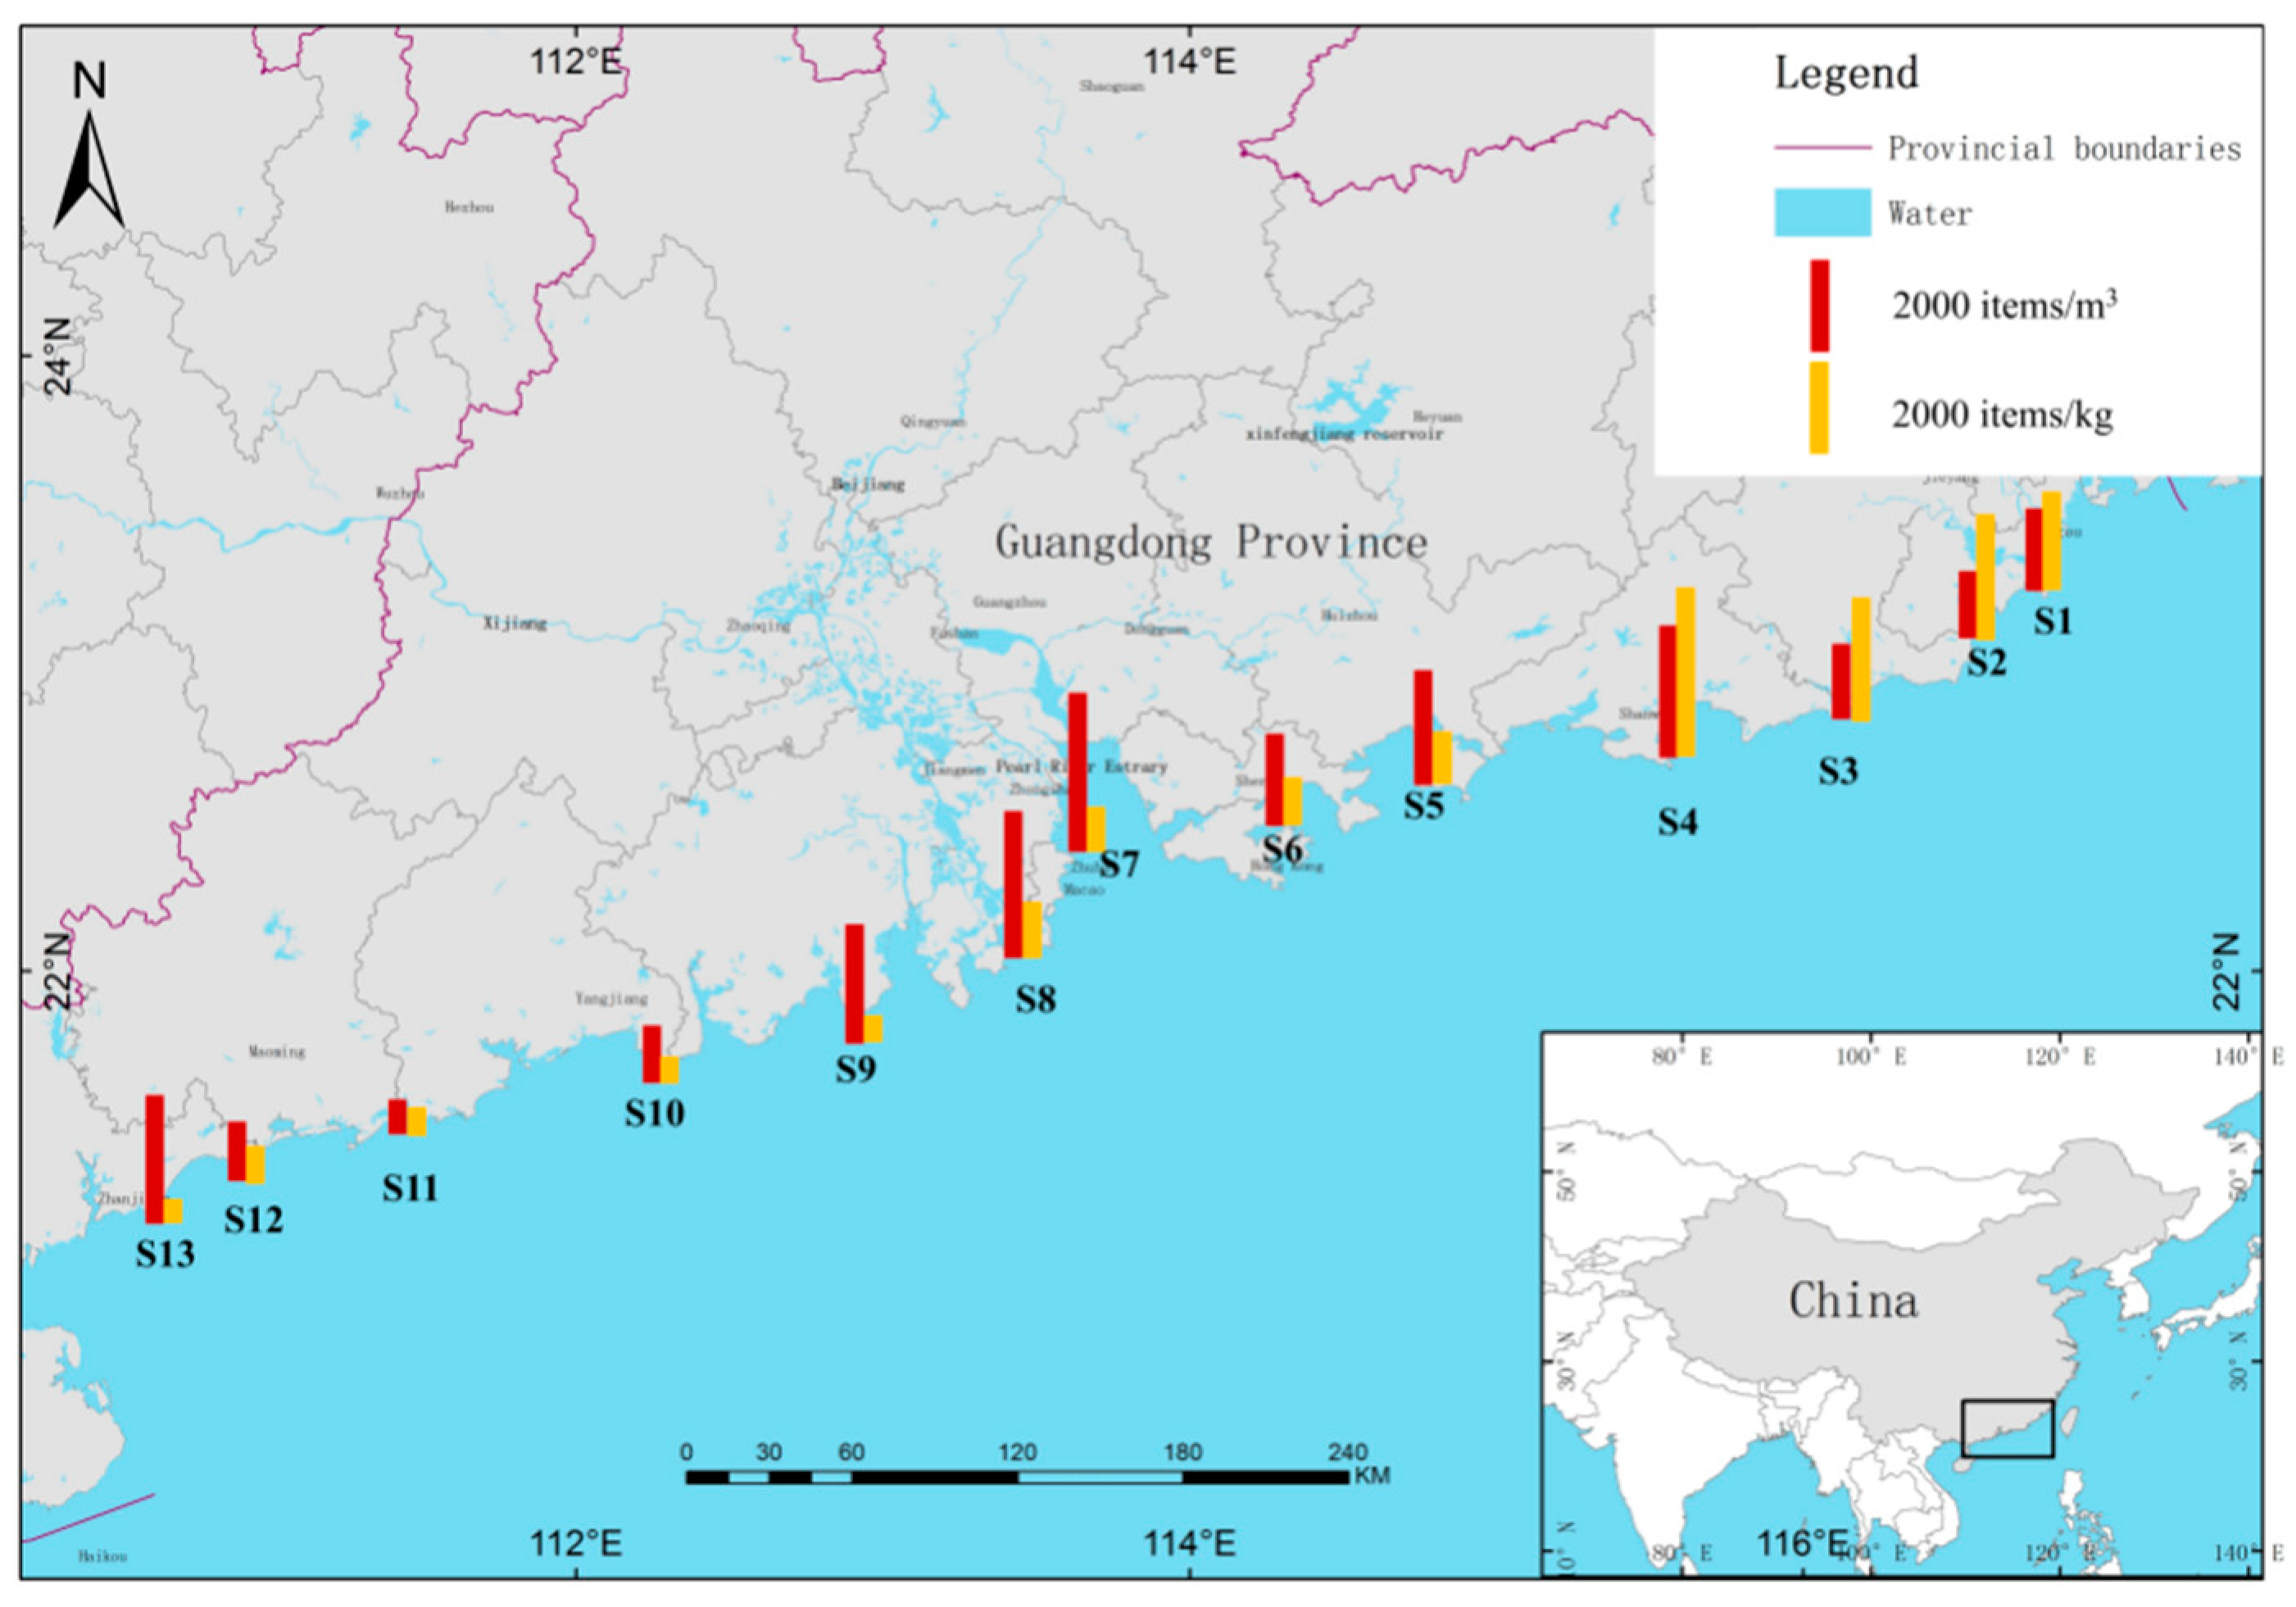
MPs were found in surface water samples collected from all of the sampling sites along the coast of Guangdong. The research results show that the abundance of MPs in surface water samples ranged from 850 to 3500 items/m3 (mean abundance = 2185 ± 833 items/m3) (Figure S1). Because of the different methodologies adopted, it is difficult to compare the results of different studies directly. However, in order to further clarify the level of microplastic pollution in the coastal areas of Guangdong, it is necessary to compare the results with other studies (Table 1). These concentrations were higher than those reported in previous studies conducted in Aegean-Levantine Sea [48]; Bohai Bay, China [49]; Western Mediterranean Sea [50,51]; and the Bay of Brest, France [52]. The MP concentrations reported here are of the same order of magnitude as those reported in previous studies of microplastic pollution levels in coastal areas of Guangdong [36] and the Pearl River in Guangzhou [38], indicating that the microplastic pollution level in Guangdong is largely consistent among sampling sites.
In our sediment samples, the MP abundance ranged from 433 to 4166 items/kg (mean = 1444 ± 28 items/kg dry weight) (Figure S1). These concentrations are higher than those in Bohai Sea, Yellow Sea [46]; western Pacific Ocean [53] and along North African coasts of the Mediterranean Sea [54], but much lower than in the North Shore Channel, Chicago, IL, USA [55] (Table 1). The MP abundance in our sediments samples is of the same order of magnitude as that in the Pearl River [38].
According to a 2020 study, the relative abundances of MPs and local sources of pollution are closely linked [56]. The use of different methodologies makes it difficult to compare results among studies [49]. However, such comparisons would shed further light on MP pollution along the coast of Guangdong. MP abundances in water and sediment samples differed among regions. In our water samples, based on observations and counting, the maximum MP abundance was found in the S7–S8 region, while the minimum occurred in the S10–S12 region. No obvious spatial distribution pattern was apparent along the coastline. There are two possible reasons for the high concentration of MPs in the S7–S8 region: (1) Zhuhai is adjacent to industrialized region like Hong Kong, Shenzhen, and Macau to the south, and is located in the central Pearl River Delta region; and (2) the population around the sampling area is large, such that human activity is high, and domestic sewage is discharged directly into the sea. No significant difference in MP abundance was found among the sampling sites (Kruskal–Wallis test, p > 0.05), where MPs distributed in surface waters tend to be of low density and easily disperse in the water. At the same time, the source of MPs, the characteristics of MPs, and flow rate are also potential inducements [57]. Among the sediment samples collected from different sampling sites, however, the concentrations of MPs differed significantly (Kruskal–Wallis test, p < 0.01).
The site with the highest MP abundance was S4, while S13 and S9 had the lowest MP abundances. The high abundance of MPs in sediment samples collected from S4 may be attributed to the large number of factories in the area, including textile mills; industrial pollution at this site, which lacks pollution prevention measures, is serious; moreover, there are several sewage treatment plants near the sampling site, whose effluents carry MPs into nearby bodies of water. Based on these results, the main causes of MP pollution in coastal areas of Guangdong are human activities and industrial pollution. In the areas with point source pollution, such as S4, there are more sewage treatment plants, which will cause serious microplastic pollution in the area. There are agricultural planting bases in S3, and the use of agricultural plastic products will also cause microplastic pollution to a certain extent. The sediment samples of S7 and S8 do not show high MPs abundance, which may be due to the fact that there are many tributaries in the Pearl River Estuary, indicating that tributaries play an important role in transporting MPs to the main stream. The confluence of tributaries and main streams produces complex flow patterns and large-scale turbulent structures, thus agitating deposited MPs in sediments, resulting in high MPs abundance in surface water. In other areas, such as S3 and S4, the fluid movement is relatively weak, and the settlement process of MPs is less affected.
Pearson correlation analysis showed no significant correlation between MP abundance in surface water and sediment samples. This result is consistent with the findings of Yuan et al. [58], and may be attributed to a variety of factors, such as water wave, water quality (organisms and pollutants in water, such as bacteria, microorganisms, plankton, benthos, heavy metals, antibiotics, etc.) and the properties of MPs.
3.2. Microplastic Size and Morphology
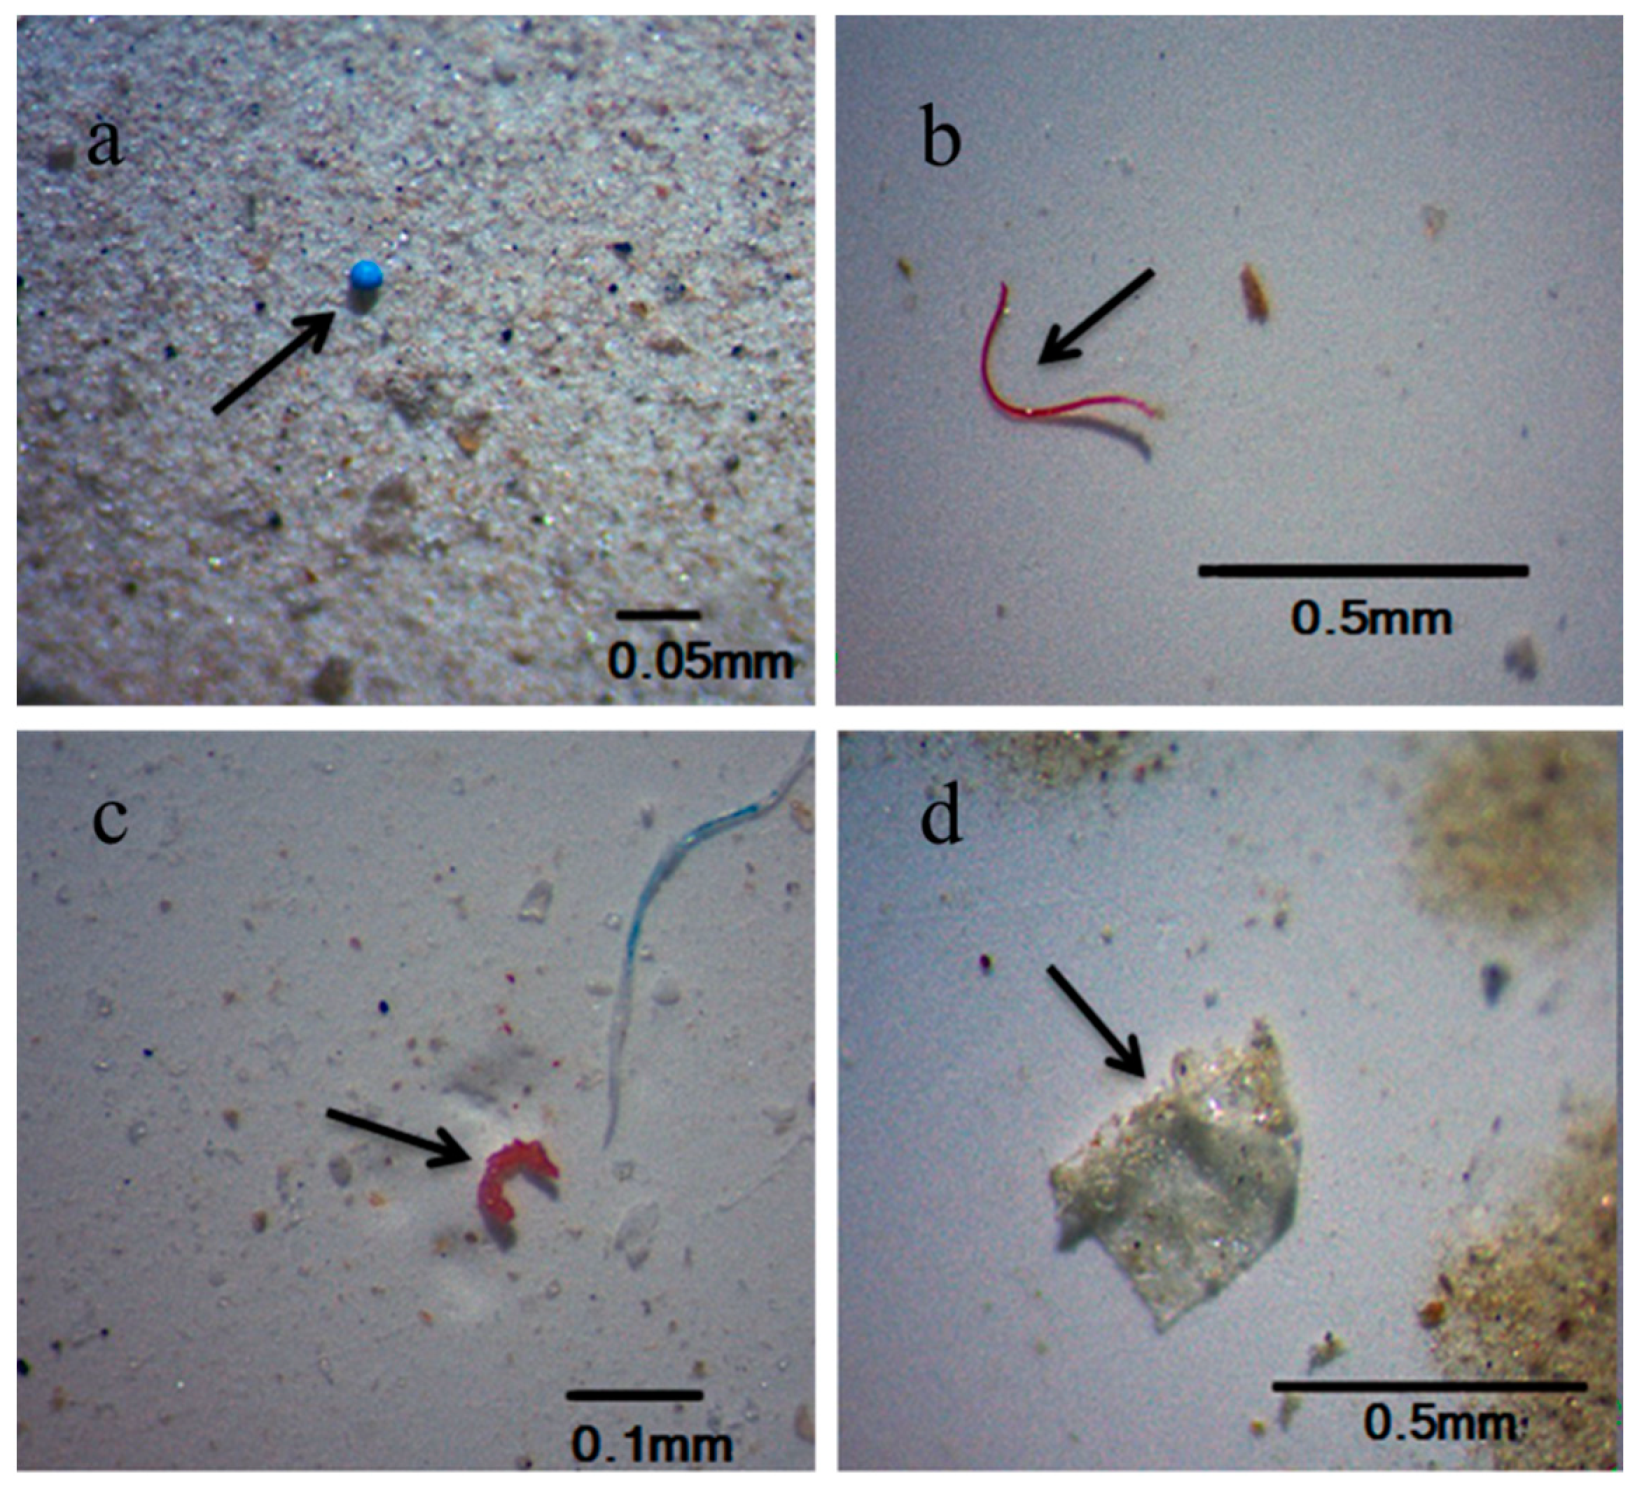
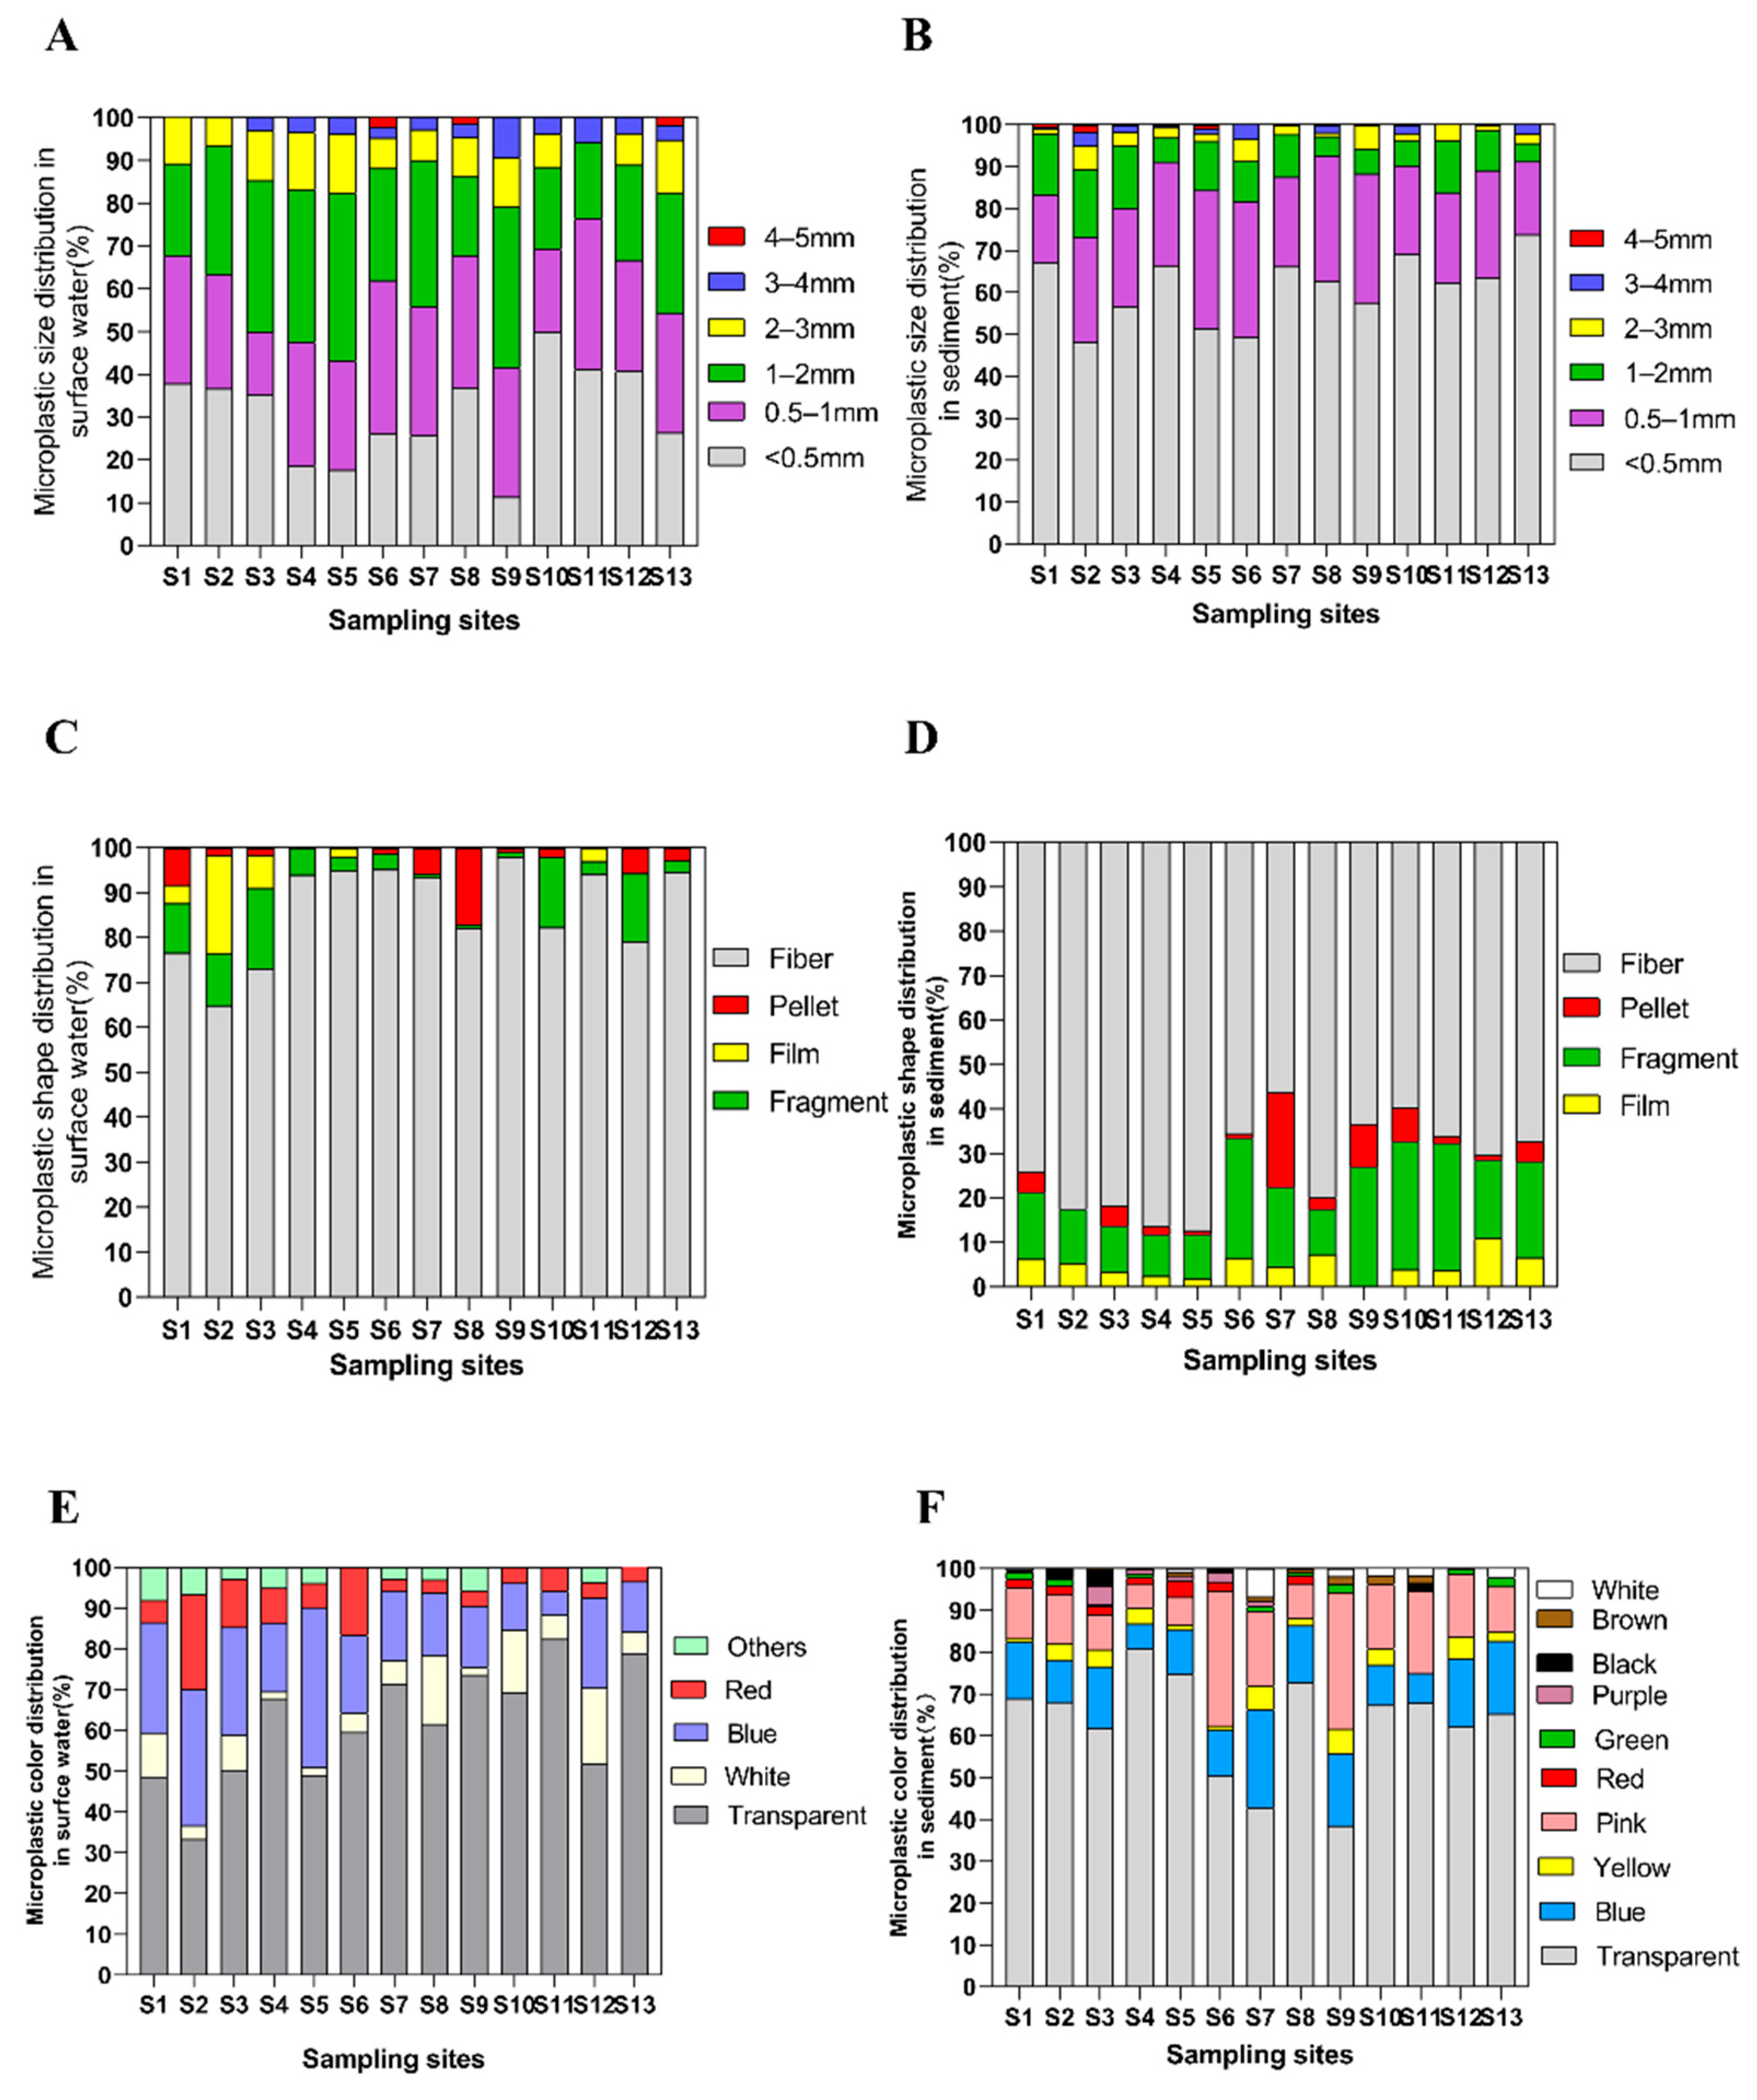
Stereomicroscopes were used to observe microplastics in the water and sediment samples, and MPs were classified based on type, color, and size. In this study, fiber, pellet, foam, and fragment were the four major microplastic categories (Figure 2). The results showed that fiber and fragments were the most abundant types of plastic in the samples, followed by pellets and films. The results showed that fibers dominated the surface water and sediments (Figure 3C), accounting for 89.3% and 77.3% of all microplastics, respectively; followed by fragments, with only minor contributions from pellets and films (consistent with the results of Dai et al.) [59]. In water samples, the abundance of fibers was significantly higher than that of fragments (ANOVA, F = 56.147, p < 0.01) and pellets (ANOVA, F = 56.941, p < 0.01). Fishery activities, maritime transport, discharge of domestic sewage, textile manufacturing, surface runoff, and shipping are all potential sources of fibers [35,60,61,62].
Besides, more fibers were also found in sediment samples, (77.28%) (Figure 3D). This result is consistent with the findings of several previous studies [42,63]. The difference is that compared with the surface water samples, sediment samples contain a large amount of fragments which may be due to the small surface-volume ratio of the fragments, which allows them to sink and be deposited on the bottom [64]. Fok et al. suggested that beaches are an important source of plastic debris in the ocean, from which originally large pieces of stranded plastic enter the ocean in the form of smaller pieces after a long weathering process [36]. In our sediment samples, the abundance of fibers differed significantly from those of films (ANOVA, F = 16.990, p < 0.01) and fragments (ANOVA, F = 12.56, p < 0.01). The small number of microbeads observed in this study may be due to the fact that microbeads can be removed directly from sewage treatment plants [65,66].
The MPs observed by stereomicroscopy could be classified into six size categories: <0.5 mm, 0.5–1 mm, 1–2 mm, 2–3 mm, 3–4 mm, and 4–5 mm. Both water and sediment samples were found to contain more smaller-sized MPs (<2 mm) (Figure 3A,B), consistent with the findings of Wu et al. [49] and Di [67]. The high abundance of smaller MPs in the survey area may be due to larger MPs splitting into small particles [68,69]. When the abundances of the four types of MPs were analyzed according to size class, most microplastics were in the smallest class and the distribution of size range against abundance was not elliptical, indicating the lack of a linear trend.
The color of MPs in water and sediment samples was identified through visual observation; transparent microplastics were a major component of all samples. The MPs in water samples were mainly transparent (62.5%) or blue (20.07%) (Figure 3E); in contrast, transparent, pink, yellow, and blue microplastics were present in sediment samples (Figure 3F), with transparent MPs accounting for 66.86% of the total. These results are consistent with the findings of Di et al. [67]. Yellow MPs are highly degraded products [70], and their low abundance in this study indicates that the degradation of plastic waste in the region is not obvious, and most of them do not come from remote areas. Other colored MPs likely originated from colored plastic products used in daily life, such as clothing and commodity packaging [64,68,71].
3.3. Microplastic Composition
A total of 225 suspected microplastic particles (8% of total suspected MPs) were selected from the samples for component identification. Different polymer types were found in the selected particles from surface water sample by using Raman spectroscopy (Thermo Fisher Scientific DXR2, 532 nm laser, Raman shift 50–3500 cm−1) and micro-Fourier transformed infrared spectroscopy (μ-FTIR) (Nicolet iN10, Thermo Fisher Scientific, USA) (only those spectra that match the standard database by more than 70% are accepted to ensure the reliability of the results) (Figure S2), mainly including rayon (38.2%), polyethylene terephthalate (PET) (16.4%), ethylene/vinyl acetate copolymer (12.73%), and polyacrylamide 11 (PA) (10%). Cotton and unidentified particles accounted for a total of 17.27%. The main polymer types in the sediment were rayon (31.3%), PET (23.5%), and polyethylene (PE) (20.9%) (Table 2) Rayon is the main polymer type at each sampling point. As a silk man-made fiber, rayon is composed of cellulose, which is mainly used in the field of garment manufacturing. Therefore, the main source of rayon in marine environment is domestic sewage. A second dominant polymer in the sample, polyethylene terephthalate, mainly used in packaging material, electronic appliances, building materials as well as automotive, from which it can be estimated that the polymer may be mainly derived from human daily necessities and modern industry.
3.4. Microplastic Risk Assessment Analysis
According to the method of Lithner et al. polymer concentration and chemical toxicity data of microplastic polymers are taken as important indexes for establishing risk assessment model and evaluating ecological hazards [72]. Combined with the concentration of MPs and polymer types at sampling sites, we use the polymer hazard score of Lithnner et al. [72] (Table 3), and use the method of Xu et al. to evaluate the potential risks of MPs in coastal areas of Guangdong [73]. Sn is the polymer hazard score of Lithnner et al. [71], Pn is the percentage of each MP at each sampling point, H is a certain MP polymer risk index.
The following formula is used:
- (1)
- Fi = Ci/Coi;
- (2)
- PLI = ;
- (3)
- PLIzone =
- (4)
- H =
PLI (pollution load index) represents the pollution load index of MPs here, which were proposed to evaluate the pollution levels in estuarine areas, and was used in this study to evaluate the load of MPs in the investigated area. Fi is used to indicate the pollution degree of microplastics, and Ci indicates the MPs concentration at each sampling point. Coi is the background value, that is, the concentration of MPs in the absence of pollution. In order to facilitate the comparison of pollution risk category of MPs in different sampling points and the whole region, Coi is given a specific value, combined with the research of Xu et al., the value of Coi is specified as 0.5 items/m3.
Xu et al. defined the risk degree of MPs to help analyze the risk level of each sampling point and provide reference for risk management of environmental departments. Overall, the microplastics pollution risk can be divided into four levels: I (polymer risk index: <10, PLI: <10); II (polymer risk index: 10–100, PLI: 10–20); III (polymer risk index: 100–1000, PLI: 20–30); and IV (polymer risk index: >1000, PLI: >30) [72]. In this study, the sampling points with high abundance of MPs in water samples are S4 (1850 items/m3), S7 (3500 items/m3), S8 (3250 items/m3), and S13 (2850 items/m3). After the identification of MPs, it was found that the areas with high abundance of MPs not only showed high pollution load, but also had dangerous polymers and contain more kinds of MPs. For example, high-risk polyurethane microplastics were found in S8. The risk level of MPs in the sampled area is little higher than medium (Figure 4). Therefore, the high pollution risk of MPs is jointly determined by the presence of high abundance MPs and the presence of harmful MPs with high hazard score [74]. Hence, even though the microplastics abundance varies from place to place, the PLI is at the same level. Microplastics with a high hazard score can result in a higher polymer risk index in the region. In general, the abundance of MPs in coastal areas of Guangdong is high, but the aggregation of high risk is relatively low, and the overall risk level is medium. Microplastic pollution risk assessment converts abundance data into class categories, more intuitively indicating the risk of microplastic pollution in an area.
However, there are some limitations in the potential risk assessment of microplastics. At present, there is no unified method for the risk assessment of microplastics, and there is no unified standard for the risk classification of microplastics pollution. In addition, the selection of suspected microplastics particles for component identification is random, and microplastics with high hazard score are likely to be missed, so the pollution risk level of microplastics may be underestimated.
4. Effective Management of Plastics Is Essential for Environmental Sustainability
Looking at the results of this study, the pollution risk level of MPs in Guangdong coastal areas is high, so it is necessary to reduce the use and waste of plastic products from the source.
Plastic waste in the marine environment poses a threat to the survival of marine life (starvation, suffocation, infection, and increased mortality) [75]. The muscle tissue of commercial fish was also found to contain MPs, which may threaten human health [76]. In addition, these plastic particles will also have a negative impact on tourism and hinder economic development. The extensive transportation and adsorption of MPs may also cause the transportation of invasive species, thus damaging public health [77].
Microbeads and single-use plastics (SUPs) play an important role in marine plastic pollution. An estimated 8 trillion microbeads are released into the aquatic environment every day through wastewater treatment plants (WTP) [78]. Compared with plastic bags, the intervention measures for microbeads are limited. In order to reduce the pollution of microbeads, legislation or a ban is urgently needed, and effective monitoring should be carried out to ensure compliance with the intervention measures. Some countries have adopted a phased approach to banning microbeads. Manufacturers should phase out microbeads from their products and explore natural alternatives that do not pose a threat to the environment.
To reduce SUP pollution, a combination of legislative and non-legislative measures (strengthening civic education and publicity, deepening the understanding of marine pollution situation, and helping to persuade the government to take legislative action) should be advocated. The government should take into account the local conditions and valuable experience to formulate rational policies. Taxes, for example, are more likely to reduce the use of SUPs than bonuses [79].
Plastic ban can save oil consumption and play an important role in energy sustainability [79]. The life cycle and pollution of plastics can lead to climate change and affect biodiversity [80]. Therefore, necessary measures should be taken in the production, use, and waste management of plastics. In some products such as medical equipment, SUPs are difficult to be replaced, but the product design should be improved [81]. For some high-risk plastics, such as PVC, safer alternatives should be explored [82]. Studies have shown that if the recycling amount of plastic packaging is raised to 5%, the potential impact of global warming will decrease by 7% [83]. In the management of plastic waste, the following four points should be observed: reduction, reuse, recycling, and recovery. Changing the life cycle of plastics is of great significance to environmental protection.
In this study, it was found that there was serious MP pollution around the WTP. Although WTP can remove most of the MPs, the massive daily discharge of wastewater is still a huge challenge to aquatic ecosystems. In order to reduce the pollution degree of MPs around WTP, textile production technology should be improved to reduce the release of fibers. For example, synthetic-natural textiles can reduce fiber loss by 80% [84]. Installing filters at the drain of washing machine can reduce the emission of fibers [62]. In WTP, new treatment methods should be developed to retain MPs [62].
During the COVID-19 pandemic, in order to control and alleviate the spread of virus, the government encouraged citizens to adopt plastic protective equipment, such as masks and gloves, and the use of SUPs increased greatly [85,86]. In addition, lower oil prices (reduced water, land, and air transportation) can promote the production of new plastics instead of plastic recycling [87]. Dozens of single-use face masks were found in a Hong Kong beach, exposing the flaws in the use and management of plastics [88]. In the face of a large amount of plastic waste, the primary treatment methods are landfill and incineration, which directly leads to energy loss and harmful gas emissions into the environment, threatening human health and environmental protection, energy sustainability as well as waste management facing more arduous challenges. Therefore, there is an urgent need to improve waste management, improve plastic recycling, and produce reusable alternatives.
After China announced the ban on importing most plastic wastes in 2017, it saved ecological costs and promoted the change of plastic waste treatment structure in various countries [89]. Developing countries lack advanced plastic waste treatment technology, and burning plastic has adverse effects on global climate change [89]. Therefore, all countries and places should strengthen local waste management, while developing countries such as China should raise awareness of the potential risks of plastic waste, formulate policies to reduce the negative effects of plastics, such as restricting the production and use of plastics, encouraging the production of environmentally friendly plastic substitutes, strengthening publicity and education, improving the classification of plastic waste, and promoting the recycling of plastic products [90].
5. Conclusions
MPs were found at all sites sampled in this study, indicating high prevalence of this emerging pollutant. The most abundant type of MPs in water samples was fibers. More fragments were found in sediment samples, which are mainly derived from thicker plastic products that are degraded into MPs when discarded materials larger than 5 mm are not removed from beaches. Areas with high microplastic abundance contains more types of polymers and more high-risk polymers. The overall microplastic pollution risk level of Guangdong coastal areas is little higher than medium. The presence of large amounts of rayon suggests human activities and domestic sewage are the main sources of microplastic pollution, and human activities increase the accumulation of MPs in the environment, thereby increasing the pollution risk of MPs.
Supplementary Materials
The following are available online at https://www.mdpi.com/2071-1050/13/5/2691/s1. Figure S1: The abundance of microplastic in water samples and sediments along the coast of Guangdong, Figure S2: Typical microplastics and their components identified by Raman spectroscopy, Table S1: The coordinates and peripheral conditions of the sampling sites in this study.
Author Contributions
Conceptualization, Y.L. and G.C.; methodology, Y.Z.; software, Y.L.; validation, Y.L. and Y.Z.; formal analysis, Y.L.; investigation, K.X.; resources, J.W.; data curation, Y.L.; writing—original draft preparation, Y.L.; writing—review and editing, J.W.; visualization, K.H.; supervision, H.G. and M.Y.; project administration, J.W.; funding acquisition, J.W. All authors have read and agreed to the published version of the manuscript.
Funding
This research received no external funding.
Institutional Review Board Statement
Not applicable. The study did not involve humans or animals.
Informed Consent Statement
Not applicable.
Data Availability Statement
Not applicable.
Acknowledgments
This study was supported by Guangdong Province Universities and Colleges Pearl River Scholar Funded Scheme (2018), the National Natural Science Foundation of China (42077364), the National Key Research and Development Program of China (2018YFD0900604), Key Research Projects of Universities in Guangdong Province (2019KZDXM003 and 2020KZDZX1040), and Science and Technology Program of Guangdong, China (2019A141405034). We appreciate the provision of SCAU Wushan Campus Teaching & Research Base.
Conflicts of Interest
The authors declare no conflict of interest.
References
- Zhang, W.; Zhang, S.; Wang, J.; Wang, Y.; Mu, J.; Wang, P.; Lin, X.; Ma, D. Microplastic pollution in the surface waters of the Bohai Sea, China. Environ. Pollut. 2017, 231, 541–548. [Google Scholar] [CrossRef]
- Jambeck, J.R.; Geyer, R.; Wilcox, C.; Siegler, T.R.; Perryman, M.; Andrady, A.; Narayan, R.; Law, K.L. Plastic waste inputs from land into the ocean. Science 2015, 347, 768–771. [Google Scholar] [CrossRef]
- Savrık, S.A.; Erdoğan, B.C.; Balköse, D.; Ülkü, S. Statistical thermal stability of PVC. J. Appl. Polym. Sci. 2010, 116, 1811–1822. [Google Scholar] [CrossRef] [Green Version]
- Gewert, B.; Plassmann, M.M.; MacLeod, M. Pathways for degradation of plastic polymers floating in the marine environment. Environ. Sci. Process. Impacts 2015, 17, 1513–1521. [Google Scholar] [CrossRef] [Green Version]
- Van Cauwenberghe, L.; Janssen, C.R. Microplastics in bivalves cultured for human consumption. Environ. Pollut. 2014, 193, 65–70. [Google Scholar] [CrossRef] [PubMed]
- Remy, F.; Collard, F.; Gilbert, B.; Compere, P.; Eppe, G.; Lepoint, G. When microplastic is not plastic: The ingestion of cellulose fibers by macrofauna living in seagrass macrophytodetritus. Environ. Sci. Technol. 2015, 49, 11158–11166. [Google Scholar] [CrossRef] [PubMed]
- Miller, R.Z.; Watts, A.J.R.; Winslow, B.O.; Galloway, T.S.; Barrows, A.P.W. Mountains to the sea: River study of plastic and non-plastic microfiber pollution in the Northeast USA. Mar. Pollut. Bull. 2017, 124, 245–251. [Google Scholar] [CrossRef]
- Dris, R.; Gasperi, J.; Rocher, V.; Tassin, B. Synthetic and non-synthetic anthropogenic fibers in a river under the impact of Paris megacity: Sampling methodological aspects and flux estimations. Sci. Total Environ. 2018, 618, 157–164. [Google Scholar] [CrossRef] [Green Version]
- Gall, S.C.; Thompson, R.C. The impact of debris on marine life. Mar. Pollut. Bull. 2015, 92, 170. [Google Scholar] [CrossRef] [PubMed]
- Eerkes-Medrano, D.; Thompson, R.C.; Aldridge, D.C. Microplastics in freshwater systems: A review of the emerging threats, identification of knowledge gaps and prioritisation of research needs. Water Res. 2015, 75, 63–82. [Google Scholar] [CrossRef]
- Mani, T.; Hauk, A.; Walter, U.; Burkhardt-Holm, P. Microplastics profile along the Rhine River. Sci. Rep. 2015, 5, 1–7. [Google Scholar] [CrossRef] [PubMed]
- Fok, L.; Cheung, P.K. Hong Kong at the Pearl River Estuary: A hotspot of microplastic pollution. Mar. Pollut. Bull. 2015, 99, 112–118. [Google Scholar] [CrossRef]
- Rillig, M.C. Microplastic in terrestrial ecosystems and the soil? Environ. Sci. Technol. 2012, 46, 6453–6454. [Google Scholar] [CrossRef] [PubMed]
- Van Cauwenberghe, L.; Vanreusel, A.; Mees, J.; Janssen, C.R. Microplastic pollution in deep-sea sediments. Environ. Pollut. 2013, 182, 495–499. [Google Scholar] [CrossRef]
- Dris, R.; Gasperi, J.; Saad, M.; Mirande, C.; Tassin, B. Synthetic fibers in atmospheric fallout: A source of microplastics in the environment? Mar. Pollut. Bull. 2016, 104, 290–293. [Google Scholar] [CrossRef] [PubMed]
- Schymanski, D.; Goldbeck, C.; Humpf, H.-U.; Fürst, P. Analysis of microplastics in water by micro-Raman spectroscopy: Release of plastic particles from different packaging into mineral water. Water Res. 2018, 129, 154–162. [Google Scholar] [CrossRef]
- Kosuth, M.; Wattenberg, E.V.; Mason, S.A.; Tyree, C.; Morrison, D. Synthetic Polymer Contamination in Global Drinking Water. 2017. Available online: https://orbmedia.org/stories/invisibles_final_report (accessed on 19 September 2017).
- Zhang, H. Transport of microplastics in coastal seas. Estuar. Coast. Shelf Sci. 2017, 199, 74–86. [Google Scholar] [CrossRef]
- Geyer, R.; Jambeck, J.R.; Law, K.L. Production, use, and fate of all plastics ever made. Sci. Adv. 2017, 19, e1700782. [Google Scholar] [CrossRef] [Green Version]
- Karthik, R.; Robin, R.S.; Purvaja, R.; Ganguly, D.; Anandavelu, I.; Raghuraman, R.; Hariharan, G.; Ramakrishna, A.; Ramesh, R. Microplastics along the beaches of southeast coast of India. Sci. Total Environ. 2018, 645, 1388–1399. [Google Scholar] [CrossRef]
- Isobe, A.; Kubo, K.; Tamura, Y.; Kako, S.; Nakashima, E.; Fujii, N. Selective transport of microplastics and mesoplastics by drifting in coastal waters. Mar Pollut Bull. 2014, 89, 324–330. [Google Scholar] [CrossRef]
- Lusher, A. Microplastics in the Marine Environment: Distribution, Interactions and Effects. Mar. Anthropog. Litter 2015, 245–307. [Google Scholar] [CrossRef] [Green Version]
- Thushari, G.G.N.; Senevirathna, J.D.M.; Yakupitiyage, A.; Chavanich, S. Effects of microplastics on sessile invertebrates in the eastern coast of Thailand: An approach to coastal zone conservation. Mar. Pollut. Bull. 2017, 124, 349–355. [Google Scholar] [CrossRef]
- Bråte, I.L.N.; Blazquez, M.; Brooks, S.J.; Thomas, K.V. Weathering impacts the uptake of polyethylene microparticles from toothpaste in Mediterranean mussels (M. galloprovincialis). Sci. Total Environ. 2018, 626, 1310–1318. [Google Scholar] [CrossRef]
- Rochman, C.M.; Hoh, E.; Kurobe, T.; Teh, S.J. Ingested plastic transfers hazardous chemicals to fish and induces hepatic stress. Sci. Rep. 2013, 3, 3263. [Google Scholar] [CrossRef]
- Rochman, C.M.; Lewison, R.L.; Eriksen, M.; Allen, H.; Cook, A.-M.; Teh, S.J. Polybrominated diphenyl ethers (PBDEs) in fish tissue may be an indicator of plastic contamination in marine habitats. Sci. Total Environ. 2014, 476–477, 622–633. [Google Scholar] [CrossRef] [PubMed]
- Dawson, A.; Kawaguchi, S.; King, C.; Townsend, K.; King, R.; Huston, W.; Nash, S. Turning microplastics into nanoplastics through digestive fragmentation by Antarctic krill. Nat. Commun. 2018, 9, 1001. [Google Scholar] [CrossRef] [PubMed]
- Ding, J.; Zhang, S.; Razanajatovo, R.M.; Zou, H.; Zhu, W. Accumulation, tissue distribution, and biochemical effects of polystyrene microplastics in the freshwater fish red tilapia (Oreochromis niloticus). Environ. Pollut. 2018, 238, 1–9. [Google Scholar] [CrossRef] [PubMed]
- Mattsson, K.; Johnson, E.V.; Malmendal, A.; Linse, S.; Hansson, L.A.; Cedervall, T. Brain damage and behavioural disorders in fish induced by plastic nanoparticles delivered through the food chain. Sci. Rep. 2017, 7, 11452. [Google Scholar] [CrossRef]
- Mak, C.W.; Yeung, K.C.F.; Chan, K.M. Acute toxic effects of polyethylene microplastic on adult zebrafish. Ecotoxicol. Environ. Saf. 2019, 182, 109442. [Google Scholar] [CrossRef]
- Fendall, L.S.; Sewell, M.A. Contributing to marine pollution by washing your face: Microplastics in facial cleansers. Mar. Pollut. Bull. 2009, 58, 1225–1228. [Google Scholar] [CrossRef] [PubMed]
- Wang, J.; Tan, Z.; Peng, J.; Qiu, Q.; Li, M. The behaviors of microplastics in the marine environment. Mar. Environ. Res. 2016, 113, 7–17. [Google Scholar] [CrossRef]
- Cai, L.; Wang, J.; Peng, J.; Wu, Z.; Tan, X. Observation of the degradation of three types of plastic pellets exposed to UV irradiation in three different environments. Sci. Total Environ. 2018, 628–629, 740–747. [Google Scholar] [CrossRef]
- Andrady, A.L. Persistence of plastic litter in the oceans. In Marine Anthropogenic Litter; Bergmann, M., Gutow, L., Klages, M., Eds.; Springer: New York, NY, USA, 2015; pp. 57–72. [Google Scholar]
- Cole, M.; Lindeque, P.; Halsband, C.; Galloway, T.S. Microplastics as contaminants in the marine environment: A review. Mar. Pollut. Bull. 2011, 62, 2588–2597. [Google Scholar] [CrossRef] [PubMed]
- Fok, L.; Cheung, P.K.; Tang, G.; Li, W.C. Size distribution of stranded small plastic debris on the coast of Guangdong, South China. Environ. Pollut. 2016, 1–6. [Google Scholar] [CrossRef] [PubMed]
- Guangzhou Environmental Protection, Guangzhou Environmental Statistical Bulletin for 2015. Available online: http://www.gzepb.gov.cn/root43/gov/201607/t20160720_10029.htm (accessed on 21 July 2016).
- Lin, L.; Zuo, L.; Peng, J.; Cai, L.; Fok, L.; Yan, Y.; Li, H. Occurrence and distribution of microplastics in an urban river: A case study in the Pearl River along Guangzhou City, China. Sci. Total Environ. 2018, 644, 375–381. [Google Scholar] [CrossRef]
- Peng, G.Y.; Xu, P.; Zhu, B.S.; Bai, M.Y.; Li, D.J. Microplastics in freshwater river sediments in Shanghai, China: A case study of risk assessment in mega-cities. Environ. Pollut. 2018, 234, 448–456. [Google Scholar] [CrossRef]
- Pivokonsky, M.; Cermakova, L.; Novotna, K.; Peer, P.; Cajthaml, P.; Janda, V. Occurrence of microplastics in raw and treated drinking water. Sci. Total Environ. 2018, 643, 1644–1651. [Google Scholar] [CrossRef]
- Barrows, A.P.W.; Neumann, C.A.; Berger, M.L.; Shaw, S.D. Grab vs. neuston tow net: A microplastic sampling performance comparison and possible advances in the field. Anal. Methods 2017, 9, 1446–1453. [Google Scholar] [CrossRef]
- Zhao, S.; Zhu, L.; Li, D. Microplastic in three urban estuaries, China. Environ. Pollut. 2015, 206, 597–604. [Google Scholar] [CrossRef]
- Leslie, H.A.; Brandsma, S.H.; van Velzen, M.J.M.; Vethaak, A.D. Microplastics en route: Field measurements in the Dutch river delta and Amsterdam canals, wastewater treatment plants, North Sea sediments and biota. Environ. Int. 2017, 101, 133–142. [Google Scholar] [CrossRef] [PubMed]
- Hidalgo-Ruz, V.; Gutow, L.; Thompson, R.C.; Thiel, M. Microplastics in the marine environment: A review of the methods used for identification and quantification. Environ. Sci. Technol. 2012, 46, 3060–3075. [Google Scholar] [CrossRef]
- Nuelle, M.T.; Dekiff, J.H.; Remy, D.; Fries, E. A new analytical approach for monitoring microplastics in marine sediments. Environ. Pollut. 2014, 184, 161–169. [Google Scholar] [CrossRef] [PubMed]
- Zhao, J.; Ran, W.; Teng, J.; Liu, Y.; Liu, H.; Yin, X.; Cao, R.; Wang, Q. Microplastic pollution in sediments from the Bohai Sea and the Yellow Sea, China. Sci. Total Environ. 2018, 640–641, 637–645. [Google Scholar] [CrossRef]
- Su, L.; Xue, Y.; Li, L.; Yang, D.; Kolandhasamy, P.; Li, D.; Shi, H. Microplastics in Taihu Lake, China. Environ. Pollut. 2016, 216, 711–719. [Google Scholar] [CrossRef] [PubMed]
- van der Hal, N.; Ariel, A.; Angel, D.L. Exceptionally high abundances of microplastics in the oligotrophic Israeli Mediterranean coastal waters. Mar. Pollut. Bull. 2017, 116, 151–155. [Google Scholar] [CrossRef] [PubMed]
- Wu, N.; Zhang, Y.; Zhao, Z.; He, J.; Li, W.; Ma, Y. Occurrence and distribution of microplastics in surface water and sediments of two typical estuaries in Bohai Bay, China. Environ. Sci. Proc. Imp. 2019, 21, 1143–1152. [Google Scholar] [CrossRef] [PubMed]
- Fossi, M.C.; Marsili, L.; Baini, M.; Giannetti, M.; Coppola, D.; Guerranti, C.; Caliani, I.; Minutoli, R.; Lauriano, G.; Finoia, M.G.; et al. Fin whales and microplastics: The Mediterranean Sea and the Sea of Cortez scenarios. Environ. Pollut. 2016, 209, 68–78. [Google Scholar] [CrossRef] [PubMed]
- de Lucia, G.A.; Caliani, I.; Marra, S.; Camedda, A.; Coppa, S.; Alcaro, L.; Campani, T.; Giannetti, M.; Coppola, D.; Cicero, A.M.; et al. Amount and distribution of neustonic micro-plastic off the western Sardinian coast (central-western Mediterranean Sea). Mar. Environ. Res. 2014, 100, 10–16. [Google Scholar] [CrossRef] [PubMed]
- Frere, L.; Paul-Pont, I.; Rinnert, E.; Petton, S.; Jaffre, J.; Bihannic, I.; Soudant, P.; Lambert, C.; Huvet, A. Inflfluence of environmental and anthropogenic factors on the composition, concentration and spatial distribution of microplastics: A case study of the Bay of Brest (Brittany, France). Environ. Pollut. 2017, 225, 211–222. [Google Scholar] [CrossRef] [Green Version]
- Zhang, D.; Liu, X.; Huang, W.; Li, J.; Wang, C.; Zhang, D.; Zhang, C. Microplastic pollution in deep-sea sediments and organisms of the Western Pacific Ocean. Environ. Pollut. 2020, 259, 113948. [Google Scholar] [CrossRef]
- Tata, T.; Belabed, B.E.; Bououdina, M.; Bellucci, S. Occurrence and characterization of surface sediment microplastics and litter from North African coasts of Mediterranean Sea: Preliminary research and first evidence. Sci. Total Environ. 2020, 713, 136664. [Google Scholar] [CrossRef]
- Hoellein, T.J.; McCormick, A.R.; Hittie, J.; London, M.G.; Scott, J.W.; Kelly, J.J. Longitudinal patterns of microplastic concentration and bacterial assemblages in surface and benthic habitats of an urban river. Freshw. Sci. 2017, 36, 491–507. [Google Scholar] [CrossRef]
- Irfan, T.; Khalid, S.; Taneez, M.; Muhammad, Z.H. Plastic driven pollution in Pakistan: The first evidence of environmental exposure to microplastic in sediments and water of Rawal Lake. Environ. Sci. Pollut. Res. 2020, 27, 15083–15092. [Google Scholar] [CrossRef]
- Rodrigues, M.O.; Abrantes, N.; Gonçalves, F.J.M.; Nogueira, H.; Marques, J.C.; Gonçalves, A.M.M. Spatial and temporal distribution of microplastics in water and sediments of a freshwater system (Antua River, Portugal). Sci. Total Environ. 2018, 633, 1549–1559. [Google Scholar] [CrossRef]
- Yuan, W.; Liu, X.; Wang, W.; Di, M.; Wang, J. Microplastic abundance, distribution and composition in water, sediments and wild fish from Poyang Lake, China. Ecotoxicol. Environ. Saf. 2019, 170, 180–187. [Google Scholar] [CrossRef]
- Dai, Z.; Zhang, H.; Zhou, Q.; Tian, Y.; Chen, T.; Tu, C.; Fu, C.; Luo, Y. Occurrence of microplastics in the water column and sediment in an inland sea affected by intensive anthropogenic activities. Environ. Pollut. 2018, 242, 1557–1565. [Google Scholar] [CrossRef] [PubMed]
- Mason, S.A.; Kammin, L.; Eriksen, M.; Aleid, G.; Wilson, S.; Box, C.; Williamson, N.; Riley, A. Pelagic plastic pollution within the surface waters of Lake Michigan, USA. J. Great Lakes. Res. 2016, 42, 753–759. [Google Scholar] [CrossRef]
- Hernandez, E.; Nowack, B.; Mitrano, D.M. Polyester textiles as a source of microplastics from households: A mechanistic study to understand microfiber release during washing. Environ. Sci. Technol. 2017, 51, 7036–7046. [Google Scholar] [CrossRef] [PubMed]
- Browne, M.A.; Crump, P.; Niven, S.J.; Teuten, E.; Tonkin, A.; Galloway, T.; Thompson, R. Accumulation of microplastic on shorelines worldwide: Sources and sinks. Environ. Sci. Technol. 2011, 45, 9175–9179. [Google Scholar] [CrossRef]
- Hu, L.; Chernick, M.; Hinton, D.E.; Shi, H. Microplastics in Small Waterbodies and Tadpoles from Yangtze River Delta, China. Environ. Sci. Technol. 2018, 52, 8885. [Google Scholar] [CrossRef]
- Wang, W.; Ndungu, A.W.; Li, Z.; Wang, J. Microplastics pollution in inland freshwaters of China: A case study in urban surface waters of Wuhan, China. Sci. Total Environ. 2017, 575, 1369–1374. [Google Scholar] [CrossRef] [PubMed]
- Lei, K.; Qiao, F.; Liu, Q.; Wei, Z.; Qi, H.; Cui, S.; Yue, X.; Deng, Y.; An, L. Microplastics releasing from personal care and cosmetic products in China. Mar. Pollut. Bull. 2017, 123, 122–126. [Google Scholar] [CrossRef]
- Cheung, P.K.; Fok, L. Characterisation of plastic microbeads in facial scrubs and their estimated emissions in Mainland China. Water Res. 2017, 122, 53–61. [Google Scholar] [CrossRef]
- Di, M.; Wang, J. Microplastics in surface waters and sediments of the Three Gorges Reservoir, China. Sci. Total Environ. 2018, 616, 1620–1627. [Google Scholar] [CrossRef]
- Browne, M.A.; Galloway, T.S.; Thompson, R.C. Spatial patterns of plastic debris along estuarine shorelines. Environ. Sci. Technol. 2010, 44, 3404–3409. [Google Scholar] [CrossRef]
- Zhang, K.; Gong, W.; Lv, J.; Xiong, X.; Wu, C. Accumulation of floating microplastics behind the Three Gorges Dam. Environ. Pollut. 2015, 204, 117–123. [Google Scholar] [CrossRef]
- Liu, P.; Zhan, X.; Wu, X.; Li, J.; Wang, H.; Gao, S. Effect of weathering on environmental behavior of microplastics: Properties, sorption and potential risks. Chemosphere 2020, 242, 125193. [Google Scholar] [CrossRef]
- Stolte, A.; Forster, S.; Gerdts, G.; Schubert, H. Microplastic concentrations in beach sediments along the German Baltic coast. Mar. Pollut. Bull. 2015, 99, 216–229. [Google Scholar] [CrossRef]
- Lithner, D.; Larsson, Å.; Dave, G. Environmental and health hazard ranking and assessment of plastic polymers based on chemical composition. Sci. Total Environ. 2011, 409, 3309–3324. [Google Scholar] [CrossRef] [PubMed]
- Xu, P.; Peng, G.; Su, L.; Gao, Y.Q.; Gao, L.; Li, D. Microplastic risk assessment in surface waters: A case study in the Changjiang Estuary, China. Mar. Pollut. Bull. 2018, 133, 647–654. [Google Scholar] [CrossRef] [PubMed]
- Cowger, W.; Booth, A.M.; Hamilton, B.M.; Thaysen, C.; Primpke, S.; Munno, K.; Lusher, A.L.; Dehaut, A.; Vaz, V.P.; Liboiron, M.; et al. Reporting Guidelines to Increase the Reproducibility and Comparability of Research on Microplastics. Appl. Spectrosc. 2020, 74, 1066–1077. [Google Scholar] [CrossRef]
- Baulch, S.; Perry, C. Evaluating the impacts of marine debris on cetaceans. Mar. Pollut. Bull. 2014, 80, 210–221. [Google Scholar] [CrossRef]
- Abbasi, S.; Soltani, N.; Keshavarzi, B.; Moore, F.; Turner, A.; Hassanaghaei, M. Microplastics in different tissues of fish and prawn from the Musa Estuary, Persian Gulf. Chemosphere 2018, 205, 80–87. [Google Scholar] [CrossRef]
- Hardesty, B.D.; Good, T.P.; Wilcox, C. Novel methods, new results and science-based solutions to tackle marine debris impacts on wildlife. Ocean Coast. Manag. 2015, 115, 4–9. [Google Scholar] [CrossRef] [Green Version]
- Rochman, C.M.; Kross, S.M.; Armstrong, J.B.; Bogan, M.T.; Darling, E.S.; Green, S.J.; Smyth, A.R.; Veríssimo, D. Scientific evidence supports a ban on microbeads. Environ. Sci. Technol. 2015, 49, 10759–10761. [Google Scholar] [CrossRef] [PubMed] [Green Version]
- Schnurr, R.E.J.; Alboiu, V.; Chaudhary, M.; Corbett, R.A.; Quanz, M.E.; Sankar, K.; Srain, H.S.; Thavarajah, V.; Xanthos, D.; Walker, T.R. Reducing marine pollution from single-use plastics (SUPs): A review. Mar. Pollut. Bull. 2018, 137, 157–171. [Google Scholar] [CrossRef] [PubMed]
- Walker, T.R.; Mallory, M.; Avery-Gomm, S. Why Canada’s single-use plastic ban could help the environment and wildlife. Mar. Policy. 2016, 68, 117–122. [Google Scholar]
- Prata, J.C.; Silva, A.L.P.; da Costa, J.P.; Mouneyrac, C.; Walker, T.R.; Duarte, A.C.; Rocha-Santos, T. Solutions and Integrated Strategies for the Control and Mitigation of Plastic and Microplastic Pollution. Int. J. Environ. Res. Public Health 2019, 16, 2411. [Google Scholar] [CrossRef] [Green Version]
- Rochman, C.M.; Browne, M.A. Classify plastic waste as hazardous. Nature 2013, 494, 169–171. [Google Scholar] [CrossRef]
- Gallego-Schmid, A.; Mendoza, J.M.F.; Azapagic, A. Improving the environmental sustainability of reusable food containers in Europe. Sci. Total Environ. 2018, 628–629, 979–989. [Google Scholar] [CrossRef] [Green Version]
- Napper, I.E.; Thompson, R.C. Release of synthetic microplastic plastic fibers from domestic washing machines: Effects of fabric type and washing conditions. Mar. Pollut. Bull. 2016, 112, 39–45. [Google Scholar] [CrossRef] [Green Version]
- Tobías, A. Evaluation of the lockdowns for the SARS-CoV-2 epidemic in Italy and Spain after one month follow up. Sci. Total Environ. 2020, 725, 138539. [Google Scholar] [CrossRef]
- Xiao, Y.; Torok, M.E. Taking the right measures to control COVID-19. Lancet Infect. Dis. 2020, 1–2. [Google Scholar] [CrossRef] [Green Version]
- Patrício Silva, A.L.; Prata, J.C.; Walker, T.R.; Campos, D.; Duarte, A.C.; Soares, A.M.V.M.; Barcelò, D.; Rocha-Santos, T. Rethinking and optimising plastic waste management under COVID-19 pandemic: Policy solutions based on redesign and reduction of single-use plastics and personal protective equipment. Sci. Total Environ. 2020, 742, 140565. [Google Scholar] [CrossRef] [PubMed]
- NGO Oceans Asia. No Shortage of Surgical Mask at the Beach. 2020. Available online: http://oceansasia.org/beach-mask-coronavirus/ (accessed on 14 May 2020).
- Wen, Z.; Xie, Y.; Chen, M.; Dinga, C.D. China’s plastic import ban increases prospects of environmental impact mitigation of plastic waste trade flow worldwide. Nat. Commun. 2021, 12, 425. [Google Scholar] [CrossRef]
- Dahlbo, H.; Poliakova, V.; Mylläri, V.; Sahimaa, O.; Anderson, R. Recycling potential of post-consumer plastic packaging waste in Finland. Waste Manag. 2018, 71, 52–61. [Google Scholar] [CrossRef]
Figure 1.
Locations of the thirteen sampling sites and the abundance of microplastics at each sampling point under study.
Figure 1.
Locations of the thirteen sampling sites and the abundance of microplastics at each sampling point under study.

Figure 2.
Types of microplastics in the surface water and sediments from coastal area of Guangdong (a–d): (a) pellets, (b) fibers, (c) fragments, (d) films.
Figure 2.
Types of microplastics in the surface water and sediments from coastal area of Guangdong (a–d): (a) pellets, (b) fibers, (c) fragments, (d) films.

Figure 3.
The proportion of microplastic size in the water samples (A) and sediments (B); the proportion of microplastic shape in the water samples (C) and in sediments (D); the proportion of microplastic color in the water samples (E) and in sediments (F) from coastal area of Guangdong.
Figure 3.
The proportion of microplastic size in the water samples (A) and sediments (B); the proportion of microplastic shape in the water samples (C) and in sediments (D); the proportion of microplastic color in the water samples (E) and in sediments (F) from coastal area of Guangdong.

Figure 4.
The risk degree of microplastic pollution along the coast of Guangdong. Color represents toxicity index of different polymers, circle size represents different pollution load index.
Figure 4.
The risk degree of microplastic pollution along the coast of Guangdong. Color represents toxicity index of different polymers, circle size represents different pollution load index.


Table 1.
Microplastic abundance in other studies.
| Study Area | Sample Type | Sampling Methods | Abundance | References | |
|---|---|---|---|---|---|
| Tools | Mesh Size | ||||
| Aegean-Levantine Sea | Water at depths of 0–20 cm | Manta trawl | 333 μm | 7.68 ± 2.38 items/m3 | [48] |
| Yondingxinhe Estuar | Surface water | 12 V DC Teflon pump | 48 μm | 788.0 ± 464.2 items/m3 | [49] |
| the Bay of Brest, France | the top 20 cm of the water | standard Manta trawl | 335 μm | 240 ± 350 items/L | [52] |
| Western Mediterranean Sea | Water (Top 45 cm) | WP2 | 200 μm | 0.31 ± 1.17 items/m3 | [50] |
| Western Mediterranean Sea | Surface water | Manta trawl | 500 μm | 0.15 ± 0.11 items/m3 | [51] |
| Pearl River in Guangzhou | Surface water (top 50 cm) | 5 L water sampler | 0.02 mm | 2724 items/m3 | [38] |
| Bohai Sea, Yellow Sea | Sediment | Stainless steel box sampler | 171.8 items/kg 123.6 items/kg 72 items/kg | [46] | |
| Western Pacific Ocean | Sediment | Stainless-steel box corer | 240 items/kg | [53] | |
| Mediterranean Sea | Sediment | 5 mL metal-capped glass bijoux jar | 182.66 ± 27.32 items/kg 649.33 ± 184.02 items/kg | [54] | |
| North Shore Channel, USA | Sediment | a Ponar grab | 3.6 × 10³–1.62 × 10⁴ items/kg | [55] | |
| Pearl River in Guangzhou | Sediment | Van Veen grab sampler | 1669 items/kg | [38] | |
Table 2.
Composition of microplastics in surface water and sediment in different sampling site of Guangdong coastal area.
Table 2.
Composition of microplastics in surface water and sediment in different sampling site of Guangdong coastal area.
| Polymer Type | Surface Water | Sediment |
|---|---|---|
| Rayon | 38.18% | 31.30% |
| PET | 16.36% | 23.47% |
| Polyamide-11 | 10% | 2.61% |
| PE | 1.82% | 20.87% |
| PP | 0.91% | 0 |
| EVA | 12.73% | 0 |
| PUR | 0.91% | 0 |
| PS | 0.91% | 0 |
| PP | 0.91% | 0.87% |
| Nylon 6 | 0.91% | 0 |
| Poly(2,3-butylene sulfone) | 0 | 0.87% |
| Poly(acrylonitrile:vinyl chloride) | 0 | 0.87% |
| Non-plastic | 16.36% | 19.13% |
Table 3.
Type and details of polymers detected in this study.
| Polymer | Abbreviation | Monomer | Hazard Score (Hightest Level) a |
|---|---|---|---|
| Polyethylene terephthalate | PET | Ethylene glycol | 4 (II) |
| Ethylene/Vinyl Acetate | EVA | Ethylene | 9 (II) |
| Low-Density Polyethylene | LDPE | Ethylene | 11 (II) |
| Polyurethane | PUR | Propylene oxide | 7384 (V) |
| Nylon 6 | PA | ε-caprolactam | 50 (III) |
| Polystyrene | PS | Styrene | 30 (II) |
| Polyethylene | PE | Ethylene | 11 (II) |
a The hazard score of each polymer were taken from Lithner et al. (2011).
Publisher’s Note: MDPI stays neutral with regard to jurisdictional claims in published maps and institutional affiliations. |
© 2021 by the authors. Licensee MDPI, Basel, Switzerland. This article is an open access article distributed under the terms and conditions of the Creative Commons Attribution (CC BY) license (http://creativecommons.org/licenses/by/4.0/).
Share and Cite
MDPI and ACS Style
Li, Y.; Zhang, Y.; Chen, G.; Xu, K.; Gong, H.; Huang, K.; Yan, M.; Wang, J. Microplastics in Surface Waters and Sediments from Guangdong Coastal Areas, South China. Sustainability 2021, 13, 2691. https://doi.org/10.3390/su13052691
AMA Style
Li Y, Zhang Y, Chen G, Xu K, Gong H, Huang K, Yan M, Wang J. Microplastics in Surface Waters and Sediments from Guangdong Coastal Areas, South China. Sustainability. 2021; 13(5):2691. https://doi.org/10.3390/su13052691
Chicago/Turabian StyleLi, Yizheng, Yindan Zhang, Guanglong Chen, Kaihang Xu, Han Gong, Kai Huang, Muting Yan, and Jun Wang. 2021. "Microplastics in Surface Waters and Sediments from Guangdong Coastal Areas, South China" Sustainability 13, no. 5: 2691. https://doi.org/10.3390/su13052691
Note that from the first issue of 2016, this journal uses article numbers instead of page numbers. See further details here.