1. Introduction
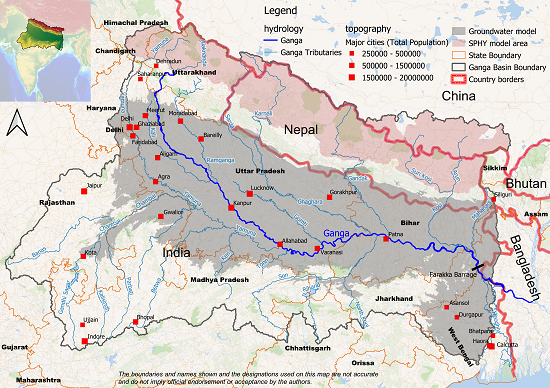
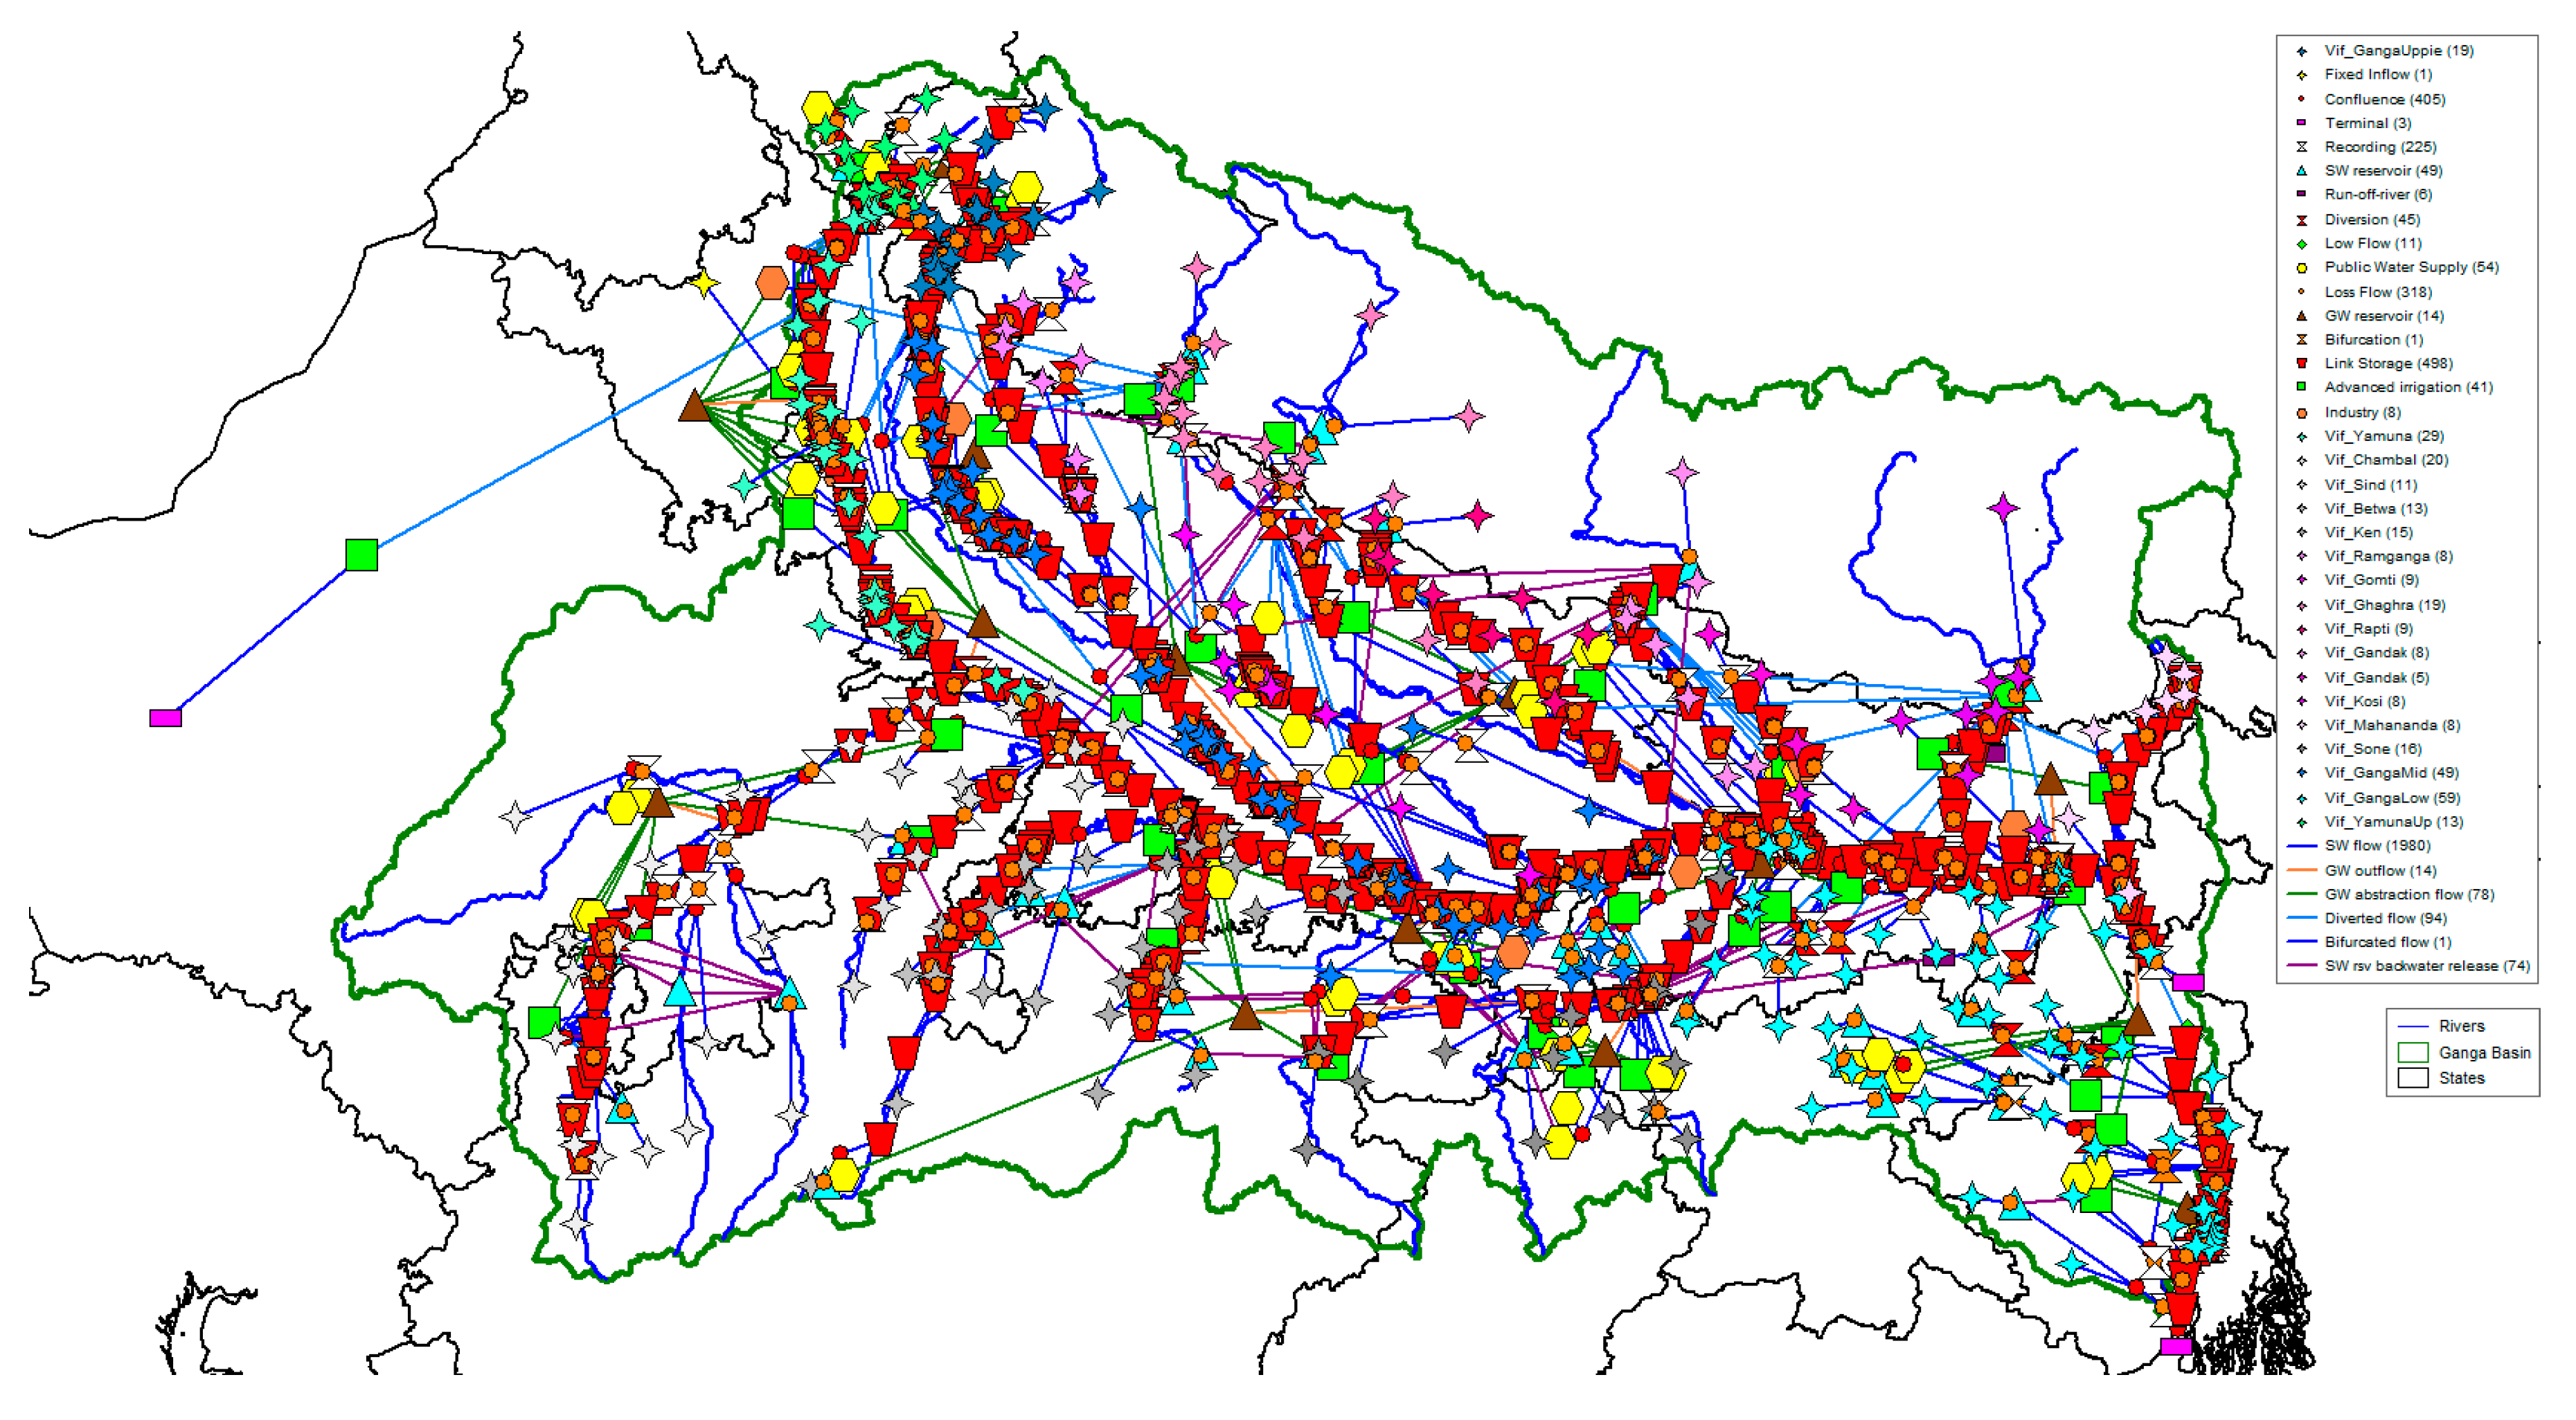
The Ganga River Basin (
Figure 1) in India stretches over 860,000 km
2 [
1] and is home to more than 485 million people (2011 census data [
2]). The population is concentrated on the plains that support extensive irrigated agriculture. The plains are of very low slope, falling from 250 m above mean sea level in the west, to approximately 25 m near Farakka at the border with Bangladesh—a distance of over 1500 km. North of the plains the Ganga and its tributaries flow from the Himalaya at elevations over 6000 m. Covered by snow and glaciers, the Himalaya significantly influence the flow regime in the northern tributaries. The mountains and hills to the south are much lower, with an average elevation of around 1000 m. Water availability increases in the plains from west to east. The Himalayan tributaries of the Ganga (the Yamuna, Ghagra, Gandak and Kosi) supply the majority of the water to the plains. Conjunctive irrigation using surface and groundwater in the western part of the plains has led to local decreases in groundwater tables, while in some canal and eastern areas waterlogging is a major problem. In the basin, precipitation increases further to the east, as does mainstem flow as tributaries join. Pre-monsoon water shortage is common in dry years, especially in the western plains.
Water is diverted from rivers through canals and pumped from groundwater. A large fraction of irrigation water is not used for plant transpiration and returns as aquifer recharge or drainage to canals and rivers. There are direct exchanges between the rivers and groundwater. Depending on river and groundwater level, the flow is either from groundwater to river (gaining river) or from rivers/canals to groundwater (losing river). Water quality and riverine ecology depend strongly on the flows resulting from the interaction between geo-hydrology and water resources management.
The ecological health of the Ganga River and some of its tributaries has deteriorated significantly due to high pollution loads from point and non-point sources; river modifications with infrastructure (dams and barrages); flow regime changes caused by high levels of water abstraction, mostly for irrigation, but also for municipal and industrial uses; and hydropower generation [
3]. The Government of India has committed to an ambitious goal of rejuvenating the Ganga and has assigned significant funds to address the problem [
4]. Since India is a federated country, and responsibility for water resources management is assigned to the states by the Constitution cooperation with and between the national government and those of the 11 Indian states is required for effective basin management.
The Ganga River Basin Model was developed by a collaborative team of national and international scientists with funding from the South Asia Water Initiative (a multi-donor trust fund managed by the World Bank) to support strategic river basin planning. It assesses the impacts of different socio-economic and climate change scenarios combined with different strategies for new infrastructure, management and operation. The objective of applying a participatory approach to model development was to both improve the quality of the model and to increase the commitment and ownership of relevant authorities and agencies. The process of model construction and the assessment of the first scenarios and strategies led by international scientists are intended as the start of a continuous process of model application and improvement led by Indian authorities and agencies. A set of reports provides a description of the set-up and calibration of the Ganga River Basin Model [
5], a description of the participatory modelling process [
6], and presentation and discussion of the scenario modelling results, environmental flow analysis, and surface-groundwater analysis [
7].
3. Results
3.1. Results of Participatory Modelling Process
3.1.1. Broad Participation
One of the results of the adopted approach was broad participation from different national-level government departments/agencies and those from the eleven Ganga states, both in the series of basin-wide workshops as well as in the different state-level workshops (
Table 3,
Table 4 and
Table 5). Participants were particularly positive about the opportunities the approach offered counterparts in different government agencies to collaborate and share cross-sectoral information relevant to Ganga basin planning. Many reported gaining new insights into the river basin, users’ needs and interests and the role modeling can play in the planning process.
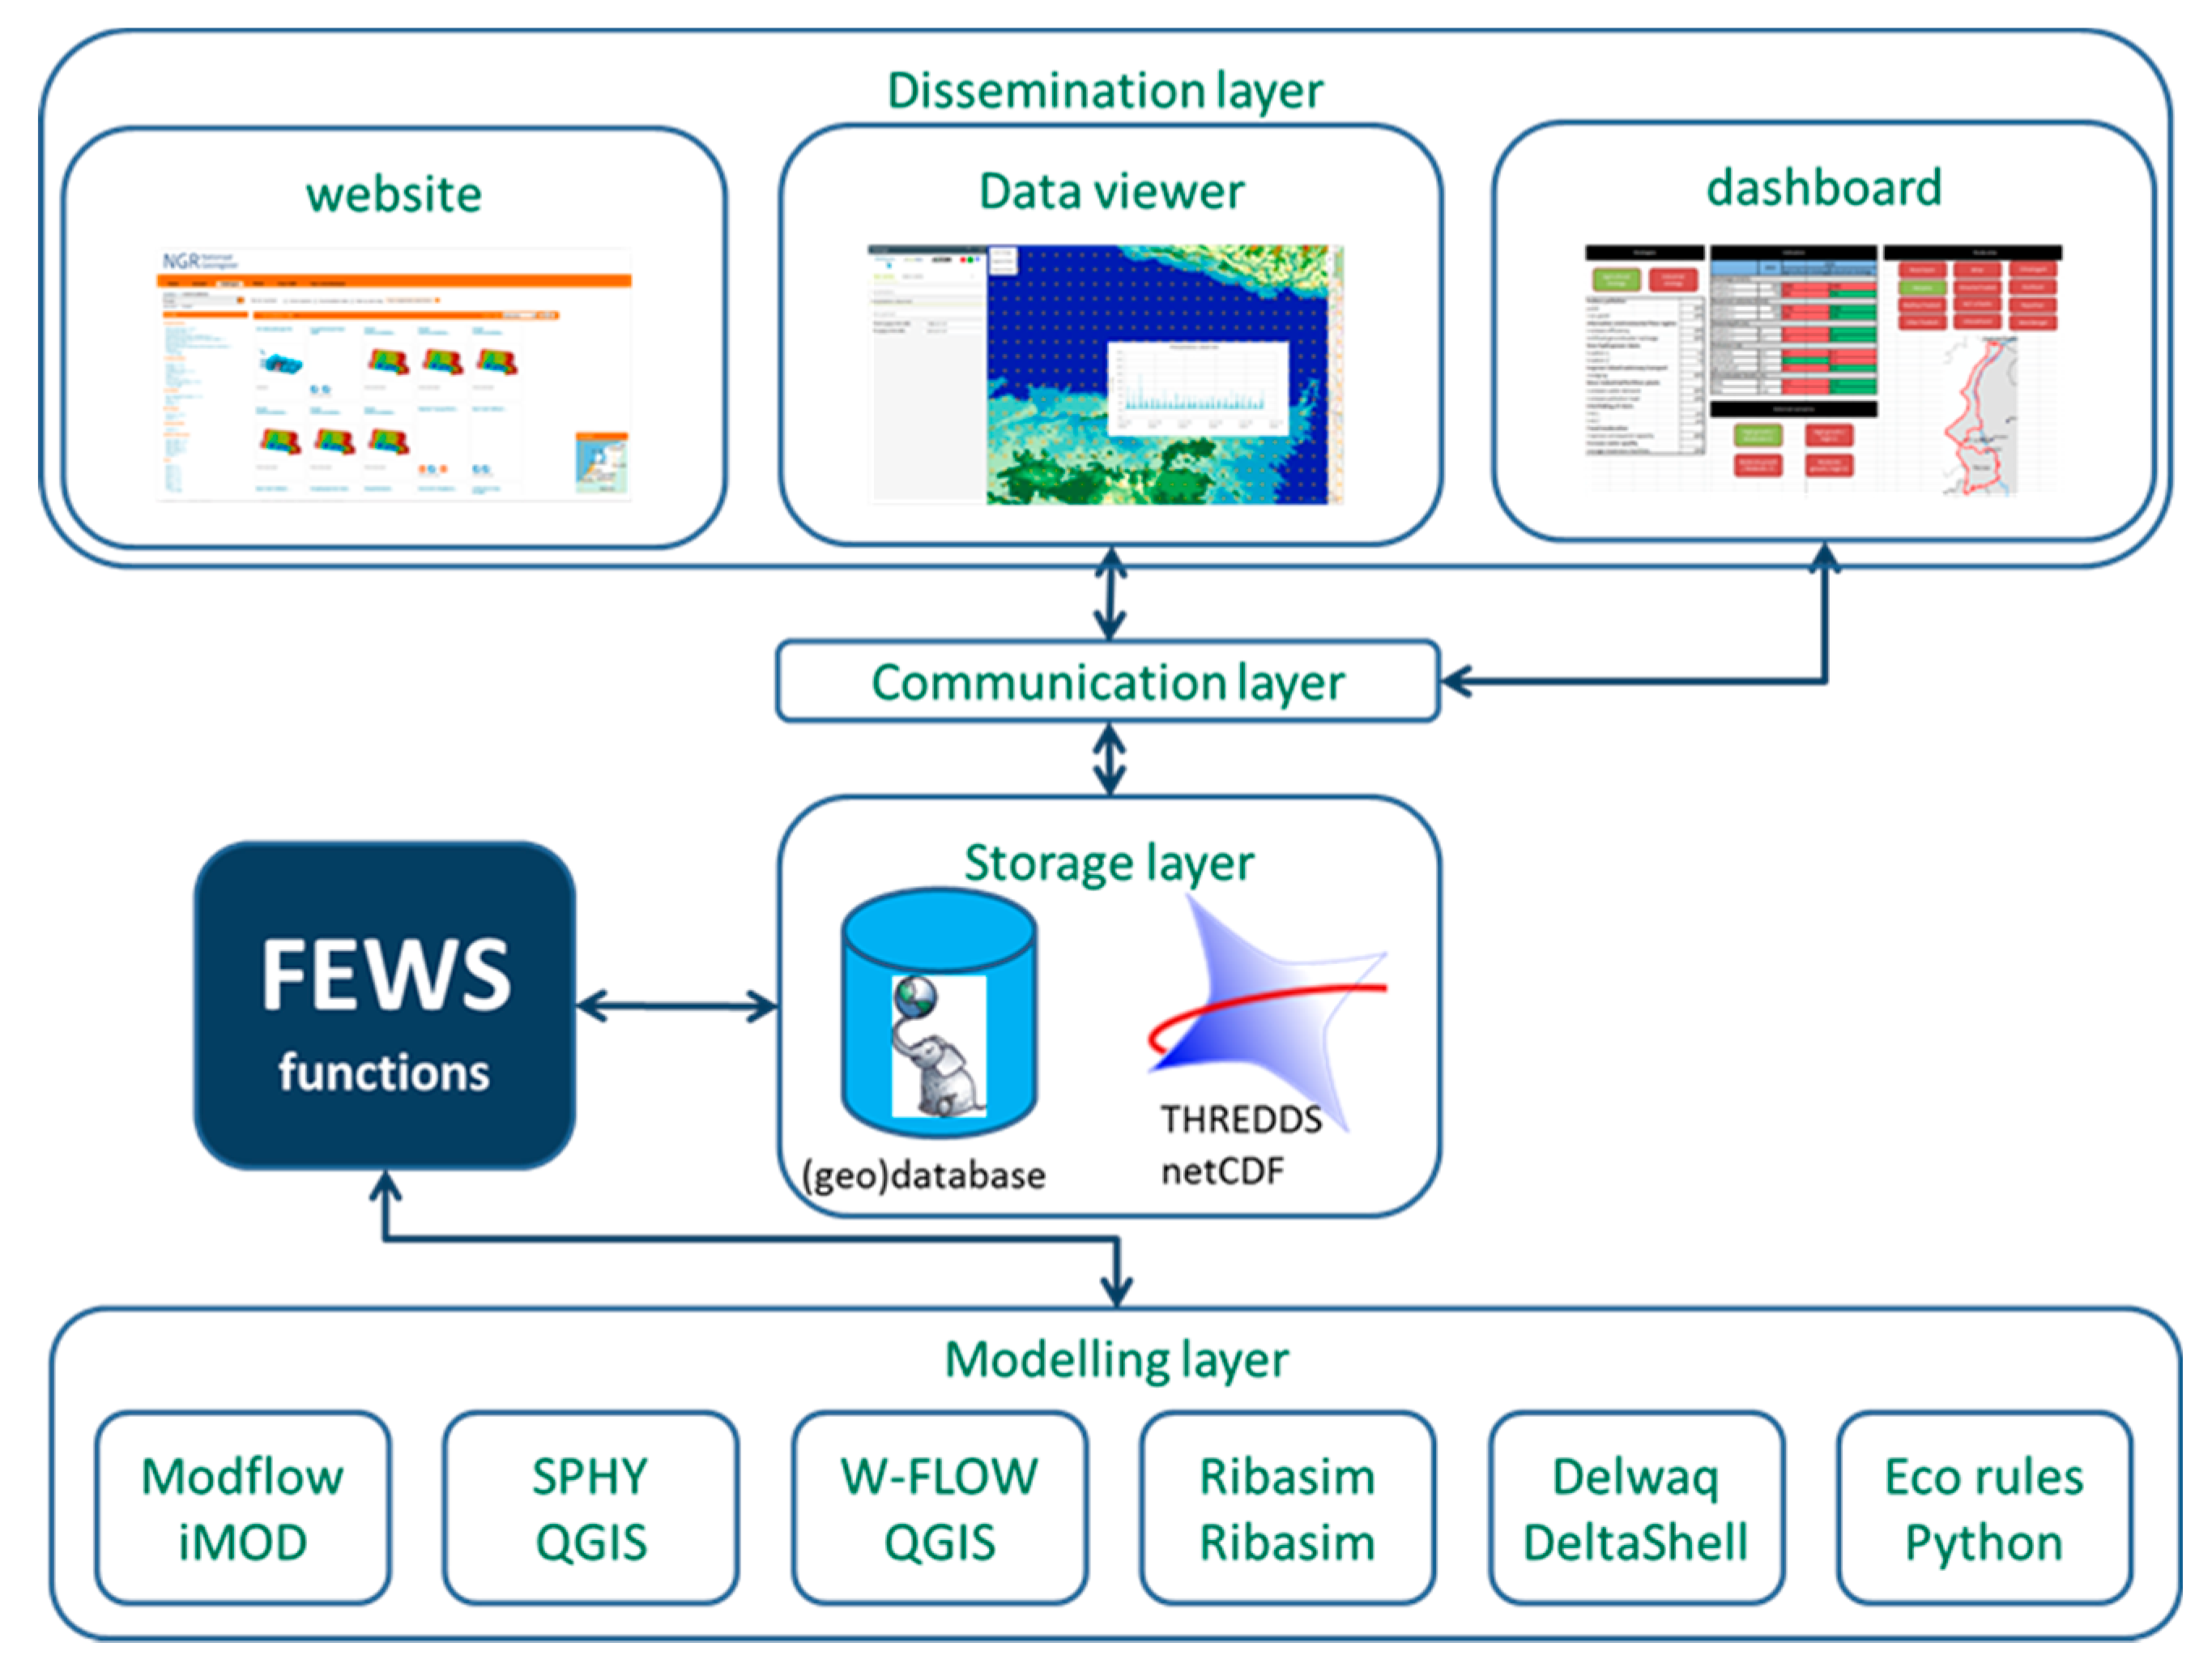
3.1.2. Input to the Dashboard
The interactive workshops in 2016 provided input on the most important problems in the basin and provided data for model development. The workshops paid special attention to identifying indicators relevant for stakeholders. The dashboard is based on the indicators identified through this process. Where indicators were proposed that could not be evaluated using the modeling framework, the participatory process helped to manage expectations.
3.1.3. Use of the Ganga River Basin Model in Workshops
In the third round of workshops in April 2017 participants articulated priority interventions. Group discussions confirmed four potentially effective strategies:
increasing irrigation efficiency
limiting groundwater abstraction
increasing waste water treatment, and
increasing reservoir volume
Demonstration model runs were carried out for the strategies with updated inputs representing the different strategies.
3.1.4. Opportunities for Follow-Up
Following project conclusion, the dashboard and underlying models provide a foundation for coordinated strategic planning in the Ganga Basin. Key to success will be continued stakeholder engagement. In the future, stakeholder engagement could be expanded to include representatives from a wider range stakeholder organizations and community bodies.
3.2. Calibration and Validation of the Ganga River Basin Model
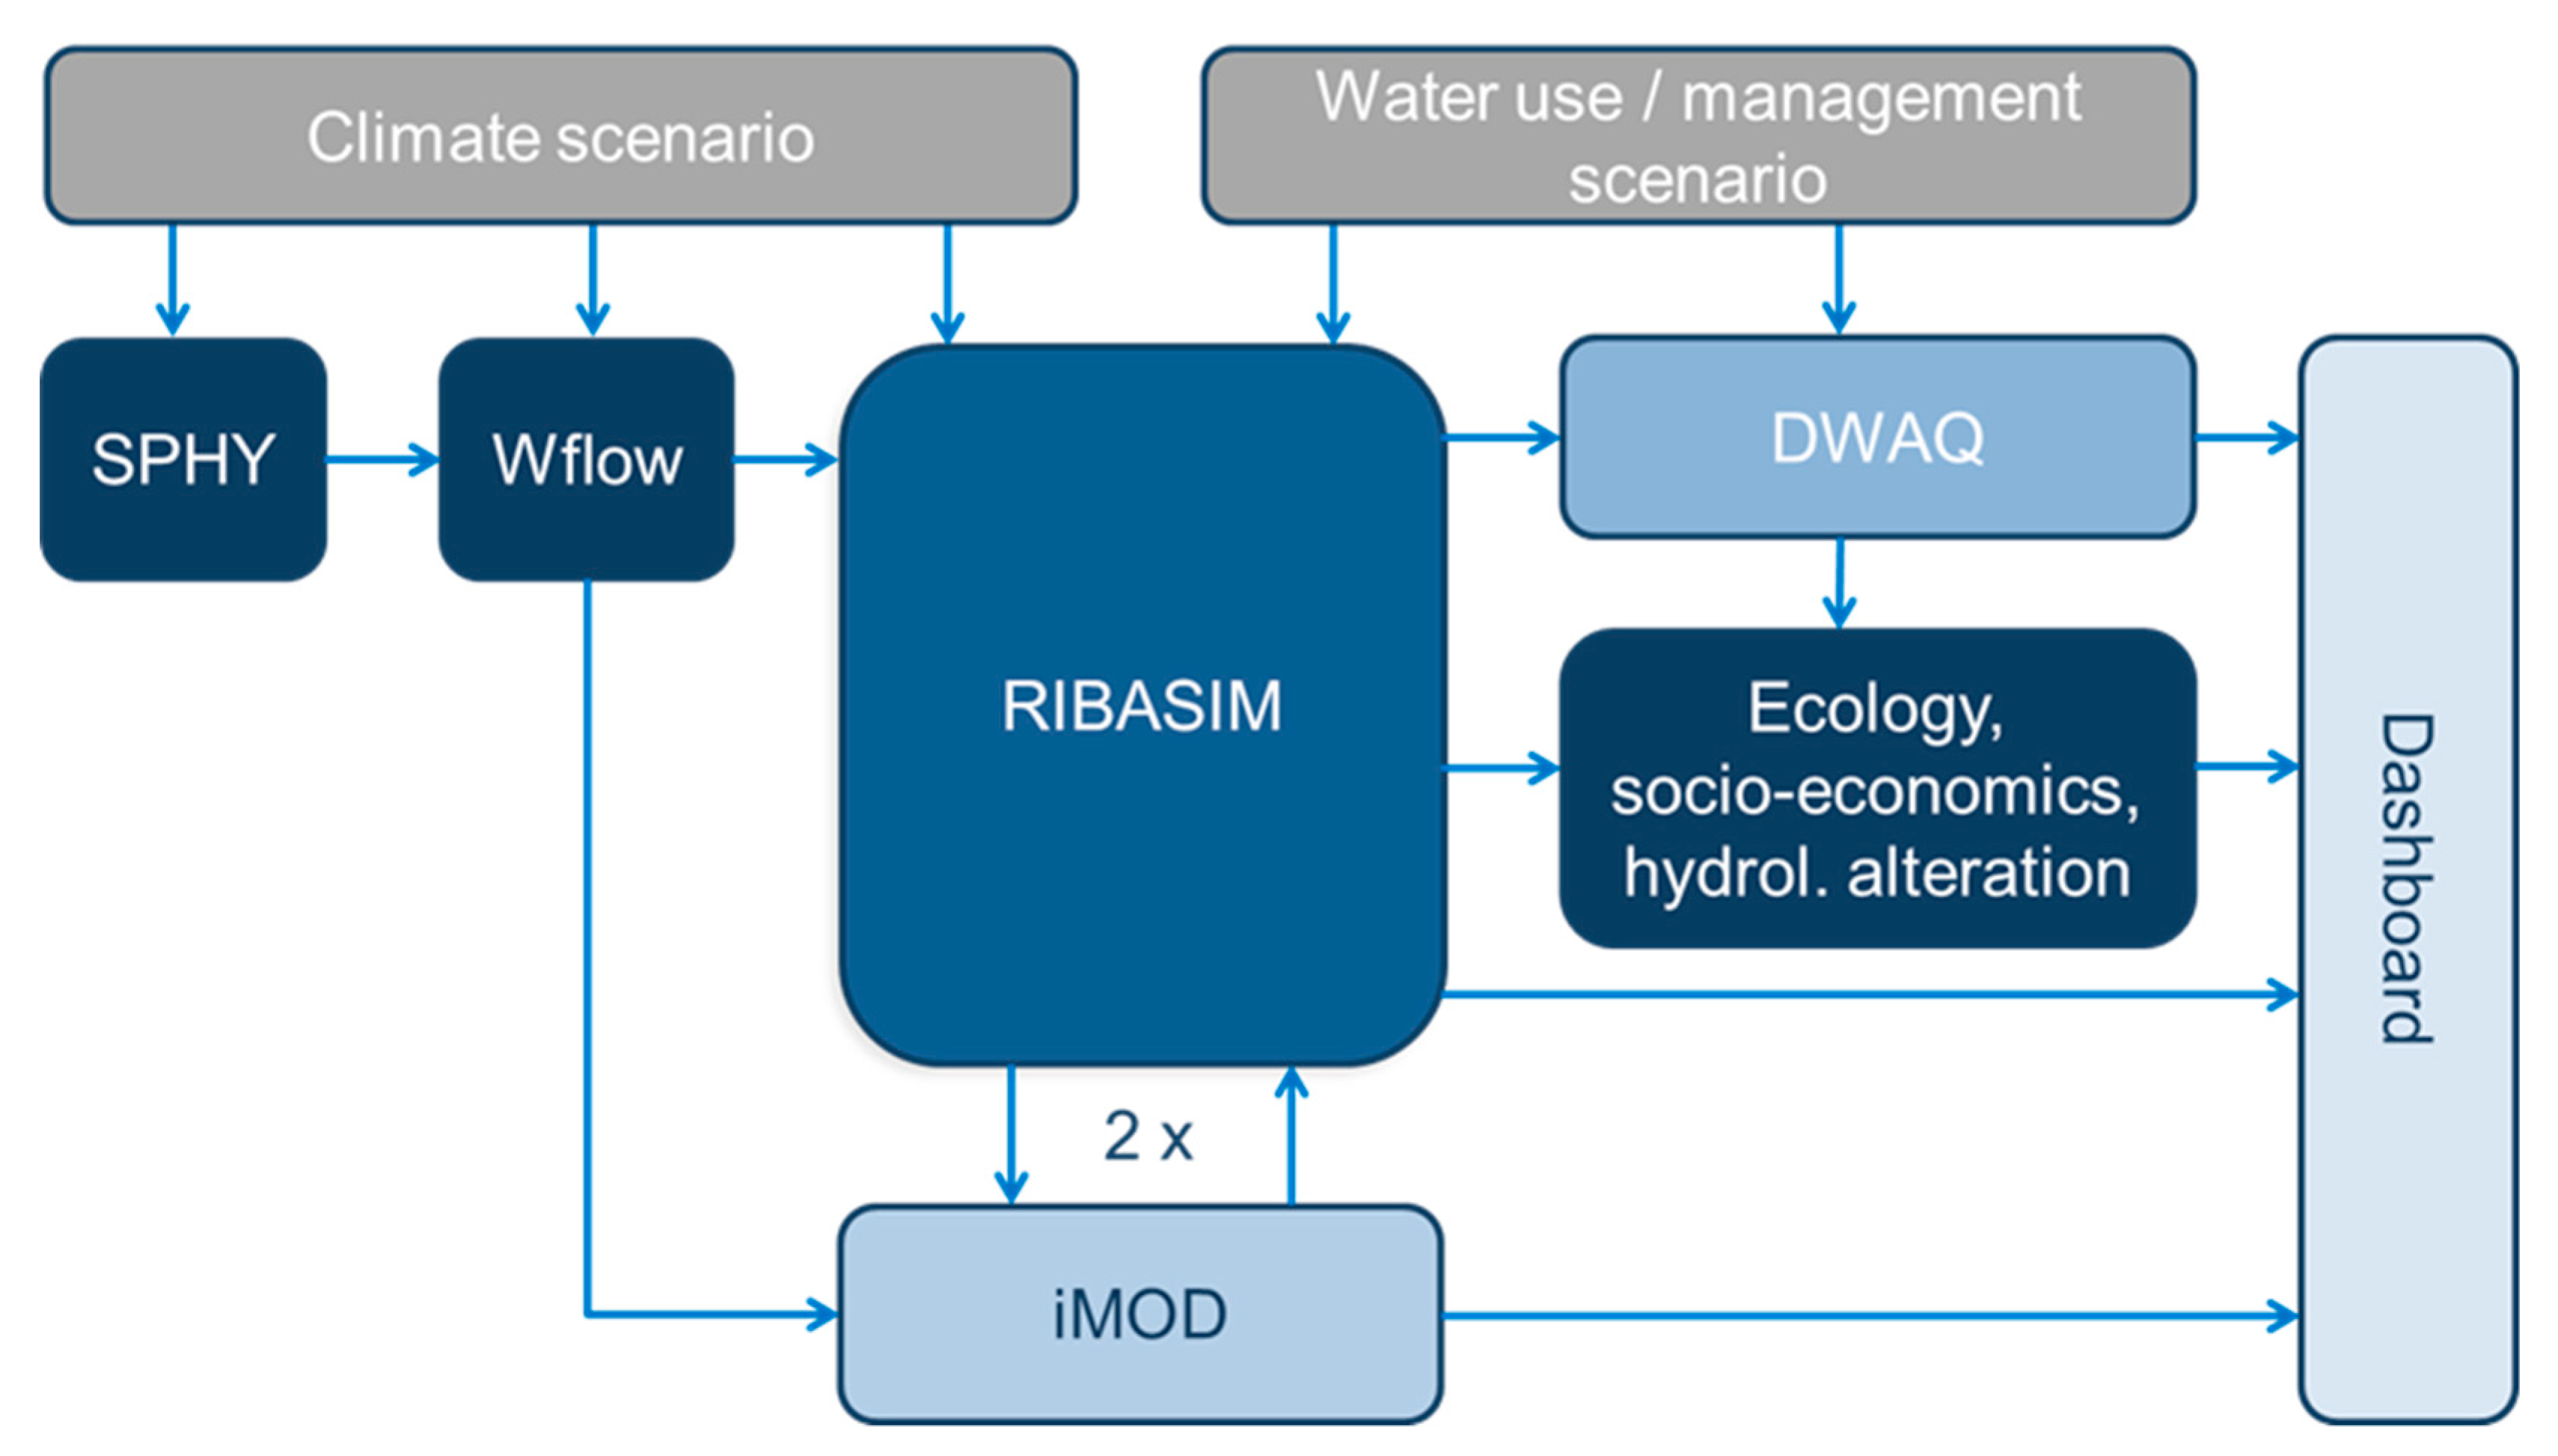
The model components for hydrology, geohydrology and water resources management have been jointly calibrated and validated, as river flows are influenced by water use and water infrastructure operations. Flows were calibrated using 1995–2009 data and validated against 1985–1994 data. Flow calibration and validation focused on the Ganga mainstream and its main tributaries. Calibration and validation data for iMOD were specified by location not time period. The entire calibration process had six steps:
Calibration of SPHY flows at locations in the Himalayan catchments upstream of any significant water demand or water infrastructure;
Calibration of Wflow flows at locations in the catchments outside the Himalayas upstream of any significant water demand or water infrastructure;
Calibration of iMOD groundwater levels with a fixed river water level;
Calibration of pumping capacities for irrigation and public water supply in RIBASIM, using estimates of 2011 annual pumping from CGWB (2014), and where data unavailable using canal capacities, assuming no supply shortages in wetter than average years;
Combined calibration of SPHY, Wflow and RIBASIM using measured river discharges assuming no supply shortages in wetter than average years and zero flux between rivers and the groundwater; and
Combined calibration of SPHY, Wflow, RIBASIM and iMOD using measured river discharges after incorporation of river-groundwater exchanges from step simulation of iMOD.
A complete description of calibration and validation results as well as sensitivity analysis results are in [
5].
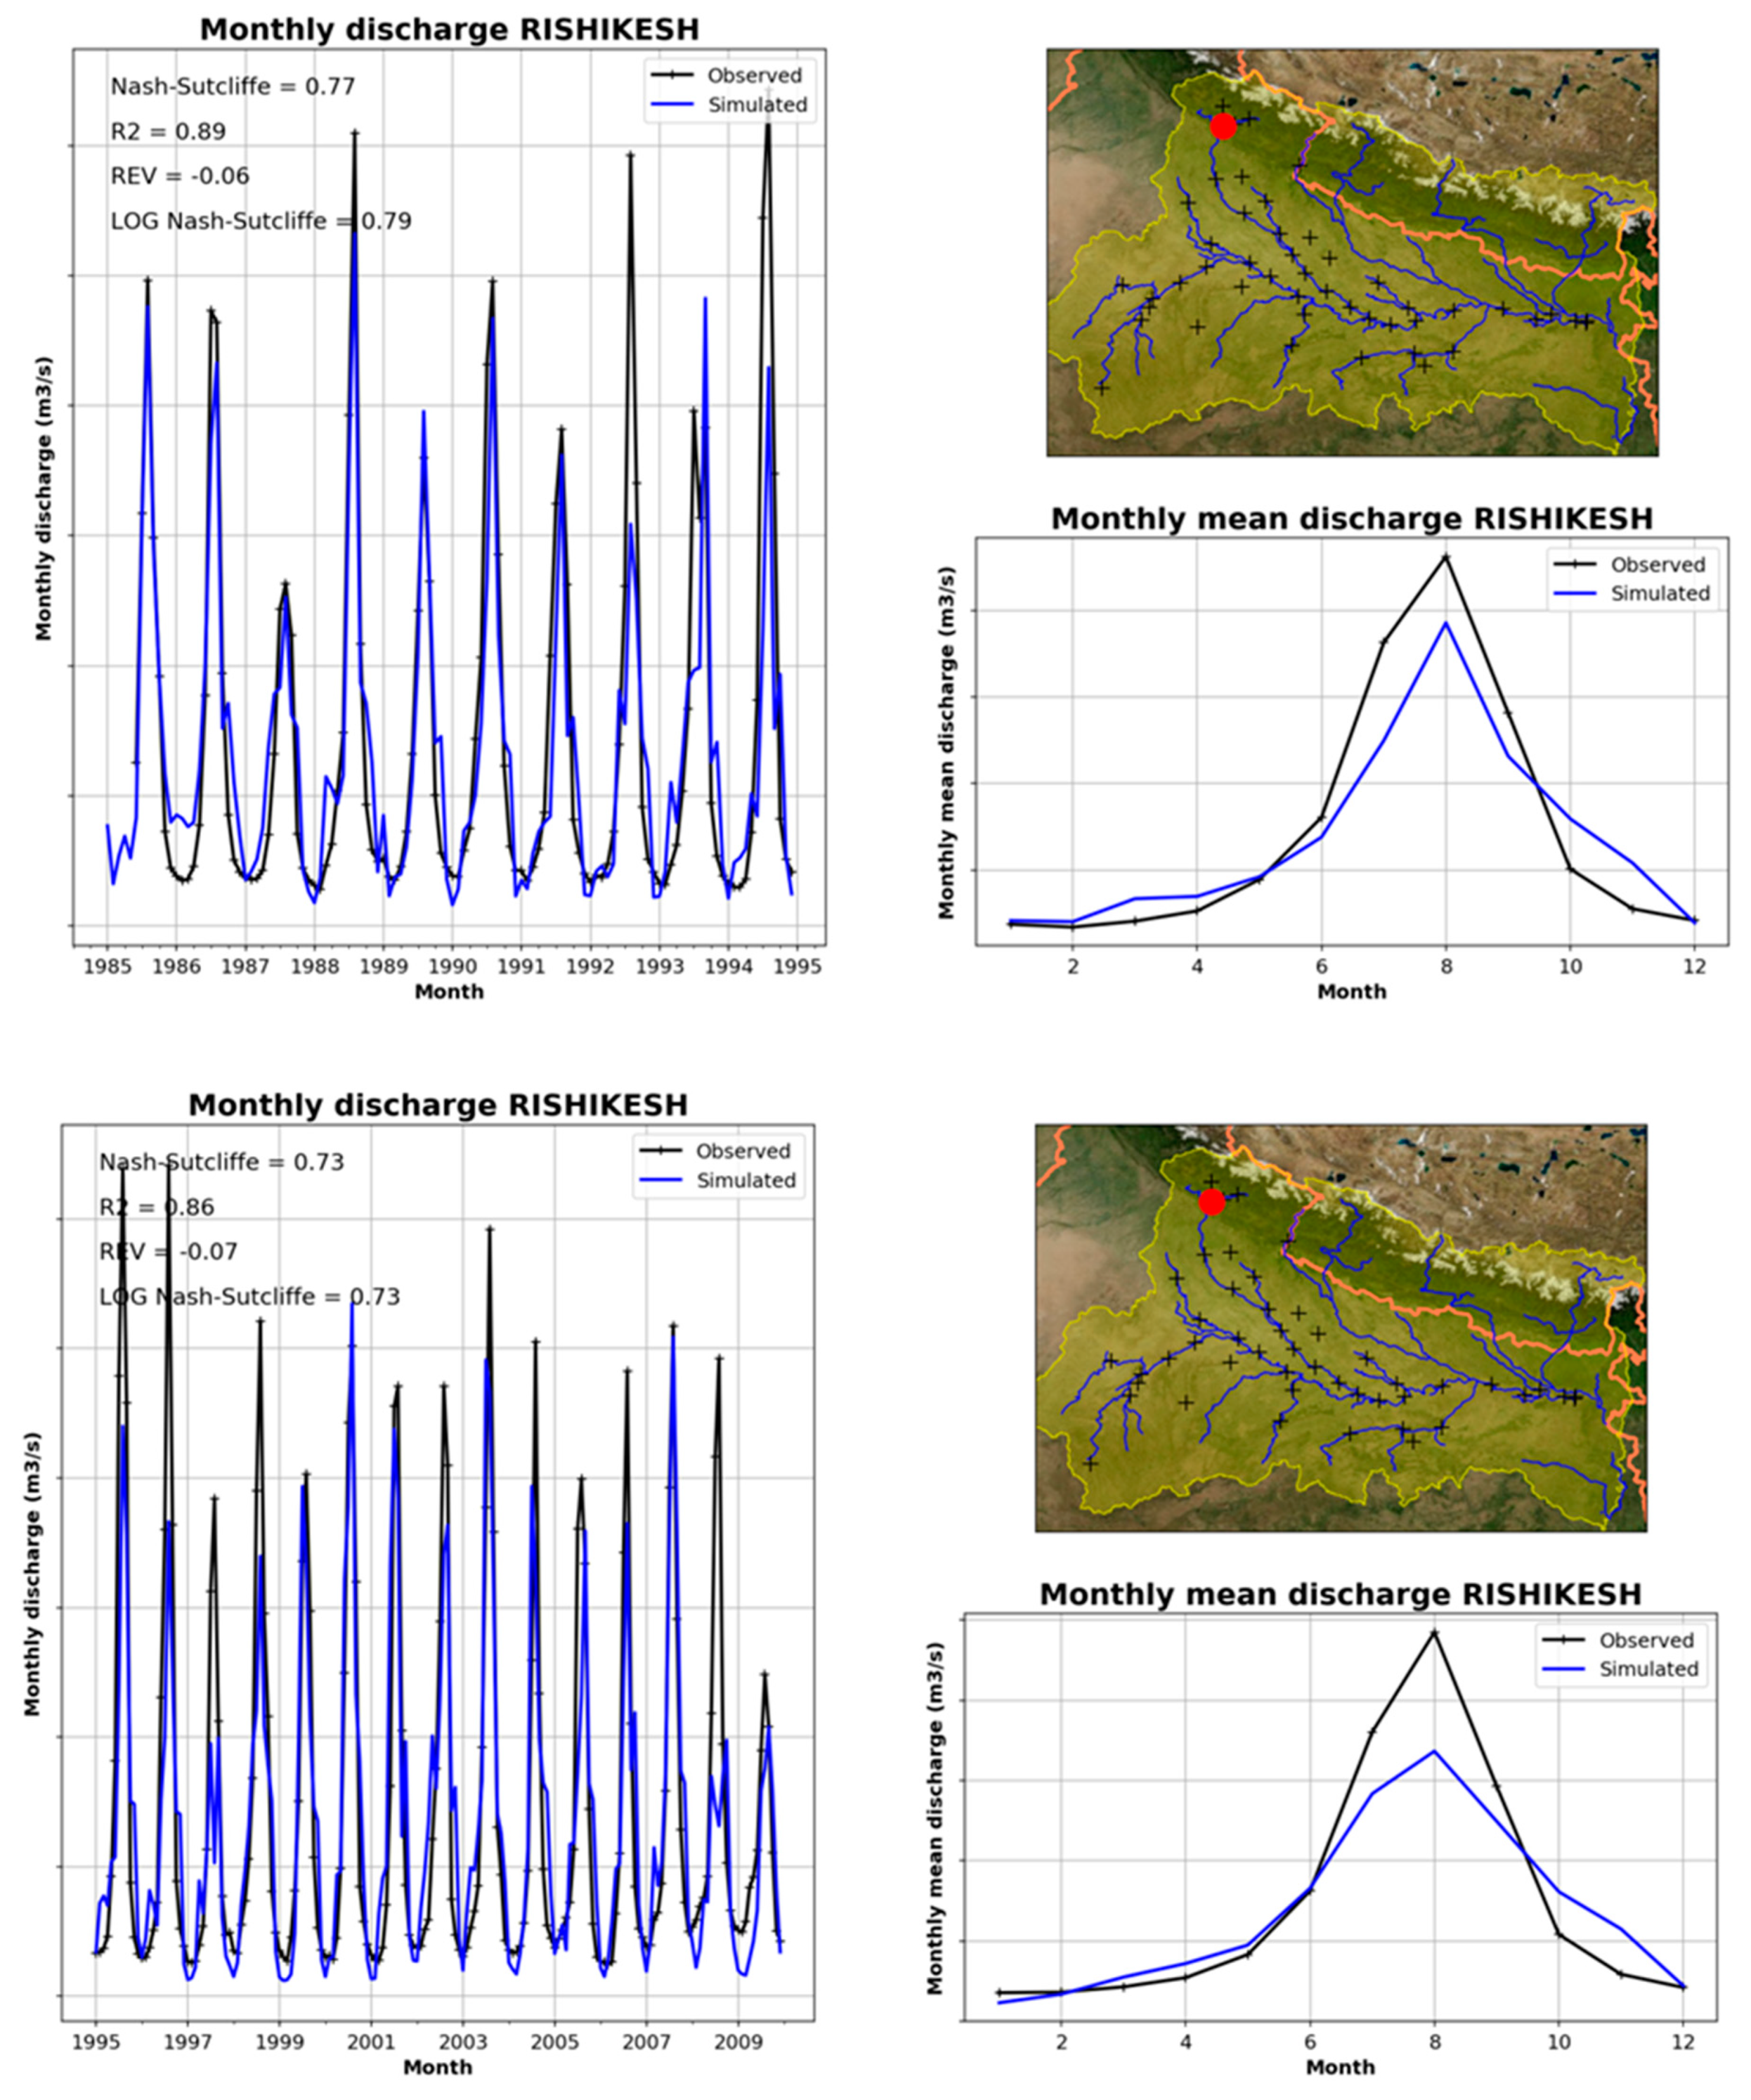
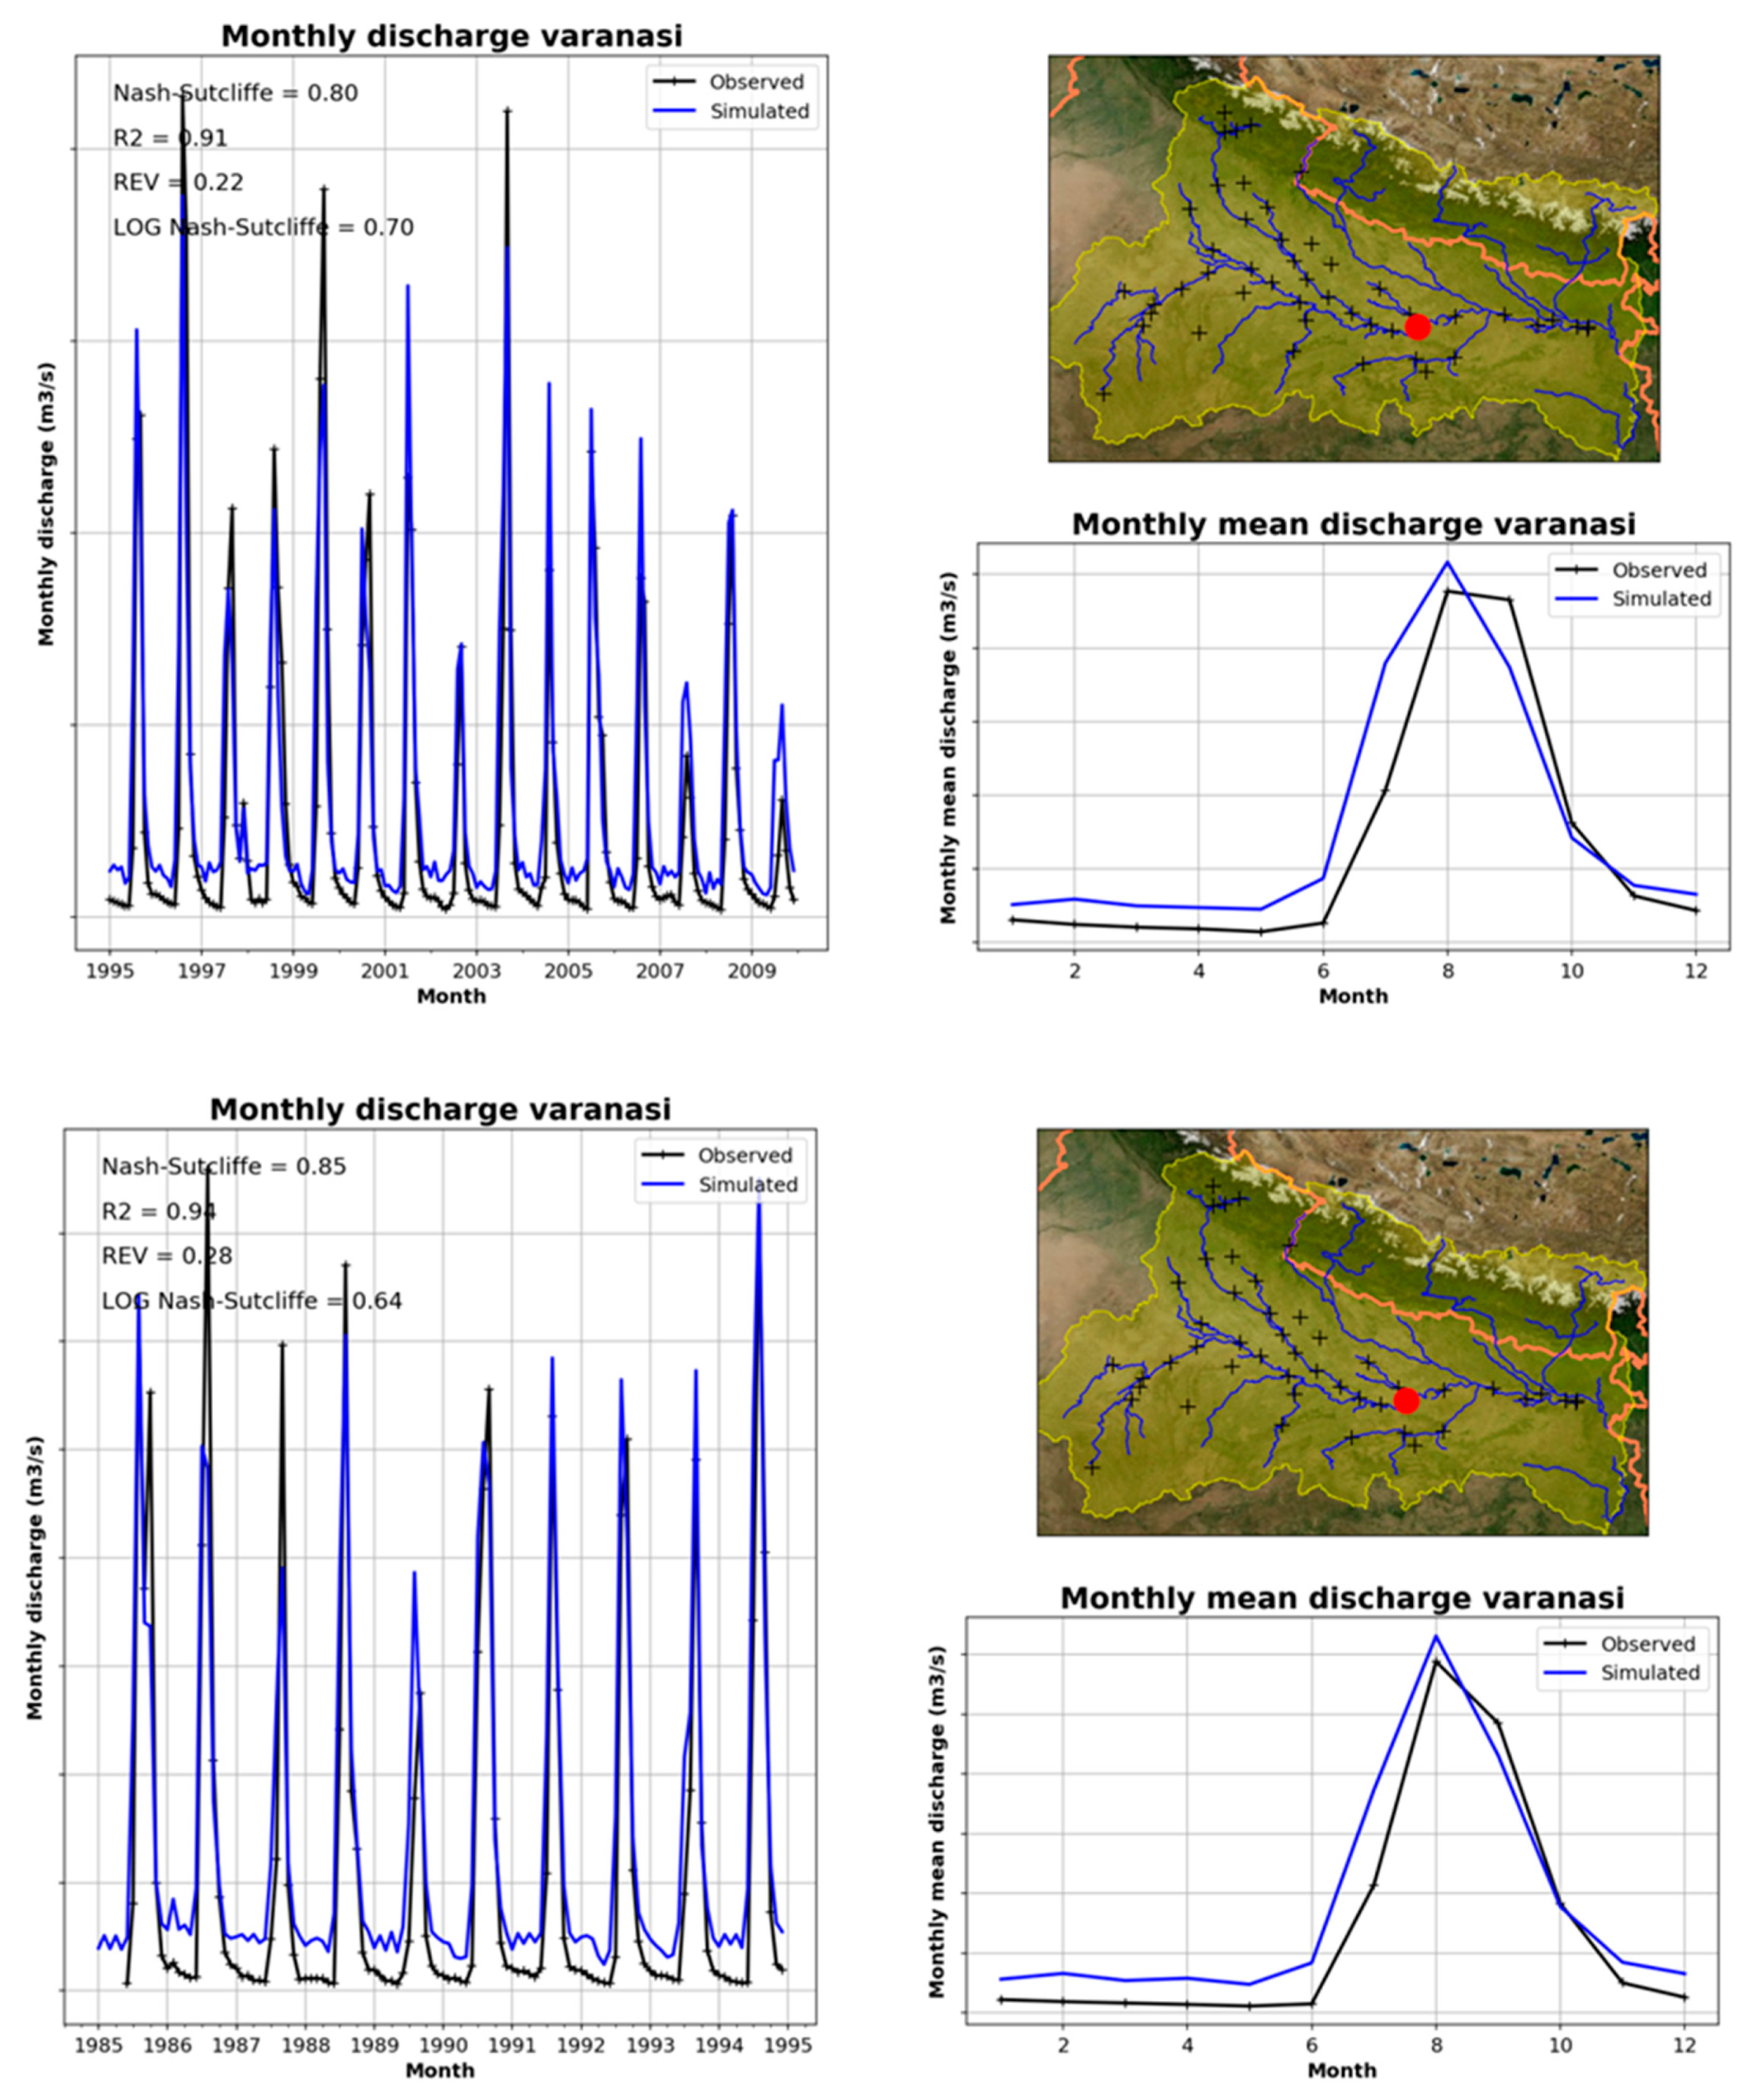
Figure 7 and
Figure 8 show calibration and validation for monthly flows at two locations on the Ganga River. Observed flow data are from CWC. Flow values are omitted in compliance with the Government of India Water Data Policy for classified data.
Figure 7 shows results for Rishikesh, where the Ganga descends from the Himalayas onto the plains. Simulations generally agree well with the measurements but underestimate peak monsoon flows. These peak flows are less important from a water supply perspective, as during the monsoon demands (including to fill storage) are far lower than supply.
Figure 8 shows results for Varanasi, the most downstream location on the Ganga for which data were available. Again, simulations match measurements well, but with an overestimation of dry season flows.
It is difficult to compare the results of model calibration and validation with those of previous studies, since model results of previous studies are only available in the form of reports and since different data were made available to prior studies. Limited availability of measured discharge data within India for the studies reported in [
12,
13] made these studies focus on stations in Nepal. Ref. [
13] reports results for the station Hardinge Bridge in Bangladesh for the period 1998 to 2006. These results show Nash–Sutcliffe efficiency (NSE) coefficients of 0.85 to 0.89, which is comparable to the values presented here for Varanasi (
Figure 8), the most downstream station for which data were available in this study. Ref. [
14] presents NSE and volume bias for simulation results for 1990 to 2004 for a number of stations within India. For Rishikesh an NSE of 0.60 and a volume bias of +30% is reported, which compares unfavorably with the results presented here where NSE of 0.73 to 0.77 and a bias of −6% to −7% were achieved (
Figure 7). There are two more stations both on the Ganga River for which both this study and [
14] reports results: Ankinghat and Kanpur. Both studies show comparable values for the NSE, but the volume bias reported in [
14] is +30%, while our results vary between −18% to −32%.
Overall, the calibration and validation of this study benefited from better data availability than previous studies. As far as results can be compared, the hydrological results of the Ganga River Basin Model appear to be comparable to the results of previous studies and sometimes represent a slight improvement.
3.3. Assessment of the Impact of Scenarios and Strategies
Herein, the term scenario describes developments that impact water resources, but that are outside the direct influence of water managers (e.g., population growth or climate change); and the term strategy describes a combination of interventions designed to address current or future management issues. The effectiveness of strategies can be assessed for different scenarios.
Except for the present scenario, all scenarios are based on assumptions or projections and are, therefore, uncertain. The ‘pristine’ scenario describes the basin without water resource development. Other scenarios describe possible futures for around the year 2040. All include increases in domestic, industrial, and agricultural water demand. Three climate change futures are considered: no climate change, climate described by the Intergovernmental Panel on Climate Change (IPCC) Representative Concentration Pathway (RCP) 4.5 scenario and climate described by the IPCC RCP8.5 scenario.
Based on stakeholder inputs, strategies were developed that could be implemented in combination or separately:
Business as Usual (BAU): No changes in water resources management.
Approved Infrastructure (Appr.Inf): Implementation of infrastructure projects approved as of early 2018.
Inter-Basin Transfer Links (IBTL+): Implementation of the main proposed inter-basin transfers relating to the Ganga Basin.
NMCG Planned Treatment (Pl.tr): Implementation of the additional treatment plants planned by National Mission for Clean Ganga (NMCG).
Improved Treatment (Imp.tr): All planned wastewater treatment plants implemented and fully operational, and rural wastewater impact reduced by additional treatment.
Increased Irrigation Efficiency (Eff): Surface water irrigation efficiency increased from 40% to 48% and groundwater irrigation efficiency increased from 70% to 74%.
Conjunctive Use (Conj.use): Groundwater abstraction reduced by 50% at over-extracted nodes. (Six nodes are over-abstracted in the present scenario and 12 nodes in the 2040 scenarios).
E-Flow (e-flow): Minimum flow forced to 40% of pristine flow for each month, whenever possible.
Most strategies can be scaled to increase their impact.
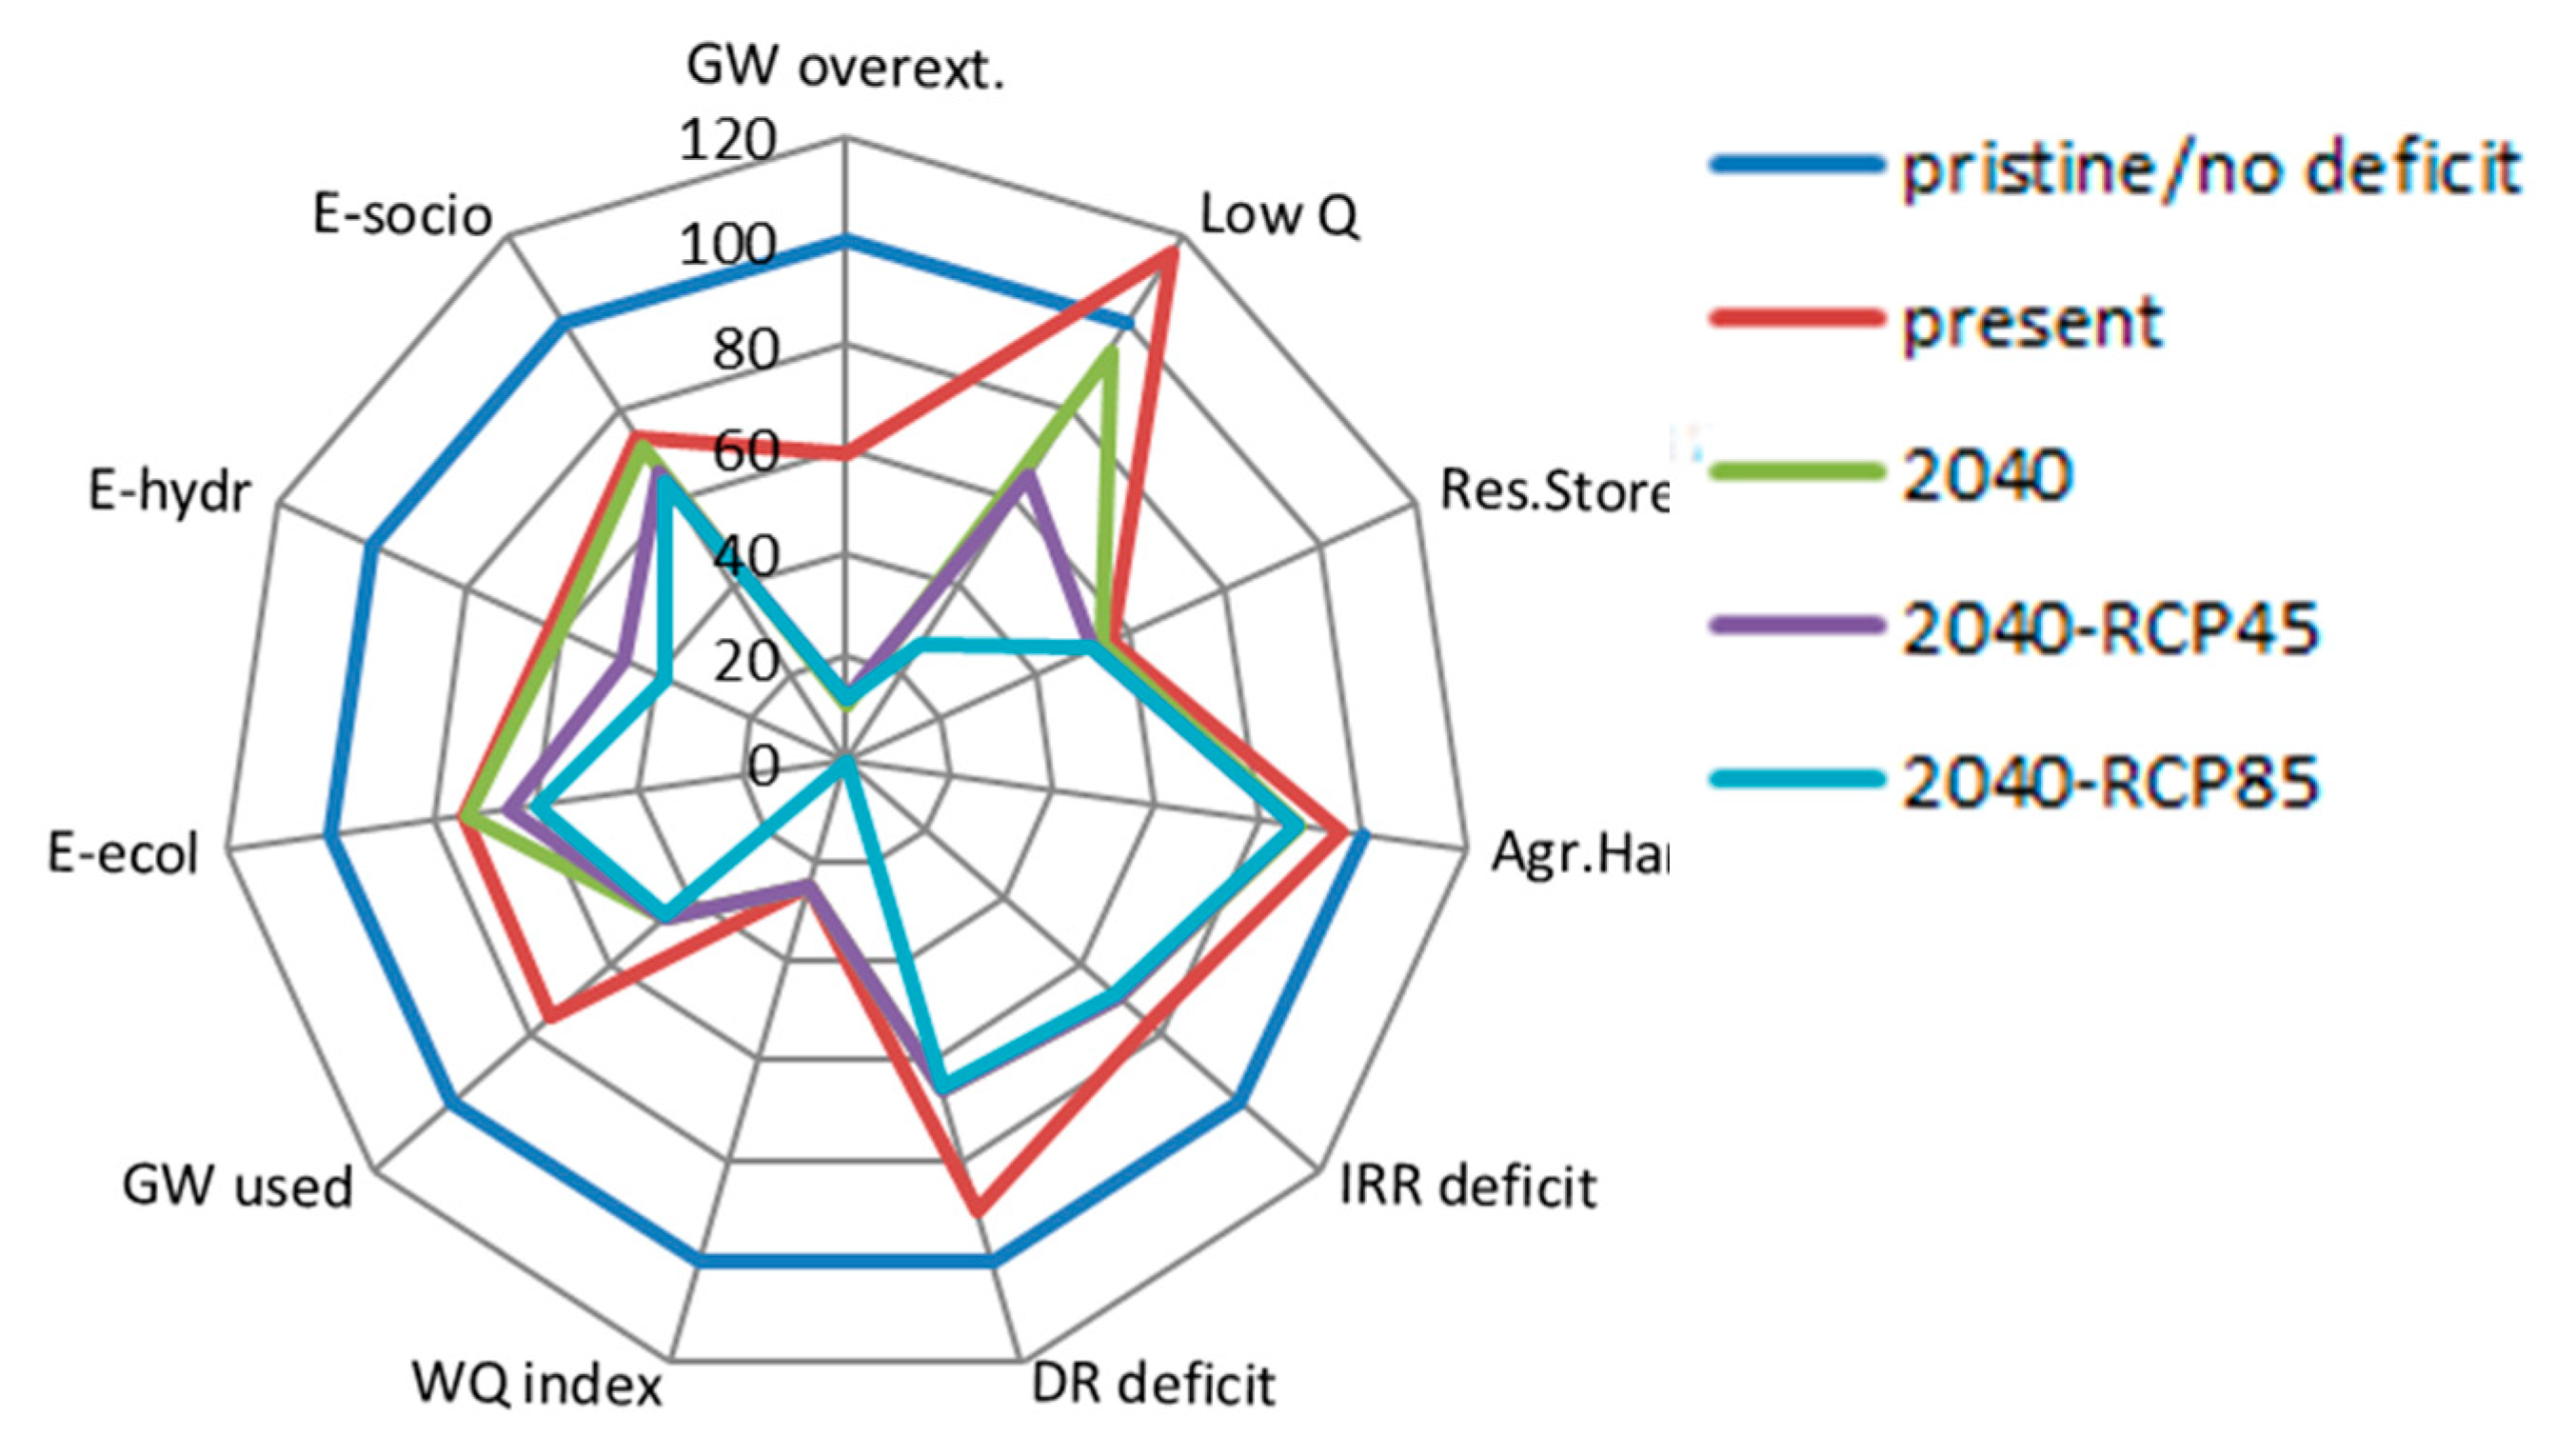
Figure 9 shows basin-wide indicator values for the modelled scenarios. Impacts are most visible in the hydrological indicators: areas with critical groundwater use increase significantly, and the lowest dry-year river discharge diminishes significantly. The e-flow indicators differ significantly from the pristine condition, however, there are only small differences in e-flow indicators between future scenarios. Scenario assessments (without management interventions) indicate a significant decrease in future water availability, water quality and ecological status. Changes are mainly caused by socio-economic factors, not climate change.
Given the significant potential degradation by 2040, it is informative to evaluate the effectiveness of strategies proposed by stakeholders.
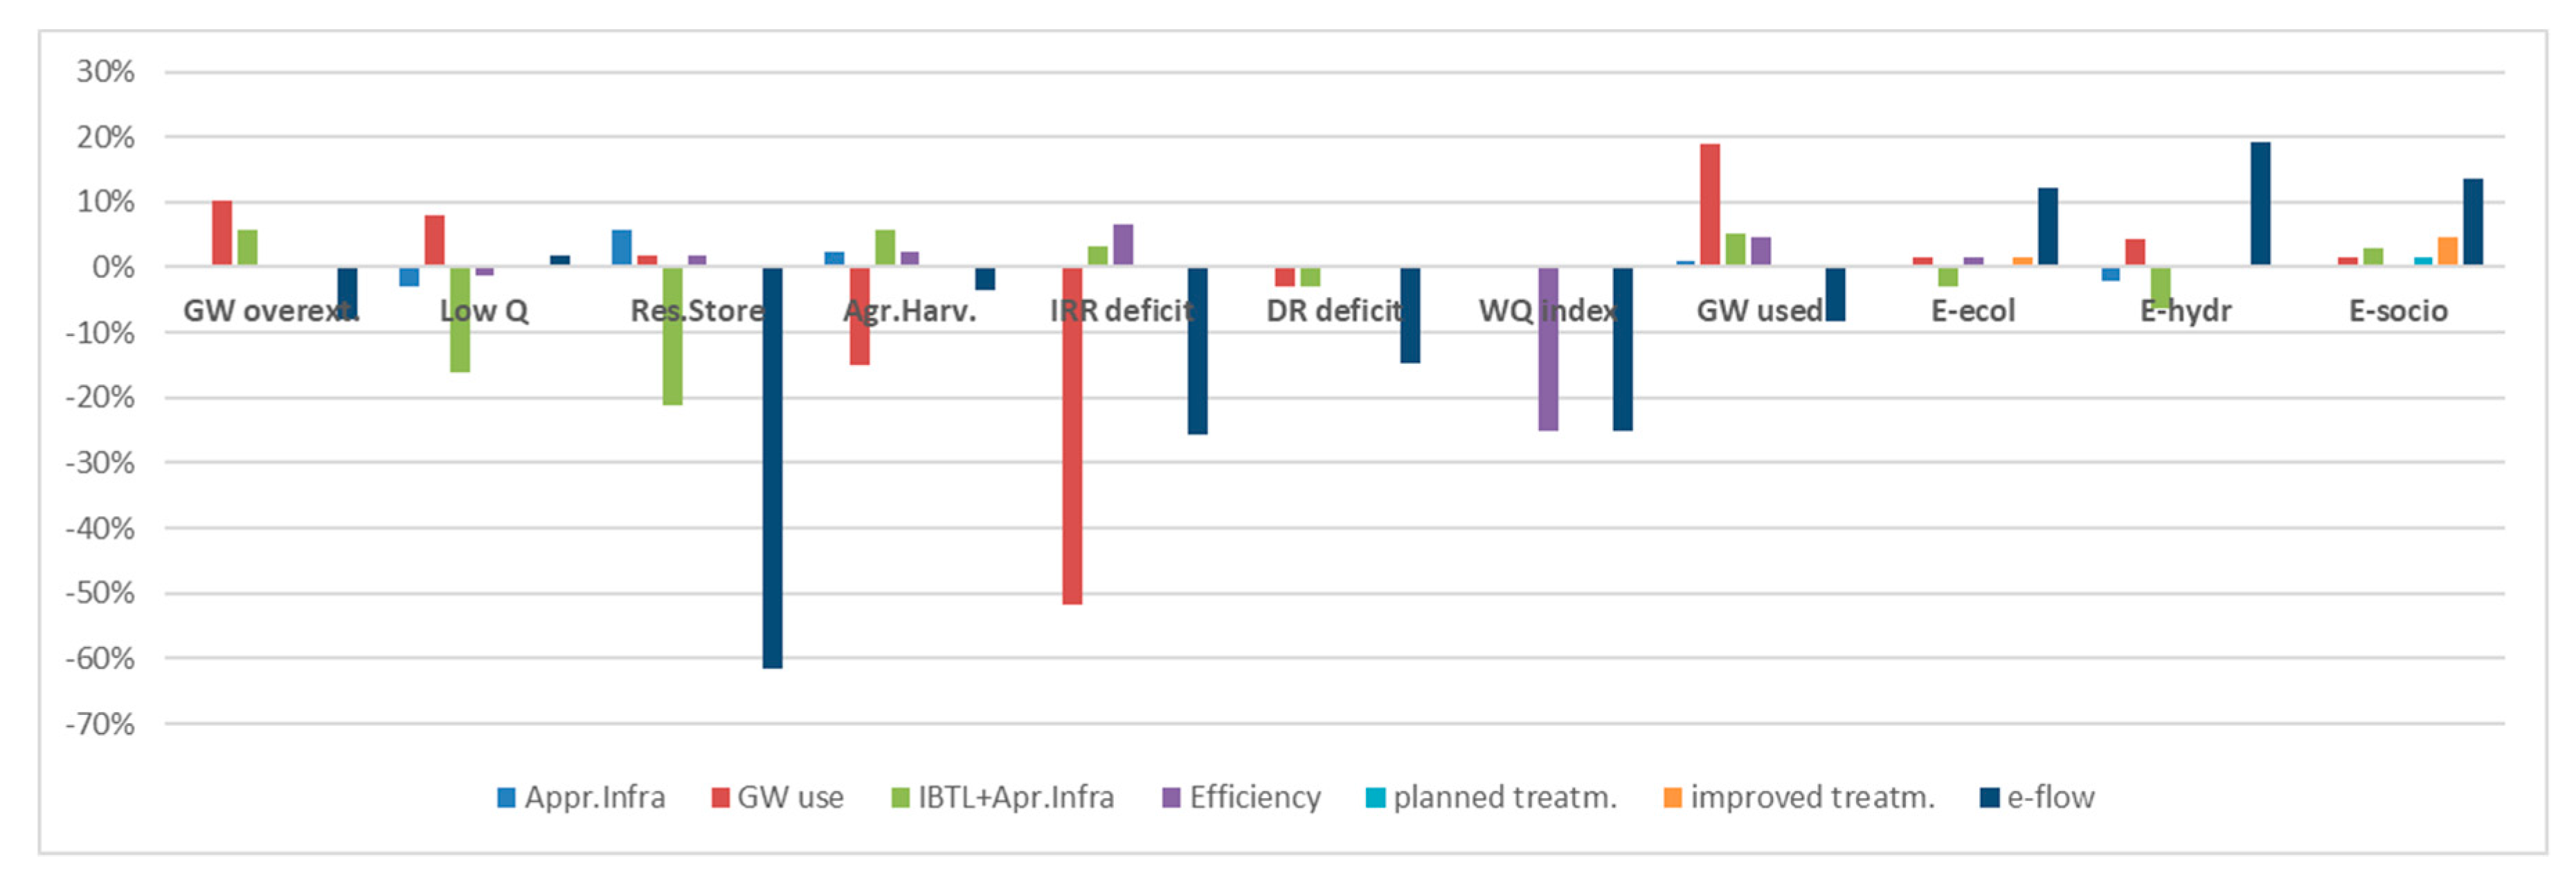
Table 6 and
Figure 10 show indicator scores for individual strategies under the IPCC 2040_RCP4.5 scenario. If multiple strategies were combined, a greater response would be expected. Details of the assessment are available in [
7].
4. Discussion
The scenario assessments indicate significant degradation from the pristine condition. During part of the year a large fraction of the flow is diverted to canals, sometimes reducing flow in the river to almost zero. Groundwater levels have changed significantly. Flows in the shallow aquifers in the Ganga plains now entirely reflect anthropogenic influences. Water quality has been severely degraded by liquid and solid waste discharges into the river and its tributaries. It is the first time that these findings can be based on comparison of model results for the actual situation with a pristine scenario.
Model results suggest significant additional degradation in water availability, water quality and ecological status will occur in coming decades in the absence of strong management intervention. A new finding from the scenario analysis is that degradation will be mainly caused by socio-economic factors, not climate change. The projected significant increases in water demand by 2040 will mainly affect groundwater, because most available surface river water is already used. Scenario results show that drinking water and irrigation water deficits will increase, and water quality will further deteriorate. Despite considerable data uncertainty, climate change is expected to affect water demand more than water availability.
Results of the analysis show that there is no single simple intervention to address the multiple pressures on the Ganga. A combination of interventions is required. However, the suite of currently considered interventions, which would require huge investment and face significant technical challenges and stakeholder opposition, will not adequately address the future challenges of water availability, water quality and ecology. Indeed, they will not even address the current severe pressures on the river system. This is an important new finding of this study.
The intervention with the greatest potential benefits is further improvement of municipal wastewater treatment. Whether centralized or decentralized, high- or low-technology, greater reduction in pollution improves downstream water quality, improves ecosystem services, and reduces water-related illnesses and deaths. The next most important intervention is an increase in water-use efficiency, especially in irrigated agriculture. Increased efficiency will not immediately increase water availability; however, irrigation deficits may be reduced. This means greater agricultural production for the same level of irrigation withdrawals.
Model results show that water availability in the basin will be insufficient to meet projected future demands and that there are no easy technical solutions. Many interventions that are beneficial for one sector or outcome show negative effects for others.
The results of the scenario analysis show that ambitious strategies are needed to reduce demands across all sectors and that trade-offs need to be made between sectors. The agricultural sector will need to adapt to lower water availability in terms of crop choices, planting seasons and irrigation efficiency. Farmers will need to develop flexible approaches, choosing irrigated or non-irrigated crops depending on monsoon rainfall. This will affect agricultural production and sector employment.
Without coordination and careful balancing of interests, expensive interventions may fail, wasting scarce financial resources. The absence of a functioning water-resources management governance structure in the basin aggravates the challenges the basin is facing. Although not as a result of the presented study, the authors recommend from global experience that a basin management organization with a legal mandate to work across state boundaries is needed to plan the strategy and implement it.
The consequences of the conclusions presented above are far-reaching and will involve many departments and ministries beyond just water resources. Non-technical interventions, including incentives to change cropping patterns and to reduce water use, are required. Fundamentally, the focus will need to shift from more “crop per drop” to more “jobs per drop”. Service and industrial sectors consume far less water per employment generated, supporting greater growth.
The participatory approach to prepare and apply an integrated river basin model as presented in this paper has potential to support improved strategic planning for the Ganga Basin as shown by the results for the scenario and strategies presented. A similar approach can also have added value to support strategic planning for other large river basins in South Asia and the rest of the world. The components of the integrated model should then be modified to reflect the river basin, the issues and the possible interventions.


