Article

The Influence of Rainfall and Land Use/Land Cover Changes on River Discharge Variability in the Mountainous Catchment of the Bagmati River

School of Earth and Planetary Sciences, Curtin University, Bentley, Perth, WA 6102, Australia
*
Author to whom correspondence should be addressed.
Water 2019, 11(12), 2444; https://doi.org/10.3390/w11122444
Submission received: 11 September 2019 / Revised: 31 October 2019 / Accepted: 19 November 2019 / Published: 21 November 2019
(This article belongs to the Section Hydrology)

Abstract

:
Changes in rainfall and land use/land cover (LULC) can influence river discharge from a catchment in many ways. Homogenized river discharge data from three stations and average rainfall records, interpolated from 13 stations, were examined for long-term trends and decadal variations (1970–2017) in the headwater, upper and middle catchments of the Bagmati River. LULC changes over five decades were quantified using multitemporal Landsat images. Mann–Kendall tests on annual time series showed a significant decrease in river discharge (0.61% per year) from the entire Bagmati catchment, although the decrease in rainfall was statistically insignificant. However, declines in river discharge and rainfall were both significant in upper catchment. Decadal departures from long-term means support these trend results. Over tenfold growth in urban area and a decrease in agricultural land were observed in the upper catchment, while forest cover slightly increased in the entire catchment between 1975 and 2015. Correlation analysis showed a strong association between surface runoff, estimated using the curve number method, observed river discharge and rainfall in the upper catchment, while the relationship was weaker in the headwater catchment. These results were also supported by multiple regression analysis, suggesting that human activities together with climate change have contributed to river discharge changes in the Bagmati catchment.

Graphical Abstract

1. Introduction

Atmospheric and ocean temperatures are rising at an unprecedented rate and the rise is projected to continue during the 21st century [1]. This warming can alter rainfall patterns, including the frequency of extreme precipitation/drought events, evaporation and total runoff patterns, and hence, the availability of water resources [1,2]. Despite general agreement on increasing temperature, changes in rainfall and runoff can vary widely from one region to another [3,4,5]. For example, the Nile River showed a decreasing discharge in the 20th century [6], while high summer precipitation and rainstorms are linked to increased summer discharge and floods in the lower Yangtze River basin [7]. Nakaegawa et al. [4] projected the Amazon River to have increased discharge during the rainy season while it may decrease in dry season. In the Ganges basin (of which the Bagmati catchment forms part), some studies have predicted increasing monsoon discharge [8,9], while others suggested a likely decrease of annual and monsoon discharge [10,11].
In addition to climate change, land use/land cover (LULC) changes can increase the uncertainty of hydrological variability within a catchment as a result of changes in surface runoff, natural recharge processes and evapotranspiration [12,13,14]. Based on a review of 94 catchments across the world, Bosch and Hewlett [15] suggested that clearing of forests increases river discharge while recovery of vegetation or afforestation decreases the discharge. Growth in urban areas can increase surface runoff while evaporation and ground water recharge may have varying response [16,17]. Increasing river discharge is also linked with expansion of agricultural land and decrease in shrubs and forests [18,19]. In the Ganges basin, natural and climatic variability in precipitation and river discharge are further affected by rapid population growth and subsequent LULC changes, including urbanization and deforestation [20]. Nevertheless, a few studies also reported no significant changes in rainfall, evapotranspiration and river discharge in relation to forest-cover changes [21,22].
Within Nepal, significant LULC changes have occurred, especially with conversion from forest to agriculture. Forest cover in Nepal decreased from 45% in 1966 to 29% in 1994 [23,24]. However, recent forest assessments over 20 districts of Terai region suggest that, the rate of decrease has slowed down to 0.06% per year during 1990–2010 [24]. Forest conditions are estimated to be improving with community-based forest management and government regulations [23,24,25]. However, increasing frequency of weather-related extreme events in the region [26] such as excessive rainfall, long drought spells, landslides and floods have already had negative impacts on agriculture, forestry and biodiversity in Nepal [23].
The Bagmati River is not only important in relation to the initial settlement of Kathmandu valley, its tributary systems are also crucial for meeting the water demand of millions of people living in Kathmandu Valley and its downstream region [27]. In fact, per capita water availability in the catchment is one of the lowest in the country [28] and pressure on water resources is growing consistently due to high population growth [29,30].
Chalise et al. [31] examined a method to estimate low flow in the mountainous regions and also attempted to estimate runoff for ungauged areas of Nepal based on 52 mountain catchments. Bohlinger and Sorteberg [32] found both increasing and decreasing trends in monsoon rainfall, and spatial variation in the occurrence of extreme events across Nepal. Studies conducted in different catchments of the country (e.g., [33,34]) suggest that changes in rainfall and river discharge are different from place to place. Analyzing rainfall and river flow regimes in eight different river basins of Nepal, Hannah et al. [35] found no clear spatial pattern though the relationship between rainfall and river discharge varied based on basin characteristics, including LULC. Various LULC maps of Nepal have been prepared for 1978, 1986, 1994 and 2010 [36,37,38] while some have focused on mapping LULC of Kathmandu valley [39,40]. However detailed comparisons of LULC based on such results are difficult, due to the use of different methods. Some studies have modelled future water availability under various climate change scenarios for some mountain catchments located in different parts of Nepal [41,42]. Considering local variabilities in topography, precipitation and river discharge patterns, there are significant limitations in generalizing the results of macro level studies or inferring from studies of nearby catchments [35].
Few studies have analyzed the rainfall and/or river discharge of the Bagmati River catchment. Based on a hydrological model calibrated with 1999–2001 data, Babel et al. [43] predicted increasing annual precipitation in the Bagmati catchment. Based on Thiessen polygon interpolation of 1981–2008 data, Shrestha and Sthapit [44] found increasing rainfall in the Bagmati catchment with higher chances of future flooding during monsoon. Dhital et al. [45] analyzed data from 1980 to 2009 to estimate seasonal trends of temperature, precipitation and river discharge in the larger Bagmati catchment that includes the lower catchment in Terai region as well. Dhital and Kayastha [46] and Dhital et al. [47] performed frequency analysis of high rainfall and peak flood events in the Bagmati catchment. Examining monthly discharge between 1965 and 2000 with regression analysis, Sharma and Shakya [28] found decreasing monsoon discharge in the Bagmati catchment. These studies, however, have not provided detail on spatial variability within the catchment. Rainfall variability at individual stations were analyzed by Tuladhar et al. [48]. However, comprehensive studies analyzing the association between rainfall, LULC and river discharge changes are lacking, and this study aimed to fill this void. Considering multi-decadal fluctuations in hydro-climatic variables, analysis of data for longer periods (>45 years) was expected to provide better understanding of long-term variabilities.
The aims of this study were to: (a) investigate the long-term trend in average rainfall and river discharge in the Bagmati catchment and its sub-catchments; (b) analyze decadal variability of rainfall, LULC and river discharge; and (c) examine the association between river discharge, regional average rainfall and LULC changes.

2. Materials and Methods
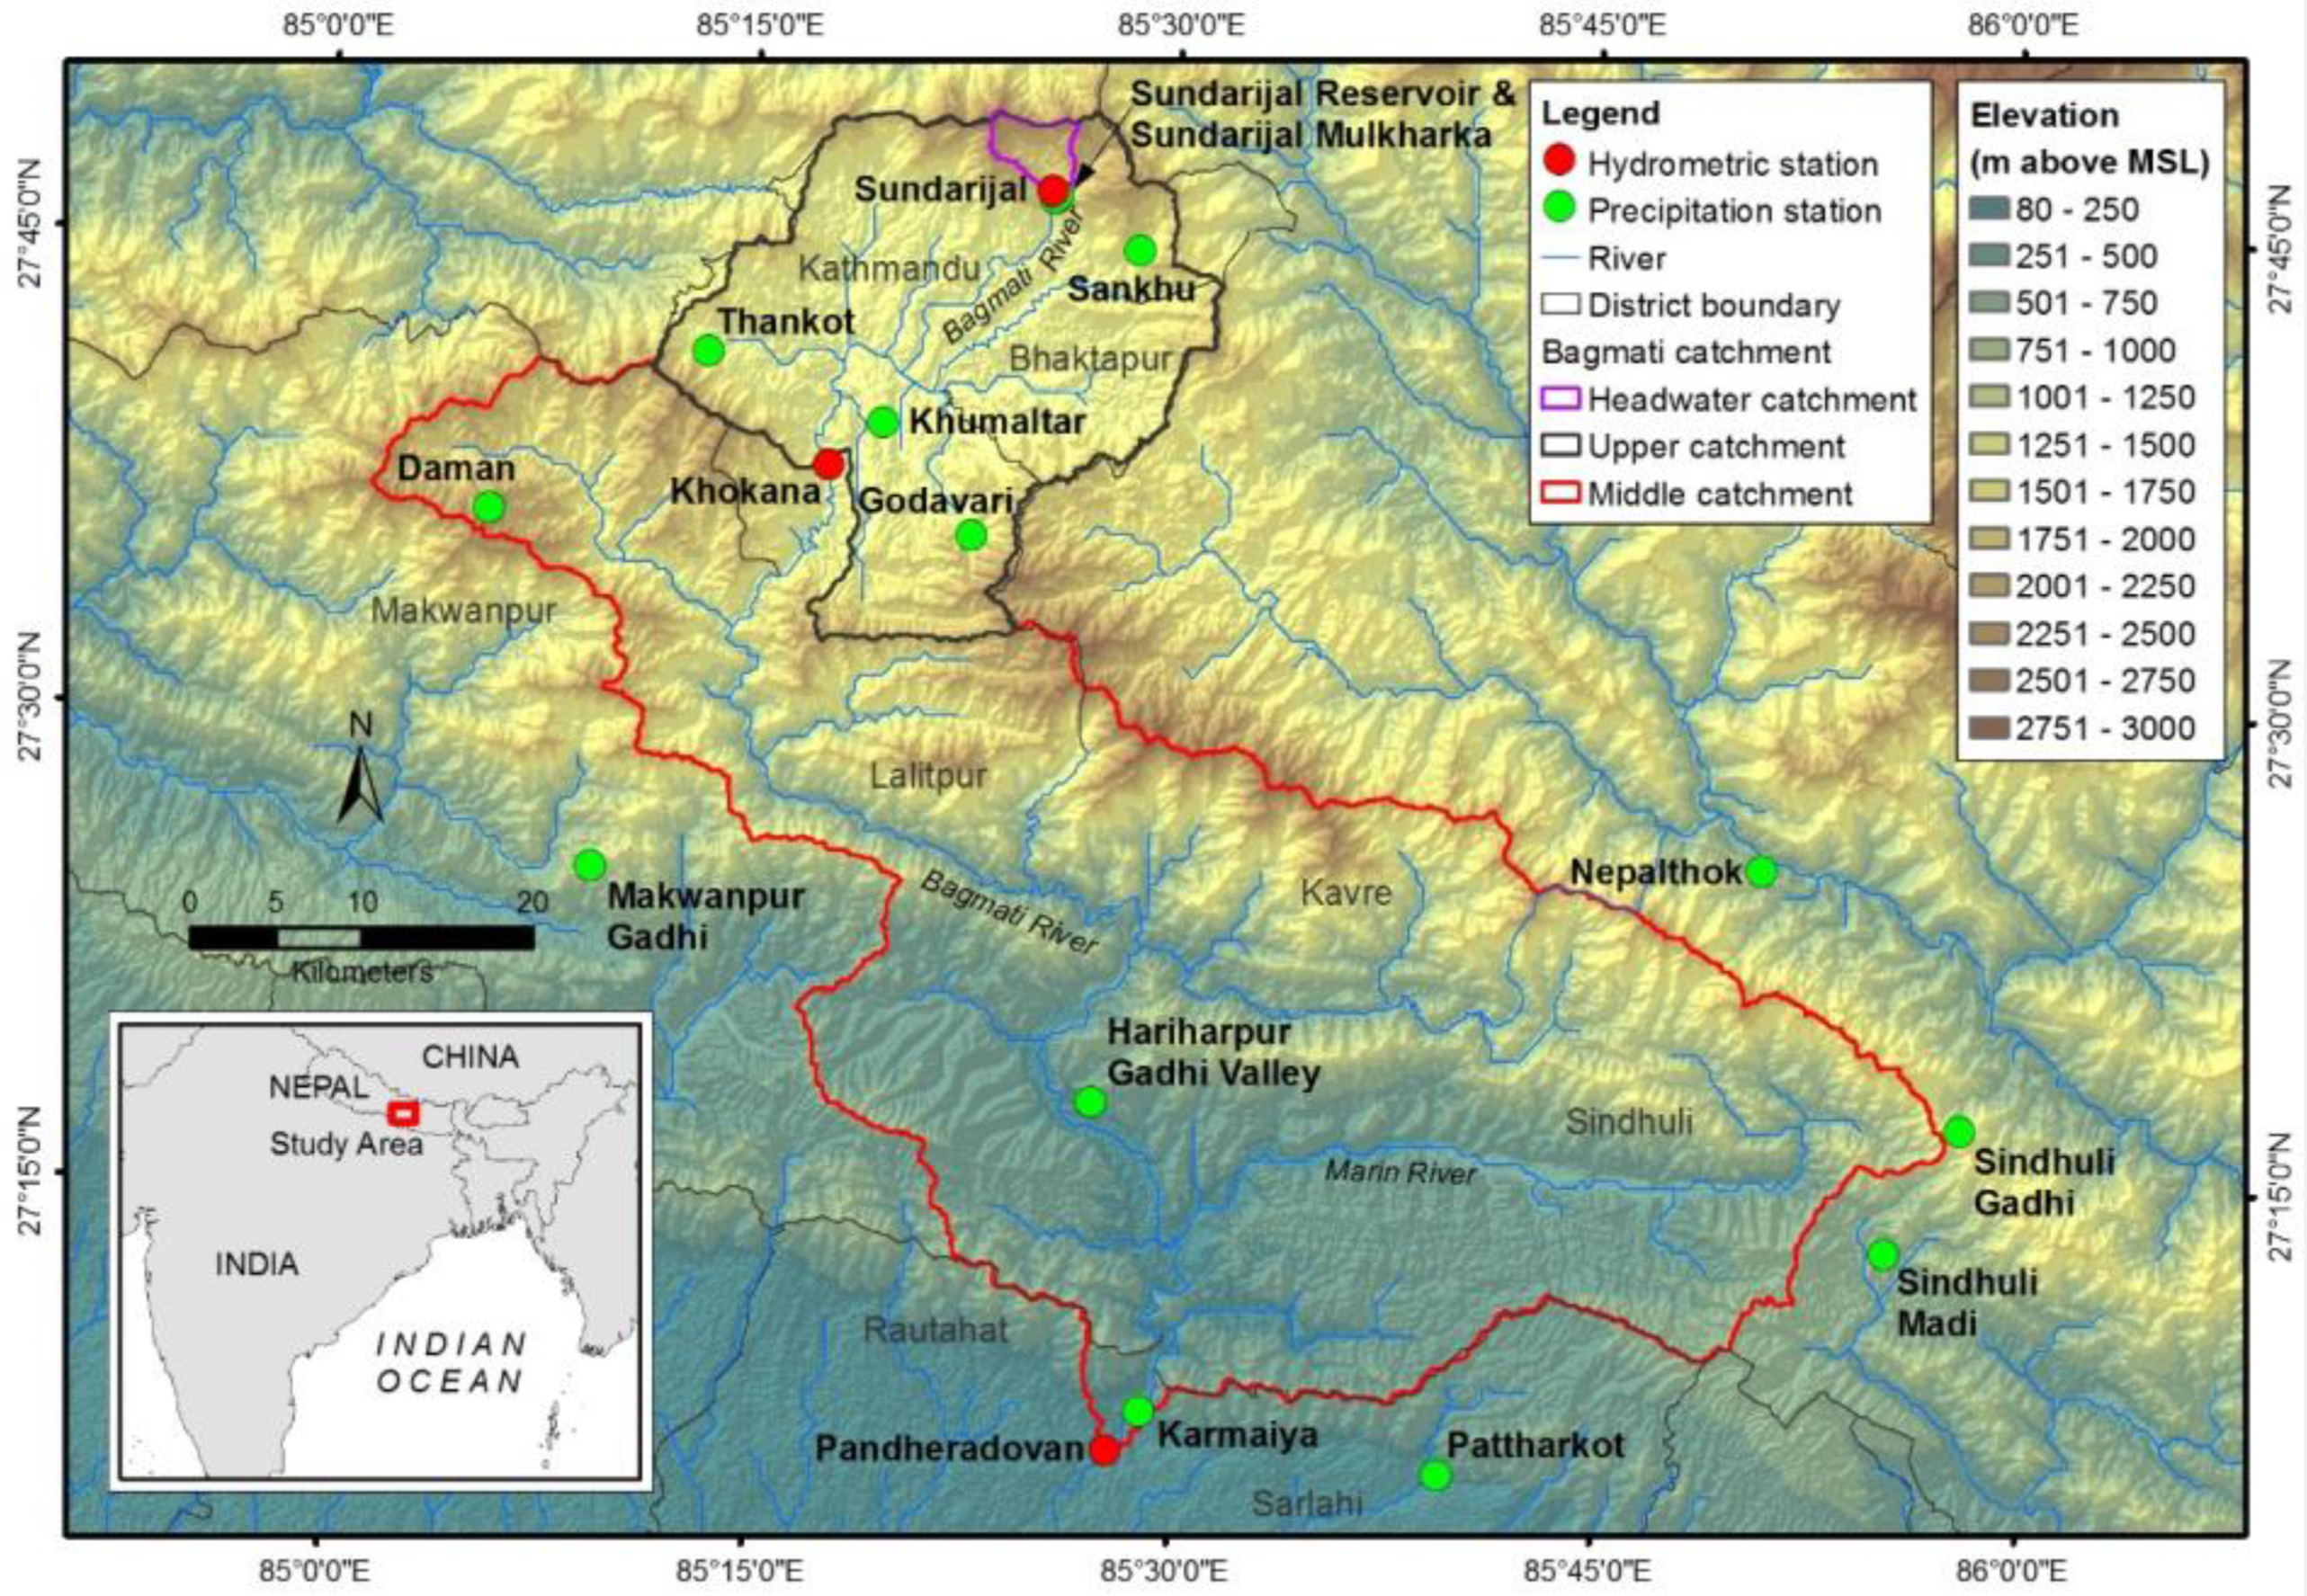
2.1. Study Area

Originating from mountain springs north of Kathmandu, the Bagmati River flows south through the Kathmandu valley, a mid to low elevation mountain region, and the Terai plain, to eventually converge with the Ganges River system. This study focuses on the 2823 km2 area of middle and upper Bagmati River catchment in Central Nepal (Figure 1). The small area (15 km2) upstream of Sundarijal hydrometric station located at 1600 m elevation is described in this study as the headwater catchment. This area is within the Shivapuri–Nagarjun national park and has been protected since 1976 [27] with human activities being limited. The 605 km2 catchment, upstream of Khokana station (1250 m) mostly comprising the urbanized area of the Kathmandu valley is referred to as the upper catchment [43,49,50]. The 2215 km2 catchment downstream of Khokana yet upstream of Pandheradovan station (180 m), mostly representing lower/mid mountain region, is referred to as the middle catchment [43,49]. Thus, the three sub-catchments of Bagmati River, delineated based on the three available river gauge locations, represent contrasting geographical settings within the catchment. The study area covers the Kathmandu, Lalitpur and Bhaktapur districts, and parts of the Kavre, Sindhuli, Makwanpur, Rautahat and Sarlahi districts. Based on Shuttle Radar Topography Mission (SRTM) data [51], the elevation of the Kathmandu valley ranges between 1170 and 1400 m whilst the surrounding mountains extend up to 2780 m. Elevations in the lower parts of the middle catchment range between 140 and 600 m while higher parts of Kavre, Sindhuli, upper Makwanpur and southern Lalitpur range from 1500 to 2800 m (Figure 1).
The climate in the southern parts of the middle Bagmati catchment that includes lower hills and valleys (below 1000 m) is sub-tropical. The mid-elevation mountain ranges and valleys (1000–2000 m) have a warm temperate climate whilst the higher mountain parts experience a cold temperate climate [52,53,54]. On average, minimum temperatures within the catchment range from 0–12 °C in winter and 9–24 °C in summer, whilst maximum temperatures can be between 9 and 27 °C in winter and 21 and 39 °C in summer [31].
Precipitation, mostly in the form of rainfall, is the main source of water input to the catchment and no rivers are snow fed. The Indian summer monsoon delivers more than 80% of annual rainfall between June and September [48,55]. Westerly systems originating from the Mediterranean region bring some winter and spring precipitation between November and March [54]. River discharge in the region is related to rainfall pattern, peaking in July–August and reaching a low between January and April.
The lower parts of the Kathmandu valley are generally covered by agriculture and urban land uses. Based on district level census data [56], the permanent population of Bagmati catchment was 2.7 million in 2011. However, at least 30% more people are estimated to live in the Kathmandu valley temporarily [30,57] and the total population was estimated to be over 4 million [58]. Outside the Kathmandu valley, agricultural activities not only take place on valley bottoms and lowlands, but also on the mountain slopes that would otherwise be covered by forest and shrubs.

2.2. Remote Sensing Data

Landsat images between 1975 and 2015 were used to map historical LULC changes at a 10-year interval. Most of the Landsat images available from May to August have high cloud cover. And since agricultural area can be best separated from other vegetated areas when there are less crops, images from the dry season (November to April) were chosen. Due to the unavailability of suitable images around 1985, an image from 1988 was used. Table 1 shows the list of Landsat images used in the study.
Landsat Multi Spectral Scanner (MSS) images have spatial resolutions of 60 m, unlike the 30 m of Thematic Mapper (TM) and Operational Land Imager (OLI) images. The TM and OLI sensors also have additional spectral bands. Studies have shown that Landsat images taken from MSS, TM and OLI sensors are comparable in terms of their spectral attributes [59,60] and have been used appropriately to map long-term LULC changes (e.g., [61,62,63,64]). Since the LULC is only classified into broad categories, the use of these images is considered appropriate for this study. SRTM V4 elevation data [51] were used to delineate the river catchment boundaries.

2.3. Hydro-Meteorological Gauge Records

Due to limitations of resources, meteorological stations are not well distributed in the mountainous areas of Nepal [52]. Nevertheless, in-situ records that are available remain valuable, since alternative sources such as remote sensing data may not have long historical coverage and their coarse spatial resolution may not be appropriate for studying small catchments. Daily precipitation records of 13 rain gauge stations and daily average discharges of three river gauge stations (obtained from the Department of Hydrology and Meteorology Nepal) are, therefore, the primary sources of data for this study. Since most of the stations have records from the early 1970s, this study focuses on variation in rainfall and river discharge between 1970 and 2017.

2.4. Land Use/Land Cover (LULC) Mapping

Landsat images were classified using maximum likelihood rule based supervised classification using the ERDAS Imagine (2016) image processing software. Data collected during field visits in 2016 and 2017 and information available from higher resolution images such as from Google Earth Pro was also used to assist the classification process.
LULC classifications for the study were kept to broad categories that were mappable consistently using historical Landsat images. Areas showing the characteristics of a forest, including tree cover and no other primary use [37], were mapped as forest. Apart from obvious shrub lands, areas which were not evidently distinguishable as agriculture or forest and showing mixed characteristics are also classified as shrubs. The shrub area in the region can, in fact, be considered as depleted forest or mixed vegetated land adjacent to agricultural areas [37]. Urban areas were classified as either built-up or mix of settlements that included some vegetated area, such as agriculture or trees. Smaller towns and human settlements that are generally a mixture of agriculture, sparse trees and some houses could not be distinguished consistently with Landsat images, so were not classified separately as urban areas. The results were filtered by merging classified areas that were smaller than three (five) pixels of image area for 1975 (1988–2015) with surrounding LULC classes. The accuracy of the LULC classifications were tested using 400 stratified random sites that were categorized based on Landsat and other higher resolution historical images available in Google Earth Pro. The accuracy statistics were calculated by comparing correct (actual) LULC and the classified LULC results at the random sites. The Kappa coefficients for the LULC classifications were between 0.89 and 0.91 and the overall accuracy of the results for each mapping period was over 85%.

2.5. Processing of Hydro-Meteorological Time Series Data

The daily precipitation and river discharge time series were tested for homogeneity using the RHtestsV4 package, in the R environment [65]. This was done to detect any “non-natural” variations introduced by gradual or abrupt changes in data collection and processing components [66,67]. Inhomogeneous daily time series data were homogenized by applying mean-based adjustments with respect to change-points detection results.
Data gaps in the daily time series were filled with 5-year daily averages [68] based on the daily records for two earlier and two later years for the same station. Annual rainfall time series were then created from the gap filled homogeneous daily series through arithmetic averaging. Regional average rainfall series for sub-catchments and the entire catchment were created based on inverse distance weighting (IDW) results of annual time series data. In general, geostatistical interpolation methods such as kriging are expected to provide a better estimation of rainfall distribution [69,70,71], while deterministic methods such as IDW, can also provide appropriate results [72,73]. Preliminary comparison of kriging and IDW results showed that IDW produced consistently appropriate interpolation of available data for this study. In the absence of dense measurement stations, the results will have some uncertainty [74] but the IDW technique has also been used in similar studies [71,75,76]. And since the focus of this study was on analyzing long-term variability using observations from the same set of locations, interpolation of rainfall using IDW was considered reasonable for this study.

2.6. Mann–Kendall Trend Test and Sen’s Slope

The Mann–Kendall (MK) test is a widely used non-parametric test to determine the existence of a significant monotonic trend in various climatic variables. Such methods use ranks of data rather than actual values, which reduces the impact of outliers in the time series [77]. Furthermore, the MK test is also suitable for data such as rainfall series that are not normally distributed [77]. In this study, regional annual average rainfall, estimated surface runoff and annual average river discharge time series were tested with MK test to understand the presence of significant long-term trends. Statistically significant, monotonic trends in 95% confidence intervals were considered significant in this study.
The Sen’s slope estimator is based on a linear model to estimate the rate of change and is a commonly used technique in analyzing hydro-meteorological data [78,79,80]. In this study, Sen’s slope and its percentage in relation to the intercept value were used to represent the magnitude of change in rainfall, estimated surface runoff and river discharge.

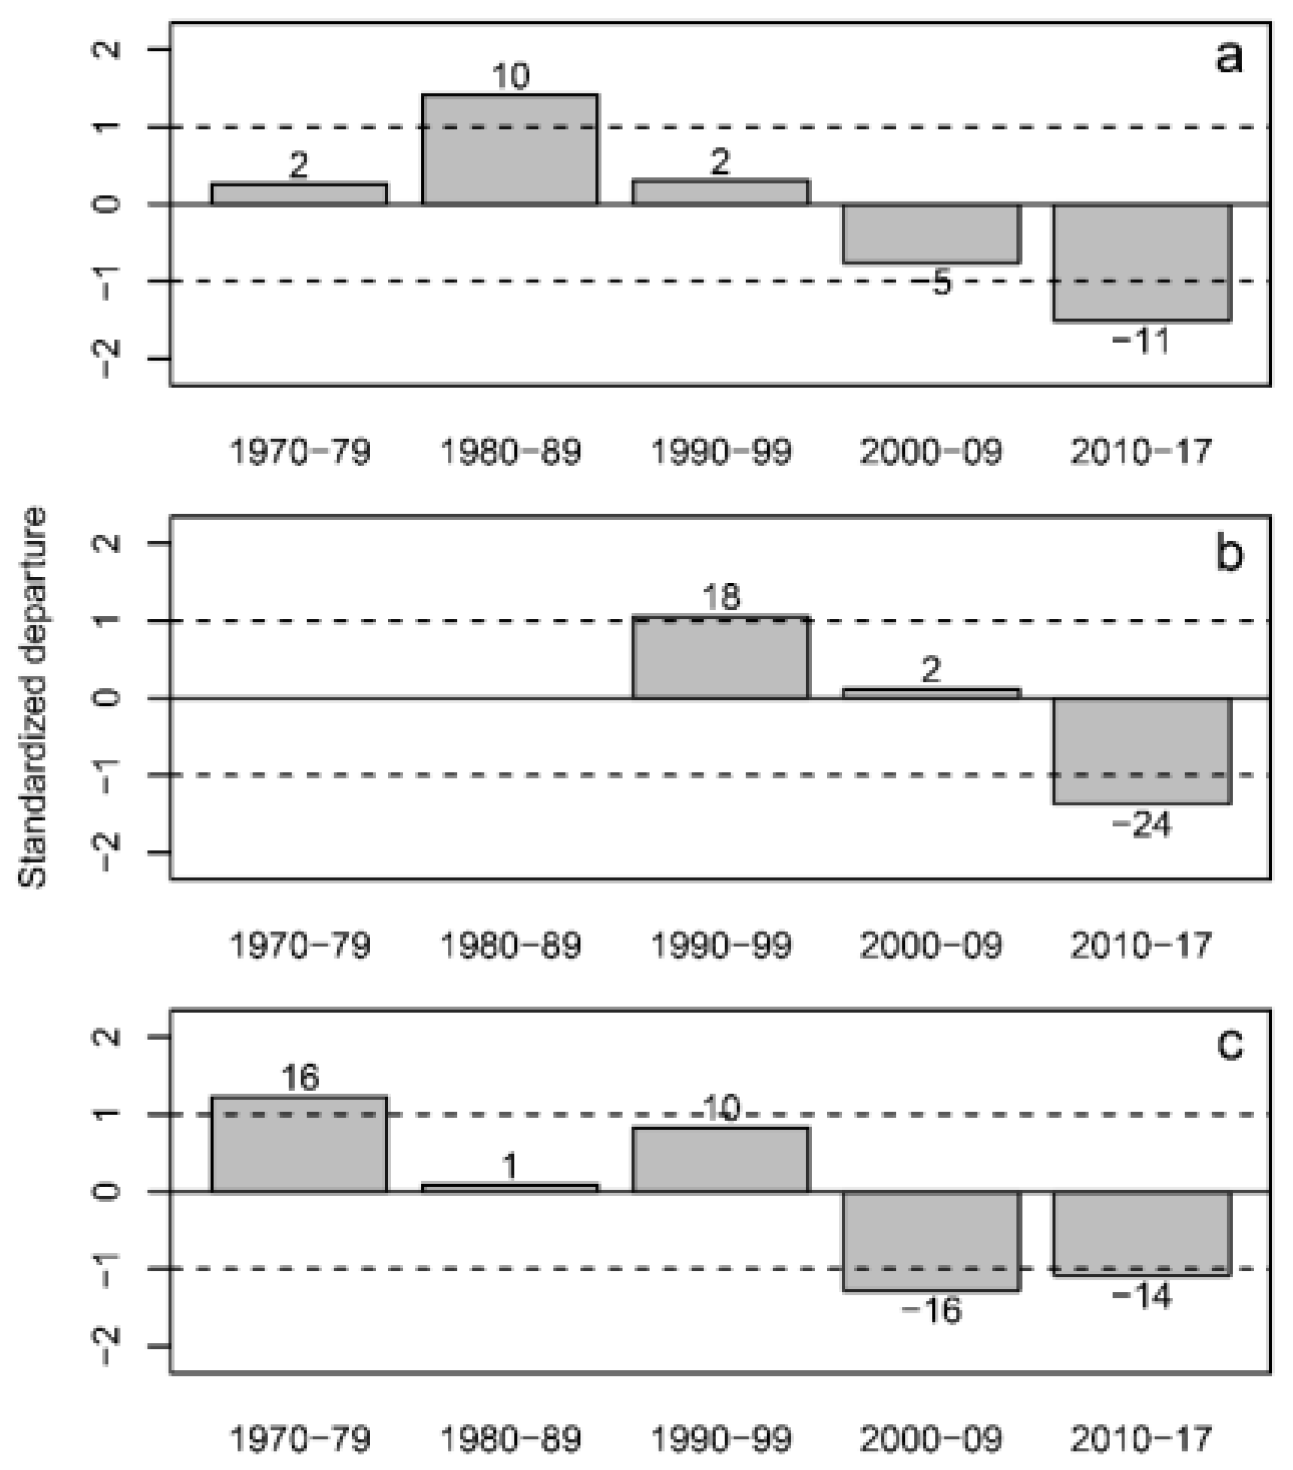
2.7. Decadal Departure from Long-Term Mean

Apart from a long-term monotonic trend, climatic and hydrological time series can also have important long-term periodic variations. Decadal variation in regional average rainfall and river discharge were analyzed in relation to the long-term mean [81] for the period of 1970–2017. The departure of decadal average series were standardized by calculating standard scores. Positive (negative) departures from the mean that were larger than the order of one standard deviation were considered in this study to be substantially higher (lower).

2.8. Association of River Discharge with Rainfall and LULC Changes

The Natural Resources Conservation Service’s curve number (CN) method [82] was used to estimate surface runoff from the sub-catchments, for the purpose of analyzing the impact of LULC and daily rainfall changes. This method calculates direct surface runoff based on precipitation, maximum soil retention and initial abstractions. Maximum soil retention can be estimated based on curve number that is determined by LULC and hydrological soil group [82]. Current LULC results and hydrological soil groups based on Food and Agriculture Organization (FAO) soil data [83] were used to identify soil curve numbers, as adopted by Mishra et al. [84]. Initial abstractions can be approximated in relation to maximum soil retention estimated as above. An initial abstraction ratio of 0.05 (i.e., initial abstraction = 0.05 × maximum soil retention), as suggested by Woodward et al. [82] and Hawkins et al. [85], was used in this study. LULC coverages of 1975, 1988, 1995, 2005 and 2015 were used to estimate LULC proportion for other years during 1970–2017 assuming linear changes in LULC. Weighted runoff for sub-catchments were then estimated using percentages of the area with specific LULC-hydrologic soil groups. Apart from changes in rainfall and LULC, river discharge depends on many other factors, such as soil moisture, evaporation, evapotranspiration, etc. However, we focused on the impact of rainfall and LULC changes only, and more comprehensive modelling was not within the scope of the study.
Pearson’s correlation coefficients were calculated to check the association between the rainfall, estimated surface runoff and observed river discharge series. Cross correlations were also analyzed to see any lagged association. Percentages of annual rainfall, estimated surface runoff and observed river discharge series with respect to their long-term means were also compared to visualize the associations between them. Multiple regression analysis was performed to quantify the influence of major LULC changes and rainfall (predictors) on river discharge. For the purpose of comparing the relative contributions of the predictor variables, the importance for each of the variables were calculated as the ratios of change in R2 (when the variable of interest is not considered) to the overall R2 (when all predictor variables are considered) [86,87].

3. Results

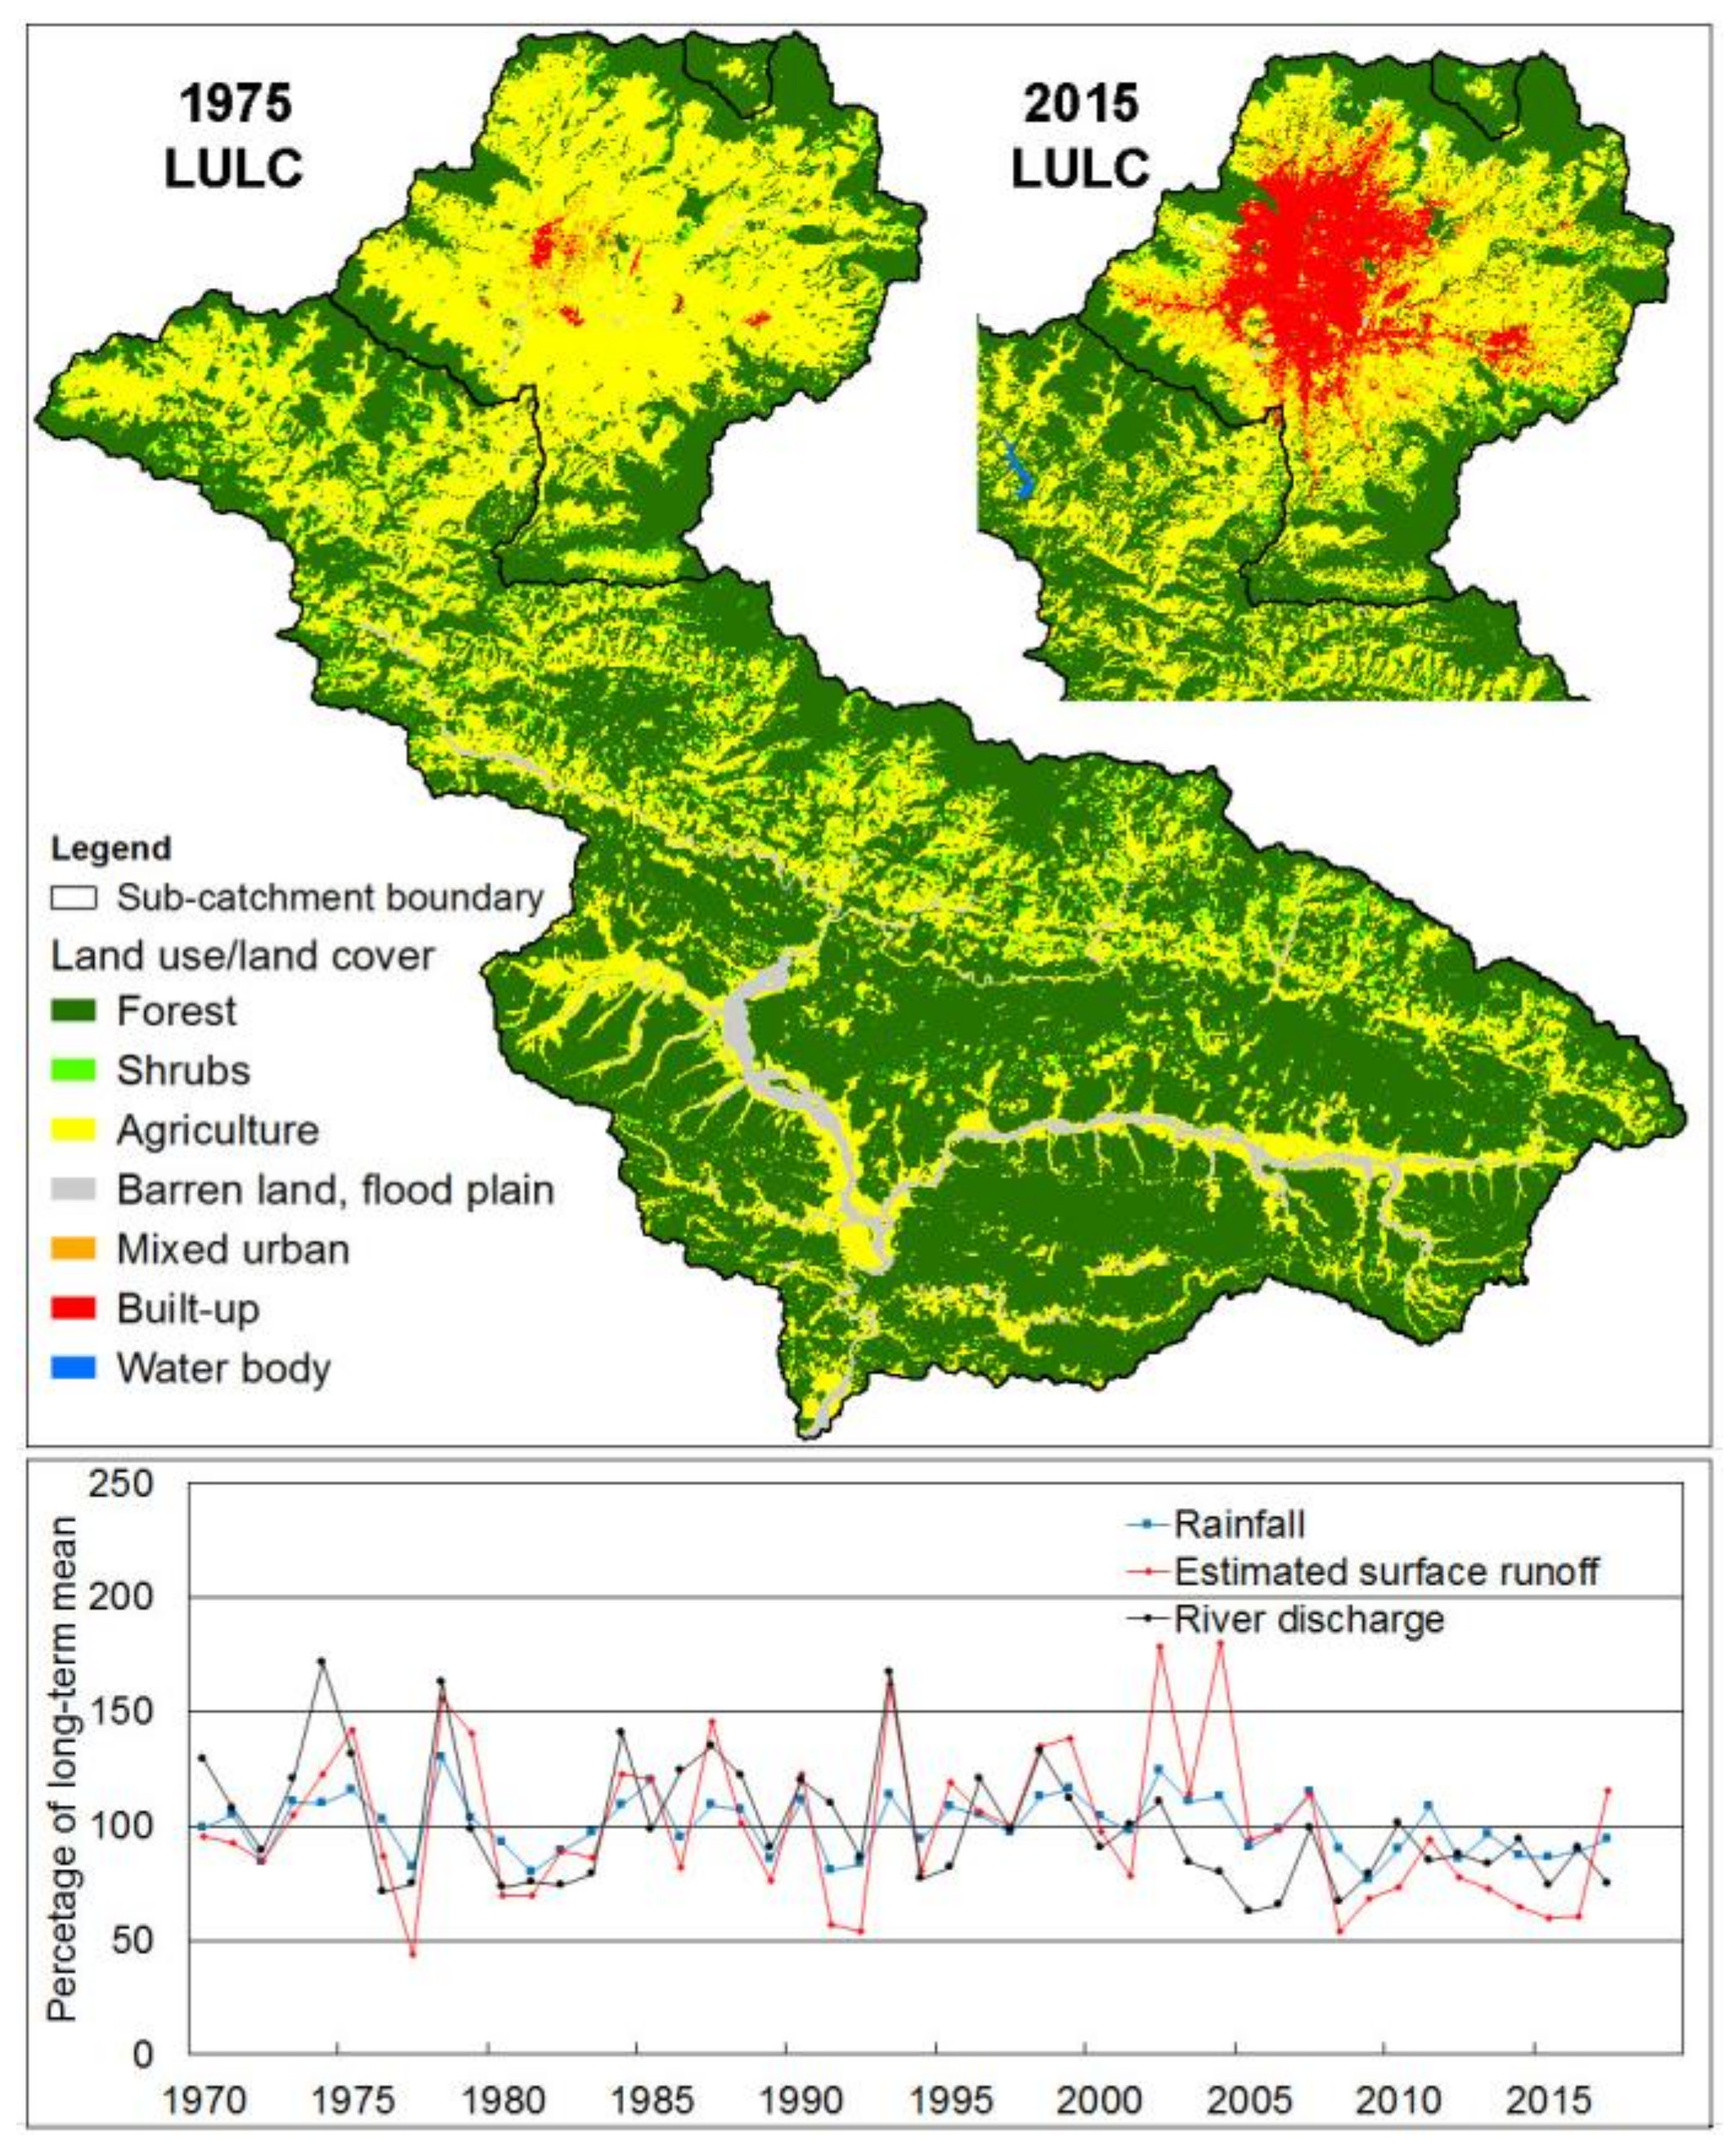
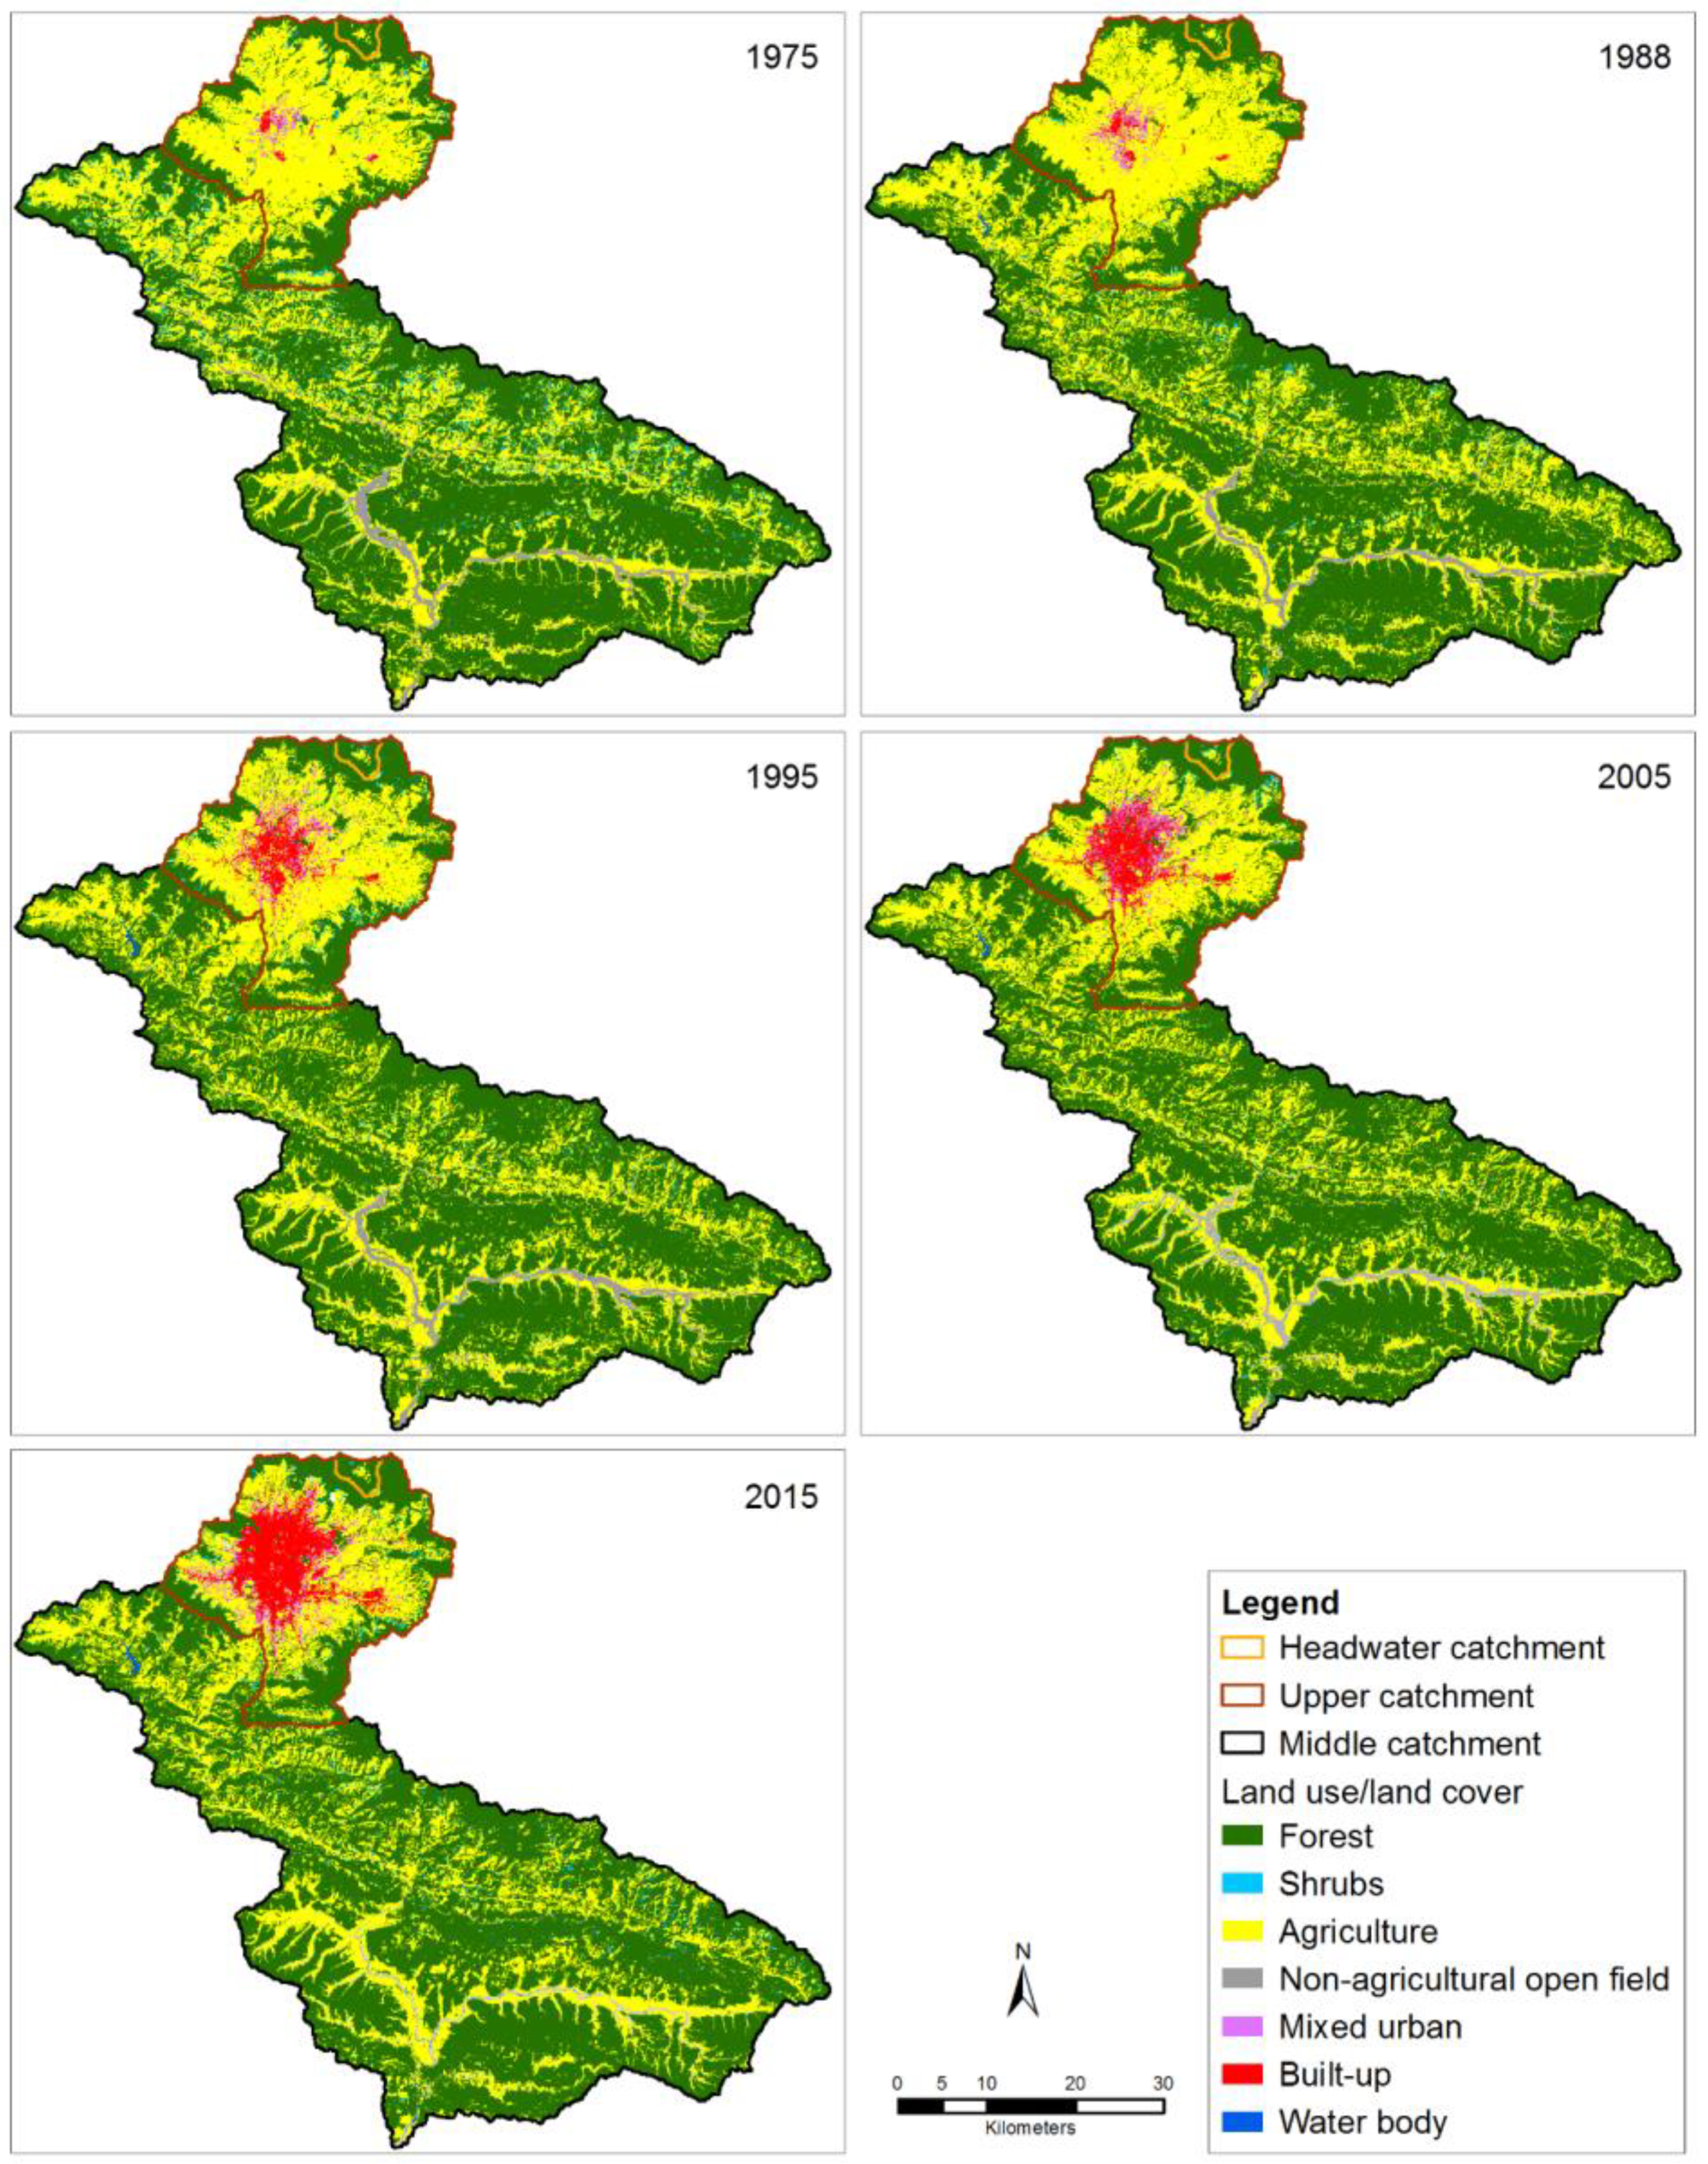
3.1. Land Use/Land Cover (LULC) Change

Figure 2 shows LULC of the Bagmati catchment from 1975 to 2015. In general, mountainous parts of the catchment are covered by forest, shrubs, agriculture or a mixture of trees and agriculture, while the valleys are generally cultivated or used for settlement/urban purposes. The land use types representing mixed human settlements and urban areas both increased consistently during the study period (1975–2015) at the expense of agricultural lands. However, most of these urban expansions were concentrated in Kathmandu valley.
Since most of the rivers and other water bodies in the catchment were too small to be consistently classified with Landsat images and their changes were negligible, no further analysis was done to compare changes in water surfaces. On average, shrubs and non-agricultural open fields were found to cover only 1.6% and 2.2% of the total area, respectively. Since the changes in these land cover were also not significant, further analysis was not performed.
Based on the most recent (2015) results, forest covers 62% of the entire catchment, while around 30% of the land is used for agriculture (Table 2). In the upper catchment forest and agricultural land cover 36% and 38% of the area, respectively, while 24% of the land is mixed urban or built-up (Table 3). In the middle catchment, forest covers 69% of the area and 28% of the land is used for agriculture (Table 4).
The results of LULC analysis (Figure 2, Table 2) show that forest cover in the entire catchment increased by 4.1% over the 1975–2015 period. Agricultural area in the catchment decreased by 13.7% over the same period, even though it increased by 38 km2 between 1975 and 1988. Less than 5% (8%) of total area covered by built-up category in 2015 were built-up in 1975 (1988). The results show that mixed urban land use covered a larger area compared to built-up areas in 1975 and 1988, but the growth rate of built-up area overtook that of mixed urban land from 1995.
Analysis of LULC change in the upper and middle Bagmati catchment shows some contrasting results. In the upper catchment (Table 3), built-up area has expanded consistently, especially after 1988 from the core of Kathmandu, Lalitpur and Bhaktapur city towards the outer parts of the valley. It increased to 35 km2 in 1995, and it has increased by around 60% every decade since then. Mixed urban areas have also increased significantly in the upper catchment. The decrease of 134 km2 in agricultural area and 127 km2 increase in combined area of mixed urban and built-up areas between 1975 and 2015 shows that most of the LULC changes related to urbanization are concentrated within Kathmandu valley, the upper part of the Bagmati catchment.
In the middle catchment (Table 4), the forest area increased by 4.4% (64 km2) between 1975 and 2015, while the increase was only 2.6% in the upper catchment. Apart from slightly higher coverage in 1988, there was no significant change in the percentage of agricultural area in the middle catchment.
The overall difference (1975–2015) in forest cover in the headwater area upstream of Sundarijal station, was less than 2% and the fluctuation remained within 2.25% of the average (Table 5). However, considering the actual area of the changes in relation to accuracy of LULC classification, these changes were considered to not be of a significant scale.

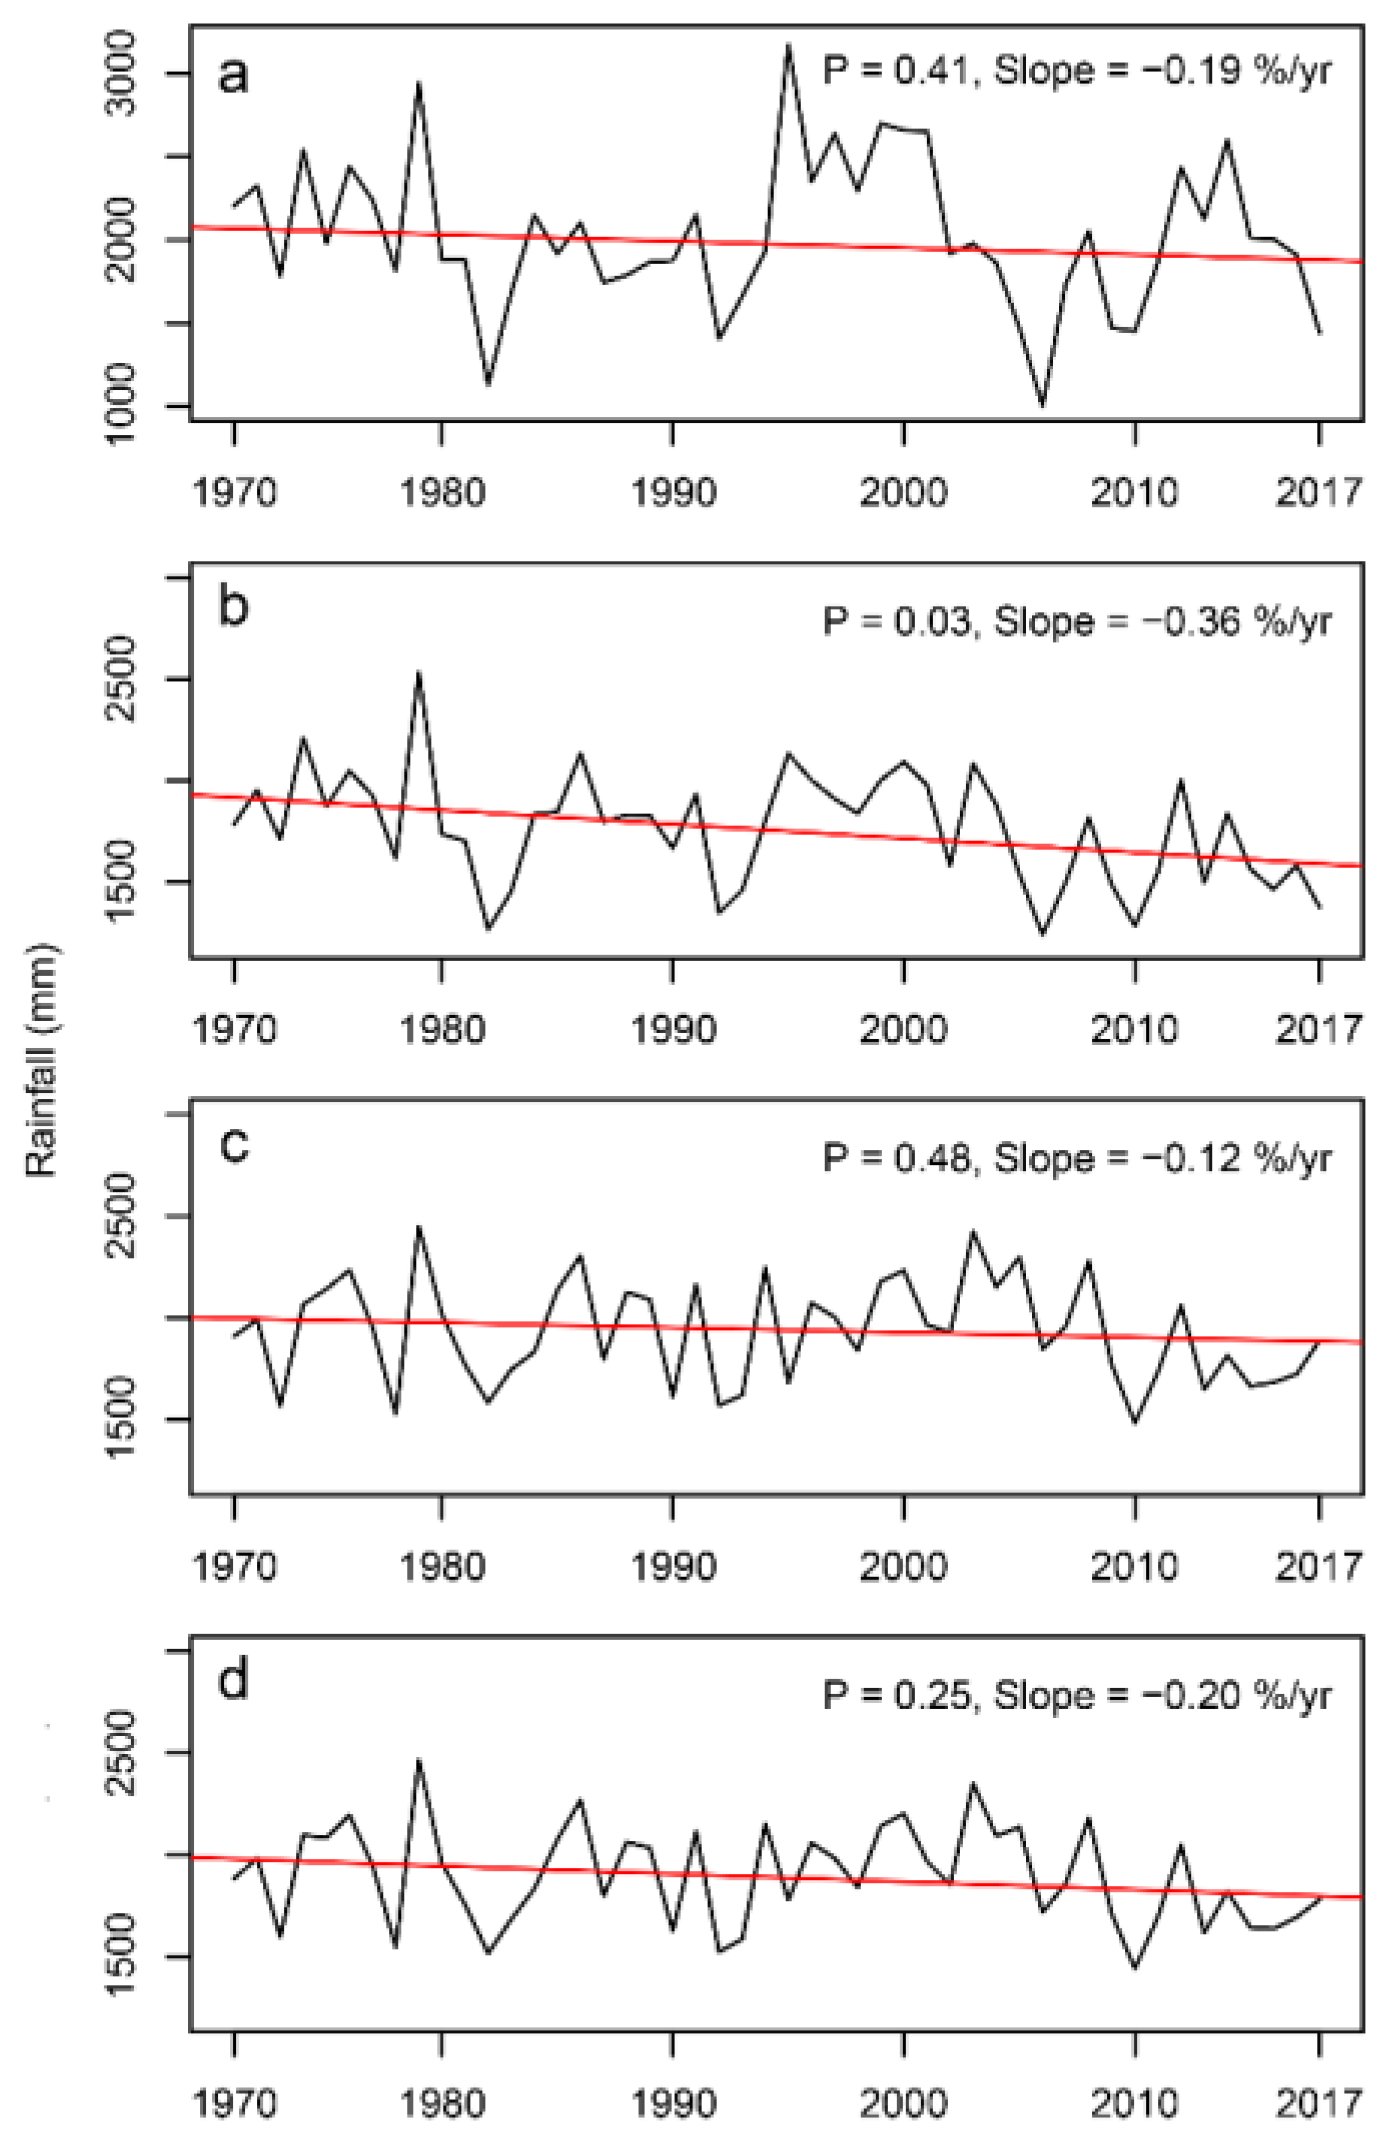
3.2. Rainfall Variability

Time series of regional annual average rainfall derived from IDW interpolation, and their long-term trends in the Bagmati catchment and its sub-catchments, are shown in Figure 3. The results show that annual average rainfall in the Bagmati catchment was decreasing by 0.20% per year. Variability in the average rainfall of the middle catchment is very similar to that of the entire catchment and the MK test showed that the long-term trends in both cases were not statistically significant. Rainfall in the headwater catchment was also decreasing non-significantly by 0.19% per year, while a higher decrease of 0.36% per year in the upper catchment was statistically significant, at 95%.
Decadal analysis of rainfall departures from the long-term mean (Figure 4) shows that regional average rainfall in the catchment was higher to substantially higher than the long-term mean during the 1970s. On the other hand, rainfall after 2010 was substantially lower in all parts of the catchment except the headwater catchment. Patterns of decadal average rainfall in middle and entire catchment were very similar, with minor departures from long-term mean and the departure after 2010 being substantial in both cases. Decadal departure of rainfall in headwater catchment highly fluctuated, while the departure in the upper catchment showed generally decreasing rainfall during 1970–2017.

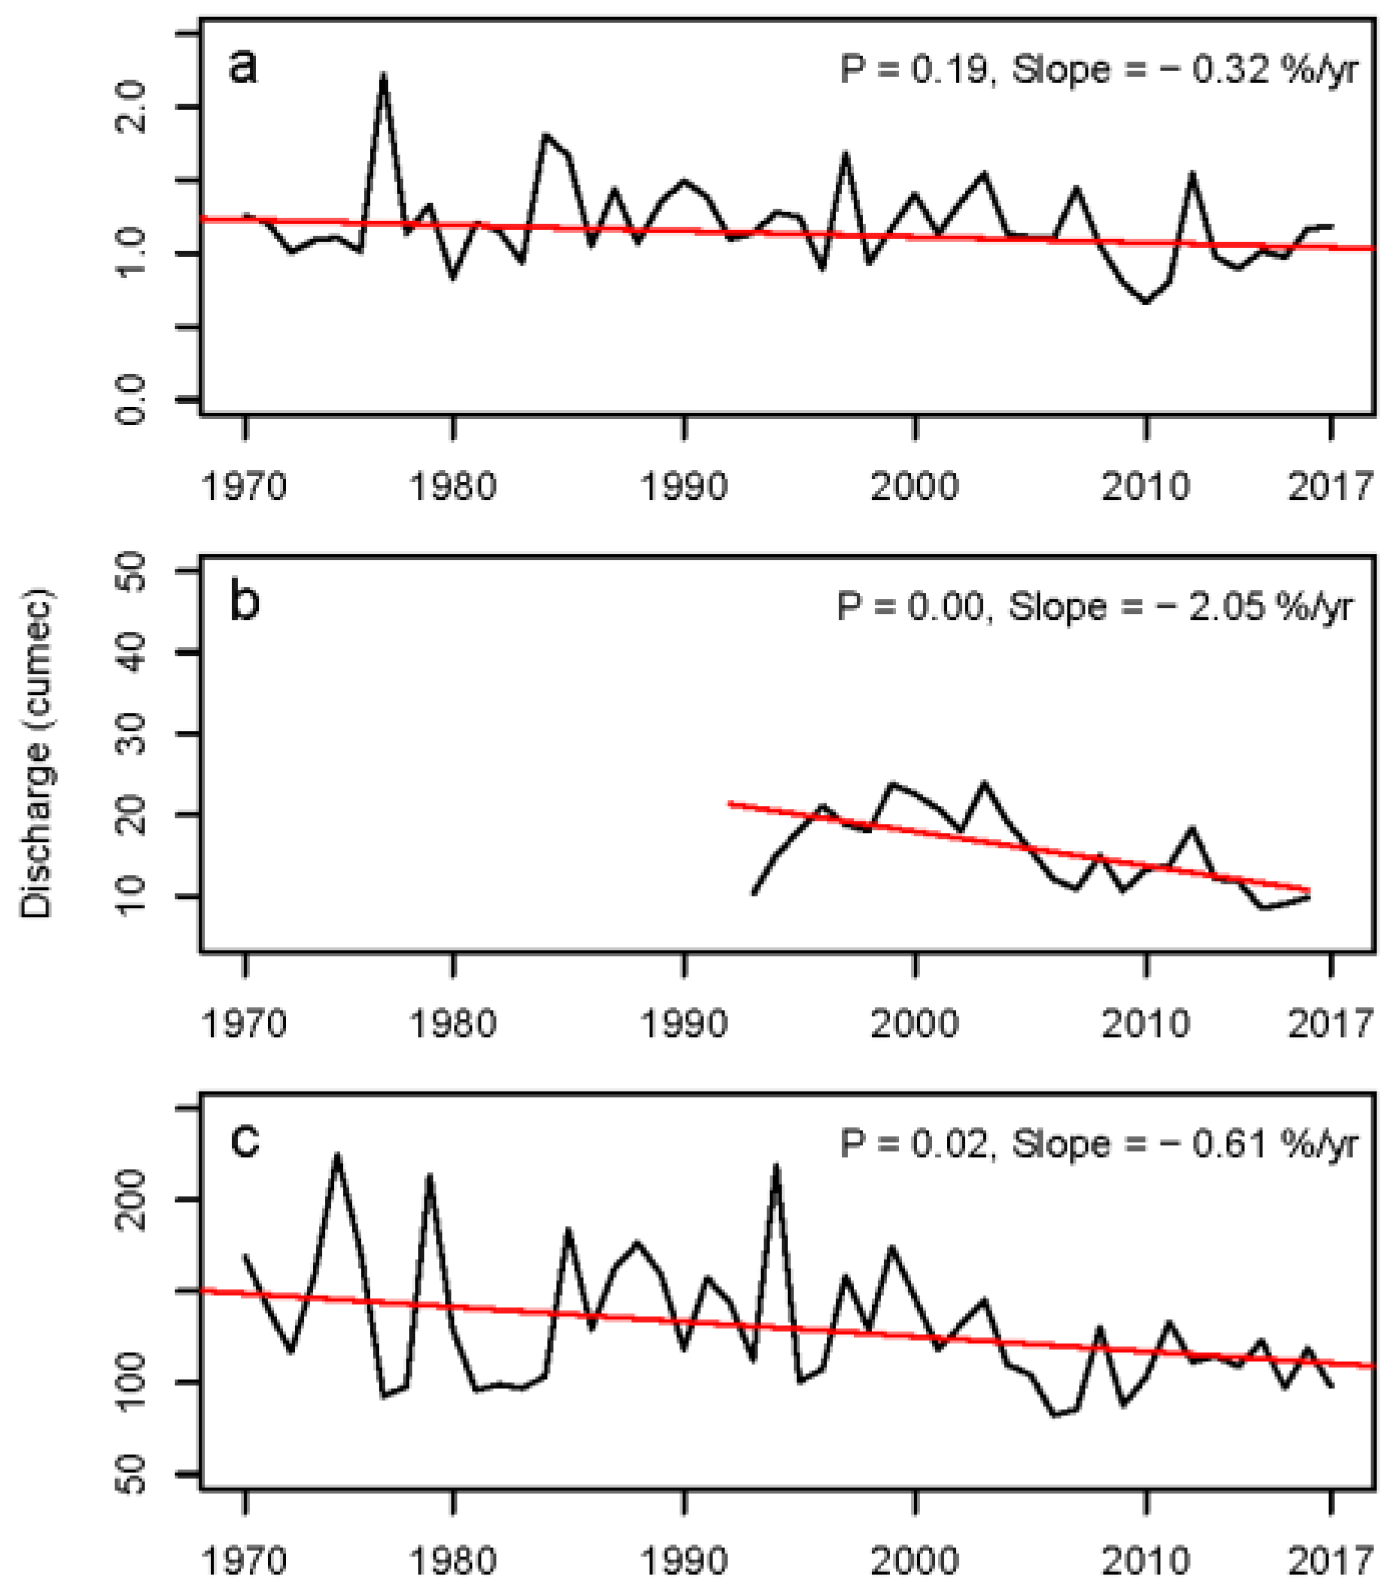
3.3. River Discharge Variability

Average annual river discharge from the entire Bagmati catchment and its sub-catchments together with their long-term trends are shown in Figure 5. Based on the 1970–2017 records at Karmaiya/Pandheradovan station that represent the river discharge from the entire Bagmati catchment, annual river discharge was decreasing significantly by 0.61% per year. River discharge measured at Sundarijal also showed a decreasing trend of 0.32% per year in headwater catchment, but the trend was statistically non-significant. Observations at Khokana station during 1992–2016 show that river discharge from the upper catchment was decreasing significantly by 2.05% per year.
Figure 6 shows decadal departures of river discharge at Sundarijal, Khokana and Pandheradovan station in relation to their long-term means. The discharge from the entire catchment in the 1970s was substantially higher (by 16%), while the decadal discharge after 2000 was substantially lower by around 15% compared to the long-term mean. It is noticeable that river discharge from upper catchment has decreased consistently between 1992 and 2017 with substantially higher discharge in the 1990s; discharge after 2010 was substantially lower. The departures of discharge from the headwater and the entire catchment are comparable, considering higher discharge before 2000 and lower discharge after 2000.

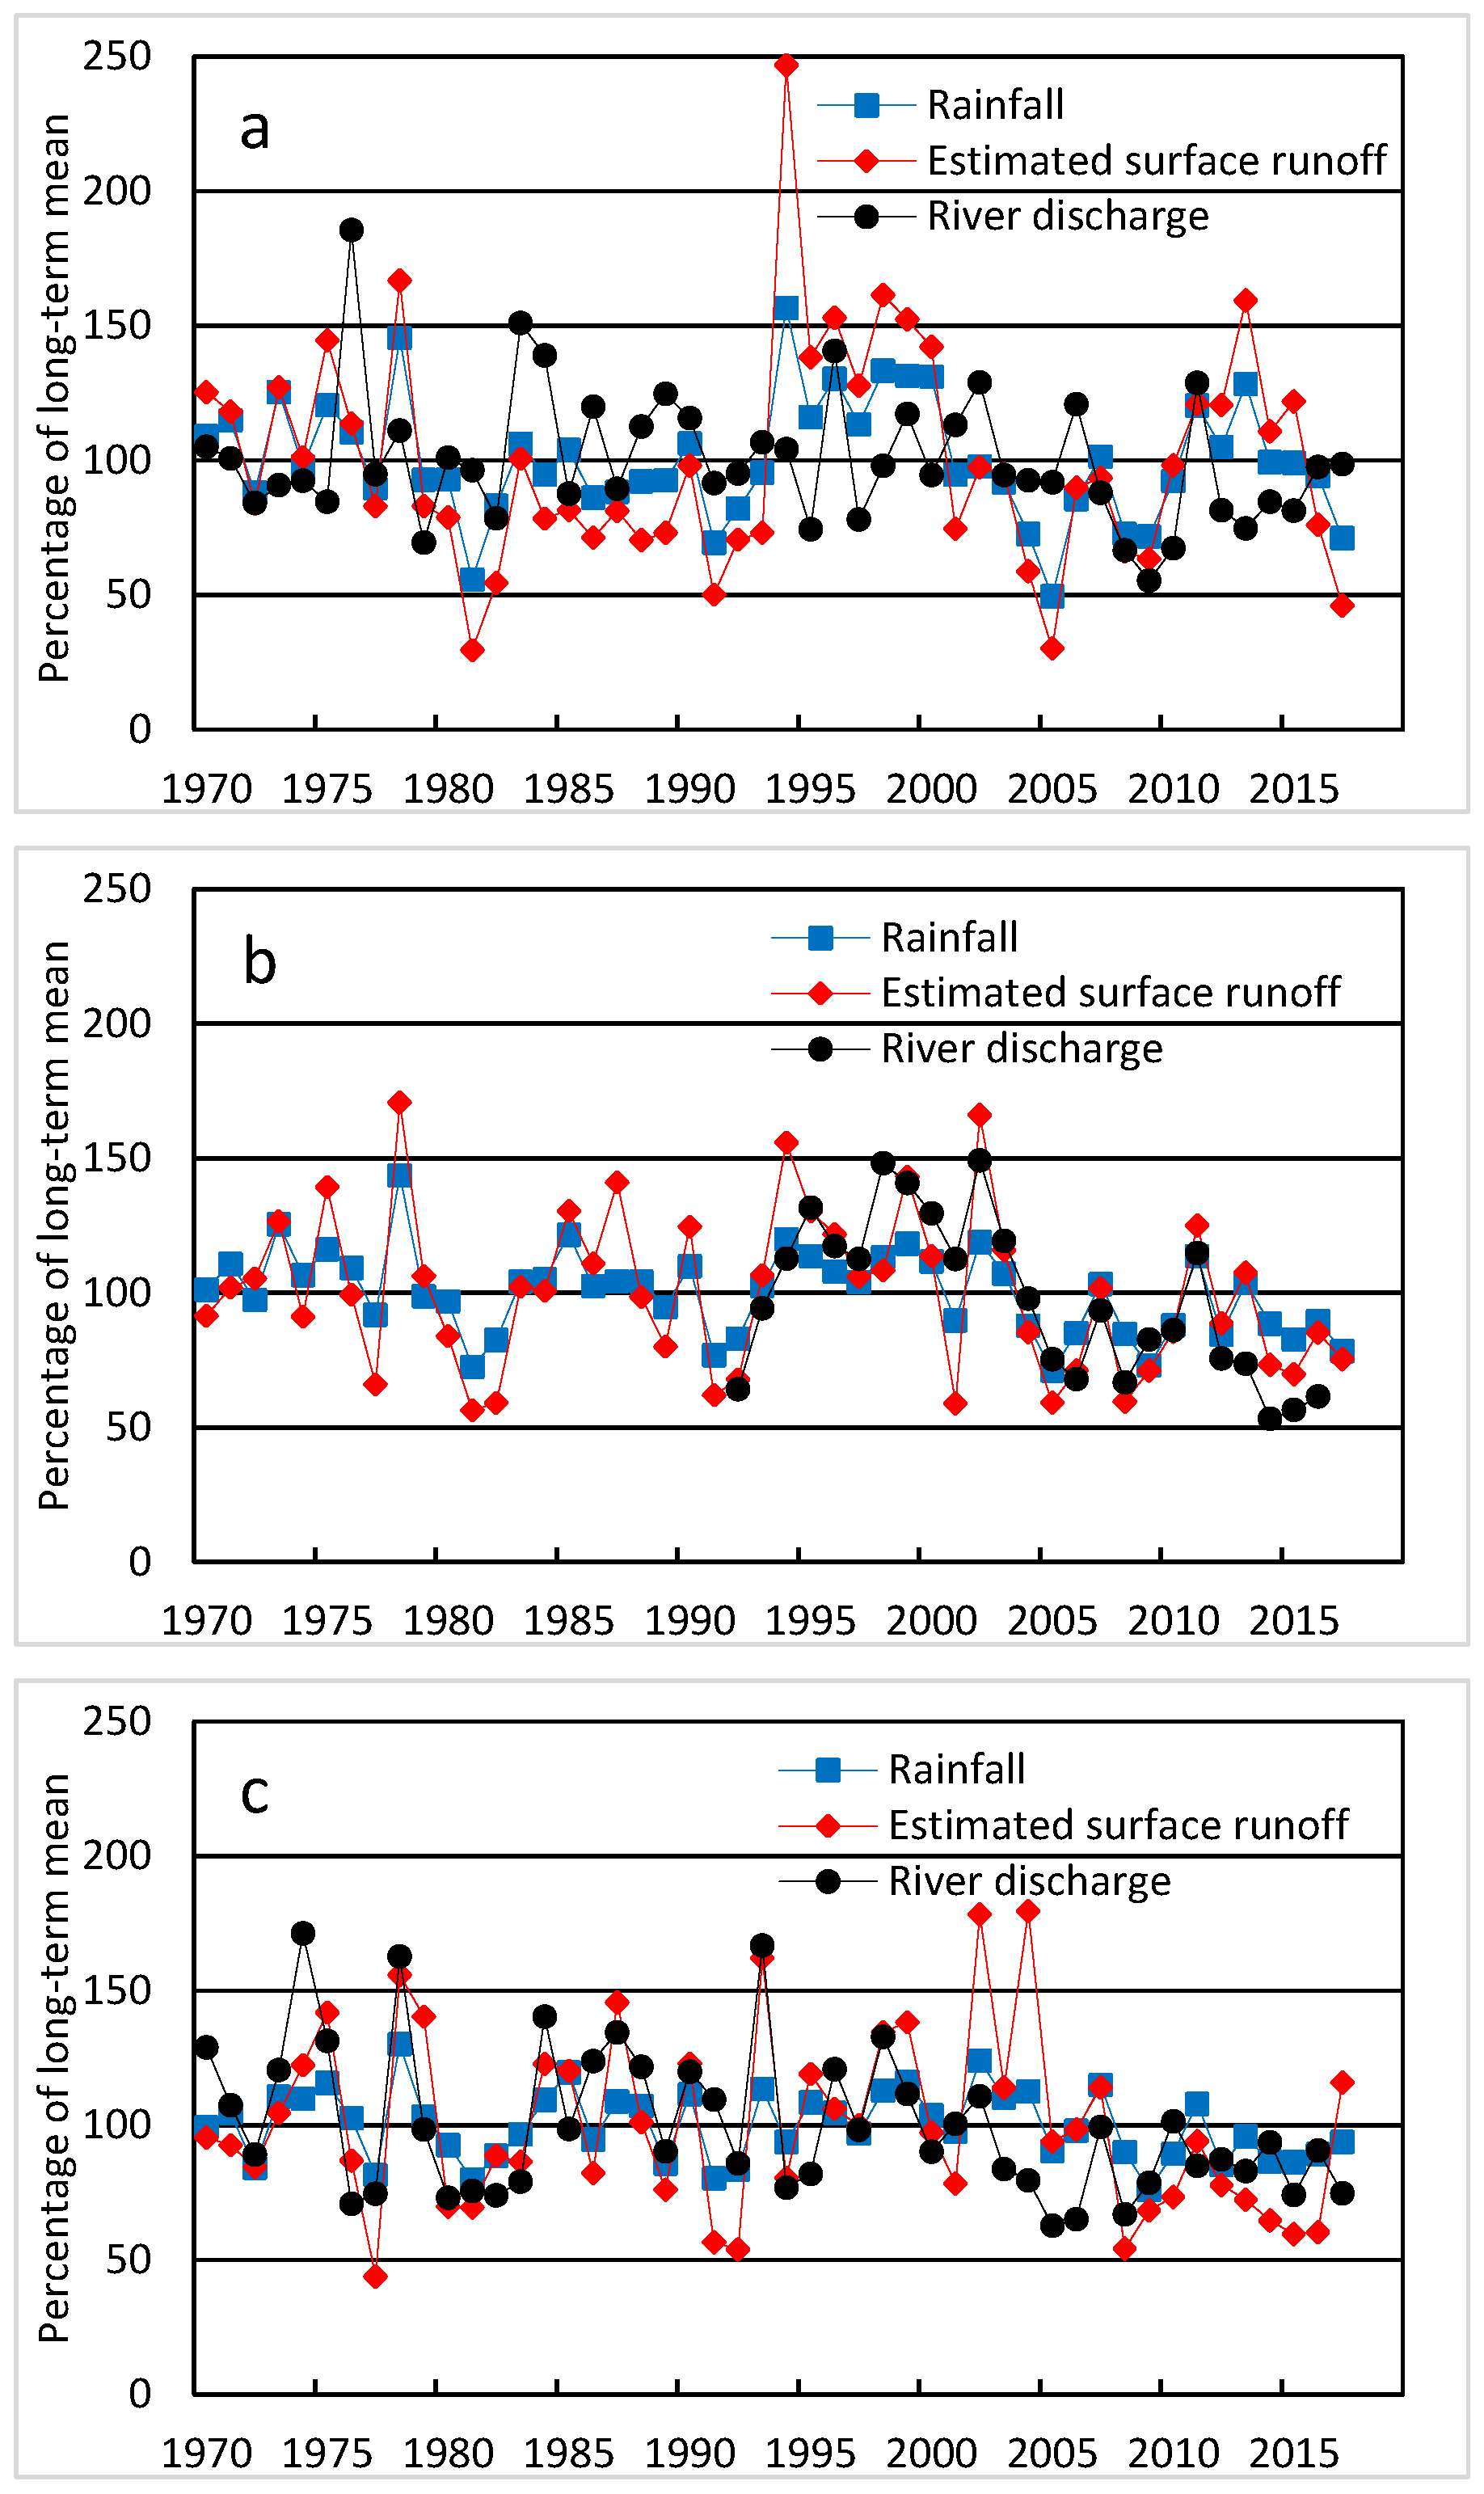
3.4. Influence of Rainfall and LULC Change on River Discharge

The association of (observed) river discharge with rainfall and estimated surface runoff, derived from rainfall and LULC changes using the CN method, are shown in Figure 7. The values represent annual distribution of rainfall, estimated surface runoff and the observed river discharge as percentages of their long-term means in the headwater, upper and entire Bagmati catchments. Patterns of estimated surface runoff and annual discharge from upper and entire catchments are highly influenced by the amount of rainfall even though the ratio of fluctuations were relatively different for some years. Estimated surface runoff in headwater catchment is also related to annual rainfall although the river discharge has a slightly different pattern.
Table 6 shows the correlation results of river discharge with rainfall and estimated surface runoff in sub-catchments of the Bagmati River. There is a statistically significant, positive correlation (r = 0.58) between annual rainfall and discharge for the entire catchment. A statistically significant, strong, positive relationship (r = 0.79) exists between rainfall and river discharge in the upper catchment, while a statistically insignificant, weak relationship (r = 0.22) was found for headwater catchment. The association between estimated surface runoff and river discharge was also weak in the headwater catchment. On the other hand, river discharge from upper and entire catchment exhibited a statistically significant correlation with estimated surface runoff.
Table 7 shows the results of multiple regression analysis, highlighting the contributions of rainfall and major LULC changes to the river discharge. The direct influence of rainfall change is statistically significant in all sub-catchments. In the upper catchment, the inverse influences of change in agricultural and urban areas were significant on river discharge but the direct contribution of rainfall change appears to be the most significant. In headwater and the entire catchment, the influences of LULC changes are not statistically significant.

4. Discussion

4.1. Land Use/Land Cover Change

LULC results show that the forested area in the middle and entire Bagmati catchment increased by 4.1% between 1975 and 2005. However, overall forest coverage in Nepal decreased by 3.1% during 1975–2005 [88]. Shrubs/mixed land area in the catchment has not changed significantly, although DFRS data [37] suggest that the national coverage of shrub land, including deteriorated forest, doubled between 1986 and 1994. These dissimilarities highlight varying LULC changes in different parts of the country. Nevertheless, the increase in forest cover within the Bagmati catchment between 1988 and 2005 is consistent with FAO [23] findings, suggesting a 4% increase in forest cover of central Nepal during 1986–1994.
Current results further suggest that due to increasing human settlements, mixed urban land use takes place in agricultural areas of Kathmandu valley which eventually develops into built-up areas. Analysis showed a remarkable (513%) increase in combined area of mixed urban and built-up land use together with 38% decrease in agricultural area of upper catchment between 1988 and 2015. This is comparable with estimates of Ishtiaque et al. [40] showing a 412% increase in built-up area and 32% decrease in agricultural area within Kathmandu valley. However, the apparent differences could be related to differences in land use classification scheme and methods employed. Furthermore, our results are also similar to the 1978–2000 urban expansion of 450% estimated by Haack and Rafter [89]. The current estimate for 2015 is also comparable to the built-up area estimated by Kumar [90] within 2 km of Kathmandu metropolitan city. Population within the Bagmati catchment increased by almost 400% between 1971 and 2011 [56]. Furthermore, the urban population in Kathmandu valley, one of the fastest growing urban agglomerations in South Asia [91] has increased annually by 4% to 5.8% from 1970 to 2010 [92]. As pointed out by Pradhan [93], conversion of agricultural area to urban land in the upper catchment is consistent with the rapid population growth in Kathmandu valley.

4.2. Rainfall Variability

MK tests showed that the decrease in annual rainfall in the Bagmati catchment was not statistically significant; however, similar analysis of monthly rainfall suggests that June and July rainfall decreased significantly by 0.55% and 0.4% per year, respectively. Individual trends at 11 rainfall stations used in this study also suggested that most of them were receiving decreased rainfall with four of those stations (viz. Godavari, Pattharkot, Sindhuli Madi and Thankot) showing significantly decreasing trends [48]. However, significantly increasing rainfall at one of the stations (Makwanpur Gadhi) that represents a part of the middle catchment could also have moderated the negative change in the regional average for the entire catchment. Decadal departure patterns of the regional rainfall also support the trend results in all sub-catchments of the Bagmati River.
Current results for the period of 1970–2015 appear different to the findings of Shrestha and Sthapit [44], suggesting that average rainfall in the Bagmati catchment, including the lower Terai sub-catchment, was increasing significantly during 1981–2008. Decadal departure from the long-term mean (cf. Figure 5) as well as further trend analysis for the shorter period of 1981–2008 does show non-significantly increasing rainfall in the Bagmati catchment. However, considering multi-decadal variation present in the regional rainfall, this increase does not seem to represent the long-term change in rainfall over the catchment.
In contrast to the decreasing trend noticed in this study, Babel et al. [43] and Dahal et al. [94] predicted increasing rainfall for the 2020s and 2030s relative to the rainfall of the 1980s. These differences could be partly due to lower than long-term rainfalls in the 1980s which were used as baselines in both of those studies and the lower than average rainfalls after 2010. However, results of this study showing higher rainfall decrease in the upper catchment are consistent with the prediction by Babel et al. [43] that the upper catchment is set to receive lower rainfall compared to the middle one.
Previous studies have indicated that rainfall patterns in Nepal are somewhat linked to El Niño Southern Oscillation and Indian Ocean Dipole [68,95,96], but relationships are not consistent [95]. Shrestha and Kostaschuk [57] also suggested that influence of ENSO phases on the streamflow within Nepal vary from one region to another. However, examining the influence of these coupled ocean–atmosphere phenomenon on rainfall distribution is beyond the scope of this study.

4.3. River Discharge Variability

A decrease in annual river discharge from the Bagmati River in the 1970–2017 period was statistically significant. Trend analysis of all available data (1965–2017) for the Karmaiya/Pandheradovan station also confirmed that river discharge decreased significantly. Sharma and Shakya [28] also found that mean annual and monsoonal river discharge from the Bagmati catchment decreased significantly during the 1965–2000 period. Based on 1980–2009 records, Dhital et al. [45] found seasonal discharge of the Bagmati catchment decreasing in all seasons except pre-monsoon. Consistency of the current findings with the results based on different record periods confirms that river discharge from the catchment is truly decreasing in the long term. The analysis of decadal departure from long-term means showing substantially lower discharge after 2000 and higher discharge before 2000 also supports the long-term trend for the entire catchment.
Steadily decreasing decadal discharge from the upper catchment aligns well with trend result. Considering availability of records only from 1992, significantly decreasing discharge from the upper catchment is not directly comparable with the 1970–2017 results for the entire catchment. However, the most consistent and highest rate of rainfall decrease for 1970–2017 in the upper catchment and highest positive correlation between rainfall and river discharge indirectly suggest that the long-term rate of river discharge decrease would also be higher in the upper catchment compared to others.
Most of the river discharge, as recorded at Sundarijal station, especially during dry season, is diverted for hydropower and drinking water purposes. However, the long-term average of this discharge is less than 1% of the discharge at Pandheradovan, and the diversion started before the study period. Likewise, most of the discharge from the Kulekhani river catchment has been diverted to the Rapti basin for hydropower generation since 1982 [28,43]. This diverted discharge accounts for less than 3% of the annual discharge at the Pandheradovan station and is expected to remain unchanged in the future [43,94]. Further analysis by adding 3% discharge on observed discharge at Pandheradovan station from 1982 onwards showed that, this would not change the direction and/or significance of long-term trend results of this study. Hence, these diversion schemes were not considered in the analysis of temporal change in river discharge.
In contrast to the results reported here, Babel et al. [43] have predicted annual water availability for the 2020s in the Bagmati basin to increase by 1.04% and 6.29% relative to the 1980s under A2 and B2 scenarios respectively. Considering lower than long-term average rainfall (Section 4.3) and relatively lower discharge from the entire catchment in the 1980s, the increase for the 2020s may not be as high as they have estimated, if not actually a decrease instead, as suggested by the trend assessment of 1970–2017.

4.4. The Influences of Rainfall and LULC Changes on River Discharge

River discharge from the Bagmati catchment was shown to be significantly correlated with rainfall, even though the degree of association was different in the sub-catchments. Hannah et al. [35] also indicated that the relationship between precipitation and river discharge in the region varies from basin to basin depending on LULC.
Rainfall from the headwater catchment is decreasing non-significantly by 0.19% per year while river discharge is decreasing non-significantly by −0.29%. The MK test on estimated surface runoff in the headwater catchment showed a statistically non-significant decrease (−0.20%) which is very similar to the change in annual rainfall. The multiple regression results also suggested that the influence of LULC change in river discharge is negligible, and that influence of rainfall change is more important.
The Kathmandu valley area (downstream of Sundarijal and upstream of Khokana) is the most dynamic part of the Bagmati catchment. River discharge from the upper catchment during 1992–2017 has decreased by −2.05% per year even though the rate of rainfall decrease is only −0.83%. Despite an increase in urban area, which generally results in higher surface runoff [97,98], the MK test on 1992–2017 estimated that surface runoff for the upper catchment showed a significant decrease of −1.51%. Multiple regression analysis suggested that, compared to the influence of LULC changes, a decrease in rainfall is more influential on river discharge from the upper catchment. This finding is also supported by strong correlations between rainfall, river discharge and estimated surface runoff in the upper catchment.
In addition, part of the decrease in river discharge from the upper catchment may also be related to increased water demand. For example, many of the headwater streams in Kathmandu valley, especially during the dry season, are exploited for the purpose of drinking water. Further, the water table in the Kathmandu valley is reported to be lowering substantially due to low recharge and increased extraction of ground water driven by scarcity and low quality of surface water [29,50,57]. Some studies have also reported increasing temperatures in most parts of the catchment [45] which suggests higher rates of evaporation. Hence, urban expansion and pressure on water sources along with a rising temperature and decreasing rainfall seem to be related to the long-term decrease in river discharge from the upper catchment.
The rate of decrease for estimated surface runoff and river discharge are both higher than the rate of rainfall changes in the entire catchment. Apart from the urban growth in the upper catchment, the major LULC change in the middle catchment was an increase in forest cover by 4.4%. However, multiple regression results indicate that the influences of LULC changes on river discharge from the entire catchment are not significant and that changes in rainfall are the greatest contributing factor. Considering many tributaries in the middle catchment are unaffected by urban usage, decreasing rainfall along with increasing temperature [45] and higher evapotranspiration seemed to be influencing river discharge from the middle catchment. Therefore, river discharge decrease from Bagmati catchment can be attributed to decreasing rainfall, increasing temperature and differing influences of LULC in upper and middle catchments.
The correlation coefficient between annual rainfall in the headwater area of the Bagmati River and discharge at Sundarijal station was only 0.31. Further analysis of cross correlation (not shown here) suggested that annual rainfall does not have a lagged correlation with annual river discharge. However, cross correlation of monthly series showed a lagged correlation of one month between rainfall and discharge from headwater catchment. Considering high forest cover that reduces direct surface runoff, increases ground water retention and causes a higher density of natural springs, the lagged correlation in the headwater catchment is reasonable. On the other hand, no lagged correlation in either annual or monthly series suggests that immediate surface runoff of rainfall is highly influential on river discharge from the upper catchment, and secondly, that of the middle catchment. These results can be related to the combined proportion of urban and agricultural land in the upper and middle catchments.

5. Conclusions

Long-term changes in rainfall and river discharge of the Bagmati River catchment were analyzed with Mann–Kendall trend tests and decadal departures from the long-term mean using historical records between 1970 and 2017. Changes in LULC were also analyzed based on classification of Landsat images. Further, the impacts of rainfall and LULC changes on river discharge were examined using correlation and multiple regression analysis, and their relationship to surface runoff was estimated based on the curve number method.
River discharge from the Bagmati catchment is decreasing significantly even though decrease in rainfall was statistically non-significant. However, the decreasing trends of regional average rainfall and river discharge from the upper catchment are both significant and even depicted a higher rate of change compared to the entire catchment. Decadal departure of rainfall showed that the rainfall in all sub-catchments was generally higher than long-term average in the 1970s, while it was substantially lower after 2010 except in the headwater catchment. At the same time, river discharge from the headwater and entire catchment after 2000 was substantially lower, while discharge before 2000 was higher.
Most of the expansion in urban land use which occurred by gradual conversion of agricultural area to mixed urban area that further develops to built-up area is consistent with rapid population growth in the Kathmandu valley in the upper catchment, especially after 1988. In fact, the percentage of urban area in the upper catchment increased from 3.9 in 1988 to 23.8 in 2015. Another main LULC change in the Bagmati catchment was an over 4% increase in forest area with a higher rate in the middle catchment.
Multiple regression analysis showed that, despite a positive contribution from urban area increase, decreasing river discharge from upper catchment is largely dependent on changes in rainfall. Analysis of correlation in conjunction with LULC changes also suggested that river discharge is highly dependent on rainfall in urban area, and the correlation is weaker when the extent of human activities, especially urbanization, is limited. Changes in estimated surface runoff based on rainfall and LULC change also shows a higher rate of decrease in urban area. This is coupled with an increased use of water from headwater streams and groundwater in the upper catchment for use as drinking water. As a main conclusion, based on these findings, both regional climate change and local human activities seem to put increased pressure on water availability in the upper Bagmati catchment. In contrast, with no substantial urban growth, river discharges from the headwater and the entire catchments are decreasing at smaller rates compared to the upper catchment. This, together with results of multiple regression suggest that the headwater and middle catchments are mostly influenced by changes in climatic factors. These findings also point to the need for more detail hydrological modelling of river discharge in relation to topography, soil characteristics, climatic variables, LULC change and water extraction which would be beneficial for drawing more concrete conclusions.

Author Contributions

Conceptualization, D.T., A.D., M.K. and R.J.C.; methodology, D.T.; software, D.T.; validation, D.T. and A.D.; formal analysis, D.T., A.D. and M.K.; investigation, D.T.; resources, D.T.; data curation, D.T. and A.D.; writing—original draft preparation, D.T; writing—review and editing, D.T., A.D., M.K. and R.J.C.; visualization, D.T.; supervision, A.D., M.K. and R.J.C.; project administration, D.T.; funding acquisition, D.T.

Funding

This research was funded by Australian Government Research Training Program Scholarship and Curtin Research.

Acknowledgments

The authors are grateful to the Department of Hydrology and Meteorology (DHM), Nepal, especially the members of hydrology and meteorological data team for arranging the hydro-meteorological data. We are also thankful for free availability of Landsat images and the Shuttle Radar Topography Mission (SRTM) elevation data. The first author is sincerely grateful to the Australian Government Research Training Program Scholarship and Curtin Research Scholarship for funding the research.

Conflicts of Interest

The authors declare no conflict of interest.

References

  1. Pachauri, R.; Meyer, L.; Plattner, G.; Stocker, T. IPCC Climate Change 2014: Synthesis Report; Intergovernmental Panel on Climate Change: Geneva, Switzerland, 2014. [Google Scholar]
  2. Arnell, N.W.; Gosling, S.N. The impacts of climate change on river flow regimes at the global scale. J. Hydrol. 2013, 486, 351–364. [Google Scholar] [CrossRef]
  3. Jeuland, M.; Harshadeep, N.; Escurra, J.; Blackmore, D.; Sadoff, C. Implications of climate change for water resources development in the Ganges basin. Hydrol. Res. 2013, 15, 26–50. [Google Scholar] [CrossRef]
  4. Nakaegawa, T.; Kitoh, A.; Hosaka, M. Discharge of major global rivers in the late 21st century climate projected with the high horizontal resolution MRI-AGCMs. Hydrol. Process. 2013, 27, 3301–3318. [Google Scholar] [CrossRef]
  5. Kabo-Bah, A.T.; Diji, C.J.; Nokoe, K.; Mulugetta, Y.; Obeng-Ofori, D.; Akpoti, K. Multiyear Rainfall and Temperature Trends in the Volta River Basin and their Potential Impact on Hydropower Generation in Ghana. Climate 2016, 4, 49. [Google Scholar] [CrossRef]
  6. Jury, M.R.; Melice, J.L. Analysis of Durban rainfall and Nile river flow 1871–1999. Theor. Appl. Climatol. 2000, 67, 161–169. [Google Scholar] [CrossRef]
  7. Jiang, T.; Su, B.; Hartmann, H. Temporal and spatial trends of precipitation and river flow in the Yangtze River Basin, 1961–2000. Geomorphology 2007, 85, 143–154. [Google Scholar] [CrossRef]
  8. Mirza, M.M.Q.; Warrick, R.A.; Ericksen, N.J. The Implications of Climate Change on Floods of the Ganges, Brahmaputra and Meghna Rivers in Bangladesh. Clim. Chang. 2003, 57, 287–318. [Google Scholar] [CrossRef]
  9. Whitehead, P.G.; Sarkar, S.; Jin, L.; Futter, M.; Caesar, J.; Barbour, E.; Butterfield, D.; Sinha, R.; Nicholls, R.J.; Hutton, C.; et al. Dynamic modeling of the Ganga river system: Impacts of future climate and socio-economic change on flows and nitrogen fluxes in India and Bangladesh. Environ. Sci. Process. Impacts 2015, 17, 1082–1097. [Google Scholar] [CrossRef]
  10. Moors, E.J.; Groot, A.; Biemans, H.; Van Scheltinga, C.T.; Siderius, C.; Stoffel, M.; Huggel, C.; Wiltshire, A.; Mathison, C.; Ridley, J.; et al. Adaptation to changing water resources in the Ganges basin, northern India. Environ. Sci. Policy 2011, 14, 758–769. [Google Scholar] [CrossRef]
  11. Santini, M.; Di Paola, A. Changes in the world rivers’ discharge projected from an updated high resolution dataset of current and future climate zones. J. Hydrol. 2015, 531, 768–780. [Google Scholar] [CrossRef]
  12. El-Khoury, A.; Seidou, O.; Lapen, D.; Que, Z.; Mohammadian, M.; Sunohara, M.; Bahram, D.; Mohammadian, A. Combined impacts of future climate and land use changes on discharge, nitrogen and phosphorus loads for a Canadian river basin. J. Environ. Manag. 2015, 151, 76–86. [Google Scholar] [CrossRef] [PubMed]
  13. Schilling, K.E.; Chan, K.S.; Liu, H.; Zhang, Y.K. Quantifying the effect of land use land cover change on increasing discharge in the Upper Mississippi River. J. Hydrol. 2010, 387, 343–345. [Google Scholar] [CrossRef]
  14. Kalyanapu, A.J.; Burian, S.J.; McPherson, T.N. Effect of land use-based surface roughness on hydrologic model output. J. Spat. Hydrol. 2010, 9, 51–71. [Google Scholar]
  15. Bosch, J.; Hewlett, J. A review of catchment experiments to determine the effect of vegetation changes on water yield and evapotranspiration. J. Hydrol. 1982, 55, 3–23. [Google Scholar] [CrossRef]
  16. Wakode, H.B.; Baier, K.; Jha, R.; Azzam, R. Impact of urbanization on groundwater recharge and urban water balance for the city of Hyderabad, India. Int. Soil Water Conserv. Res. 2018, 6, 51–62. [Google Scholar] [CrossRef]
  17. Schoonover, J.E.; Lockaby, B.G. Land cover impacts on stream nutrients and fecal coliform in the lower Piedmont of West Georgia. J. Hydrol. 2006, 331, 371–382. [Google Scholar] [CrossRef]
  18. Costa, M.H.; Botta, A.; Cardille, J.A. Effects of large-scale changes in land cover on the discharge of the Tocantins River, Southeastern Amazonia. J. Hydrol. 2003, 283, 206–217. [Google Scholar] [CrossRef]
  19. Mwangi, H.M.; Julich, S.; Patil, S.D.; McDonald, M.A.; Feger, K.H. Relative contribution of land use change and climate variability on discharge of upper Mara River, Kenya. J. Hydrol. Reg. Stud. 2016, 5, 244–260. [Google Scholar] [CrossRef]
  20. Khan, M.R.; Voss, C.I.; Yu, W.; Michael, H.A. Water Resources Management in the Ganges Basin: A Comparison of Three Strategies for Conjunctive Use of Groundwater and Surface Water. Water Resour. Manag. 2014, 28, 1235–1250. [Google Scholar] [CrossRef]
  21. Wilk, J.; Andersson, L.; Plermkamon, V. Hydrological impacts of forest conversion to agriculture in a large river basin in northeast Thailand. Hydrol. Process. 2001, 15, 2729–2748. [Google Scholar] [CrossRef]
  22. Pizarro, R.; Araya, S.; Jordán, C.; Fari, C.; Flores, J.P.; Bro, P.B. The effects of changes in vegetative cover on river flows in the Purapel river basin of central Chile. J. Hydrol. 2006, 327, 249–257. [Google Scholar] [CrossRef]
  23. FAO. Nepal Forestry Outlook Study; Food and Agriculture Organization of the United Nations: Bangkok, Thailand, 2009. [Google Scholar]
  24. Chaudhary, R.P.; Uprety, Y.; Rimal, S.K. Deforestation in Nepal: Causes, consequences and responses. In Biological and Environmental Hazards and Disasters; Elsevier: Amsterdam, The Netherlands, 2016; pp. 335–372. [Google Scholar]
  25. Gautam, M.R.; Acharya, K.; Tuladhar, M.K. Upward trend of streamflow and precipitation in a small, non-snow-fed, mountainous watershed in Nepal. J. Hydrol. 2010, 387, 304–311. [Google Scholar] [CrossRef]
  26. Nandargi, S.; Dhar, O.N. Extreme rainfall events over the Himalayas between 1871 and 2007. Hydrol. Sci. J. 2011, 56, 930–945. [Google Scholar] [CrossRef]
  27. ADB. Environmental Impact Assessment, Bagmati River Basin Improvement Project; DHI Group for Asian Development Bank: Kathmandu, Nepal, 2013. [Google Scholar]
  28. Sharma, R.H.; Shakya, N.M. Hydrological changes and its impact on water resources of Bagmati watershed, Nepal. J. Hydrol. 2006, 327, 315–322. [Google Scholar] [CrossRef]
  29. UNEP. Nepal: State of the Environment; United Nations Environment Programme: Khlong Luang, Thailand, 2001. [Google Scholar]
  30. KUKL. Kathmandu Valley Water Supply and Wastewater System Improvement (KVWSWSI) Project Feasibility Study; ADB and Kathmandu Upatyaka Khanepani Limited (KUKL): Kathmandu, Nepal, 2010. [Google Scholar]
  31. Chalise, S.R.; Kansakar, S.R.; Rees, G.; Croker, K.; Zaidman, M. Management of water resources and low flow estimation for the Himalayan basins of Nepal. J. Hydrol. 2003, 282, 25–35. [Google Scholar] [CrossRef]
  32. Bohlinger, P.; Sorteberg, A. A comprehensive view on trends in extreme precipitation in Nepal and their spatial distribution. Int. J. Climatol. 2018, 38, 1833–1845. [Google Scholar] [CrossRef]
  33. Mishra, Y.; Nakamura, T.; Babel, M.S.; Ninsawat, S.; Ochi, S. Impact of Climate Change on Water Resources of the Bheri River Basin, Nepal. Water 2018, 10, 220. [Google Scholar] [CrossRef]
  34. Khatiwada, K.R.; Panthi, J.; Shrestha, M.L.; Nepal, S. Hydro-Climatic Variability in the Karnali River Basin of Nepal Himalaya. Climate 2016, 4, 17. [Google Scholar] [CrossRef]
  35. Hannah, D.M.; Kansakar, S.R.; Gerrard, A.; Rees, G. Flow regimes of Himalayan rivers of Nepal: Nature and spatial patterns. J. Hydrol. 2005, 308, 18–32. [Google Scholar] [CrossRef]
  36. LRMP. Land Utilization Report: Land Resource Mapping Project (LRMP); Kenting Earth Sceince Canada and Department of Topography, Government of Nepal: Kathmandu, Nepal, 1986.
  37. DFRS. Forest Resouces of Nepal (1987–1998); Department of Forest Research and Survey (DFRS), Ministry of Forest and Soil Conservation: Kathmandu, Nepal, 1999.
  38. Uddin, K.; Shrestha, H.L.; Murthy, M.; Bajracharya, B.; Shrestha, B.; Gilani, H.; Pradhan, S.; Dangol, B. Development of 2010 national land cover database for the Nepal. J. Environ. Manag. 2015, 148, 82–90. [Google Scholar] [CrossRef]
  39. Thapa, R.B.; Murayama, Y. Scenario based urban growth allocation in Kathmandu Valley, Nepal. Landsc. Urban Plan. 2012, 105, 140–148. [Google Scholar] [CrossRef]
  40. Ishtiaque, A.; Shrestha, M.; Chhetri, N. Rapid Urban Growth in the Kathmandu Valley, Nepal: Monitoring Land Use Land Cover Dynamics of a Himalayan City with Landsat Imageries. Environments 2017, 4, 72. [Google Scholar] [CrossRef]
  41. Neupane, R.P.; White, J.D.; Alexander, S.E. Projected hydrologic changes in monsoon-dominated Himalaya Mountain basins with changing climate and deforestation. J. Hydrol. 2015, 525, 216–230. [Google Scholar] [CrossRef]
  42. Shrestha, S.; Shrestha, M.; Babel, M.S. Modelling the potential impacts of climate change on hydrology and water resources in the Indrawati River Basin, Nepal. Environ. Earth Sci. 2016, 75, 280. [Google Scholar] [CrossRef]
  43. Babel, M.S.; Bhusal, S.P.; Wahid, S.M.; Agarwal, A. Climate change and water resources in the Bagmati River Basin, Nepal. Theor. Appl. Climatol. 2014, 115, 639–654. [Google Scholar] [CrossRef]
  44. Shrestha, R.M.; Sthapit, A.B. Temporal Variation of Rainfall in the Bagmati River Basin, Nepal. Nepal J. Sci. Technol. 2015, 16, 31–40. [Google Scholar] [CrossRef]
  45. Dhital, Y.P.; Tang, Q.; Shi, J. Hydroclimatological changes in the Bagmati River Basin, Nepal. J. Geogr. Sci. 2013, 23, 612–626. [Google Scholar] [CrossRef]
  46. Dhital, Y.P.; Kayastha, R.B. Frequency analysis, causes and impacts of flooding in the Bagmati River Basin, Nepal. J. Flood Risk Manag. 2013, 6, 253–260. [Google Scholar] [CrossRef]
  47. Dhital, Y.P.; Kayastha, R.B.; Eslamian, S. Precipitation and discharge pattern analysis: A case study of Bagmati River basin, Nepal. J. Flood Eng. 2011, 2, 49–60. [Google Scholar]
  48. Tuladhar, D.; Dewan, A.; Kuhn, M.; Corner, R.J. Spatio-temporal rainfall variability in the Himalayan mountain catchment of the Bagmati River in Nepal. Theor. Appl. Climatol. 2019, 1–16. [Google Scholar] [CrossRef]
  49. Panthi, J.; Li, F.; Wang, H.; Aryal, S.; Dahal, P.; Ghimire, S.; Kabenge, M. Evaluating climatic and non-climatic stresses for declining surface water quality in Bagmati River of Nepal. Environ. Monit. Assess. 2017, 189, 292. [Google Scholar] [CrossRef] [PubMed]
  50. Thakur, J.K.; Neupane, M.; Mohanan, A.A. Water poverty in upper Bagmati River Basin in Nepal. Water Sci. Technol. 2017, 31, 93–108. [Google Scholar] [CrossRef] [Green Version]
  51. Jarvis, A.; Reuter, H.I.; Nelson, A.; Guevara, E. Hole-Filled SRTM for the Globe Version 4. Available online: http://srtm.csi.cgiar.org (accessed on 9 September 2016).
  52. Kansakar, S.R.; Hannah, D.M.; Gerrard, J.; Rees, G. Spatial pattern in the precipitation regime of Nepal. Int. J. Climatol. 2004, 24, 1645–1659. [Google Scholar] [CrossRef]
  53. Mishra, B.K.; Herath, S. Assessment of future floods in the Bagmati River Basin of Nepal using bias-corrected daily GCM precipitation data. J. Hydrol. Eng. 2014, 20. [Google Scholar] [CrossRef]
  54. Pokharel, A.K.; Hallett, J. Distribution of rainfall intensity during the summer monsoon season over Kathmandu, Nepal. Weather 2015, 70, 257–261. [Google Scholar] [CrossRef]
  55. Nayava, J.L. Heavy monsoon rainfall in Nepal. Weather 1974, 29, 443–450. [Google Scholar] [CrossRef]
  56. CBS. Population Monograph of Nepal; Central Bureau of Statistics: Kathmandu, Nepal, 2014; p. 362.
  57. Shrestha, M.N. Groundwater use in the Kathmandu Valley: An analysis of pre-and post Melamchi scenarios. In Kathmandu Valley Groundwater Outlook; Asian Institute of Technology, The Small Earth Nepal, Center of Research for Environment Energy Water, International Research Center for River Basin Environment-University of Yamanashi: Kathmandu, Nepal, 2012; pp. 90–96. [Google Scholar]
  58. NRB. The Share of Kathmandu Valley in National Economy; Nepal Rastra Bank, Research Department: Kathmandu, Nepal, 2012. [Google Scholar]
  59. Royer, A.; Charbonneau, U.; Brochu, R.; Murphy, J.M.; Teillet, P.M. Radiometric comparison of the LANDSAT-5 TM and MSS sensors. Int. J. Remote Sens. 1987, 8, 579–591. [Google Scholar] [CrossRef]
  60. Saunier, S.; Northrop, A.; Lavender, S.; Galli, L.; Ferrara, R.; Mica, S.; Biasutti, R.; Goryl, P.; Gascon, F.; Meloni, M. European Space agency (ESA) Landsat MSS/TM/ETM+/OLI archive: 42 years of our history. In Proceedings of the 2017 9th International Workshop on the Analysis of Multitemporal Remote Sensing Images (MultiTemp), Brugge, Belgium, 27–29 June 2017; pp. 1–9. [Google Scholar]
  61. Vittek, M.; Brink, A.; Donnay, F.; Simonetti, D.; Desclée, B. Land Cover Change Monitoring Using Landsat MSS/TM Satellite Image Data over West Africa between 1975 and 1990. Remote Sens. 2014, 6, 658–676. [Google Scholar] [CrossRef] [Green Version]
  62. Yang, X.; Lu, X.; Park, E.; Tarolli, P. Impacts of Climate Change on Lake Fluctuations in the Hindu Kush-Himalaya-Tibetan Plateau. Remote Sens. 2019, 11, 1082. [Google Scholar] [CrossRef] [Green Version]
  63. Taft, L.; Kühle, L. Glacier Changes between 1976 and 2015 in the Source Area of the Ayeyarwady (Irrawaddy) River, Myanmar. Water 2018, 10, 1850. [Google Scholar] [CrossRef] [Green Version]
  64. Ross, C.; Fildes, S.; Millington, A.C. Land-Use and Land-Cover Change in the Páramo of South-Central Ecuador, 1979–2014. Land 2017, 6, 46. [Google Scholar] [CrossRef] [Green Version]
  65. R Core Team. R: A Language and Environment for Statistical Computing; Foundation for Statistical Computing: Vienna, Austria, 2013. [Google Scholar]
  66. Costa, A.C.; Soares, A. Homogenization of Climate Data: Review and New Perspectives Using Geostatistics. Math. Geosci. 2009, 41, 291–305. [Google Scholar] [CrossRef]
  67. Chen, H.; Wang, X.L.; Wu, Y.; Feng, Y.; Pu, Q. New Techniques for the Detection and Adjustment of Shifts in Daily Precipitation Data Series. J. Appl. Meteorol. Climatol. 2010, 49, 2416–2436. [Google Scholar]
  68. Shrestha, M.L. Interannual variation of summer monsoon rainfall over Nepal and its relation to Southern Oscillation Index. Meteorol. Atmos. Phys. 2000, 75, 21–28. [Google Scholar] [CrossRef]
  69. Ly, S.; Charles, C.; Degré, A. Different methods for spatial interpolation of rainfall data for operational hydrology and hydrological modeling at watershed scale: A review. Biotechnol. Agron. Soc. Environ. 2013, 17, 392–406. [Google Scholar]
  70. Goovaerts, P. Geostatistical approaches for incorporating elevation into the spatial interpolation of rainfall. J. Hydrol. 2000, 228, 113–129. [Google Scholar] [CrossRef]
  71. Li, J.; Heap, A.D. A review of comparative studies of spatial interpolation methods in environmental sciences: Performance and impact factors. Ecol. Inform. 2011, 6, 228–241. [Google Scholar] [CrossRef]
  72. Angulo-Martínez, M.; López-Vicente, M.; Vicente-Serrano, S.M.; Beguería, S. Mapping rainfall erosivity at a regional scale: A comparison of interpolation methods in the Ebro Basin (NE Spain). Hydrol. Earth Syst. Sci. 2009, 6, 417–453. [Google Scholar] [CrossRef] [Green Version]
  73. Hartkamp, A.D.; De Beurs, K.; Stein, A.; White, J.W. Interpolation Techniques for Climate Variables; Cimmyt: Mexico City, Mexico, 1999. [Google Scholar]
  74. Webster, R.; Oliver, M.A. Geostatistics for Environmental Scientists; John Wiley & Sons: Hoboken, NJ, USA, 2007. [Google Scholar]
  75. Gemmer, M.; Becker, S.; Jiang, T. Observed monthly precipitation trends in China 1951–2002. Theor. Appl. Climatol. 2004, 77, 39–45. [Google Scholar] [CrossRef]
  76. Pingale, S.M.; Khare, D.; Jat, M.K.; Adamowski, J. Spatial and temporal trends of mean and extreme rainfall and temperature for the 33 urban centers of the arid and semi-arid state of Rajasthan, India. Atmos. Res. 2014, 138, 73–90. [Google Scholar] [CrossRef]
  77. Hamed, K.H. Trend detection in hydrologic data: The Mann–Kendall trend test under the scaling hypothesis. J. Hydrol. 2008, 349, 350–363. [Google Scholar] [CrossRef]
  78. Gocic, M.; Trajkovic, S. Analysis of changes in meteorological variables using Mann-Kendall and Sen’s slope estimator statistical tests in Serbia. Glob. Planet. Chang. 2013, 100, 172–182. [Google Scholar] [CrossRef]
  79. Da Silva, R.M.; Santos, C.A.G.; Moreira, M.; Corte-Real, J.; Silva, V.C.L.; Medeiros, I.C. Rainfall and river flow trends using Mann–Kendall and Sen’s slope estimator statistical tests in the Cobres River basin. Nat. Hazards 2015, 77, 1205–1221. [Google Scholar] [CrossRef]
  80. Javari, M. Spatial variability of rainfall trends in Iran. Arab. J. Geosci. 2017, 10, 78. [Google Scholar] [CrossRef]
  81. Sadhukhan, I.; Lohar, D.; Pal, D. Premonsoon season rainfall variability over Gangetic West Bengal and its neighbourhood, India. Int. J. Climatol. 2000, 20, 1485–1493. [Google Scholar] [CrossRef]
  82. Woodward, D.E.; Hawkins, R.H.; Jiang, R.; Hjelmfelt, J.; Allen, T.; Van Mullem, J.A.; Quan, Q.D. Runoff curve number method: Examination of the initial abstraction ratio. In Proceedings of the World Water & Environmental Resources Congress 2003, Philadelphia, PA, USA, 23–26 June 2003; pp. 1–10. [Google Scholar]
  83. FAO. Digital Soil Map of the World; Version 3.6.; Food and Agriculture Organization of the United Nations, Land and Water Development Division: Rome, Italy, 2003. [Google Scholar]
  84. Mishra, B.K.; Takara, K.; Tachikawa, Y. Integrating the NRCS Runoff Curve Number in Delineation of Hydrologic Homogeneous Regions. J. Hydrol. Eng. 2009, 14, 1091–1097. [Google Scholar] [CrossRef]
  85. Hawkins, R.H.; Theurer, F.D.; Rezaeianzadeh, M. Understanding the Basis of the Curve Number Method for Watershed Models and TMDLs. J. Hydrol. Eng. 2019, 24. [Google Scholar] [CrossRef]
  86. Tu, M.C.; Smith, P.; Filippi, A.M. Hybrid forward-selection method-based water-quality estimation via combining Landsat TM, ETM+, and OLI/TIRS images and ancillary environmental data. PLoS ONE 2018, 13, e0201255. [Google Scholar] [CrossRef] [Green Version]
  87. Judd, C.M.; McClelland, G.H.; Ryan, C.S. Data Analysis: A Model Comparison Approach; Routledge: New York, USA, 2017. [Google Scholar]
  88. Reddy, C.S.; Pasha, S.V.; Satish, K.V.; Saranya, K.R.L.; Jha, C.S.; Murthy, Y.V.N.K. Quantifying nationwide land cover and historical changes in forests of Nepal (1930–2014): Implications on forest fragmentation. Biodivers. Conserv. 2018, 27, 91–107. [Google Scholar] [CrossRef]
  89. Haack, B.N.; Rafter, A. Urban growth analysis and modeling in the Kathmandu Valley, Nepal. Habitat Int. 2006, 30, 1056–1065. [Google Scholar] [CrossRef]
  90. Kumar, A. Analysing urban sprawl and land consumption patterns in major capital cities in the Himalayan region using geoinformatics. Appl. Geogr. 2017, 89, 112–123. [Google Scholar]
  91. Muzzini, E.; Aparicio, G. Urban Growth and Spatial Transition in Nepal: An Initial Assessment; The World Bank: Washington, DC, USA, 2013. [Google Scholar]
  92. UN-DESA. World Urbanization Prospects: The 2014 Revision; United Nations Department of Economics and Social Affairs, Population Division: New York, NY, USA, 2015. [Google Scholar]
  93. Pradhan, P.K. Population growth, migration and urbanisation. Environmental consequences in Kathmandu valley, Nepal. In Environmental Change and Its Implications for Population Migration; Springer: Dordrecht, The Netherlands, 2004; pp. 177–199. [Google Scholar]
  94. Dahal, V.; Shakya, N.M.; Bhattarai, R. Estimating the Impact of Climate Change on Water Availability in Bagmati Basin, Nepal. Environ. Process. 2016, 3, 1–17. [Google Scholar] [CrossRef]
  95. Ichiyanagi, K.; Yamanaka, M.D.; Muraji, Y.; Vaidya, B.K. Precipitation in Nepal between 1987 and 1996. Int. J. Climatol. 2007, 27, 1753–1762. [Google Scholar] [CrossRef]
  96. Sigdel, M.; Ikeda, M. Summer Monsoon Rainfall over Nepal Related with Large-Scale Atmospheric Circulations. J. Earth Sci. Clim. Chang. 2012, 3, 2. [Google Scholar] [CrossRef]
  97. Weng, Q. Modeling urban growth effects on surface runoff with the integration of remote sensing and GIS. Environ. Manag. 2001, 28, 737–748. [Google Scholar] [CrossRef]
  98. Pokhrel, B.K. Impact of Land Use Change on Flow and Sediment Yields in the Khokana Outlet of the Bagmati River, Kathmandu, Nepal. Hydrology 2018, 5, 22. [Google Scholar] [CrossRef] [Green Version]
Figure 1. The Bagmati catchment and location of hydro-meteorological stations (elevation data source: SRTM).
Water 11 02444 g001
Figure 2. Land use/land cover in the Bagmati catchment—1975, 1988, 1995, 2005 and 2015.
Water 11 02444 g002
Figure 3. Long-term trend in annual average rainfall of (a) headwater, (b) upper, (c) middle and (d) entire Bagmati catchments.
Water 11 02444 g003
Figure 4. Decadal departure of rainfall in (a) headwater, (b) upper, (c) middle and (d) entire Bagmati catchments. Note: labels associated to the bars represent percentage of departure in relation to long-term mean.
Water 11 02444 g004
Figure 5. Long-term trend in annual average discharge of (a) headwater, (b) upper and (c) entire Bagmati catchments.
Water 11 02444 g005
Figure 6. Decadal departure of river discharge from (a) headwater, (b) upper and (c) entire Bagmati catchments. Note: labels associated to the bars represent percentage of departure in relation to long-term mean.
Water 11 02444 g006
Figure 7. Relationships of annual river discharge with rainfall and estimated surface runoff (derived based on rainfall and LULC) for (a) headwater, (b) upper and (c) entire catchments. Note: values on y-axis represent percentages in relation to corresponding long-term means.
Water 11 02444 g007
Table 1. Landsat images used for mapping the land use/land cover (LULC) of the catchment.
Satellite-SensorDate of imagePath/Row
Landsat 2–Multi Spectral Scanner (MSS)12 November 1975151/041
Landsat 5–Thematic Mapper (TM)3 April 1988141/041
Landsat 5-TM7 April 1995141/041
Landsat 5-TM2 April 2005 & 31 January 2006141/041
Landsat 8–Operational Land Imager (OLI)24 January 2015 & 12 February 2016141/041
Table 2. LULC in the entire Bagmati catchment between 1975 and 2015 (areas shown in km2).
LULC19751988199520052015Average (1975–2015)
Forest1688
(59.8%)
1682
(59.7%)
1721
(61.1%)
1753
(62.2%)
1757
(62.3%)
1720
(61.0%)
Agriculture975
(34.6%)
1013
(35.9%)
923
(32.7%)
873
(31.0%)
842
(29.9%)
925
(32.8%)
Mixed urban9
(0.3%)
15
(0.5%)
29
(1.0%)
32
(1.1%)
41
(1.5%)
25
(0.9%)
Built-up5
(0.2%)
8
(0.3%)
35
(1.2%)
57
(2.0%)
100
(3.5%)
41
(1.5%)
Others144
(5.1%)
101
(3.6%)
111
(3.9%)
104
(3.7%)
78
(2.8%)
108
(3.8%)
Note: values within parenthesis represent percentages of the LULC area in relation to the total area.
Table 3. LULC in the upper Bagmati catchment between 1975 and 2015 (areas shown in km2).
LULC19751988199520052015Average (1975–2015)
Forest207
(35.1%)
197
(33.3%)
206
(34.9%)
215
(36.4%)
213
(36.1%)
208
(35.3%)
Agriculture357
(60.6%)
366
(61.9%)
306
(51.9%)
275
(46.5%)
223
(37.8%)
305
(51.7%)
Mixed urban9
(1.5%)
15
(2.5%)
29
(4.9%)
32
(5.4%)
41
(6.9%)
25
(4.2%)
Built-up5
(0.8%)
8
(1.4%)
35
(5.9%)
57
(9.6%)
100
(16.9%)
41
(6.9%)
Others11
(1.9%)
5
(0.8%)
14
(2.4%)
12
(2.0%)
13
(2.2%)
11
(1.9%)
Note: values within parenthesis represent percentages of the LULC area in relation to the total area. LULC areas within headwater Bagmati catchment are not included in this table.
Table 4. LULC in the middle Bagmati catchment between 1975 and 2015 (areas shown in km2).
LULC19751988199520052015Average (1975–2015)
Forest1467
(66.2%)
1473
(66.5%)
1501
(67.8%)
1525
(68.8%)
1531
(69.2%)
1499
(67.7%)
Agriculture617
(27.9%)
645
(29.1%)
616
(27.8%)
597
(27.0%)
617
(27.9%)
618
(27.9%)
Others131
(5.9%)
96
(4.3%)
97
(4.4%)
93
(4.2%)
64
(2.9%)
96
(4.3%)
Note: values within parenthesis represent percentages of the LULC area in relation to the total area. Areas of mixed urban and built-up land were negligible (e.g., <1%), so are not listed separately.
Table 5. LULC in the headwater Bagmati catchment between 1975 and 2015 (areas shown in km2).
LULC19751988199520052015Average (1975–2015)
Forest13.6
(88.9%)
13.2
(85.2%)
13
(84.4%)
13.2
(86.3%)
13.4
(87%)
13.3
(86.4%)
Agriculture1.6
(10.5%)
2
(12.9%)
1.6
(10.4%)
1.5
(9.8%)
1.7
(11.0%)
1.7
(11.0%)
Others0.1
(0.7%)
0.3
(1.9%)
0.8
(5.2%)
0.6
(3.9%)
0.3
(1.9%)
0.4
(2.6%)
Note: values within parenthesis represent percentages of the LULC area in relation to the total area. Areas of mixed urban and built-up land were negligible (e.g., <1%), so are not listed separately.
Table 6. Correlation of river discharge with rainfall and surface runoff estimated based on rainfall and LULC changes.
CatchmentRainfall and River DischargeEstimated Surface Runoff and River Discharge
RP ValueRP Value
Headwater catchment0.220.130.100.48
Upper catchment0.790.000.750.00
Entire catchment0.580.000.540.00
Table 7. Multiple regression results showing contributions of rainfall and major LULC changes on river discharge.
CatchmentNo. of ObservationOverall R SquareP ValuePredictorP ValueImportanceSlope %
Headwater catchment480.150.07Forest0.810.010.68
Agriculture0.110.351.01
Rainfall0.030.690.67
Upper catchment250.750.00Agriculture0.030.09−0.82
Urban0.020.11−0.19
Rainfall0.000.320.09
Entire catchment480.490.00Forest0.160.05−1.30
Agriculture0.350.020.18
Urban0.100.070.08
Rainfall0.000.670.14
Note: “Importance” represents the ratio of change in R2 (when the predictor variable of interest is not considered) to the overall R2 (when all predictor variables are considered) [86,87]. “Slope %” indicates percentage of regression coefficient in relation to intercept value.

