Article

Consequences of the Integration of a Hyperbolic Funnel into a Showerhead for Droplets, Jet Break-Up Lengths, and Physical-Chemical Parameters

by
Maarten V. van de Griend
1,2,*,
Luewton L. F. Agostinho
1,3,
Elmar C. Fuchs
1,
Nigel Dyer
1 and
Willibald Loiskandl
2
1
Wetsus, European Centre of Excellence for Sustainable Water Technology, 8911 MA Leeuwarden, The Netherlands
2
Institute of Hydraulics and Rural Water Management, University of Natural Resources and Life Sciences, Muthgasse 18, 1190 Vienna, Austria
3
Water Technology Group, NHL Stenden University of Applied Sciences, 8917 DD Leeuwarden, The Netherlands
*
Author to whom correspondence should be addressed.
Water 2019, 11(12), 2446; https://doi.org/10.3390/w11122446
Submission received: 14 October 2019 / Revised: 8 November 2019 / Accepted: 18 November 2019 / Published: 21 November 2019
(This article belongs to the Special Issue Water Supply and Water Scarcity)

Abstract

:
Introducing a hyperbolic vortex into a showerhead is a possibility to achieve higher spray velocities for a given discharge without reducing the nozzle diameter. Due to the introduction of air bubbles into the water by the vortex, the spray is pushed from a transition (dripping faucet) regime into a jetting regime, which results in higher droplet and jet velocities using the same nozzle diameter and throughput. The same droplet and jet diameters were realized compared to a showerhead without a vortex. Assuming that the satisfaction of a shower experience is largely dependent on the droplet size and velocity, the implementation of a vortex in the showerhead could provide the same shower experience with ~14% less water consumption compared to the normal showerhead. A full optical and physical analysis was presented, and the important chemical parameters were investigated.

1. Introduction

1.1. Motivation

The shortage of water resources due to population concentration in urban areas is a serious issue, which calls for water-saving measures on a global scale. With an expected world population from 7.7 billion people today to 9.7 billion people by 2050 and an urban population increase of 4.3 billion today to 6.7 billion in 2050 [1], this puts an additional strain on the availability of potable water. This is further increased by decreasing mountain snowpacks due to global warming, which feed reservoirs and streams in summer with meltwater. When this source provides less feed flow than usual, problems will ensue [2]. In addition to water scarcity, energy is required to transport and purify water before it reaches the consumer, which will partly increase CO2 emissions [2]. Water reduction devices are commonly used to decrease domestic water consumption [3,4] and therefore contribute to decreasing in CO2 emissions. Among such devices, those dedicated to shower water consumption are especially challenging as it is known that total flow influences consumer satisfaction [5]. More analytically, consumer (shower) satisfaction depends on total pressure exerted by water on consumer’s skin, within a certain limit, i.e., both high- and low-pressure cause discomforts. Consequently, just reducing the water flow in order to save water and energy will also decrease customer satisfaction. For this purpose, smaller nozzles with higher pressures are often used, which are also more prone to clogging issues involving, e.g., particle deposition and lime precipitation. In this work, we presented an alternative approach, which produces higher spray velocities at the same flow rate compared to a normal showerhead. Since such a device builds on purely geometric modifications of the showerhead and there is no change in energy input, it provides a low cost and easy to implement a solution for more sustainable, equally comfortable showers. The consequences of such modifications on the overall water characteristics and shower performance would be presented in sequence.

1.2. Hyperbolic Vortices

Vortices are present in a number of natural phenomena. The most commonly known natural phenomenon, which can be described using vortex flow fields, is probably the tornado [6]. Another common example is the flow pattern observed when water, accumulated in a sink, flows down through the drain after opening its cap. Such flow also shows a resemblance to a hyperbolic velocity field.
Naturally occurring hyperbolic vortices were well described by the Austrian forester and bionics pioneer Viktor Schauberger [7] in the last century. Later on, his son Walter Schauberger [8] derived the mathematical formulation to describe the hyperbolic cone as a basic shape in which water vortices would appear.
For mathematicians, a hyperbola is a set of points, such that for any point P of the set, the absolute difference of the distances |PF1|, |PF2| to two fixed points, F1 and F2 (the foci), is constant, usually denoted as 2a with a > 0. Such geometric space can be represented as
H = { P   |   | P F 2 | | P F 1 | = 2 a }
Looking more into the physical aspects of the phenomenon, hyperbolic flows can build very particular velocity and force (vector) fields. Such fields are directly related to the hydrodynamics of the process. Mostly, in literature, the physical analyses of such flows are done to model tornados and predict their formation and trajectory [9,10] using incompressible Navier–Stokes equations with specific boundary conditions. Here the pressure gradient is considered the most important one as it justifies the rotating and uplifting flow movements. Some examples are the Trap [11] model based on satellite obtained information with defined pressure gradient boundary conditions. Rotunno [12] assumed the existence of what they called “stagnation walls”, which had basically no flow in or out in the vertical plane, which would force the flow to go up or down, generating thus the uplifting movement.
Below is a list of the most commonly covered aspects of this phenomenon (from [12]):
  • the velocity vector field of such structures is quite particular, meaning particles immersed in vortex structures, depending on their size, will be subjected to different tangential, axial, and radial velocities. This varies (considerably) with position and time,
  • when considering liquid-based hyperbolic flow structures, there is always a well-defined air-liquid internal interface, which could be eventually used to enhance gas-diffusion in the liquid,
  • for liquid structures, there is also, and necessarily, a solid-liquid interface, which would contribute to enhancing shear stresses and would be partially responsible (together with viscous stresses) for the axial velocity gradient and energy losses of the tangential component of the liquid velocity.
In this work, a setup was built using a modified showerhead, which would allow the formation of a hyperbolic vortex inside the head itself. Because it was expected that the presence of the vortex could allow extra aeration of the showered water, some characteristics of the water before and after the break-up of the liquid jets were analyzed and compared to a conventional showerhead. The authors also used the work of [5] to verify the possible influences on what they classified as “shower’s user comfort”, which, as explained by them, depends on flow rate, water temperature, and droplet impact pressure. Results showed that the modified tangential velocity field, created by the hyperbolically shaped geometry, accelerated the flow tangentially. After entering a spray plate, which acted as a dividing flow manifold, this tangential velocity directly impacted the pressure profile over the nozzles, which changed the total flow profile, causing different jet-break regimes. It would be shown that the modified showerhead produces break-up in the “jetting” regime and in the “transition” regime, where the water does not quite behave like a jet-producing small droplets (1.8 times nozzle diameter) but also not quite like a “dripping” regime, producing very large droplets formed when capillary forces are not enough to withstand gravity [13]. This regime change was possible because the modified geometry allowed air bubbles to enter the showerhead and mix with the water inside it, which brought both consequences to the break-up mechanism and, in a minor fashion, to the diffusion of gases in the liquid. These observations would be supported by the results of chemical and optical experiments.

2. Materials and Methods
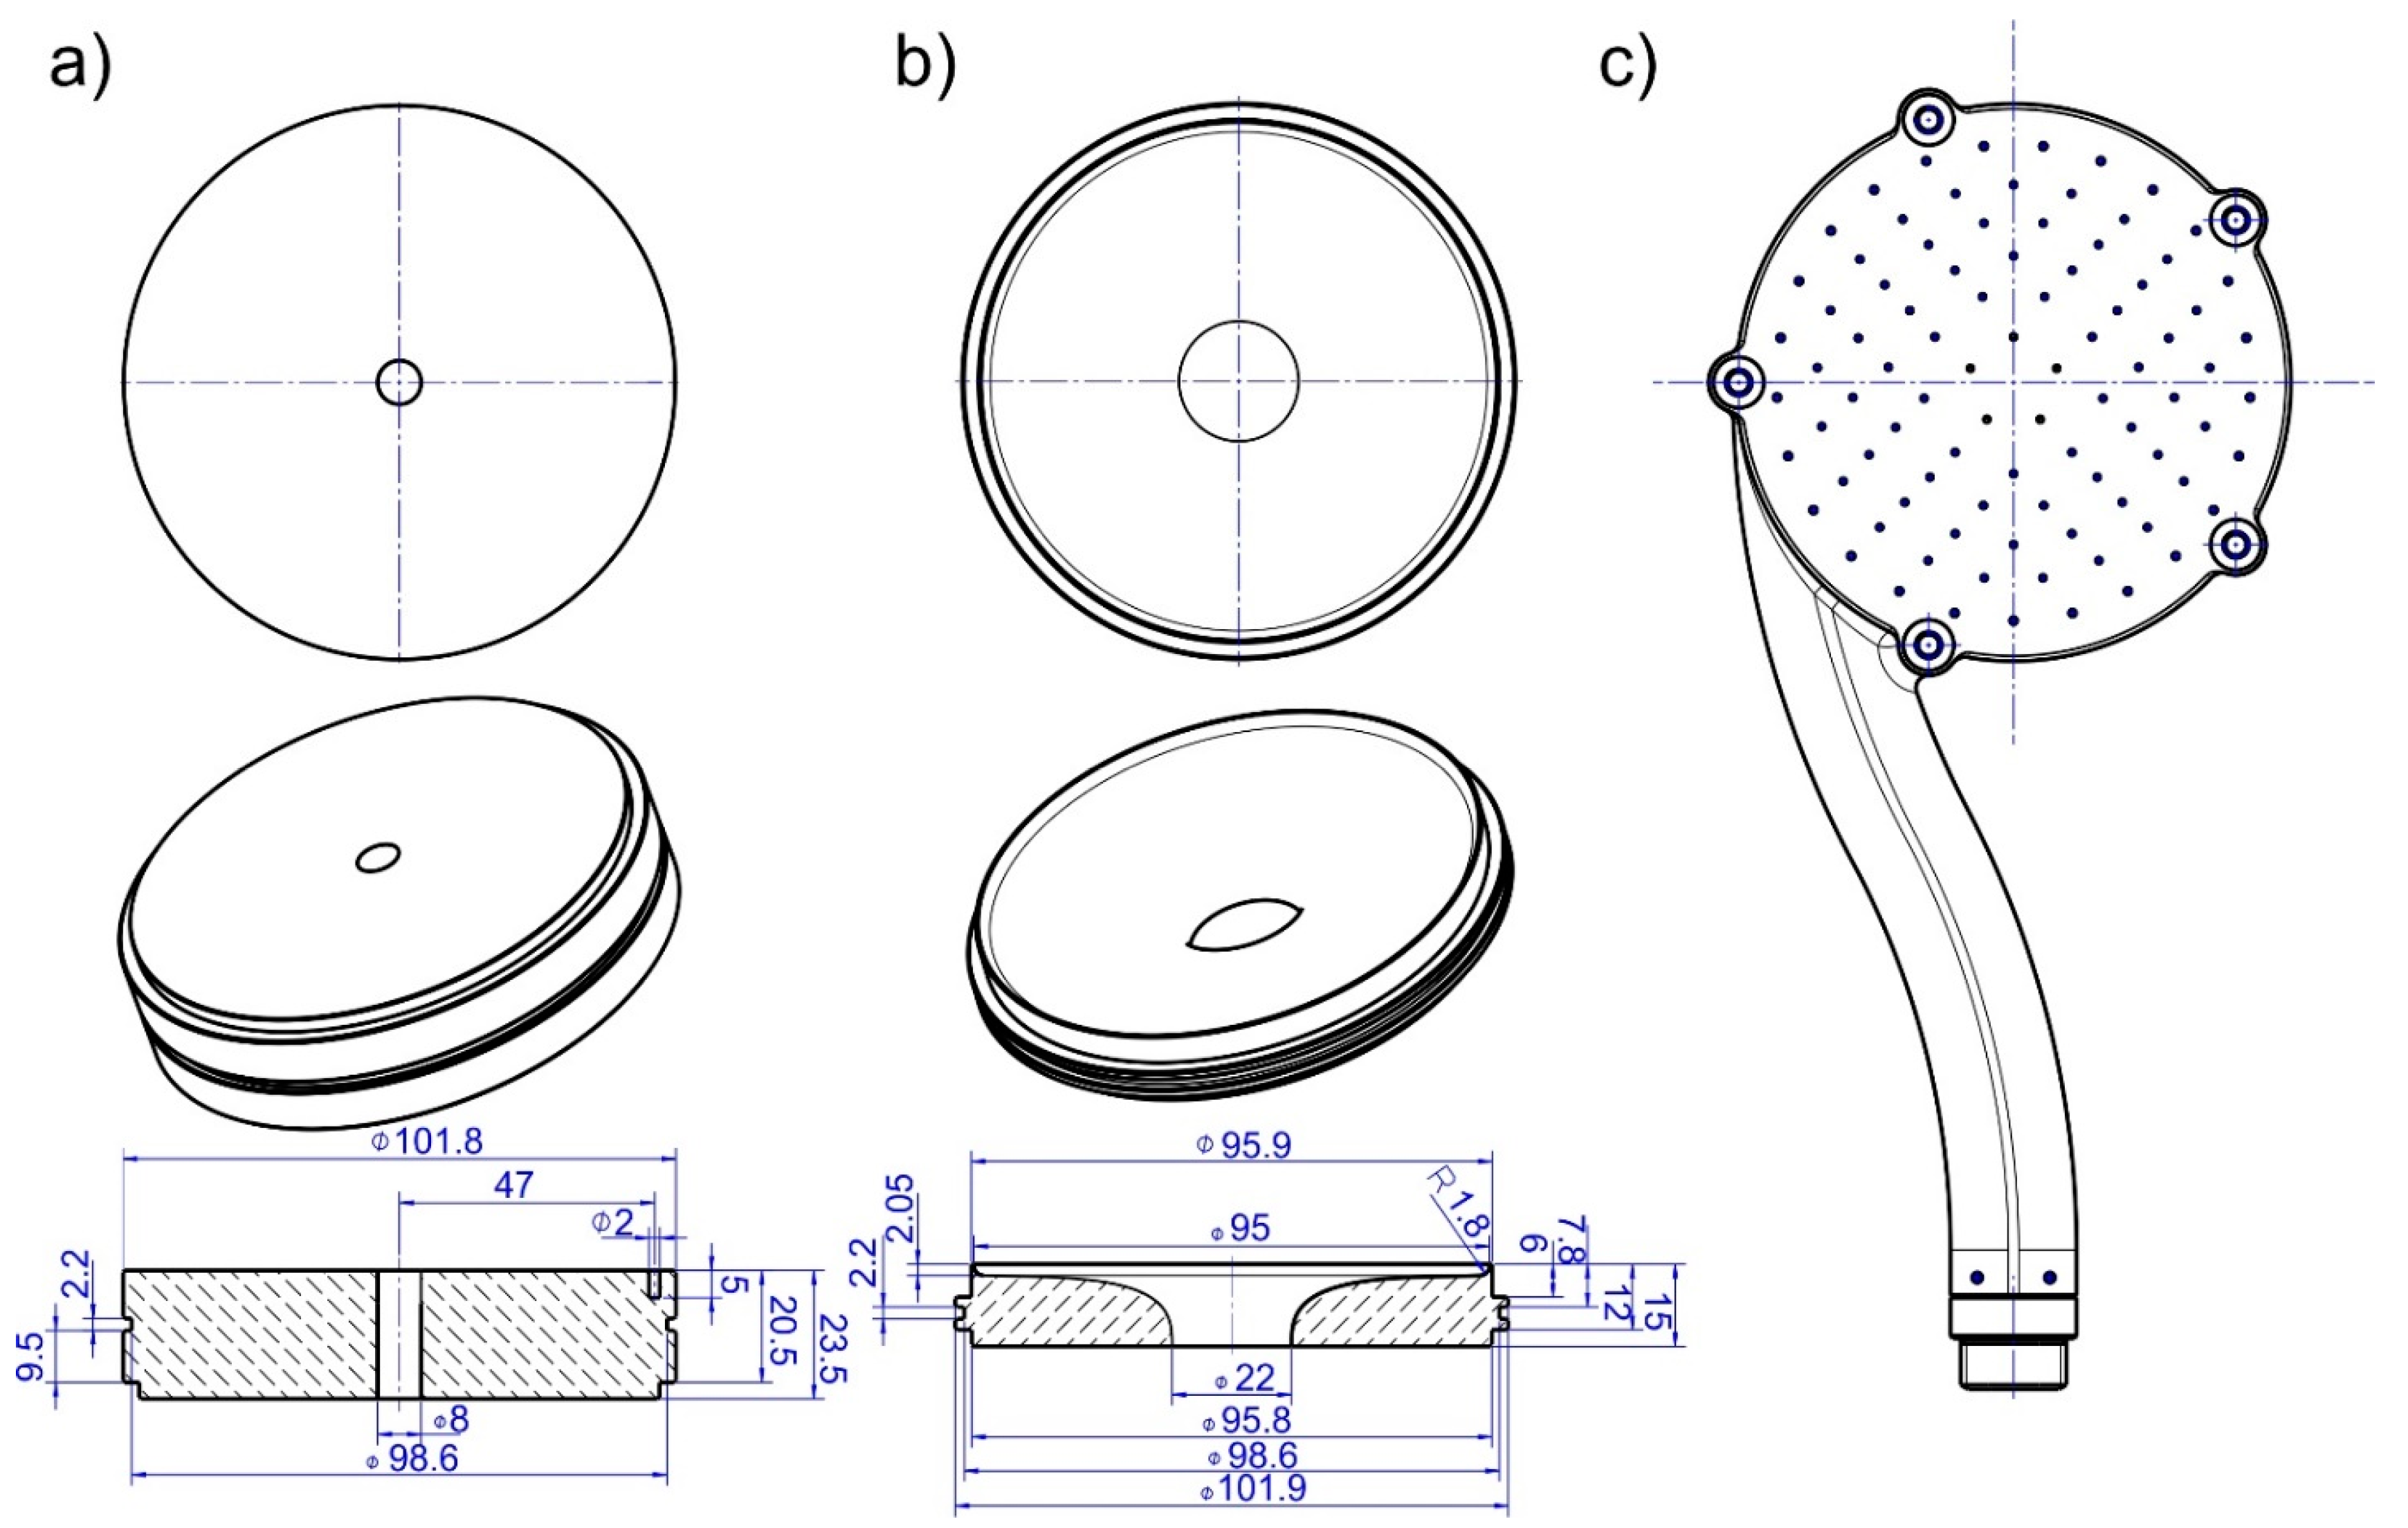
The following sections describe the showerheads, the imaging system, and the setup used for the investigation of possible influences on chemical-physical parameters of the water. The particularities of each method have been discussed.

2.1. Showerheads

In this work, two showerheads were tested with identical external dimensions but different internal structures. Both were coupled with a tangential inlet with an inner radius of 8 mm. One showerhead (henceforth called ‘regular’) consisted of a short vertical cylindrical element of diameter 8 mm in the middle of the headspace, after which the flow was distributed over all nozzles in a narrow spacing (Figure 1a). The other showerhead (henceforth called ‘vortex’) had an internal hyperbolic-like funnel that compressed water through a narrow circular region of diameter 22 mm, generating large azimuthal velocities in the spray plate region. Both showerhead spray plates consisted of 90 nozzles positioned in concentric circles with 5, 9, 13, 17, 21, and 25 nozzles per circle, which had radial distances of 16, 36, 50, 64, 78, and 94 mm, respectively. All the nozzles’ diameters were 1.2 mm. Schematics of both regular and vortex showerheads are shown in Figure 1a–c.

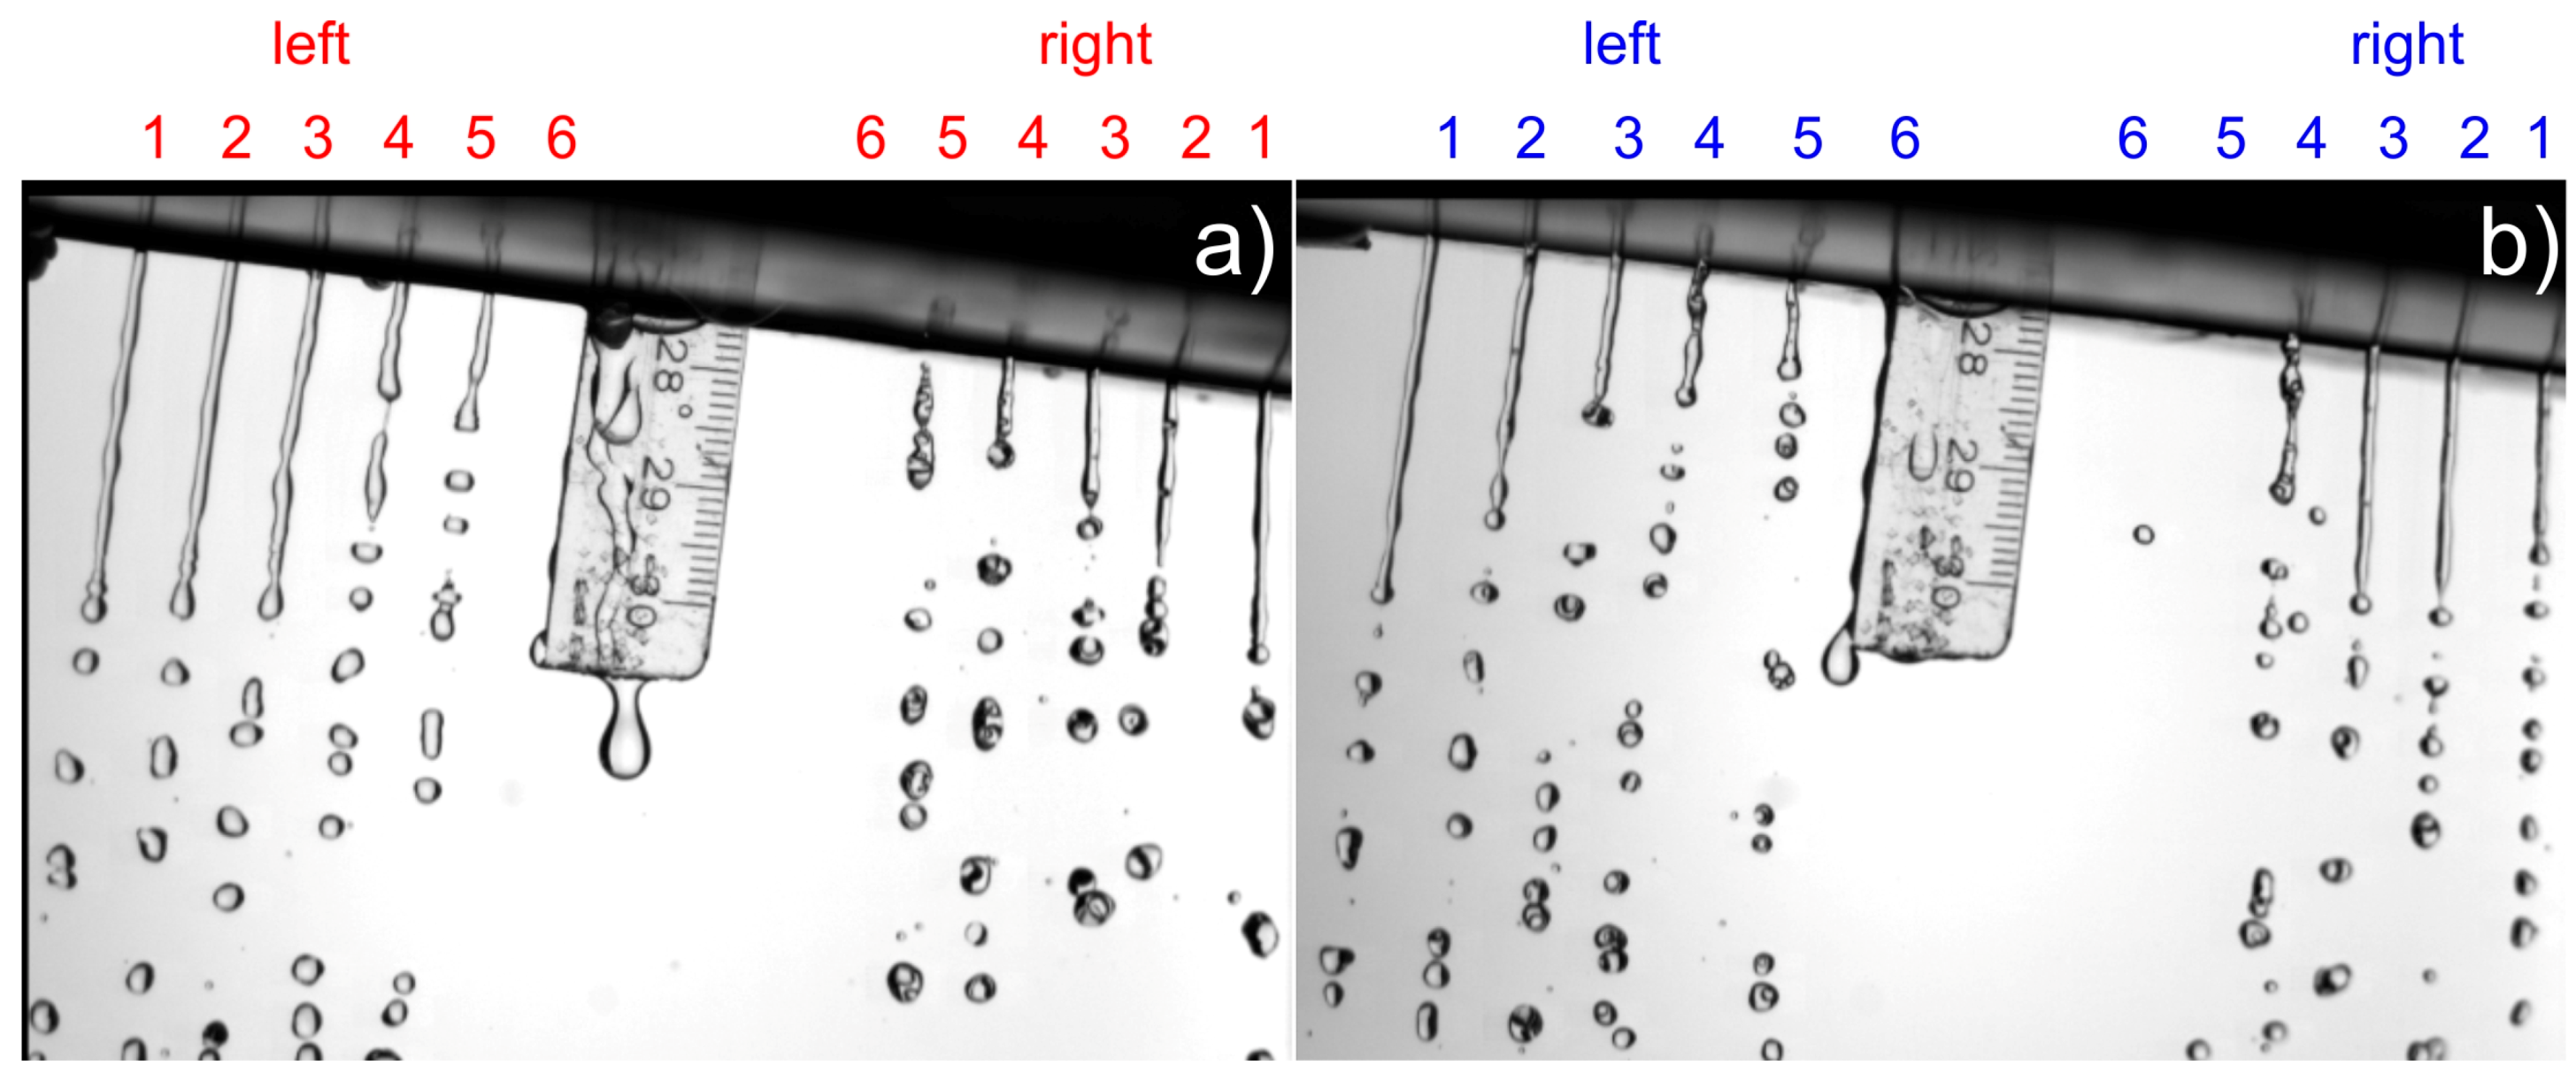
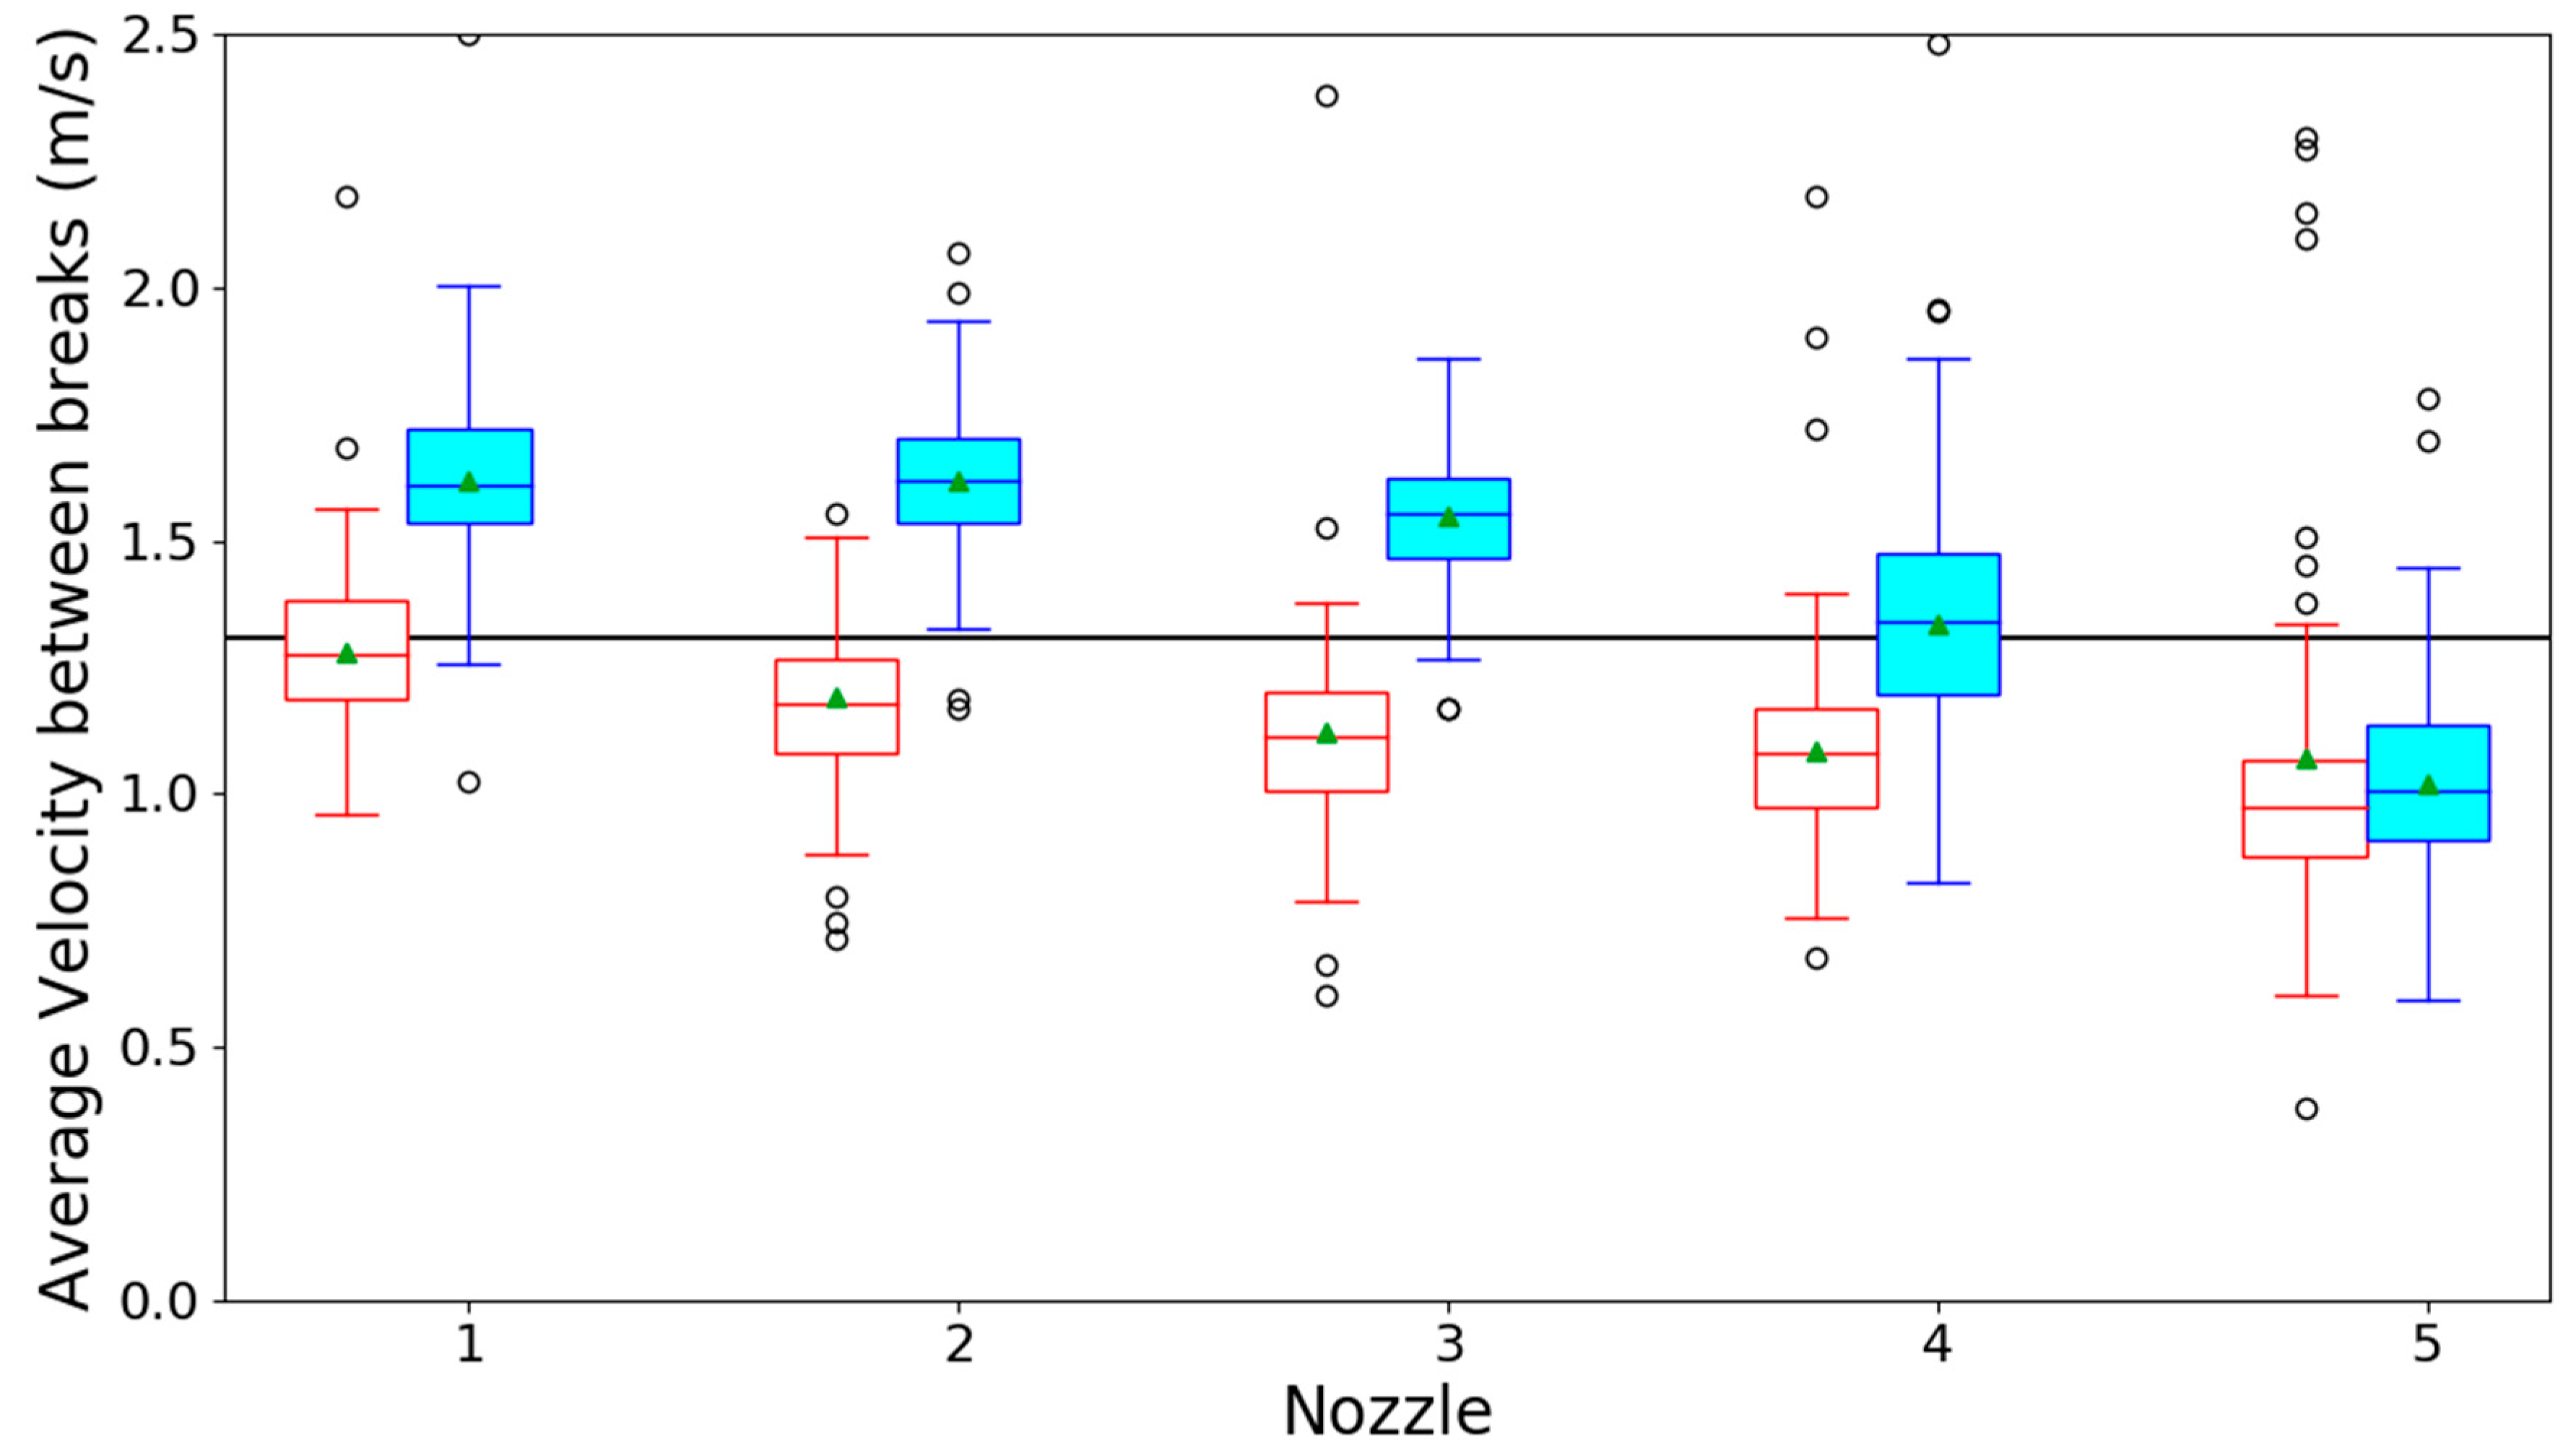
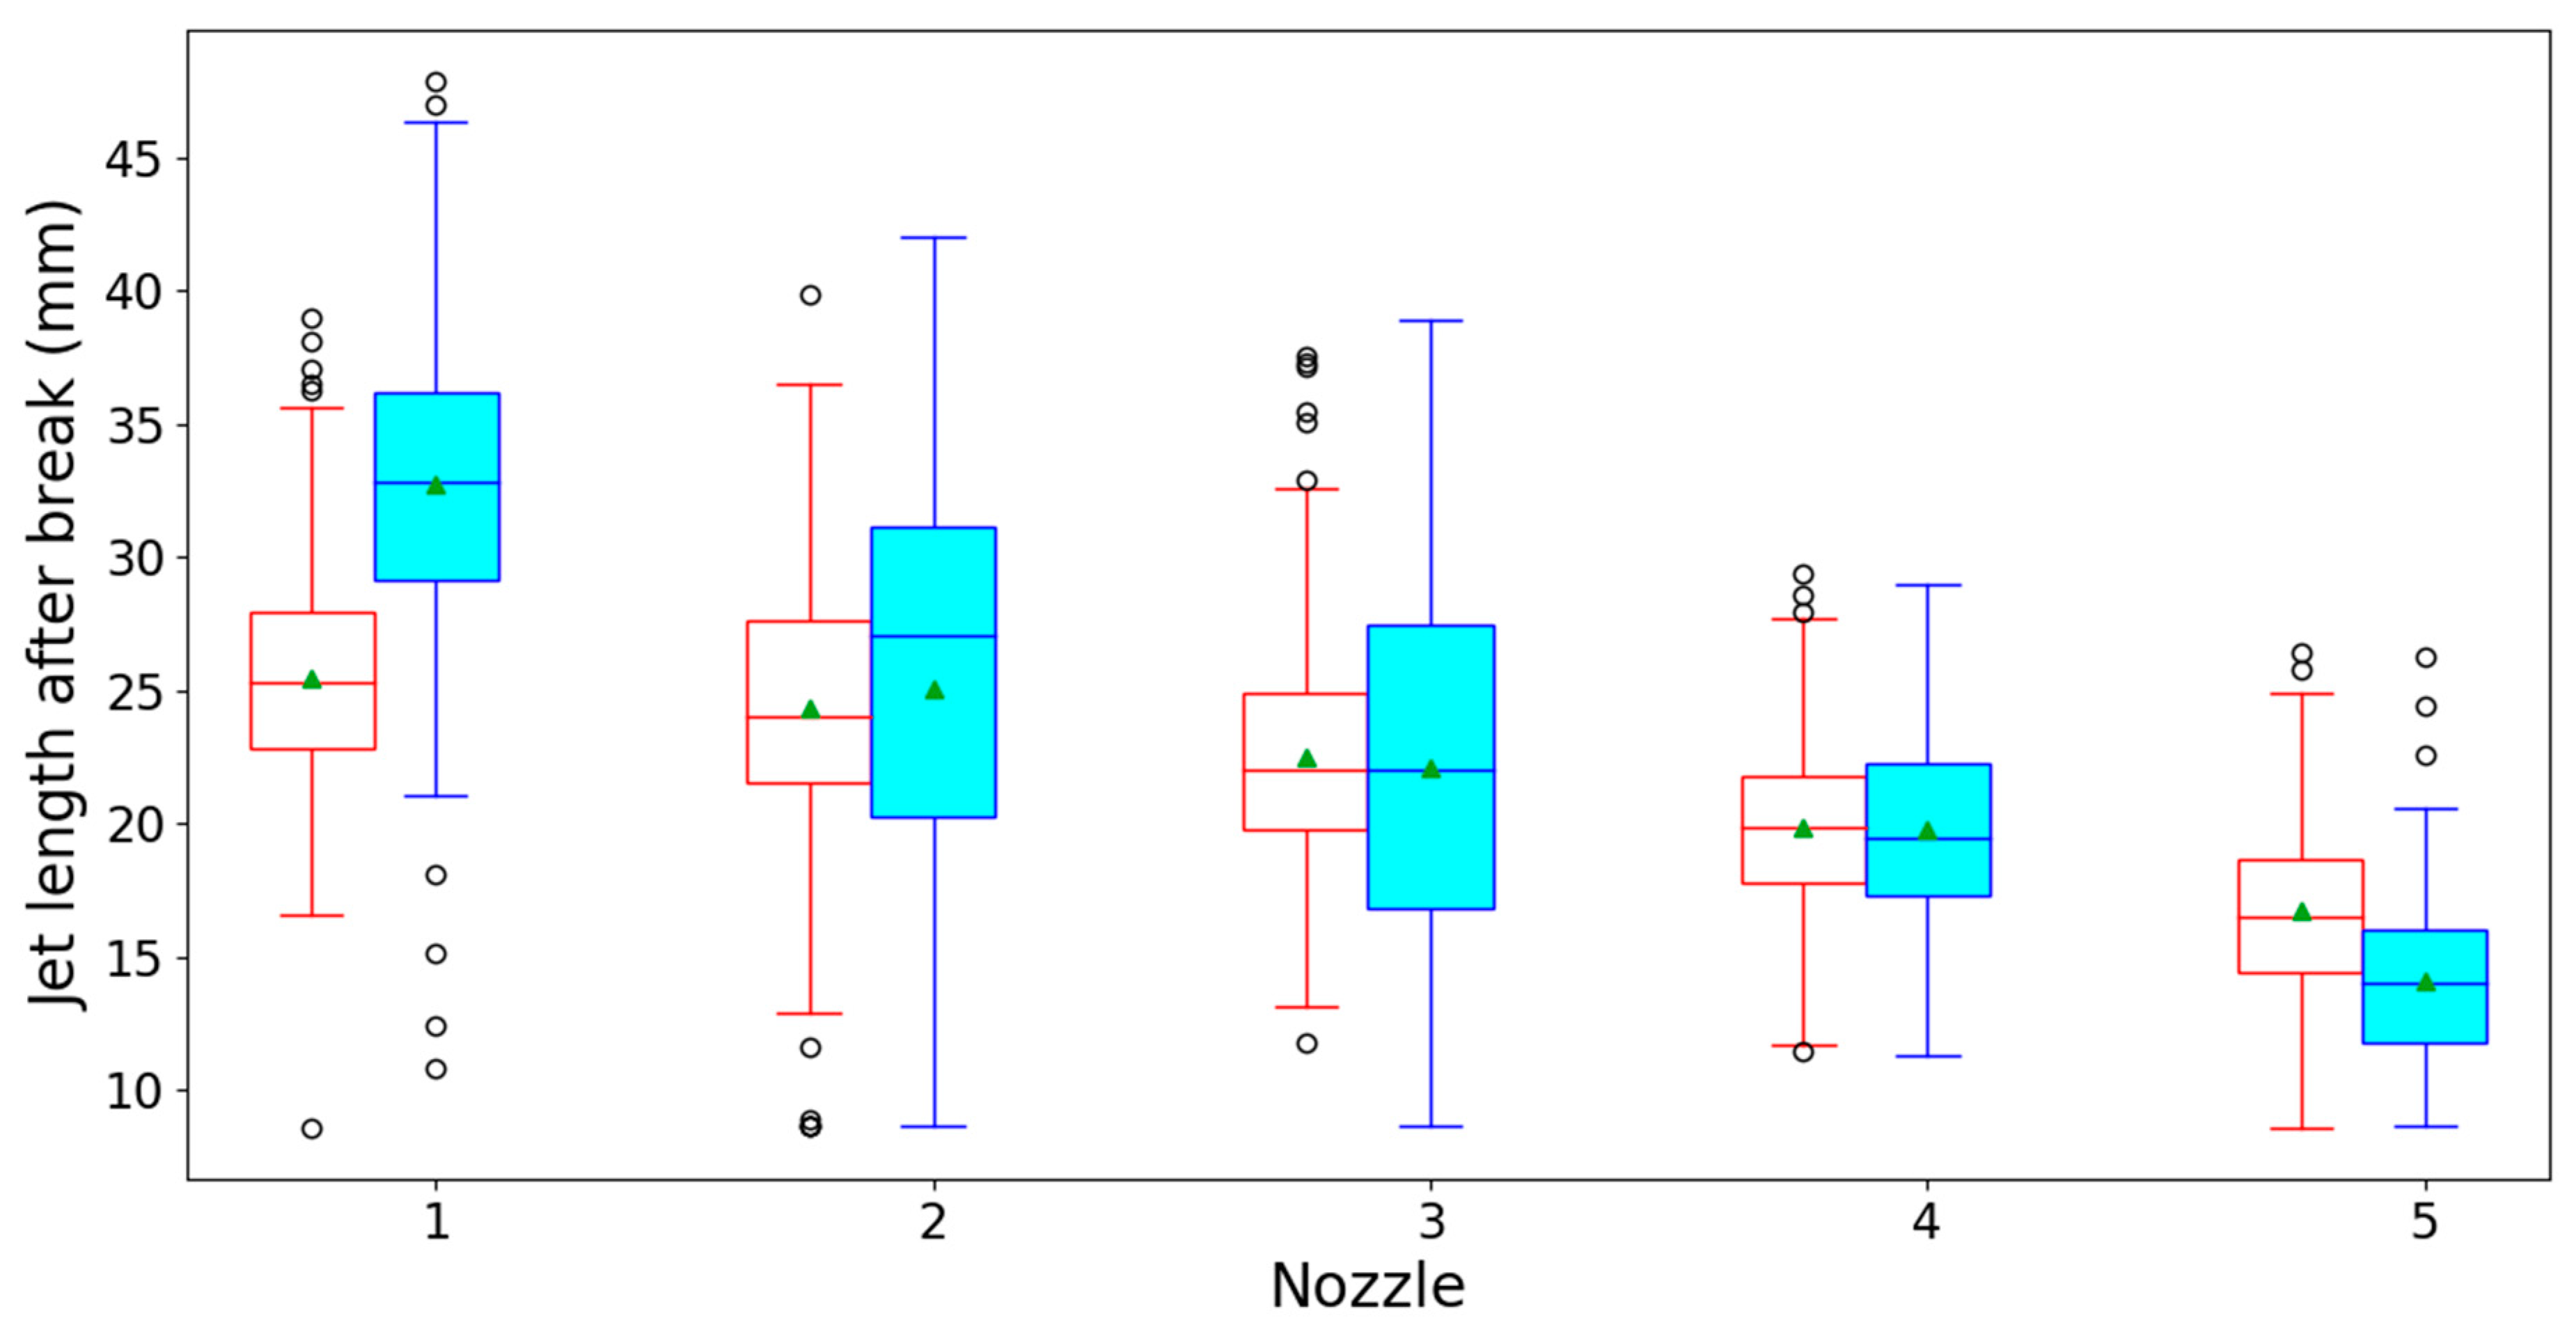
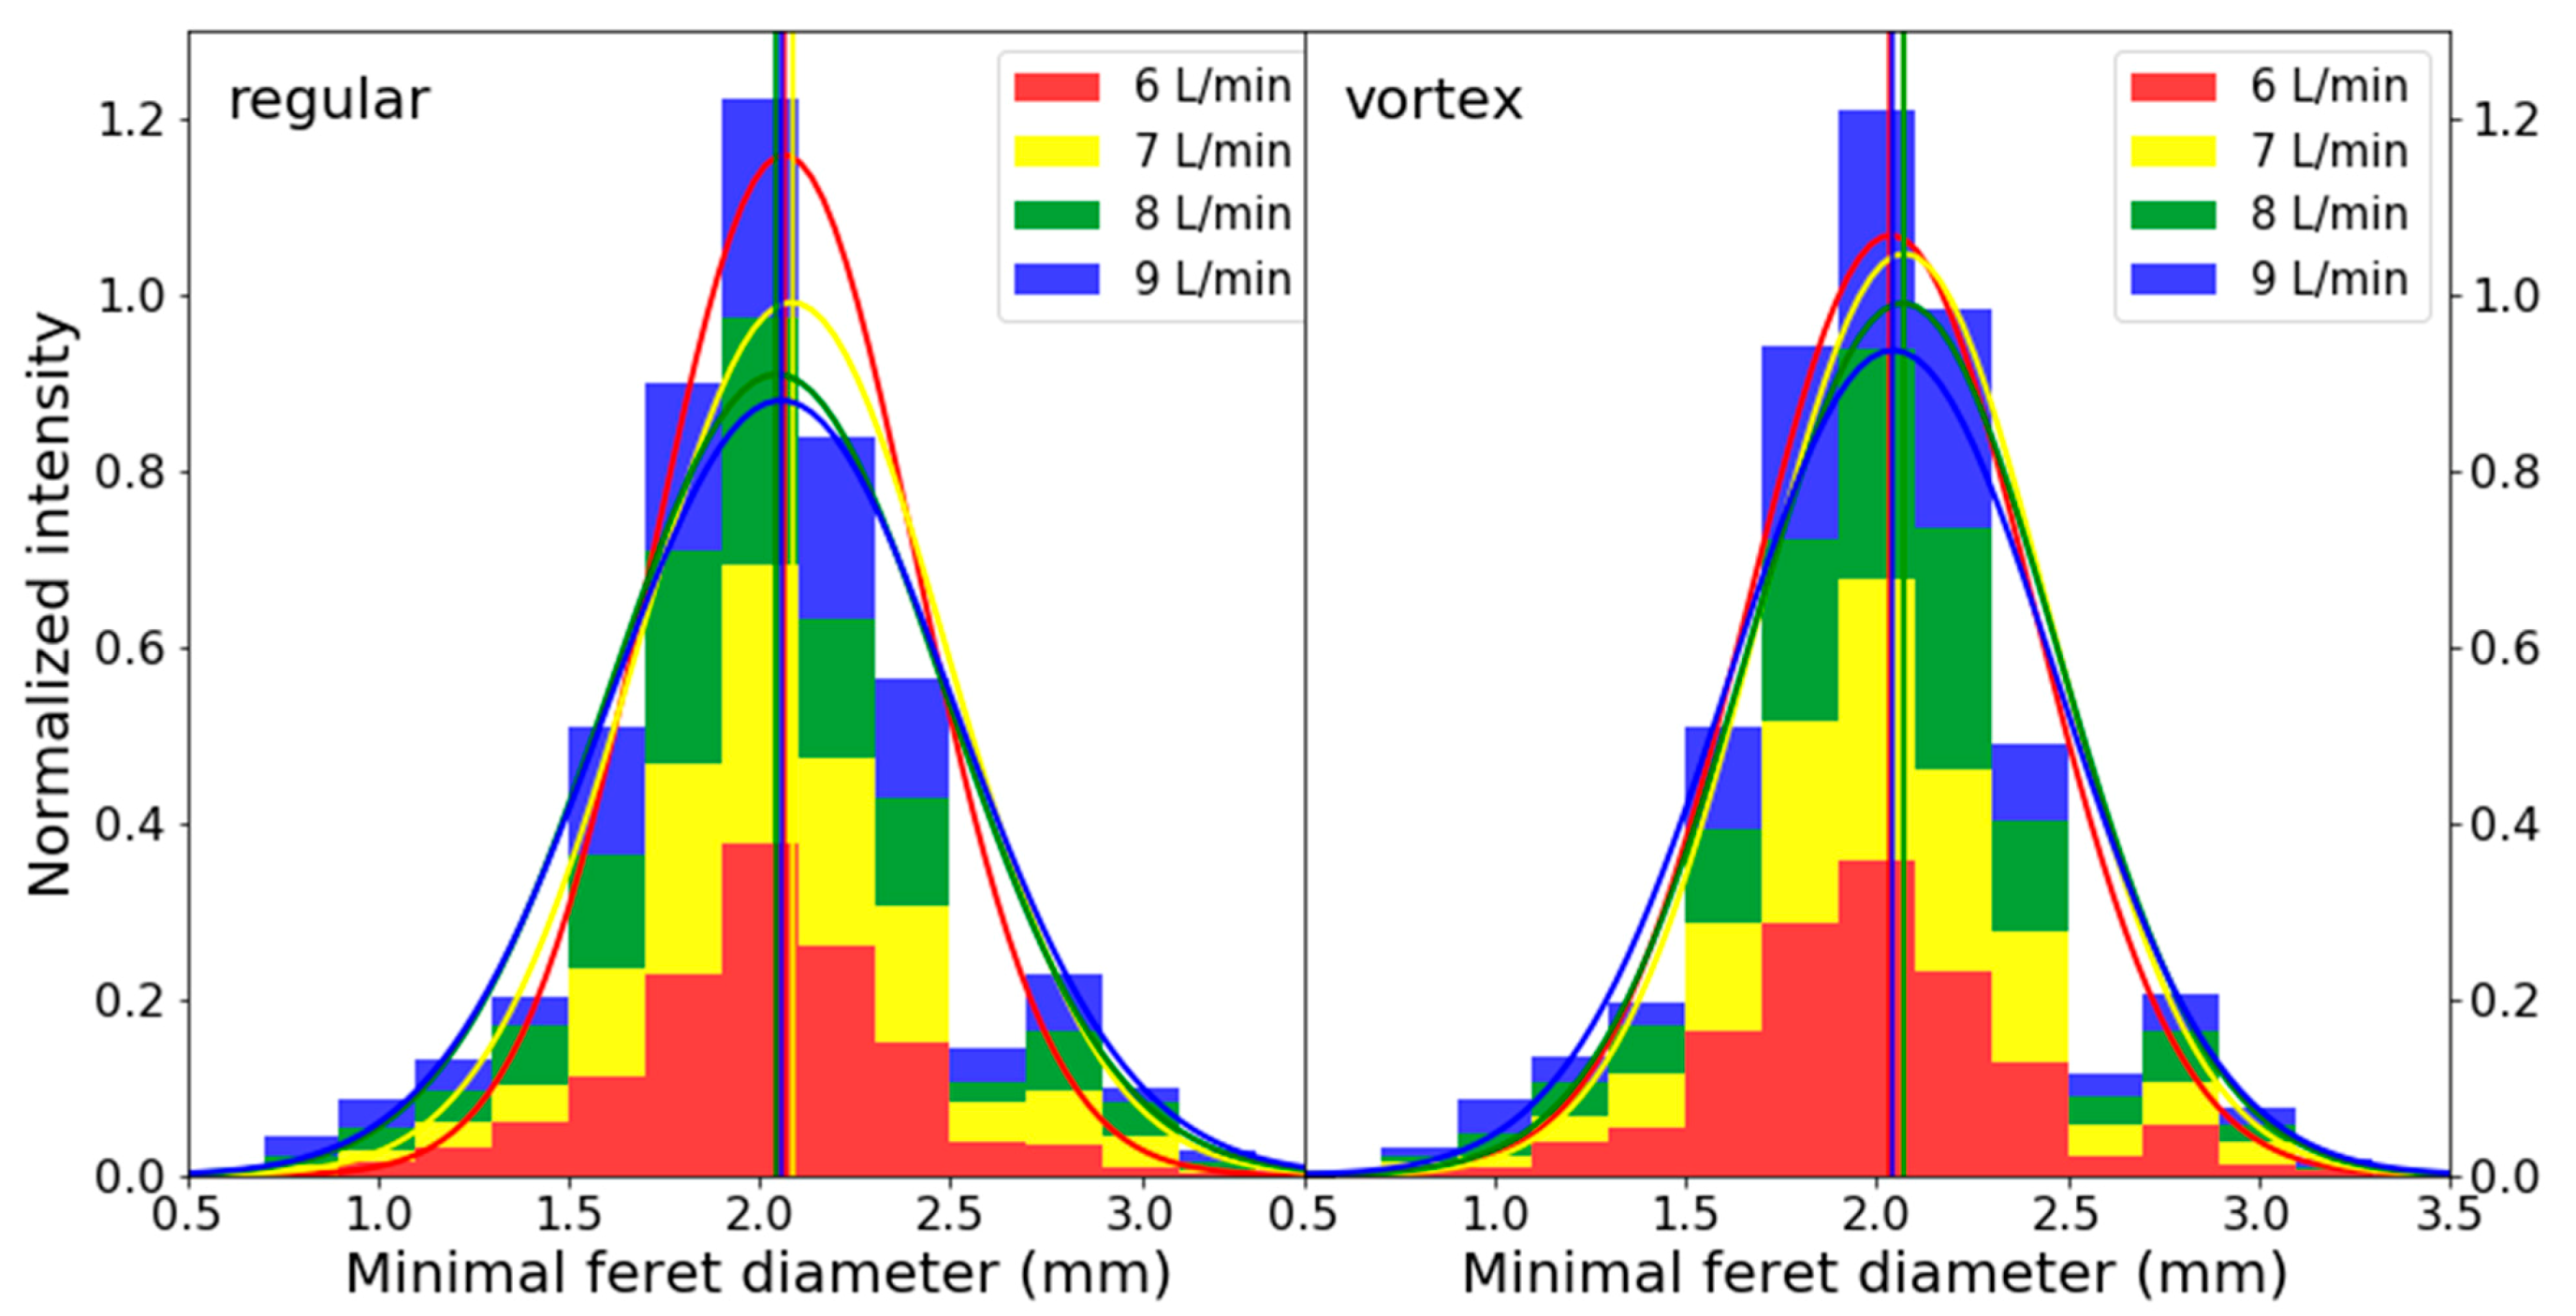
2.2. Jet Break-Up Length, Jet Velocity, and Droplet Characteristics

In all experiments, tap water was used. Using high-speed imaging, the jet break-up and droplet characteristics could be visualized, and videos were recorded, which allowed droplet diameters, break-up length, etc. to be measured. The system consisted of a Photron SA-1.1 high-speed camera coupled with a macroscopic lens (35–70 mm F/3.3–4.5 Zoom-Nikkor) at a frame rate of 3000 fps and a shutter time of 1/6000 s for the movies video S1 and video S2, and at a frame rate of 2000 fps with a shutter time of 1/5000 s for the movies video S3 and video S4; all played back with 30 fps. To allow imaging of a specific row of jets and exclude the interference of out of focus jets and droplets, a tray with a slit was constructed to catch the flow in front or behind a specific row. The tray was positioned at approximately 6 mm below the nozzles’ outlet, leaving only a single row of jets to pass undisturbed through the slit. The flow produced by the remaining jets was transported outside of the field of view of the camera. The field of view was selected in order to allow full visualization of the jet break-up lengths, i.e., from 6 mm below the nozzle tip (restriction from the tray) to the break-up point, as well as the first movements of the formed droplets. The recorded images were analyzed using ImageJ®. The program can differentiate between jets and droplets from one single image by using their circularity, i.e., the ratio between the smallest and the largest distance between two internal points of the projected object. Jets normally have circularity below 0.4 and droplets above this value, with perfect spheres having a circularity equal to 1. After differentiating the objects, ImageJ can also calculate the jet break-up lengths and droplet diameters by using their maximum Feret diameter [14], i.e., the maximum distance between two parallel lines enclosing the projected body. The jet length was calculated as the distance from the nozzle tip until the jet tip just after a break-up event. The liquid velocity was calculated using the movement of the jet between two consecutive break-up events. No retraction at the jet tip just after filament break-up was observed or considered.

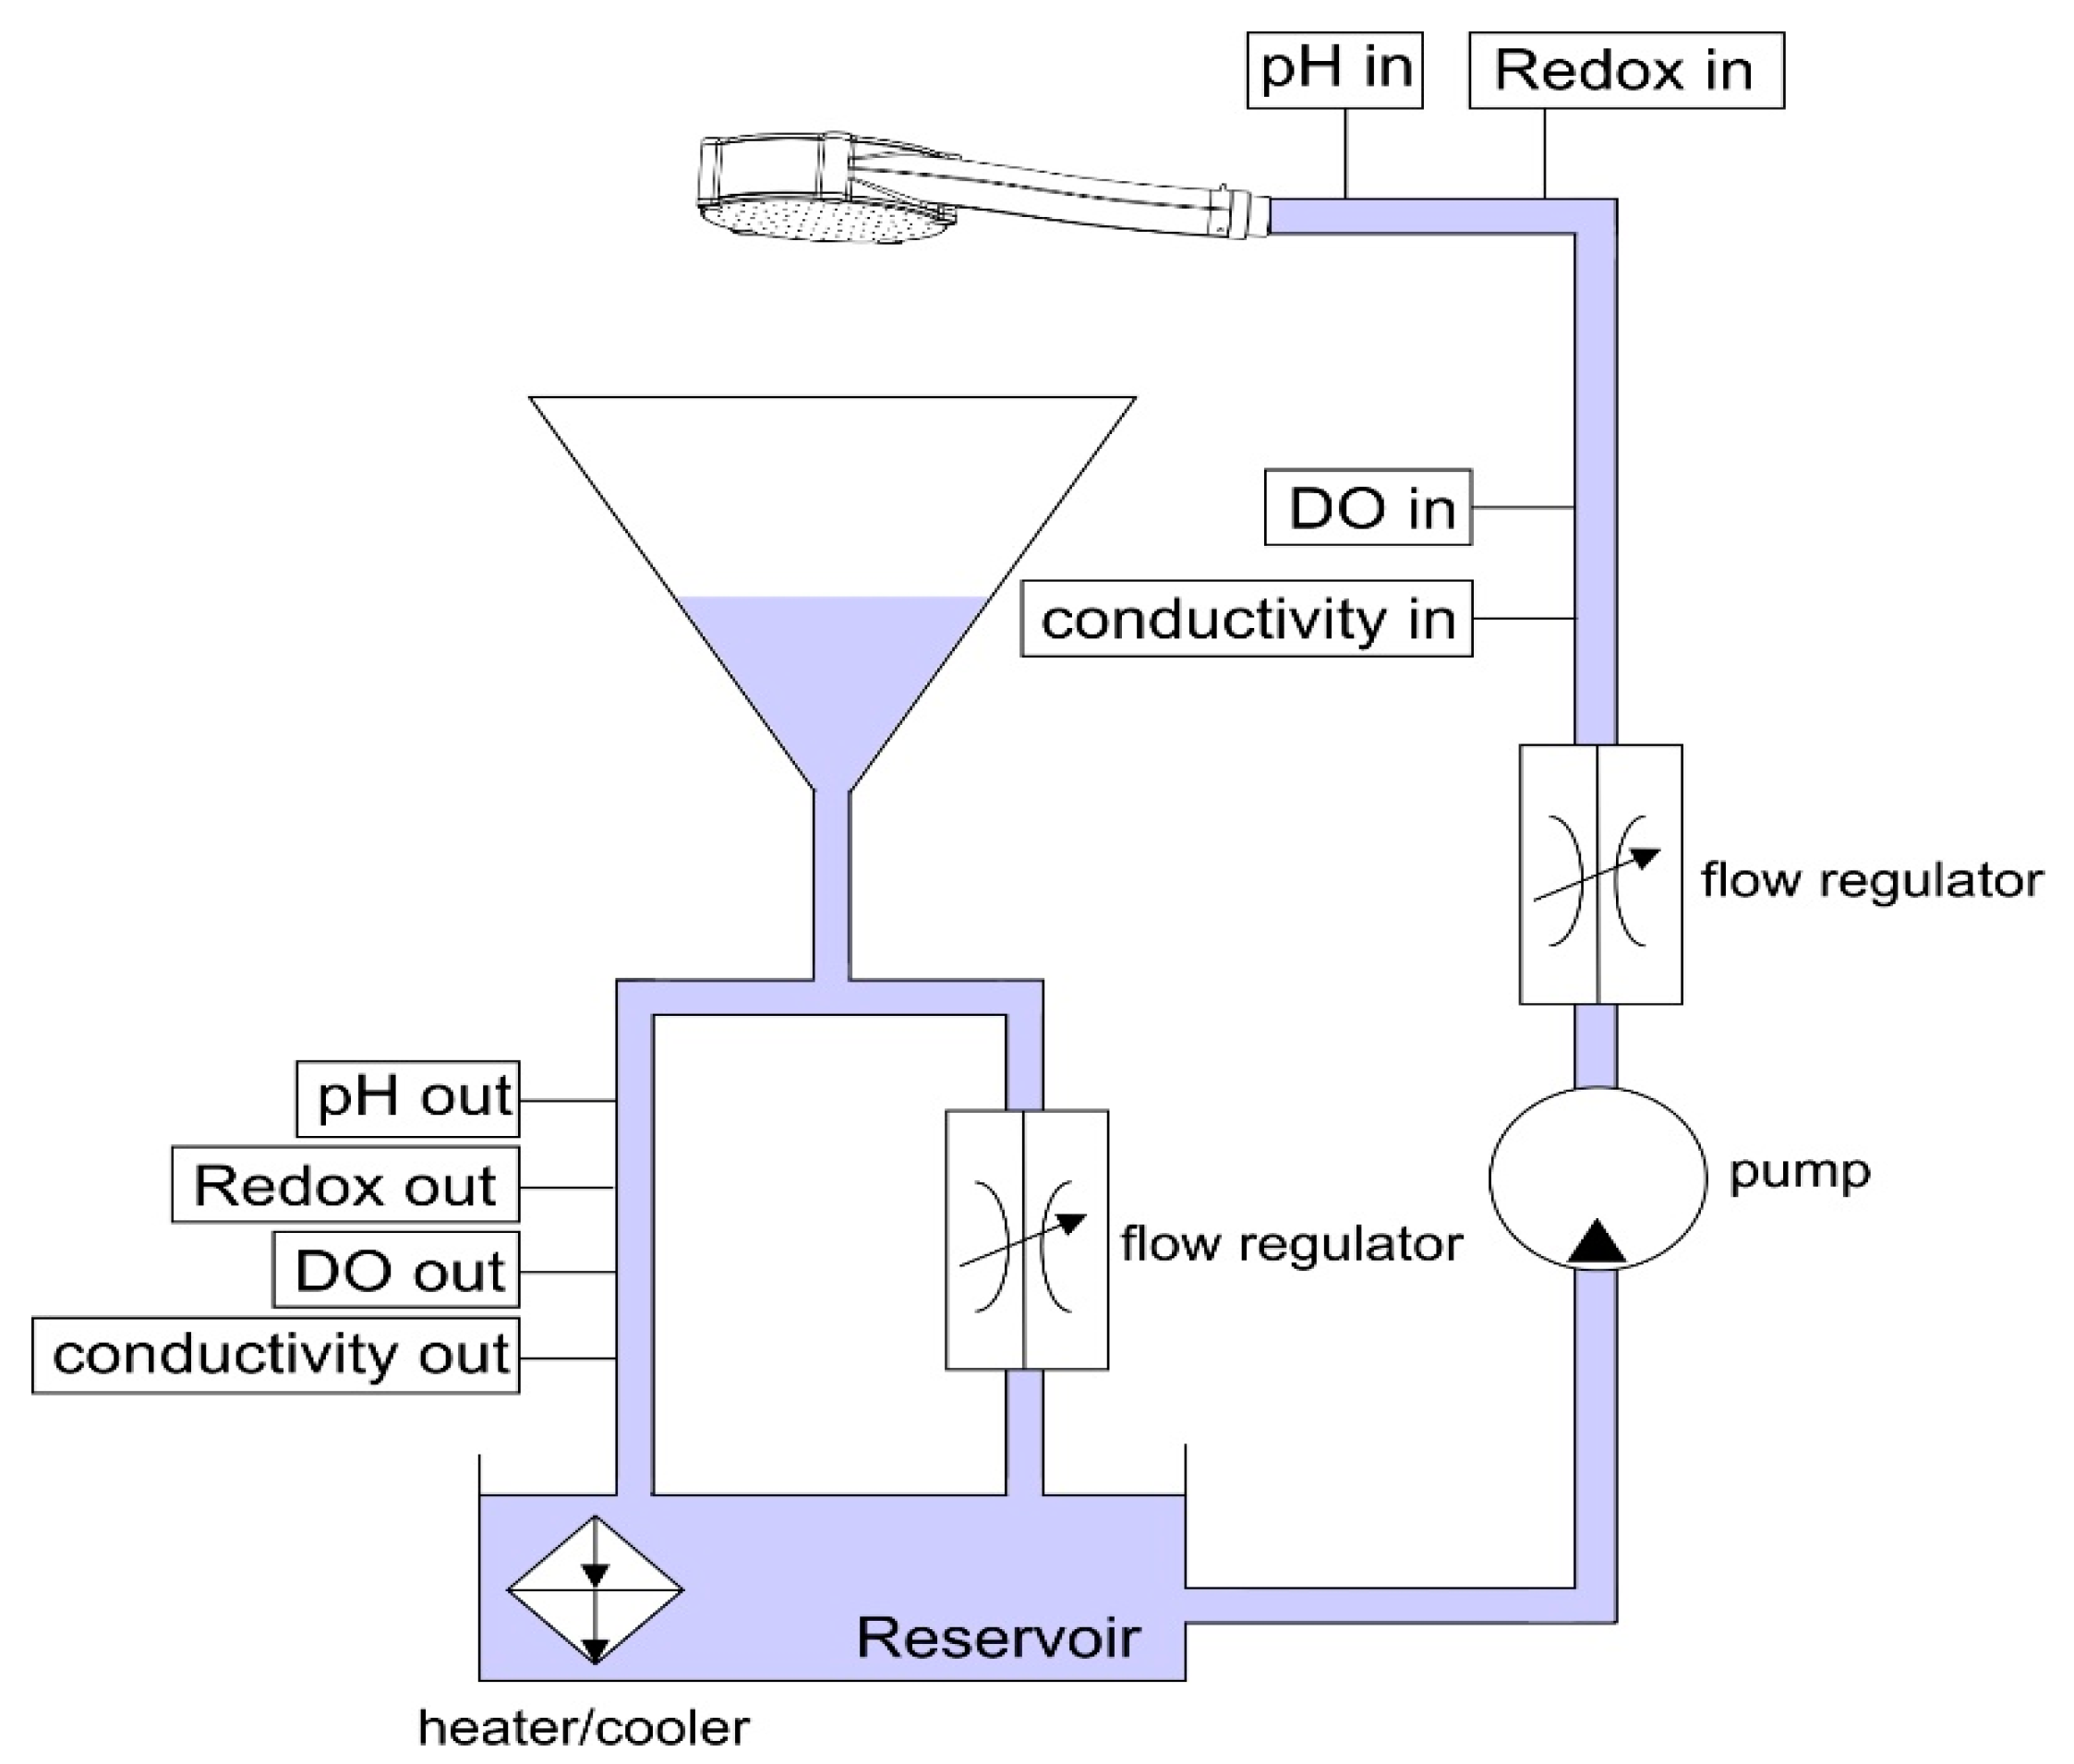
2.3. Physical and Chemical Parameters

In order to verify possible changes in the physical-chemical parameters of the water running through a normal and a vortex showerhead, a recirculating shower setup was constructed (Figure 2). A recirculating system was tested because possible changes to the water properties would be amplified after multiple passes through the system. Also, in the future, showers that use a recirculation system will become more important because they are more sustainable, saving water and energy.
In this system, water was pumped using a submerged pump from a ~20 L open reservoir to the showerhead positioned on top of this same reservoir. A flow and pressure regulator, an electrical conductivity probe (Endress Hauser), a pH probe (Endress Hauser), a redox potential probe (Endress Hauser), and a dissolved oxygen (DO) sensor (Presens) were mounted in the inlet (tubing) line, connecting the submerged pump to the showerhead. After passing through the showerhead, the sprayed water was collected by a plastic funnel, positioned between the showerhead and the reservoir, to which an outlet (tubing) line was connected. In the outlet line, the same set of probes and sensors installed in the inlet were connected. A T-junction split the shower flow between a line passing through a set of sensors, and a second line connected directly to the reservoir. This second outlet line was built for keeping a fixed water column height in the funnel, thus avoiding overflow, as well as ensuring that the outlet sensors were always submerged. The reservoir was temperature regulated through a secondary flow to a heater/cooler. Before each experiment, the tap water was purged with nitrogen to achieve a constant (low) dissolved oxygen concentration at the beginning of all the tests in order to more easily compare the diffusion of oxygen over time.

3. Results and Discussion

The following sections would discuss the properties of the measured sprays and chemical evolution of the recirculating system.

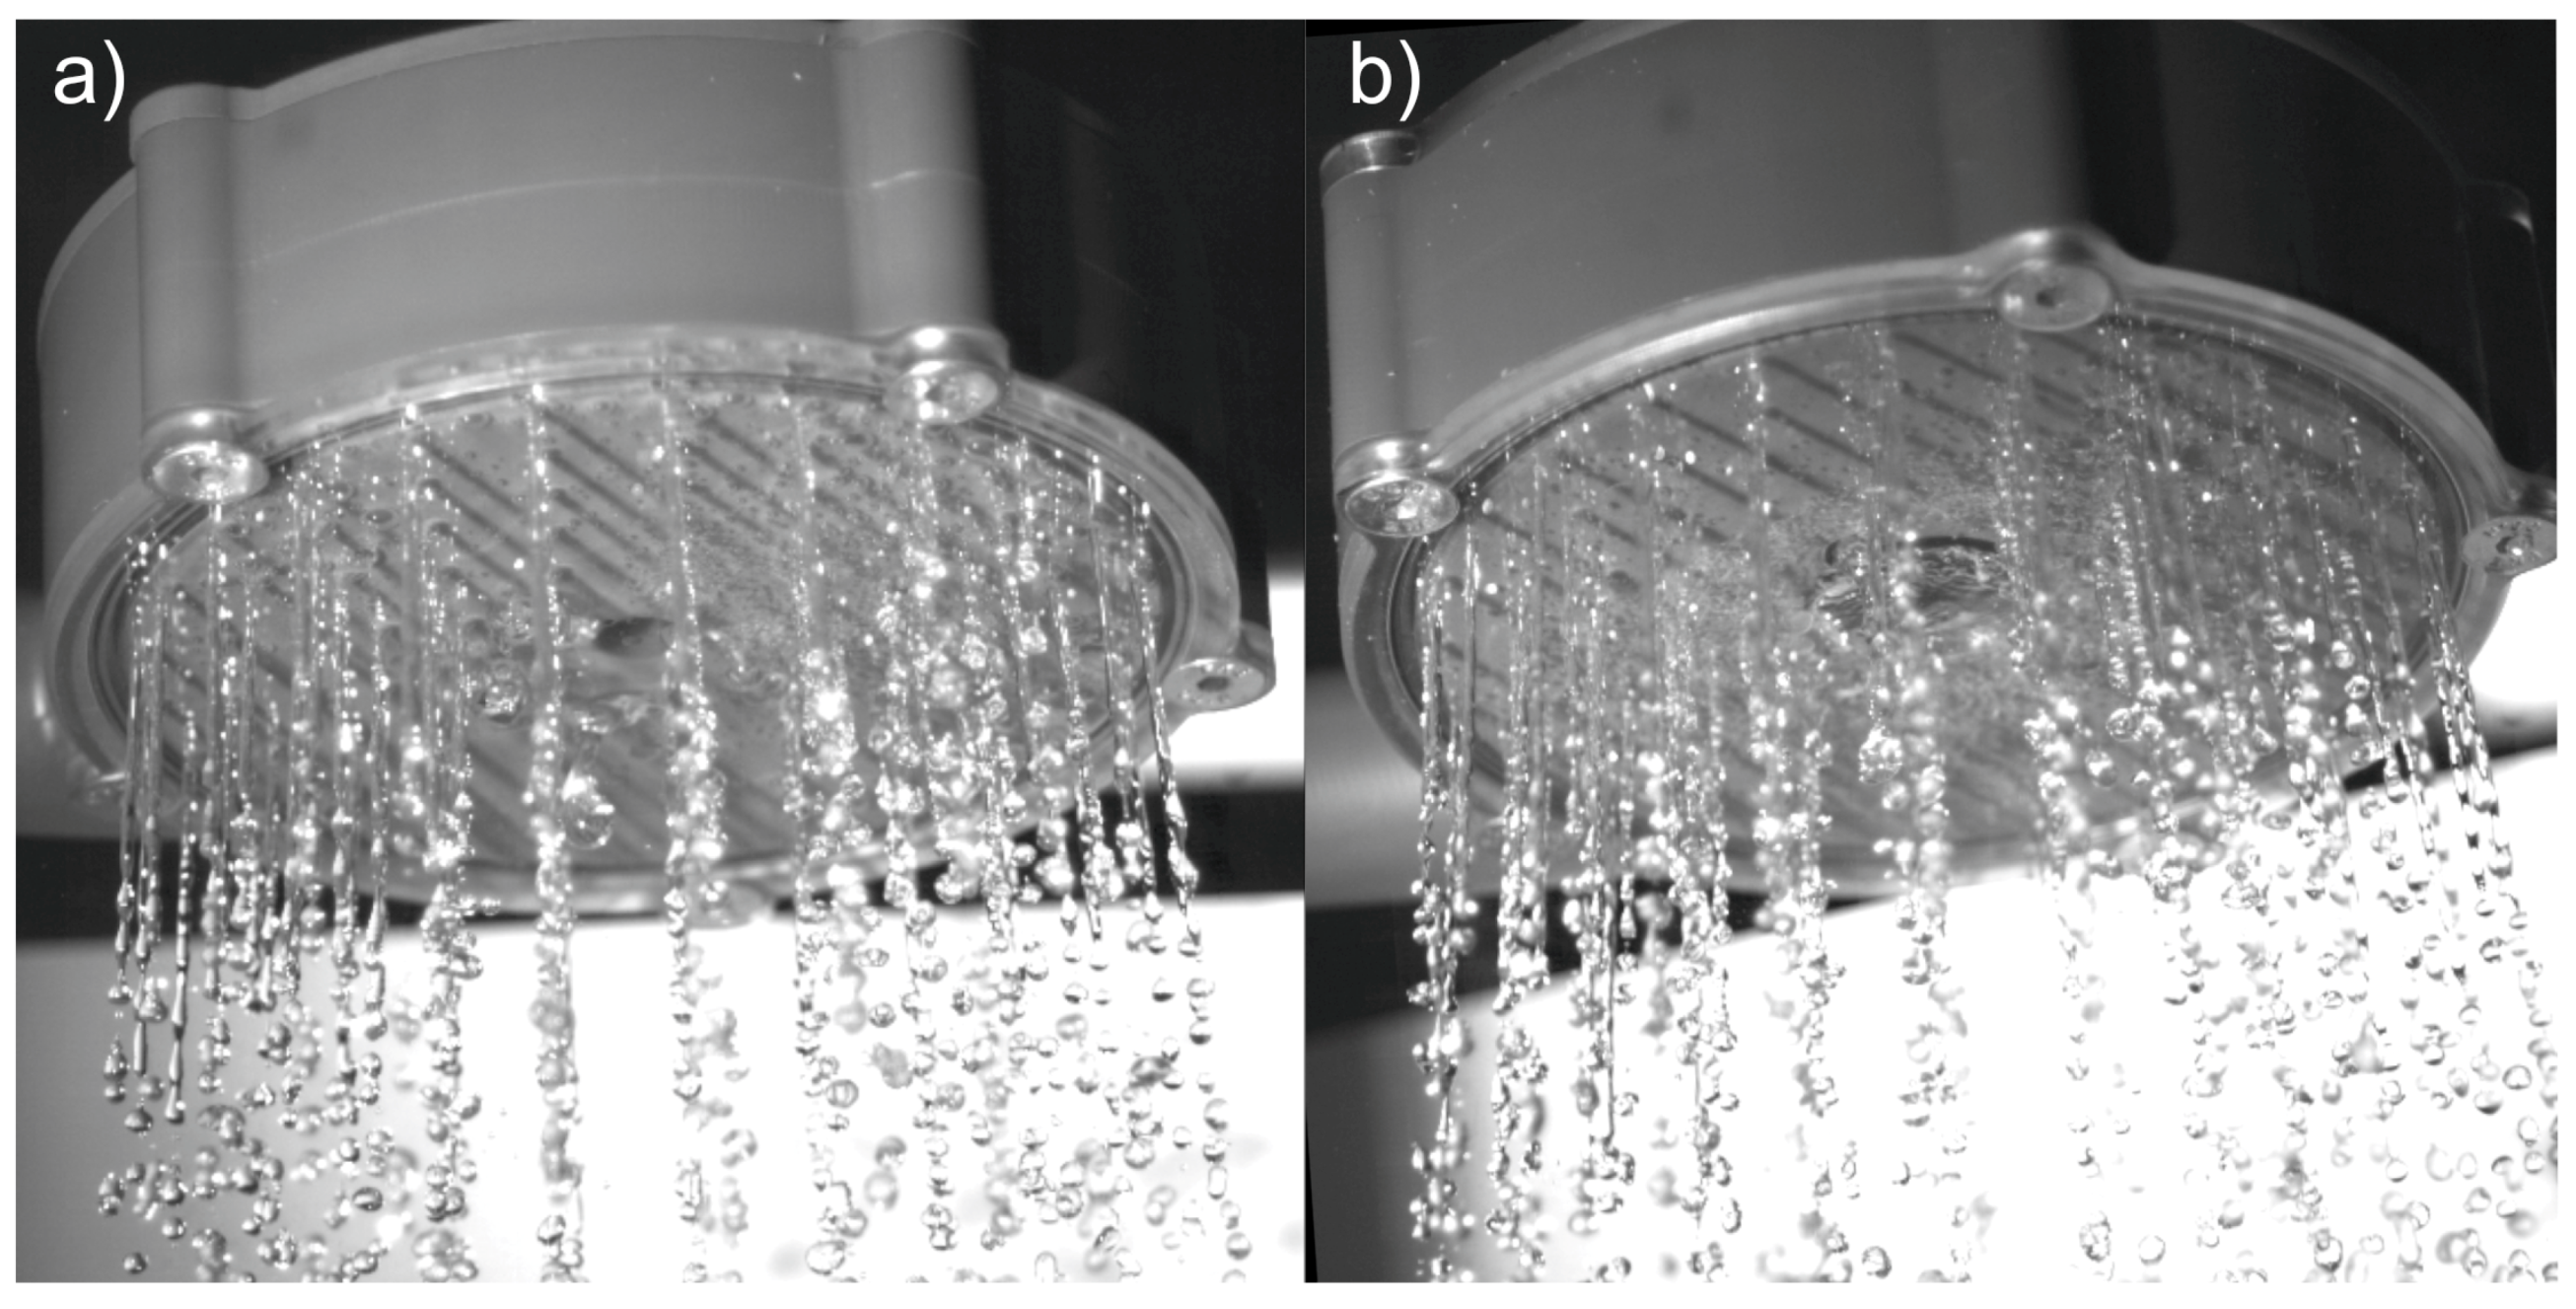
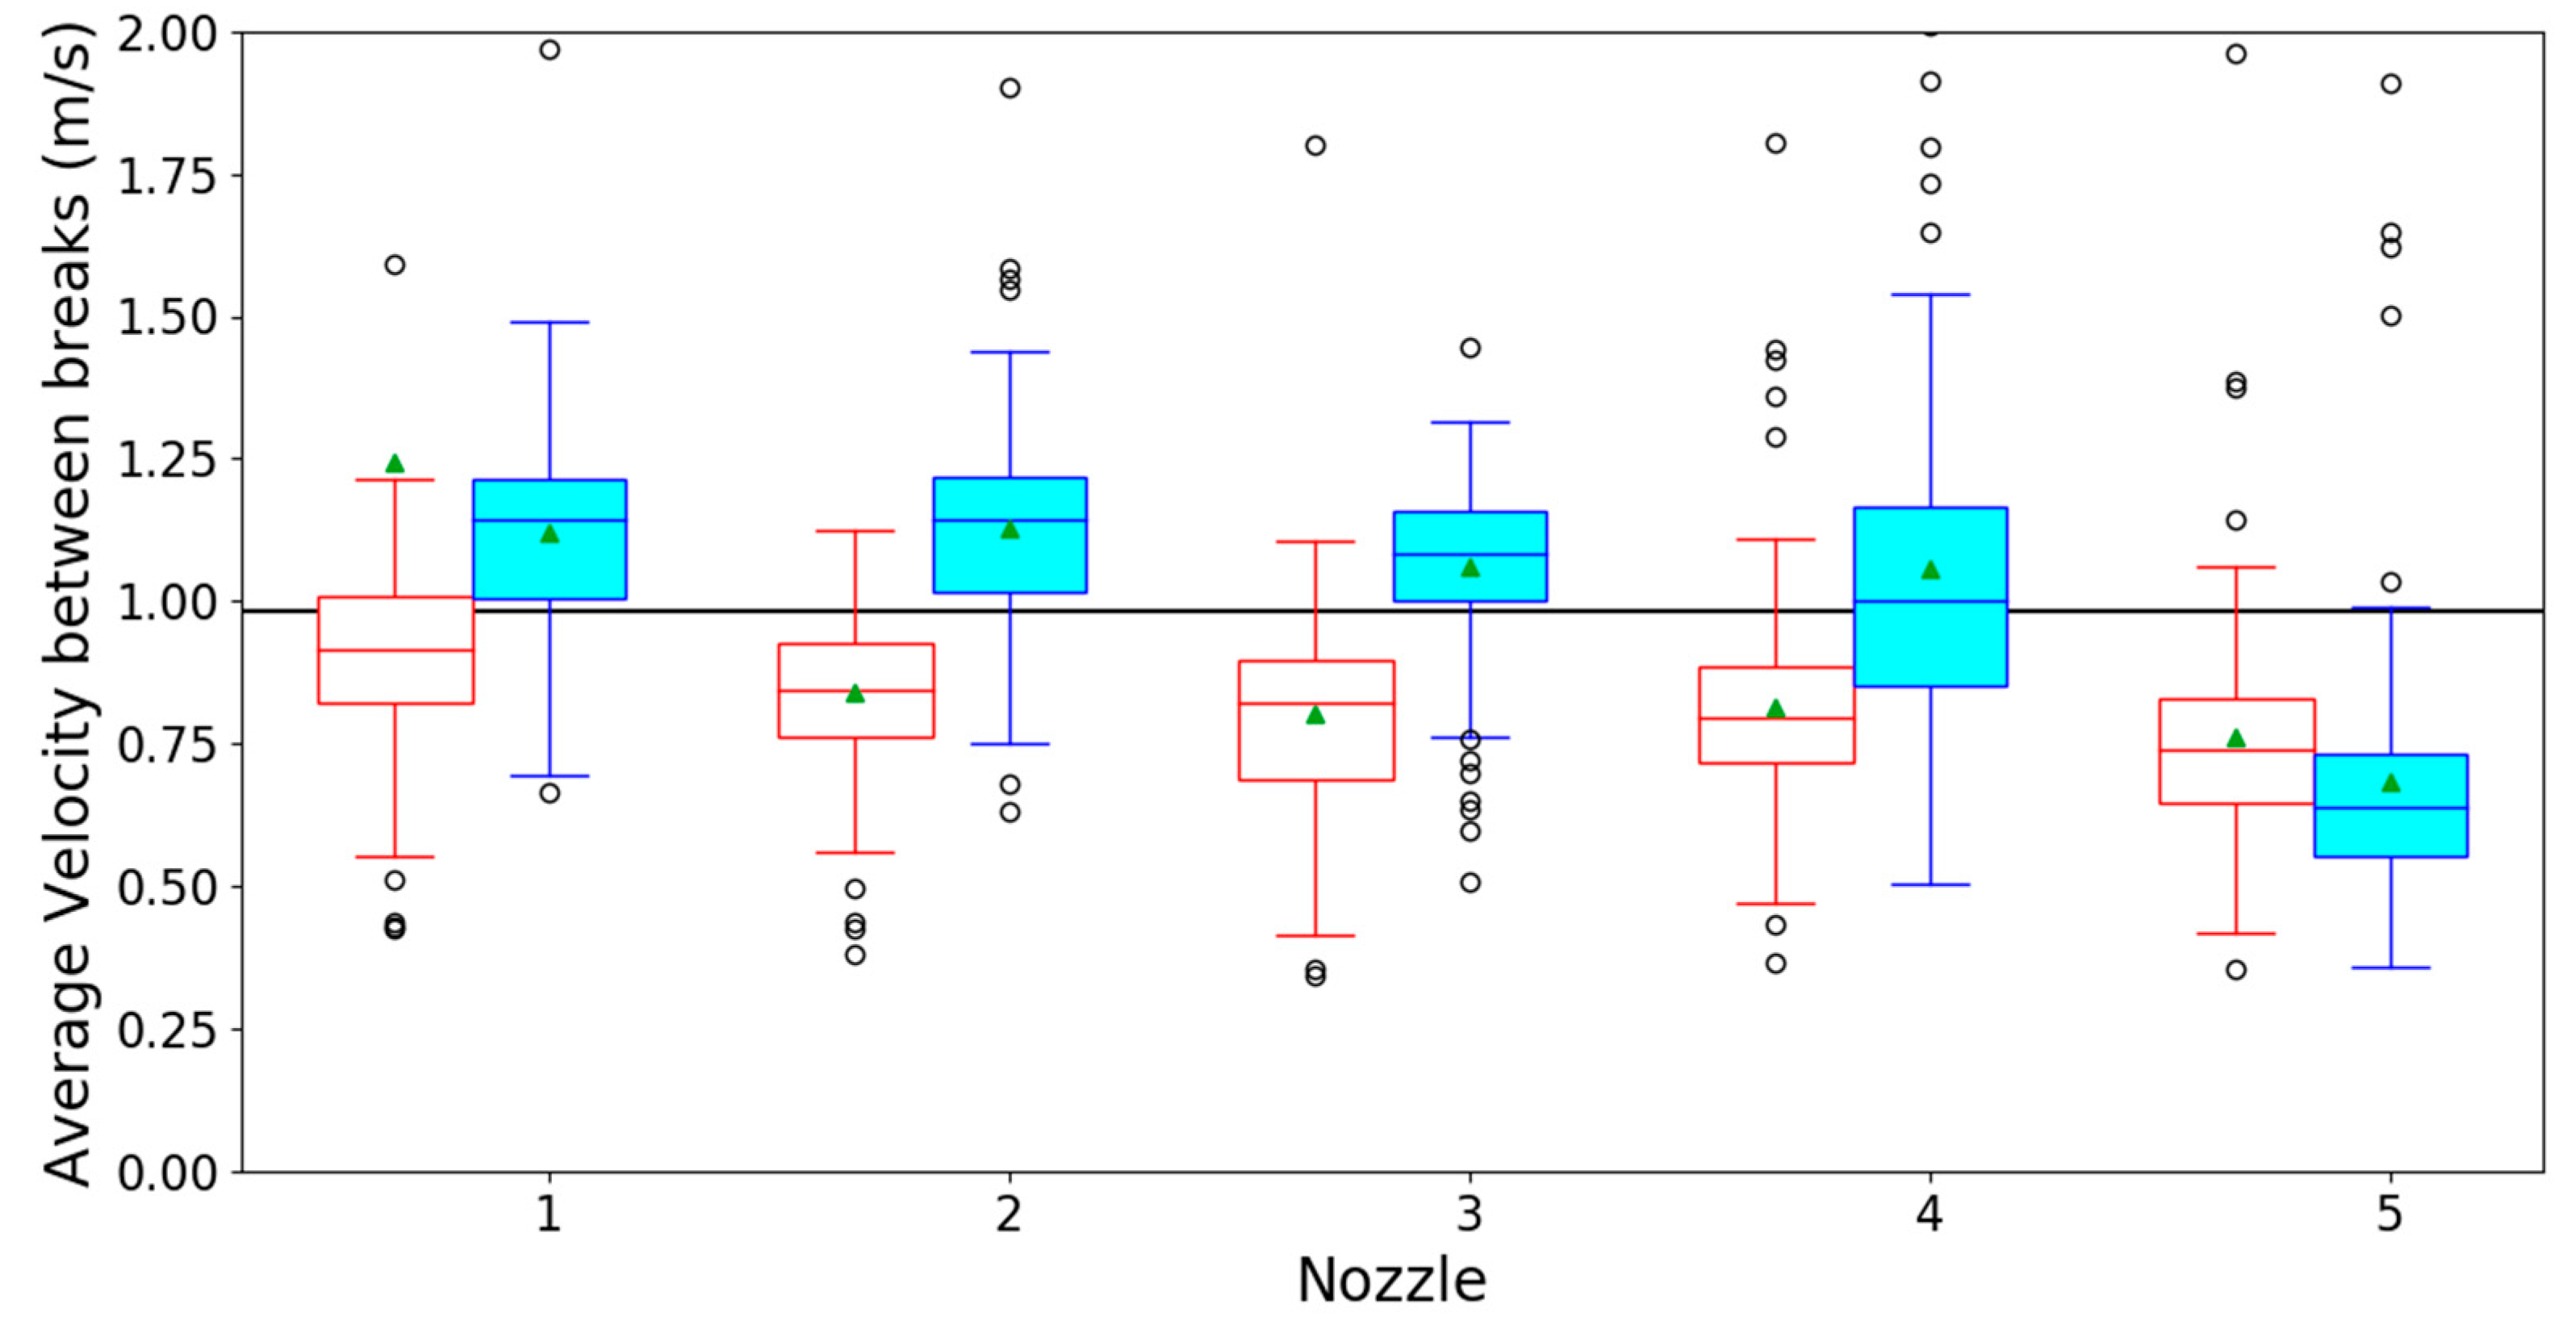
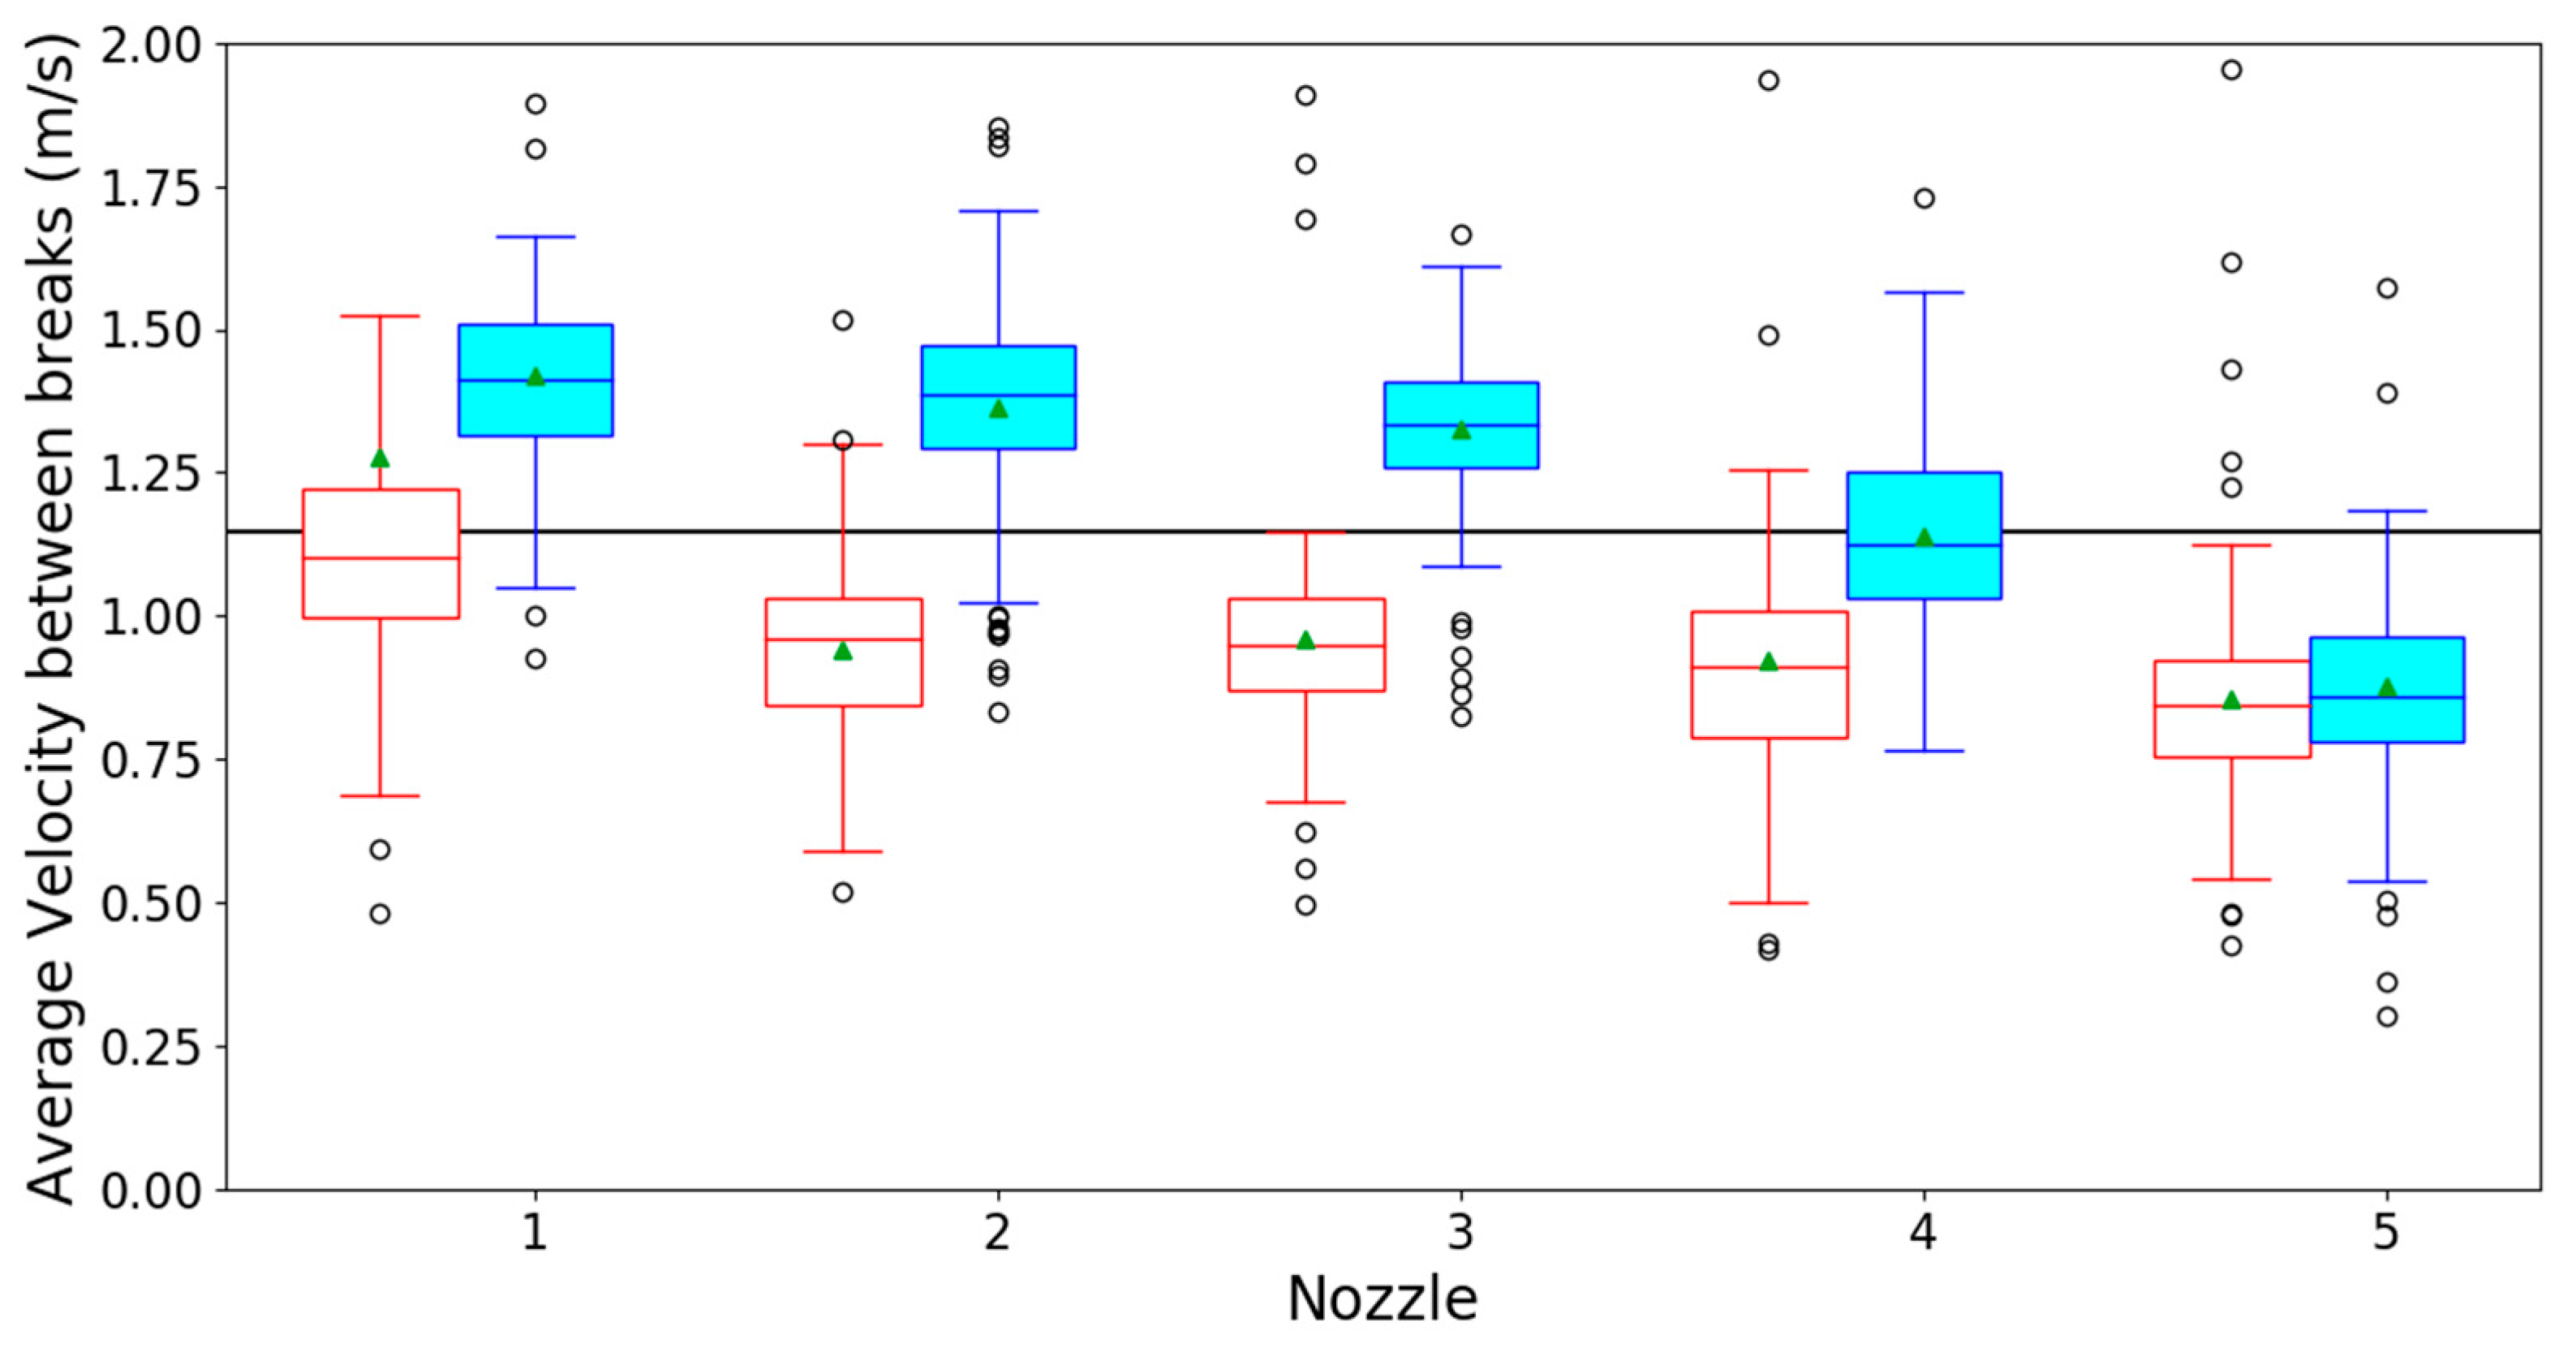
3.1. Optical Spray Analysis

A comparison of the spray from the regular and the vortex showerhead is given in Figure 3. The differences in spray characteristics between the two showerheads could be appreciated from the enclosed high-speed multimedia files (video S1 and video S2).
Figure 4a,b shows the spray of individual jets after placement of the tray filter. The jets were numbered 1 to 5 from the outermost to the innermost nozzle on both sides. The sixth jet was hidden behind the ruler. As can be seen in Figure 4, there were air bubbles inside the jets in both showerheads, with seemingly more air bubbles in the jets created by the vortex showerhead. Again, these differences could be better seen in the enclosed multimedia files (video S3 and video S4). For nozzles nr. 5b and 6b on the right side, the jet retracted back into the showerhead. From nozzle nr. 5b, only a droplet from a previous break-up could be seen directly right of the scale.
Both the regular and vortex showerheads produced a spray with a positive radial velocity gradient. This gradient was caused by centripetal forces due to the (peripheral) tangential inlet of both devices, increasing the pressure at the outermost nozzles (see Figure 1). This could also be seen in Figure 4a,b where the break-up length of the inner jets was clearly smaller than the outer jets, indicating lower velocities in the inner jets, which were a direct consequence of lower pressure flows. The average liquid velocities for the different showerheads and the different nozzles are shown in Figure 5 for a flow rate of 8 L·min−1.
As could be seen from the boxplots, apart from the innermost nozzle, the vortex showerhead showed consistently higher velocities in comparison to the regular version. This effect was seen for all tested flow rates, i.e., 6, 7, 8, and 9 L⋅min−1 (additional data for 6, 7 and 9 L⋅min−1 in the Appendix A in Figure A1, Figure A2 and Figure A3, respectively). In an aqueous vortex, perturbations in the air/water surface create a significant air boundary layer that stays associated with the surface. As these perturbations move inwards, they pull the boundary layer with them, creating a force that draws the air inwards into the vortex [16,17]. Due to the resultant pressure gradient, a certain volume of air is drawn into the water and thereby increases the flow rate through the most peripheral nozzles. This would result in an increased liquid kinetic energy for these nozzles and a consequently bigger break-up length (also observable in Figure 4). Since the sub-pressure is highest in the center of the vortex, the air intake takes place primarily at the innermost nozzles (as, for example, nozzle 5, right side, in Figure 4b). In order to understand the consequences of this result for the “shower experience” [5], the obtained median velocities for the five nozzles were used to fit a proportionality constant between flow rate and velocity for each nozzle and each showerhead, using a simple least-squares linear regression model. Taking into consideration the number of nozzles present for each radius, a weighted average was taken of the ratio between these constants in order to make our results comparable to those of Okamoto et al. [5]. The results of this calculation showed that the vortex showerhead could provide the same jet velocity as a normal showerhead when using 14.4 ± 5.6% less water (p < 0.01). Or alternatively, when using the same amount of water, the velocities (see Figure 5) and jet lengths produced by a hyperbolic showerhead were higher than those produced by a normal showerhead. It has been shown that jet velocity is related to the “shower experience” [5]. Thus, according to the results of Okamoto et al. [5], a vortex showerhead could provide the same comfort level with less water. It should be pointed out, though, that the central nozzles are used as air inlets resulting in a different spatial spray distribution, which may or may not give a desirable effect.
Figure 6 shows a boxplot representation (per nozzle) of 219 to 285 independent jet length measurements per box right after the break-up of a droplet [5].
When the liquid flow rate is increased to the point that inertial forces on the liquid overcome capillary upwards forces, the conventional image of a hanging droplet (quasi-static droplet formation) disappears, and a jet is formed at the nozzle tip from which droplets break-up [18,19]. The ratio between these two forces is the Weber number (Equation (2))
W e = ρ   ·   Q 2 D 0 3   ·   γ
with D0 being the nozzle diameter, ρ the liquid density, Q the liquid flow rate, and γ the liquid surface tension [20]. Weber numbers smaller than one indicate the liquid break-up is happening in the so-called dripping regime. For Weber numbers between one and four, it is known as “transition regime”, as the jet in that window is not yet completely formed. Rather, a small ligament forms at the nozzle tip from which droplets break-up [21]. For Weber numbers higher than four, a jet is clearly formed at the orifice. Normally, at this level, the break-up length is around 10 times bigger than the nozzle inner diameter [13]. This regime is known as the “jetting regime”. Rayleigh [22] has thoroughly studied the physics behind these break-up mechanisms and defined that the diameter of the droplets formed from such break-up is around 1.8 times the jet diameter. The Weber numbers of the jets analyzed in this work were calculated from the flow rate according to equation 2. Their values were We = 11.3, 15.4, 20.1, 25.5 for flowrates of 6,7,8,9 L min−1, respectively. Density and surface tension values of water at 35.8 °C were taken from the literature (ρ = 993.79 kg m−1 [23] and γ = 70.27 mN m−1 [24]). These calculations showed that the water was well within the jetting regime for all flowrates investigated.
It is known that, for inviscid liquids with break-up inside the jetting regime, higher liquid velocities lead to the formation of longer jets, since the characteristic timescale for the break-up is independent of jet velocity [21]. This effect is also visible in Figure 6 as a negative correlation was found (one-way ANOVA, p < 0.001 for both regular and vortex showerhead) between nozzle position and jet break-up length: the closer to the center the nozzle is, the shorter the jet break-up. Additionally, the variation of the data from the vortex showerhead was larger, indicating the presence of the transition regime. Moreover, when comparing Figure 5 and Figure 6, it was possible to see that even though the outer nozzles of the vortex showerhead presented higher liquid velocities than the regular showerhead, the jet break-up lengths in both situations were rather similar. Only the first jet showed longer jets below the vortex showerhead when compared to the regular. This could be explained by the fact that the vortex showerhead creates a suction effect [17], which purges air bubbles from the central nozzles in the system. This effect decreases the total flow in the center nozzles, which can be also seen by the reduction of the jet break-up at this point. However, the additional intake of air increases the velocity in all nozzles, which compensates for this reduction (as can be seen in Figure 5 and Figure 6) and consequently enhances the velocity at the peripheral ones. Whether this would cause higher comfort to the shower user is questionable, as the increase in peripheral jet velocity causes a consequent decrease in the velocity of the center jets.
When looking at the droplet size distribution, the minimal Feret diameter (minimum distance between two parallel lines in any orientation touching the particle) at different flow rates did not significantly shift but remained around 2.1 mm (Figure 7). Since all jets analyzed were inside the jetting regime, these droplet diameters were consistent with Rayleigh [22]. At higher flow rates, the distribution was wider for both cases.

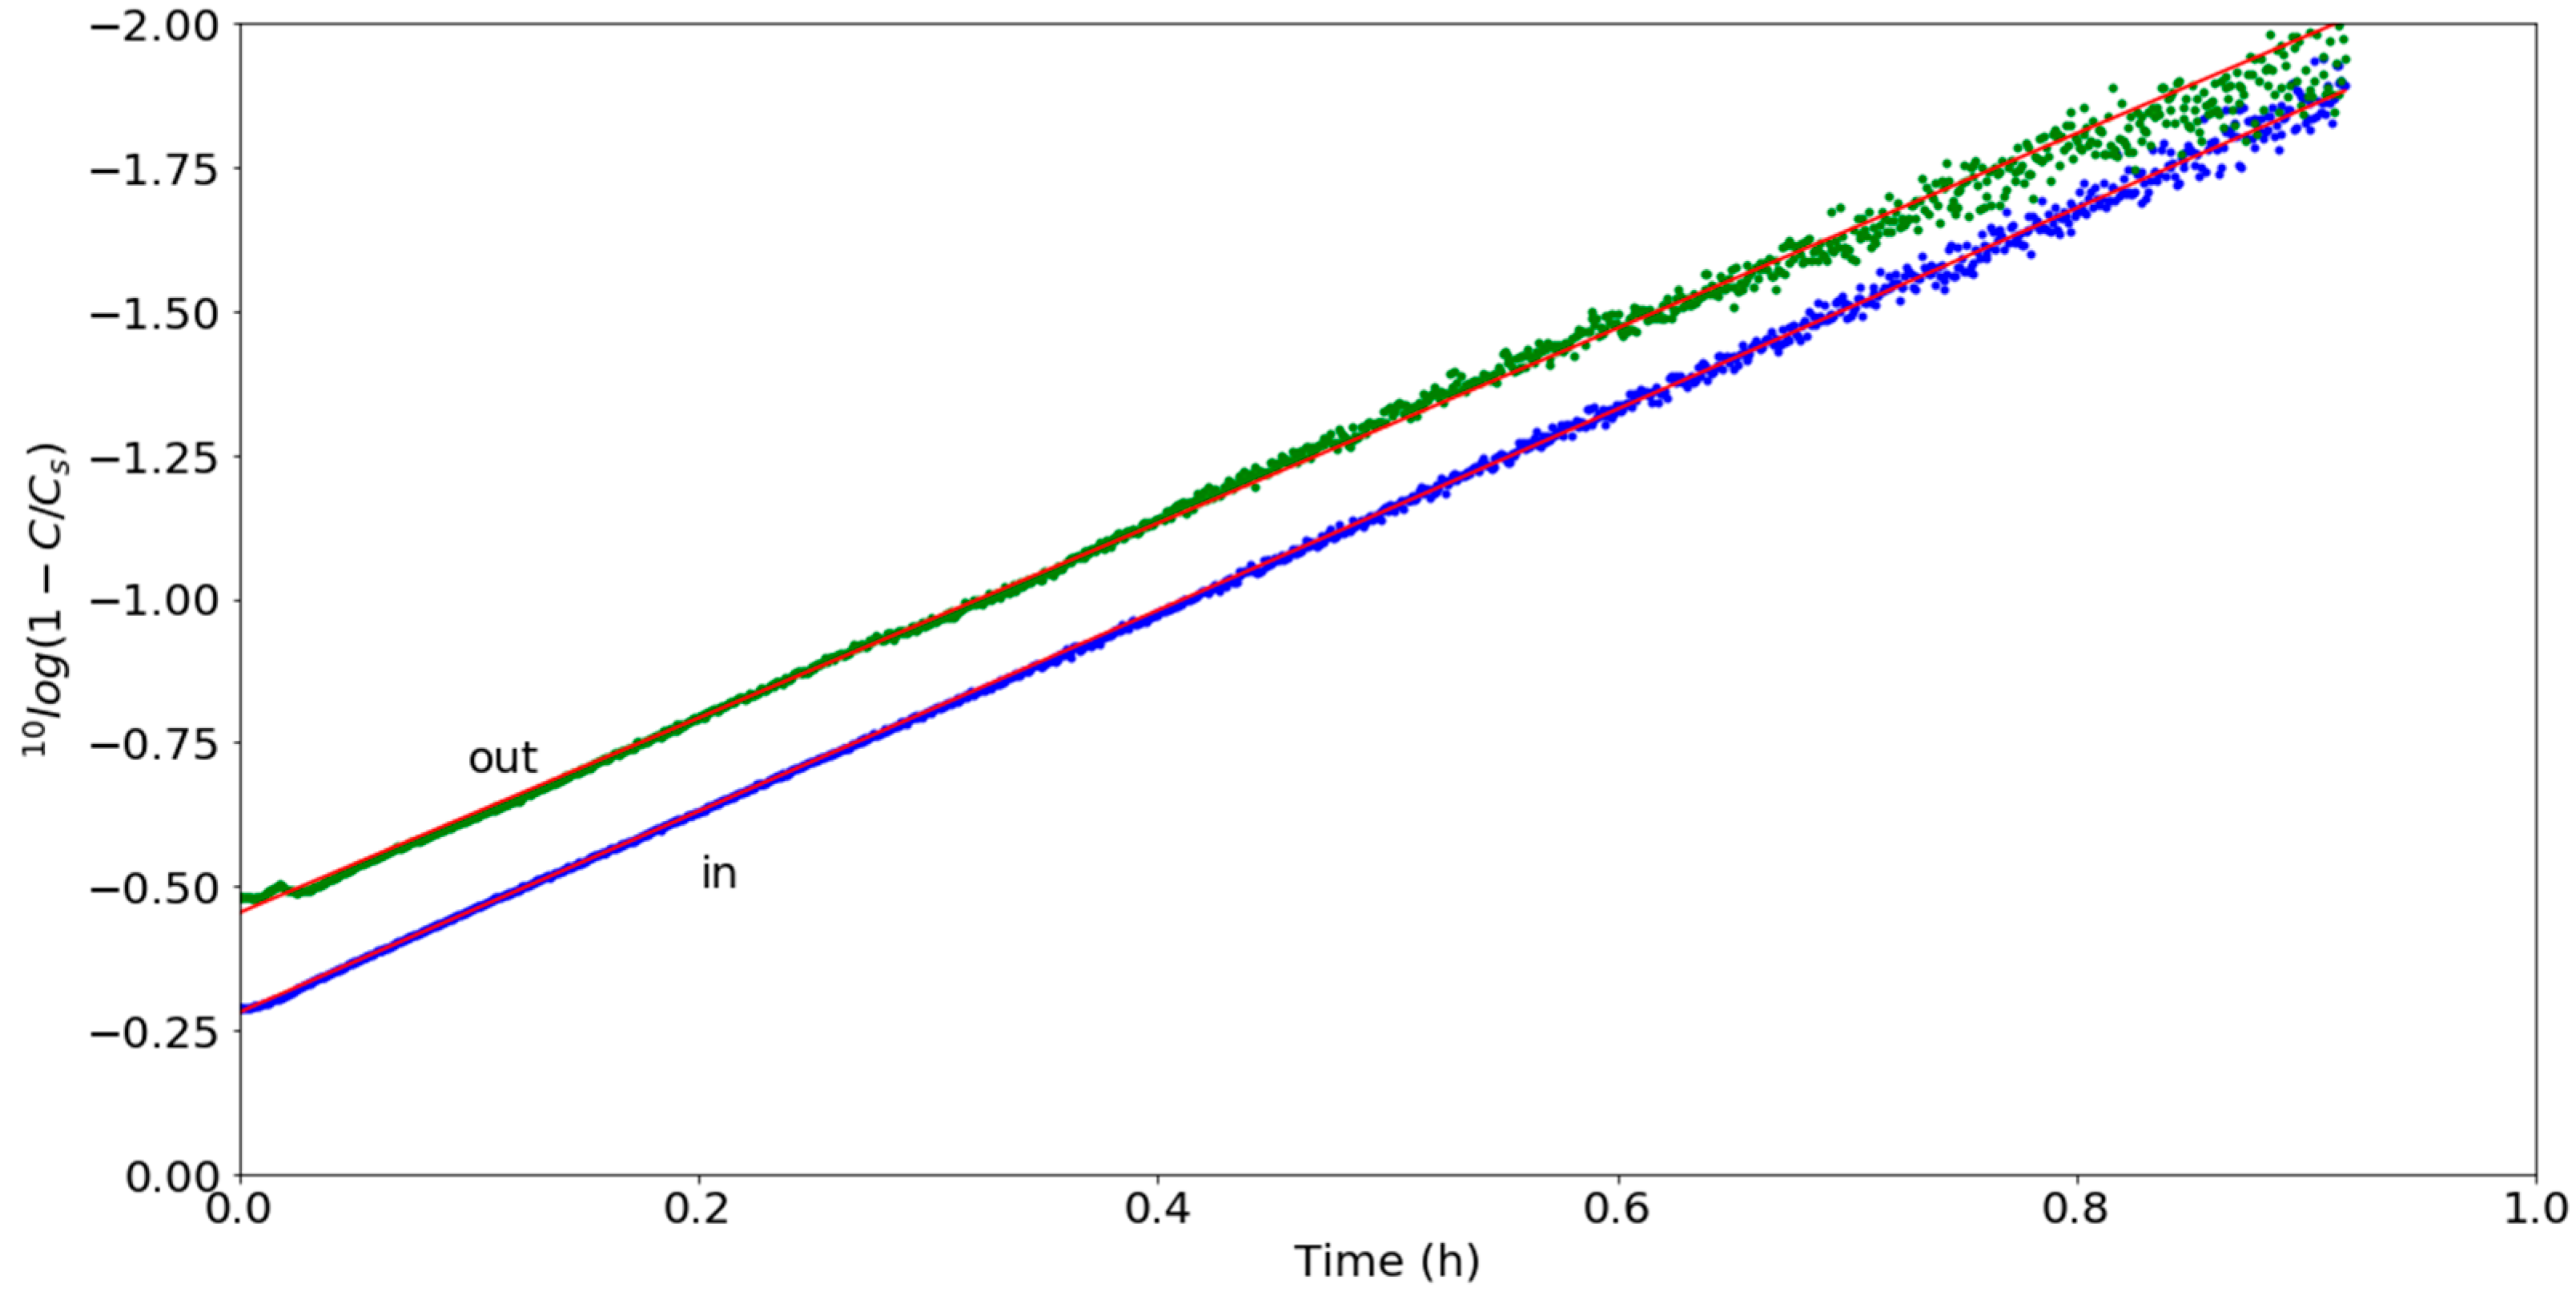
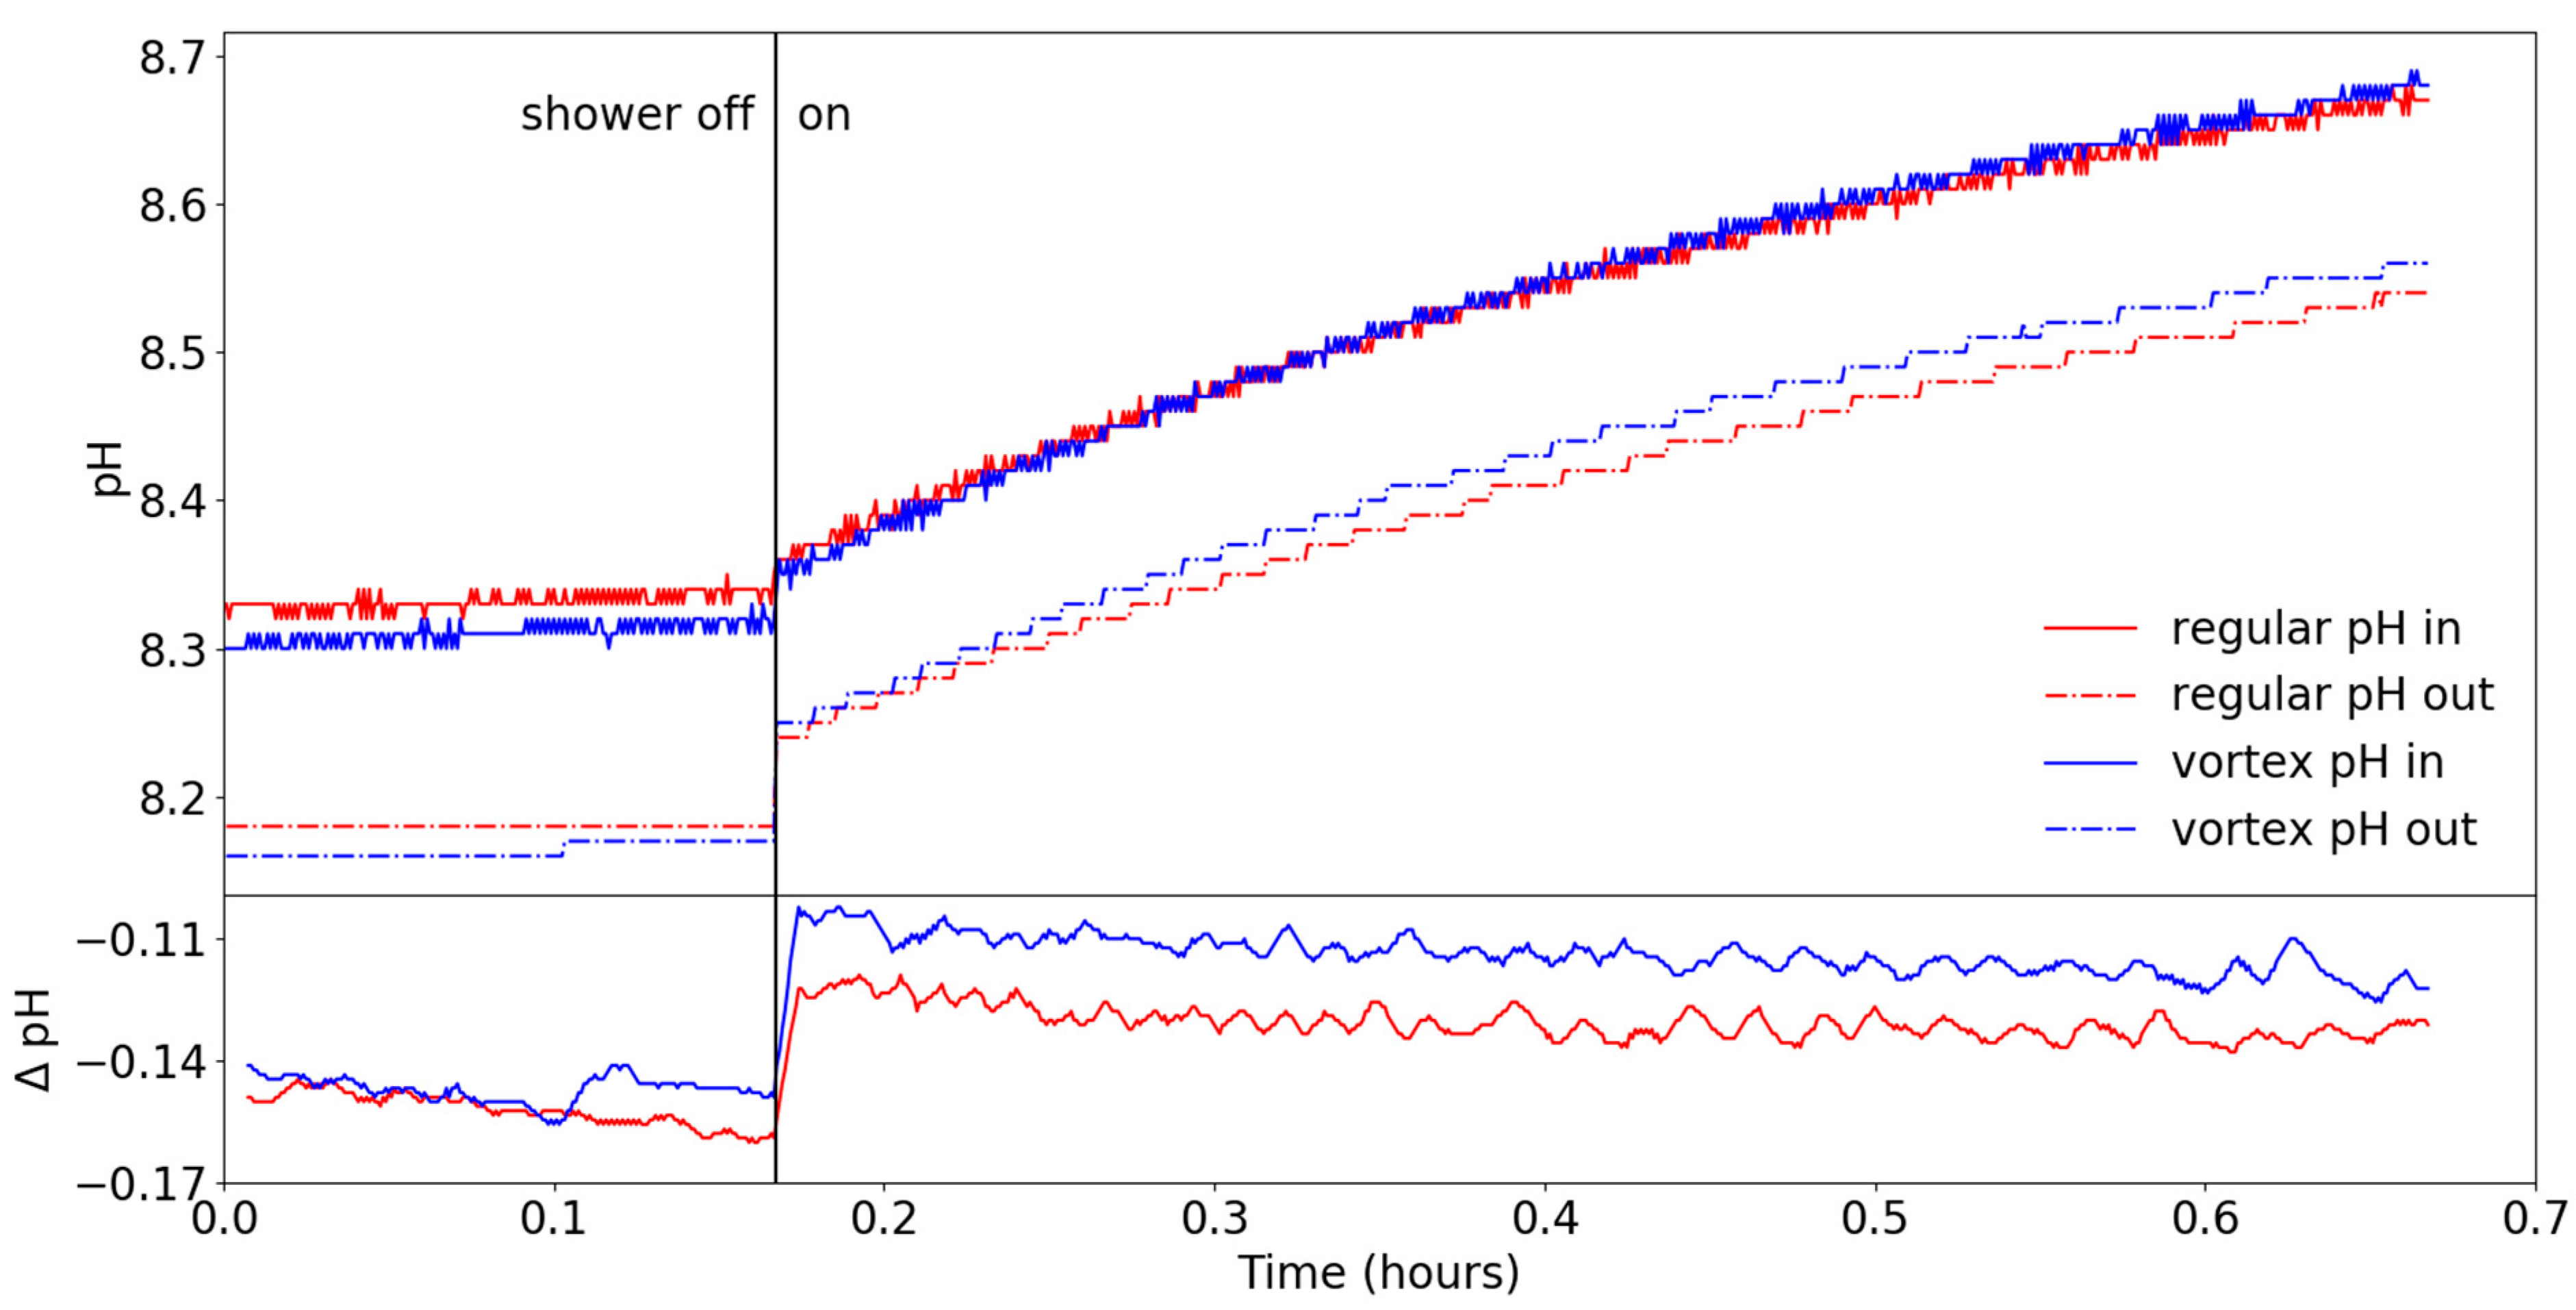
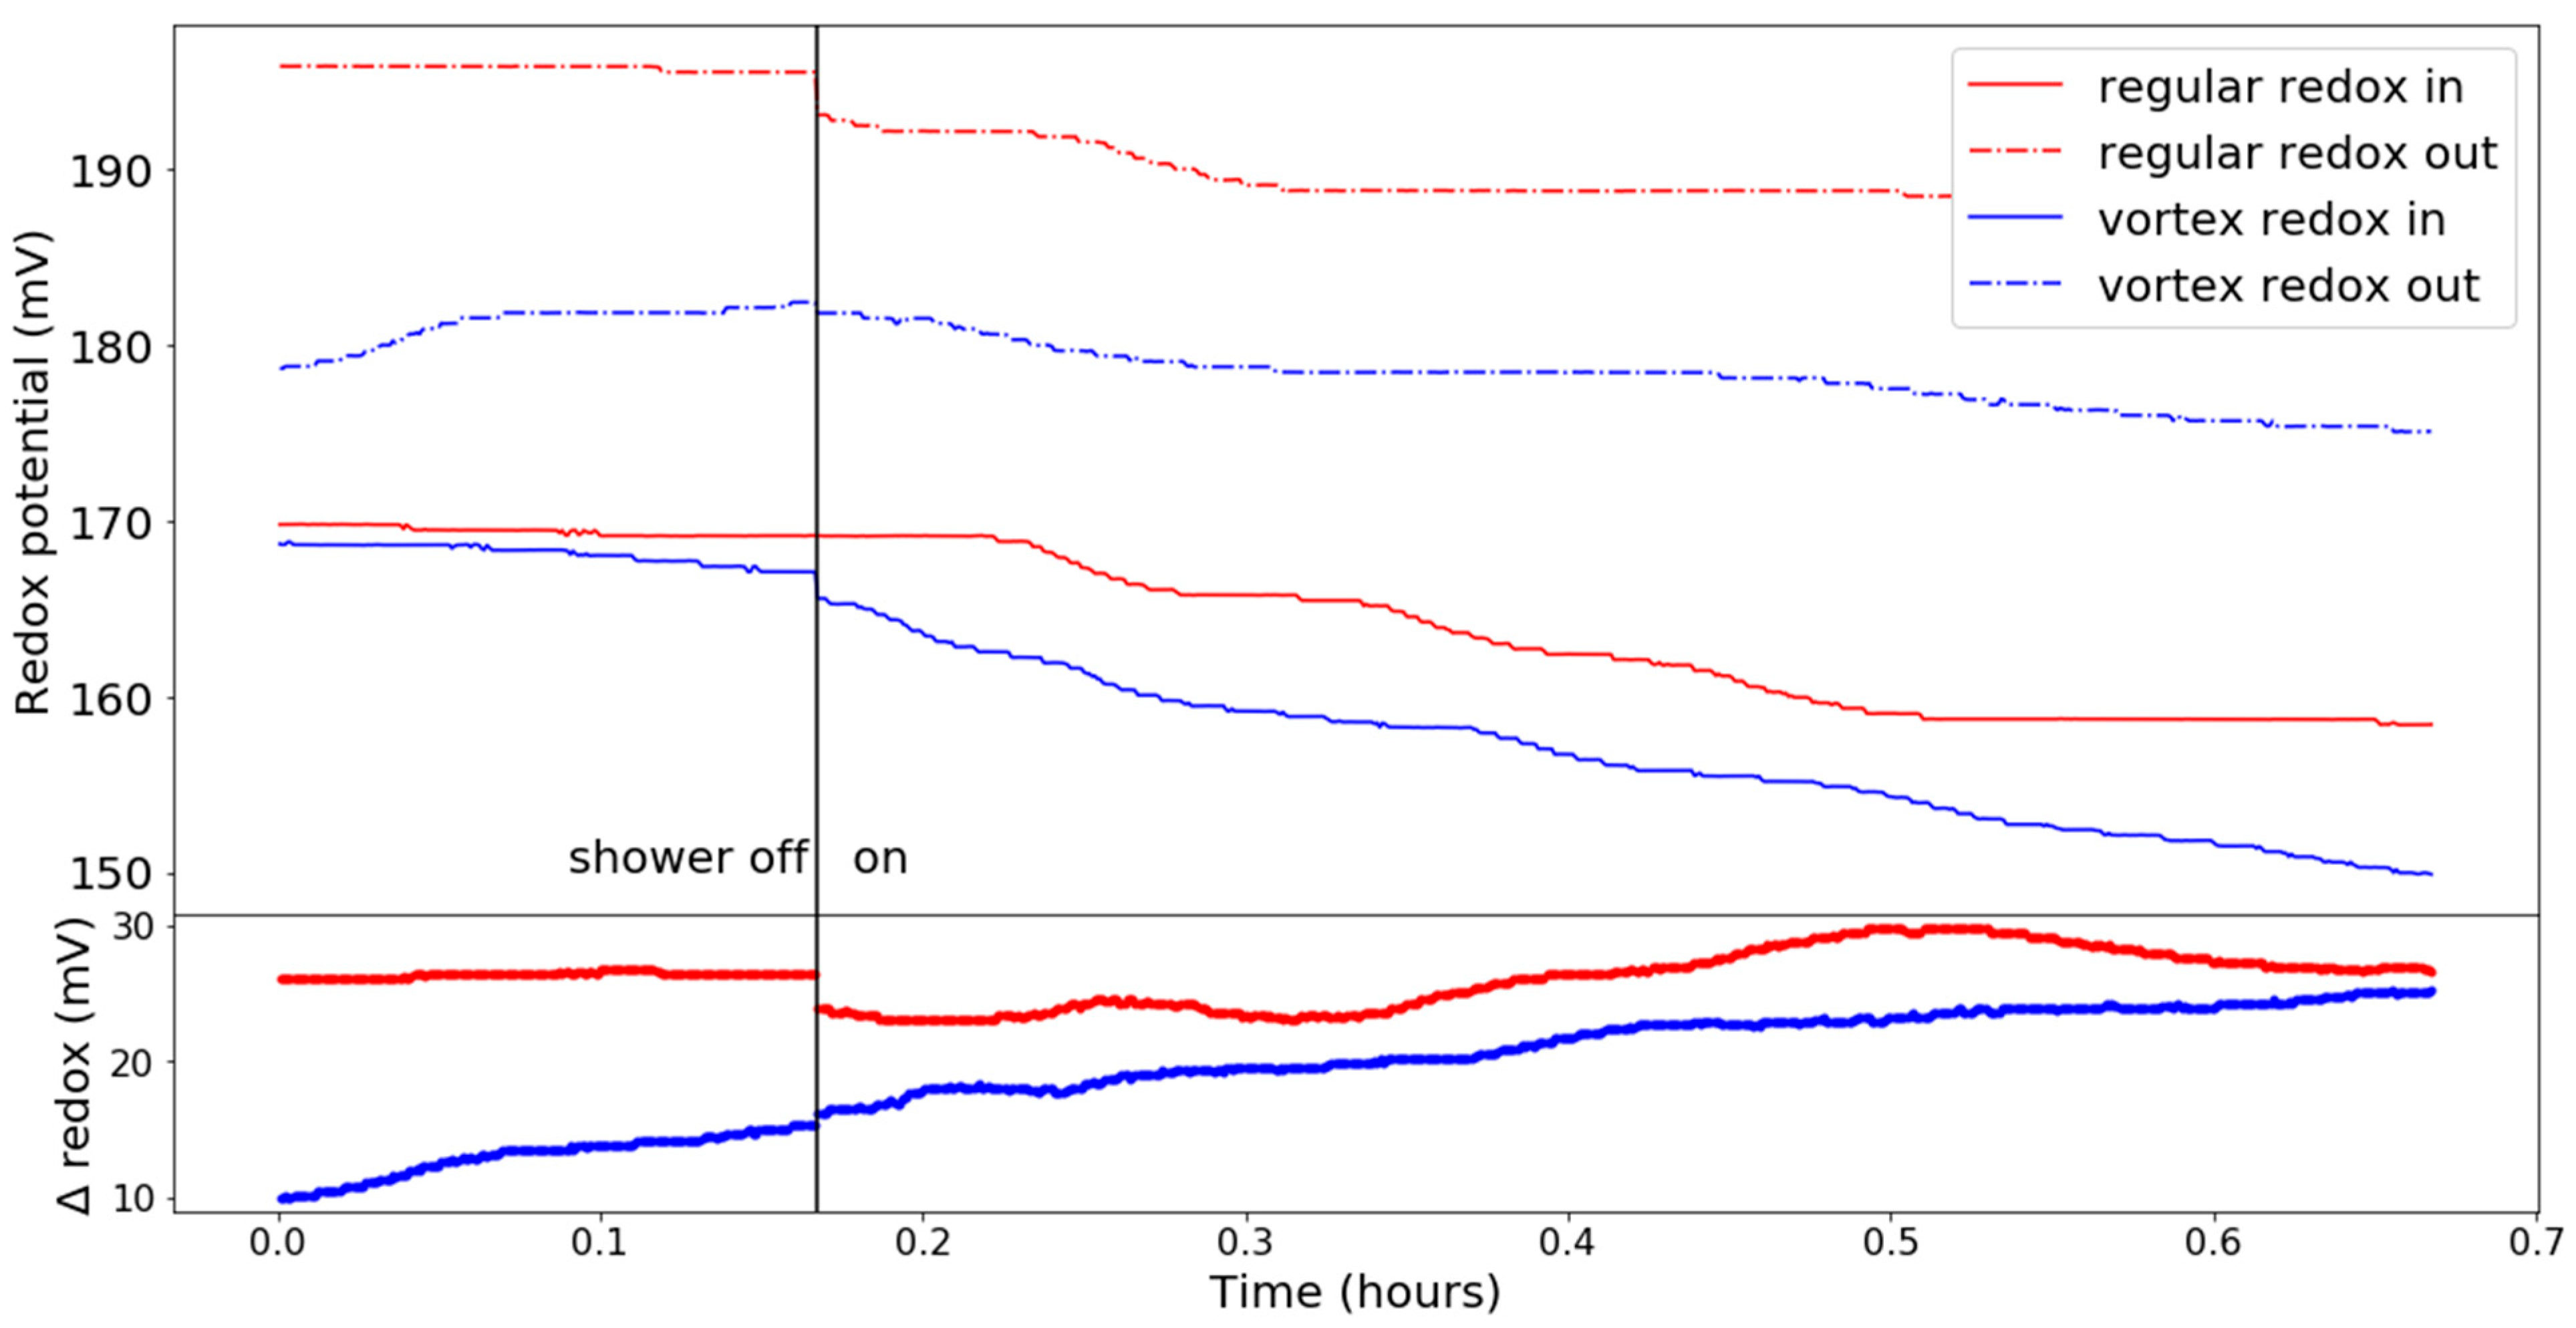
3.2. Chemical Parameters

As shown in the experimental setup (Figure 2), the water flow for both showerheads was circulated with two oxygen sensors directly before and after the showerheads. When running for longer periods, the DO concentration increased, and exponentially approached its temperature-dependent saturation value because of the large interfacial area in the heads and sprays. An example of this effect is demonstrated in Figure 8 for the vortex showerhead. The difference between the two graphs represented the immediate effect of the shower (head + spray), while the overall increase was due to the cumulative effect resulting from water recirculation through the reservoir.
These data can be fit to the exponential function (assuming the driving force is proportional to the difference between the saturation point and the actual concentration):
C ( t 2 ) = C s ( C s C ( t 1 ) ) × e ( t 2 t 1 ) / τ
where C(t1,2) is the dissolved oxygen concentration at times t1 and t2 > t1, Cs is the saturation concentration, and τ = 1 k a is a time constant typical for the system. K is the gas transfer coefficient, and a is the diffusion area divided by the total liquid volume. This equation can be rewritten to define a relative saturation coefficient F after [25]:
F C ( t 2 ) C ( t 1 ) C s C ( t 1 ) = 1 e K a Δ t
In Equation (4), t1 and t2 can also be replaced by the values at the inlet and outlet, respectively, to identify the instantaneous effect of the shower spray. F should be constant throughout the experiment, allowing us to calculate the Ka coefficient, which determines the efficiency of the system. Examples of various experiments are given in Table 1. In some experiments, the aeration was faster using the vortex showerhead (experiment 1), whereas, in others, there was no measurable difference (experiment 2). Moreover, the variation of the parameter τ was of the same order between showerheads and experiments. Naturally, the observed additional mixing of air to the water by the vortex is expected to increase the amount of dissolved oxygen. On the other hand, the time for this diffusion to happen is rather small. Hence, with the measurement precision available, no statistically significant difference in aeration could be found. However, some experiments indicated better aeration of the vortex showerhead compared to the normal one.
Apart from an increase in DO concentration, an increase of pH in the vortex showerhead compared to the regular one can be expected, since the additional mixing in the vortex will influence the carbonate/CO2 equilibrium reaction so that CO2 is expelled, comparable to stirring a glass of carbonated water,
H + + H C O 3   H 2 C O 3 s t i r r i n g H 2 O + C O 2
Naturally, the process of spraying does this as well, as shown in Figure 9 for both showerheads. Since tap water was used, the initial pH values of the two experiments were slightly different, as could be seen in the initial difference between the two measurements at the water inlet of about 0.03 pH on the left of the Figure. The difference between the sensors was plotted in the bottom part. Although being close to the sensor resolution (ΔpH = 0.01), the vortex showerhead consistently showed a slightly smaller pH decrease than the regular showerhead.
Whereas the change of pH can be easily explained by the degassing of CO2, the changes in the redox potential plotted in Figure 10 require some more in-depth discussion. The redox potential is an electrical characteristic of a solution that shows its tendency to transfer electrons to or from a reference electrode, describing a system’s overall reducing or oxidizing capacity. In well-oxidized open waters, the redox potential is normally positive (above +300 to +500 mV), whereas, in reduced environments, it can be negative. Measuring redox potential in natural (potable) waters can yield different results depending on the method [26].
Although the redox potential of water at equilibrium is relatively insensitive to a change in oxygen concentration and extent of saturation, it is, however, significantly changed by pH alterations [27]. In addition, it is highly dependent on the chemical composition of tap water. Therefore, it was to be expected that the initial values of the redox potential would differ for different measurements, as is shown in Figure 10, and made the absolute values difficult to compare. However, what could be compared was the evolution of the redox potential over time in both scenarios (thick red and blue lines in the lower part of Figure 10). The blue line showed a steeper inclination than the red line, indicating a faster rise of the redox potential difference for the vortex showerhead compared to the regular one. This could straightforwardly be explained with two other results:
  • the change of pH,
  • the (missing) increase in DO.
Solving the well-known Nernst equation [28],
E = E 0 + ( R T z F ) l n { [ A o x i d i s e d ] [ A r e d u c e d ] }
where E is the redox potential, E0 is the standard potential at 25 °C, R is the general gas constant, T the absolute temperature in K, z the number of electrons transferred, F the Faraday constant, and A are the activities of the species involved. This allows us to derive a direct proportionality of the redox potential E and the pH, namely
E ~ 0.059 V ·   pH .
Therefore, an increase of one pH unit was accompanied by a decrease in the redox potential of 59 mV at 25 °C. The pH differences measured (see Figure 7) would thus account for 0.10 (−59 mV) = −5.9 mV for the regular and 0.15 (−59 mV) = −8.85 mV for the vortex showerhead, respectively. The realized measured reductions of ~20 and ~25 mV for normal and vortex showerhead were about three times larger. So, the pH change could only explain a part of the change of the redox potential. In order to explain the additional decrease of redox potential, let us assume that a part of the dissolved oxygen enters into a chemical reaction, with some components dissolved in the water, thus oxidation takes place and the concentration of dissolved oxygen decreases. The Nernst equation shows straightforwardly that such a process would also lead to a reduction of the redox potential. If we associate the remaining reduction in redox potential—14 mV and 16mV—with such reactions, it would require 2 and 2.3 ppm or 31 and 36 µmol of DO, respectively, to be consumed by chemical reactions, which are plausible amounts for the given circumstances.

4. Conclusions

Physical and chemical parameters of an aqueous spray through a regular and a vortex showerhead were investigated and compared. The inclusion of a hyperbolic vortex in a showerhead increased the flow rate through some individual nozzles compared to a showerhead without a vortex, while droplet and jet diameter was maintained. This was achieved because, in the vortex showerhead, air bubbles are introduced from the central part of the nozzle matrix in the sprayed liquid, which, in turn, causes higher liquid velocities and break-up length in the peripheral nozzles. Since droplet size and liquid velocity make up a significant part of the “shower experience” [5], the addition of a vortex allowed the same shower experience with lower flow-rates. By mixing air into the exterior jets, a vortex showerhead could save up to 14% of the water, when compared to conventional showerheads. In addition, an increased pH and a reduced redox potential were found when comparing the vortex showerhead to the regular showerhead, indicating an increased degassing of CO2 and an increased intake of oxygen, part of which was immediately used for oxidation processes.

Supplementary Materials

The following are available online at https://www.mdpi.com/2073-4441/11/12/2446/s1, Video S1: Regular showerhead with bubbles. Video S2: Vortex showerhead with bubbles. Video S3: Spray of one row of jets from the regular showerhead. Video S4: Spray of one row of jets from the vortex showerhead.

Author Contributions

Conceptualization, methodology, M.V.v.d.G., E.C.F., L.L.F.A.; software, validation, formal analysis, investigation, resources, data curation, M.V.v.d.G.; writing—original draft preparation, M.V.v.d.G.; writing—review and editing, M.V.v.d.G, N.D., L.L.F.A., E.C.F.; supervision, L.L.F.A., E.C.F., W.L.; project administration, E.C.F., L.L.F.A.

Funding

This research received no external funding.

Acknowledgments

This work was performed at Wetsus, European Center of Excellence for Sustainable Water Technology (www.wetsus.eu). Wetsus is co-funded by the Dutch Ministry of Economic Affairs and Ministry of Infrastructure and Environment, the Province of Fryslân, and the Northern Netherlands Provinces. The authors would like to thank Jakob Woisetschläger (TU Graz, Austria) and the other participants of the research theme “Applied Water Physics” for the fruitful discussions and their financial support. A special thanks also go to Wiard Kuipers, who did a lot of experimental work and helped to build the setup.

Conflicts of Interest

The authors declare no conflict of interest.

Appendix A

Figure A1. Boxplot graphs of the average liquid velocities in the experiments done with 6 L⋅min−1 for the regular (red boxes) and vortex (blue boxes) showerhead and nozzles 1 (outermost) to 5 (innermost). The green triangles are the calculated population mean. The horizontal black line is the expected liquid velocity calculated using continuity law [15] by taking the flow rate divided by the total nozzle surface area.
Water 11 02446 g0a1
Figure A2. Boxplot graphs of the average liquid velocities in the experiments done with 7 L⋅min−1 for the regular (red boxes) and vortex (blue boxes) showerhead and nozzles 1 (outermost) to 5 (innermost). The green triangles are the calculated population mean. The horizontal black line is the expected liquid velocity calculated using continuity law [15] by taking the flow rate divided by the total nozzle surface area.
Water 11 02446 g0a2
Figure A3. Boxplot graphs of the average liquid velocities in the experiments done with 9 L⋅min−1 for the regular (red boxes) and vortex (blue boxes) showerhead and nozzles 1 (outermost) to 5 (innermost). The green triangles are the calculated population mean. The horizontal black line is the expected liquid velocity calculated using continuity law [15] by taking the flow rate divided by the total nozzle surface area.
Water 11 02446 g0a3

References

  1. United Nations. Department of Economic and Social Affairs, Population Division; World Population Prospects; United Nations: New York, NY, USA, 2019. [Google Scholar]
  2. Sokolow, S.; Godwin, H.; Cole, B.L. Impacts of urban water conservation strategies on energy, greenhouse gas emissions, and health: Southern California as a case study. Am. J. Public Health 2016, 106, 941–948. [Google Scholar] [CrossRef] [PubMed]
  3. Shimizu, Y.; Dejima, S.; Toyosada, K. The CO2 emission factor of water in Japan. Water 2012, 4, 759–769. [Google Scholar] [CrossRef]
  4. Hakket, M.J.; Gray, N.F. Carbon dioxide emission savings potential of household water user reduction in the UK. J. Sustain. Dev. 2009, 2, 36–43. [Google Scholar]
  5. Okamoto, M.; Sato, M.; Shodai, Y.; Kamijo, M. Identifying the physical properties of showers that influence user satisfaction to aid in developing water-saving showers. Water 2015, 7, 4054–4062. [Google Scholar] [CrossRef]
  6. Wood, V.T.; Brown, R.A. Simulated Tornadic Vortex Signatures of Tornado-Like Vortices Having One- and Two-Celled Structures. J. Appl. Meteorol. Climatol. 2011, 50, 2338–2342. [Google Scholar] [CrossRef]
  7. Schauberger, V. Die Natur als Lehrmeisterin. Implosion 1963, 7, 21–27. [Google Scholar]
  8. Schauberger, W. Klaus Radlberger, Der Hyperbolische Kegel; PKS Eigenverlag: Bad Ischl, Austria, 2002; ISBN 3950068619. [Google Scholar]
  9. Drullion, F. Numerical Simulation of tornado-like vortices around complex geometries. Int. J. Comp. Math. 2009, 86, 1947–1955. [Google Scholar] [CrossRef]
  10. Wan, J.W.L.; Ding, X. Physically-Based Simulation of Tornados. In Workshop on Virtual Reality Interaction and Physical Simulation, Proceedings of the Second International Conference on Virtual Reality Interaction and Physical Simulation, Pisa, Italy, 8–11 November 2005; Ganovelli, F., Mendoza, C., Eds.; ISTI-CNR: Pisa, Italy, 2005. [Google Scholar]
  11. Trapp, R.; Fiedler, B. Numerical simulation of tornado-like vortices in asymmetric flow. In The Tornado: Its structure, dynamics, prediction, and hazards. Geophys. Monogr. 1993, 79, 49–54. [Google Scholar]
  12. Rotunno, R. Numerical simulation of a laboratory vortex. J. Atmospheric Sci. 1977, 34, 1942–1956. [Google Scholar] [CrossRef]
  13. Agostinho, L.L.F. Electrohydrodynamic Atomization in the Simple-Jet Mode: Out-scaling and Application. Ph.D. Thesis, TU Delft, Delft, The Netherlands, 2013. [Google Scholar]
  14. Merkus, H.G. Particle Size Measurements: Fundamentals, Practice, Quality. Springer: Pijnacker, The Netherlands, 2009; ISBN 978-1-4020-9016-5. [Google Scholar]
  15. Pedlosky, J. Geophysical Fluid Dynamics, 2nd ed.; Springer: New York, NY, USA, 1987; pp. 10–13, ISBN-13 978-0-387-96387-7. [Google Scholar]
  16. Qian, Z.; Wu, P.; Guo, Z.; Huai, W. Numerical simulation of air entrainment and suppression in pump sump. Sci. China Technol. Sci. 2016, 59, 1847–1855. [Google Scholar] [CrossRef]
  17. Blaszczyk, A.; Papierski, A.; Kunicki, R.; Susik, M. Surface Vortices and Pressures in Suction Intakes of Vertical Axial-Flow Pumps. Mech. Mech. Eng. 2012, 16, 51–71. [Google Scholar]
  18. Lin, S.P.; Reitz, R.D. Drop and spray formation from a liquid jet. Annu. Rev. Fluid Mech. 1998, 30, 85. [Google Scholar] [CrossRef]
  19. Van Hoeve, W.; Gekle, S.; Snoeijer, J.H.; Versluis, M.; Brenner, M.P.; Lohse, D. Breakup of diminutive Rayleigh Jets. Phys. Fluids 2010, 22, 122003. [Google Scholar] [CrossRef]
  20. Van Hoeve, W. Fluid Dynamics at a Pinch: Droplet and Bubble Formation in Microfluidic Devices. Ph.D. Thesis, University of Twente, Enschede, The Netherlands, 2011. [Google Scholar]
  21. Eggers, J.; Villermaux, E. Physics of liquid jets. Rep. Prog. Phys. 2008, 71, 036601. [Google Scholar] [CrossRef]
  22. Rayleigh, L. On the instability of jets. Proc. R. Soc. Lond. 1879, 10, 4. [Google Scholar] [CrossRef]
  23. Engineering ToolBox. Water—Density, Specific Weight and Thermal Expansion Coefficient. 2003. Available online: https://www.engineeringtoolbox.com/water-density-specific-weight-d_595.html (accessed on 31 October 2019).
  24. Vargaftik, N.B.; Volkov, B.N.; Voljak, L.D. International Tables of the Surface Tension of Water. J. Phys. Chem. Ref. Data 1983, 12, 817. Available online: http://twt.mpei.ru/MCS/Worksheets/iapws/Surf-H2O.xmcd (accessed on 31 October 2019). [CrossRef]
  25. Yin, Z.G.; Cheng, D.S.; Liang, B.C. Oxygen transfer by air injection in horizontal pipe flow. J. Environ. Eng. ASCE 2012, 139, 908–912. [Google Scholar] [CrossRef]
  26. Matia, L.; Rauret, G.; Rubio, R. Fresenius J. Anal. Chem. 1991, 339, 455–462. [Google Scholar] [CrossRef]
  27. Wetzel, R.G. Limnology. In Chapter 14—Iron, Sulfur and Silica Cycles, 3rd ed.; Academic Press: Cambridge, MA, USA, 2001; pp. 289–330. ISBN 9780127447605. [Google Scholar]
  28. Orna, M.V.; Stock, J. Electrochemistry, Past and Present; American Chemical Society: Columbus, OH, USA, 1989; ISBN 978-0-8412-1572-6. [Google Scholar]
Figure 1. Schematics of the regular (a) and the vortex (b) showerhead. Both are encapsulated in the same handle and nozzle plate (c). The numbers in blue in subfigures (a) and (b) are the dimensions in mm.
Water 11 02446 g001
Figure 2. Recirculating setup for measuring chemical parameters for either the normal or the vortex showerhead.
Water 11 02446 g002
Figure 3. High-speed photography of the regular (a) and vortex (b) showerhead.
Water 11 02446 g003
Figure 4. Individual jet comparison of the spray of regular (a) and vortex (b) showerhead at 8 L h-1 flow rate, 22.7 °C temperature using a tray filter, allowing only one line of nozzles to produce an undisturbed jet path to be imaged.
Water 11 02446 g004
Figure 5. Boxplot graphs of the average liquid velocities in the experiments done with 8 L⋅min−1 for the regular (red boxes) and vortex (blue boxes) showerhead and nozzles 1 (outermost) to 5 (innermost). The green triangles are the calculated population mean. The horizontal black line is the expected liquid velocity calculated using continuity law [15] by taking the flow rate divided by the total nozzle surface area.
Water 11 02446 g005
Figure 6. Jet lengths for the various showerheads and nozzles at 8 L min−1 and 35.8 °C taken from frames right after a filament had broken off.
Water 11 02446 g006
Figure 7. Minimal Feret diameter of droplets for different flow rates for regular showerhead (left) and vortex showerhead (right) at 35.8 °C. Normalized intensities (total surface is 1) and Gaussian distributions were drawn for the various flow rates, and the vertical lines indicate the means of their respective distributions.
Water 11 02446 g007
Figure 8. DO (dissolved oxygen) content before (blue) and after (green) the vortex showerhead expressed as the logarithm of 1−C/Cs, where C is the concentration in ppm, and Cs is the saturation concentration determined from fitting the data to formula 3. The fits are shown in red. In this notation, 0 represents zero DO, and −2 represents a DO value of 0.99 Cs.
Water 11 02446 g008
Figure 9. pH against time for both showerheads before (full) and after (dot-dashed) the spray in a circulating water setup at 35.8 °C. The lower part is the difference between the two pH sensors for both showerheads, shown as a moving average over 3 minutes.
Water 11 02446 g009
Figure 10. Redox potential against time for both showerheads before (full) and after (dot-dashed) the spray in a circulating water setup. The lower part is the difference between the two redox potential sensors for both showerheads.
Water 11 02446 g010
Table 1. Fitting parameters of equation 1 to data of the DO (dissolved oxygen) content for two identical experiments of regular and vortex showerheads before and after the shower using a least-squares method. t1 indicates the start of the shower spray. Cs is the saturation concentration for oxygen found by the fit and C(t1) is the concentration at time t1. The goodness of fit is indicated with R2.
ExperimentShowerheadSensorCsC(t1)/ppmτ/hCs/ppm
1VortexIn3.130.216.130.9992
Out2.130.206.110.9972
RegularIn3.140.226.170.9998
Out2.090.246.170.9987
2VortexIn3.230.256.170.9999
Out2.170.266.160.9989
RegularIn3.210.266.140.9998
Out2.200.256.120.9994

