The Analysis of Water Supply Operating Conditions Systems by Means of Empirical Exponents


Institute of Environmental Engineering, Wroclaw University of Environmental and Life Sciences, Grunwaldzki 24, Wrocław 50-363, Poland
*
Author to whom correspondence should be addressed.
Water 2019, 11(12), 2452; https://doi.org/10.3390/w11122452
Submission received: 4 October 2019
/
Revised: 10 November 2019
/
Accepted: 20 November 2019
/
Published: 22 November 2019
(This article belongs to the Section Urban Water Management)
Abstract
:The stochastic character of water consumption by consumers and the technical condition of water supply systems are the main deterministic random factors influencing the observed changes in flow rate and pressure. The implementation of Supervisory Control and Data Acquisition (SCADA) systems resulted in the creation of dispersed data sets coming from the devices controlling the operation of the water supply system. Thanks to the use of metadata and advanced computer systems of analysis, data from various sources can be analyzed to detect the operating conditions of the water supply system. The aim of the research was to analyze an empirical exponent, determined on the basis of flow rate and pressure measurements for one of the District Metered Areas (DMAs). Modern supervised and unsupervised machine learning systems were implemented to classify the obtained results. The results of the research showed that on the basis of the established empirical exponent in the systems in which the pressure is reduced at night, it is possible to qualify the operating conditions of the water supply system in the DMA with accuracy of up to 90%. The conducted tests may be implemented as a component of expert diagnostic systems in water companies.
1. Introduction
The conditions of operation for water supply systems depend on many deterministic random factors influencing the observed changes in flow rate and pressure. The theory of exploitation of technical systems distinguishes technical and operational conditions of technical objects. The operational condition of a system, facility or technical device is a momentary phase of exploitation, described by the results of measurements of physical quantities characterizing the functional features of a water supply system [1]. The flow rate and pressure are the parameters of the operating condition of the water supply system. The distribution of these parameters is most strongly influenced by the stochastic character of water consumption by consumers. Water consumption by consumers using the water supply system shows quantitative changes both in time and in the space supported by a given water supply system. The random character of water consumption in particular points of the water supply system causes the recorded time series of instantaneous flow rate and hydrostatic pressure to be treated as a stochastic process. Recognition of the stochastic process of demand is of particular importance for developing control of the operation of equipment for water intake, treatment and distribution. The stochastic character of water demand causes the analysis of the results of flow and pressure variability in selected points of the water supply system to not allow for their simple use in the assessment of its technical condition and prediction of emergency status.
The technical condition of a system (facility) is understood as a matrix of features describing the physical properties of system components, taking into account the level of risk for loss of technical performance under the influence of operating time or external factors. Experience has shown that the quality of water and the physical and chemical processes taking place on the internal and external surfaces of water pipes determine the speed of their ageing [2,3]. Changes in technical condition are reflected in an increase in the number of failures, increased costs of pumping water and real losses during its distribution to customers. The technical condition is closely related to the age of the pipes, the material from which they are made, the water pressure in the pipelines, the composition of the water supply system and other factors having a direct or indirect impact on the change in the strength and hydraulic parameters of the water supply pipes. The analysis of data from Polish water supply companies showed that in the years 2004–2013 the network failure rate decreased three times [4]. The failure rate of the Polish water supply system (excluding house connection pipes) in 2010 was 0.61 failure/km/year and in 2014 it decreased to 0.40 failure/km/year (according to The Polish Waterworks Chamber of Commerce). However, these values are much higher than the failure rates of water supply systems in other European countries, ranging from 0.10 to 0.30 failure/km/year. The decrease in the failure rate of the water supply system observed in Poland is a result of popularization of charges for water supply system, which resulted in implementation of the principles of operation of water supply systems based on economic calculation and translated into increased care for their technical condition.
The implementation of Supervisory Control and Data Acquisition (SCADA) systems in water supply companies resulted in the creation of multidimensional, disperse data sets coming from devices controlling the operation of the water supply system. Thanks to the use of metadata and advanced IT systems of collection analysis, data from various sources can be analyzed in order to detect the phenomena important for decision making in water companies [5]. At the turn of the 20th and 21st centuries, it was pointed out that data from continuous monitoring of industrial processes, necessary for supervision and automatic control, can also be used to detect failure situations using numerical diagnostic tools [6,7]. Initially, procedures were introduced to control the correctness of measuring devices and then to detect unusual states of operation of technical devices [8,9]. Quick detection and diagnosis of malfunctions of measuring devices and the operation of the controlled technical system result not only from economic considerations, but also from the need of limiting environmental effects by reducing the risk of failure [10]. The monitoring of the state of operation of the water supply system should not be considered only in the aspect of emergency situations. For rational operation of water supply systems, the parameters of their operating status should also be recognized during unusual water consumptions, e.g., during holidays, public holidays, during popular or very interesting TV programs and in academic cities, taking into account the academic year. Depending on the purpose of the analyses: failure detection, assessment of the condition of the water supply system or location, a number of specialized methods of digital processing of the parameters of the water supply system conditions are implemented.
Among the methods of detecting the working conditions of the water supply network currently used in practice, one can distinguish hardware and software methods [11]. In hardware methods, which can also be called instrumental methods, diagnosis is performed mainly by using specialized equipment or test and diagnostic apparatus. In software methods, computer systems for data collection are used to diagnose, and using specialized calculation algorithms, the occurrence of phenomena that may affect the safety or operating costs of the water supply system is assessed. Software methods include analysis of water consumption, flow rate and pressure in selected points of the system in order to detect unusual situations and search for causes of their occurrence, including failure and pre-failures states.
The software methods include a number of solutions based on water balance and analysis of Minimum Night Flow (MNF) between 02:00–04:00 [12]. The water balance is used in the implementation of good water supply practices aimed at rational, economically justified exploitation of water supply systems, based on the minimization of actual water losses [13]. Silva et al. [14] have demonstrated that a significant drawback of balance for diagnostic purposes methods is that too little data is available and that the reliability of the data is poor. In order to improve balance based diagnosis, the methods used include the High-Density Regions (HDR) probability distribution method [14]. More advanced software solutions have implemented Multi-Criteria Decision Analysis (MCDA), which supports water supply system management and abnormal state detection [15]. The authors of these studies implemented a fuzzy, multi-criteria method of hierarchical analysis of decision-making problems, i.e., Analytic Hierarchy Process (AHP) and a method of linear ordering of the Technique for Order of Preference by Similarity to Ideal Solution (TOPSIS) objects. Both methods support decision-making processes and their implementation consists in assigning significance to particular activities undertaken to reduce water losses and the number of failures, taking into account the condition of the water supply system. The analyses have shown that the most important impact on the number of failures is related to the way of pressure management in the water supply system and implementation of water balance methods in District Metered Areas (DMAs). The Fixed and Variable Area Discharges (FAVAD) solution is one of the software methods. The FAVAD method is known as the Pressure and Leakage Management strategy (PLM) [16]. Reducing the water pressure in the DMA at night to the level resulting from the size of the water demand and the required geometric lifting height and hydraulic losses contributes to reducing the actual water losses. As part of the FAVAD pressure management strategy, during minimum night-time flows in the DMA water supply pipeline, the pressure in the system is reduced by using Pressure Reducing Valve (PRV). The idea of the FAVAD solution determines the dependence of the amount of failure discharge on the Average Zone Pressure (AZP) [17,18]. The effect of pressure on the flow rate through the orifice considers the relationship between the initial and final flow rates, depending on the prevailing operating pressure.
Advanced methods of flow rate and pressure analysis, registered on active water supply systems with SCADA systems have not been widely used so far due to the complexity of calculation procedures. For this reason, technical infrastructure diagnostics is a young and constantly evolving field. Apart from basic analyses of the parameters of water supply system operation, data mining techniques and learning systems, which are the basis for data mining, are seeing increasingly frequent use to detect abnormal situations. It is customary to divide the learning systems into learning solutions with the so-called supervision and without supervision. The classification of operating states of the water supply system, based on the analysis of flow rate and pressure parameters, includes cluster analysis using hierarchical trees, Support Vector Machine (SVM) and Decision Trees (DC). So far, most of the research results aimed at the recognition of the possibility of using data mining methods have not been implemented in many countries, including Poland, in the creation of advisory systems for services supervising the operation of complex water supply systems. One of the reasons for this situation is the lack of research conducted on real water supply systems. Most of the studies conducted so far are limited to laboratory conditions or a semi-technical scale [19,20]. The analysis of operation conditions (flow rate and pressure) is used to assess the condition of water supply systems. Review of the subject literature shows that analytical tools, such as support vector machine (SVM) and the k-nearest neighbor algorithm are used to detect operation status of water supply networks [21]. The cited research indicates that the highest accuracy of water supply operation status based on pressure parameter (94.8%) in case of failure detection had a naïve Bayes classifier. The lowest accuracy (78.51%) used a k-nearest neighbor algorithm. Neural networks [22] and decision trees [23] were also used to detect operation status of water supply systems.
Water supply infrastructure diagnostics have many limitations. Barriers to the implementation of diagnostic tools in water and sewage companies are high costs and a lack of qualified diagnostic staff who understand the essence of phenomena occurring in water supply networks and who know modern IT methods of signal analysis, including artificial intelligence methods necessary to classify phenomena based on signals from the monitoring of the water supply system. Measurements of the water supply network have caused a situation where a huge number of measurement results exceed the perceptive abilities of network dispatchers and operators, and there is a misconception about the non-interpretability of data sets generated by extensive SCADA systems. Attention is also drawn to restrictions on the ability to register and manage large databases, mainly due to the lack of implemented signal processing procedures at the place of their creation [19]. As far as extended water supply systems are concerned, time synchronisation of measurement data coming from different control points is also a problem [24]. One of the most frequently mentioned barriers to the detection of water supply operation status is a limited number of field studies. Because of this, most of the diagnostic methods presented in the literature have limited scope of application [25].
The main goal of the research presented in this article was to assess the possibility of using the modified assumptions of the FAVAD method to diagnose the operating conditions of the actual water supply system. The analyses were carried out on the basis of time series of pressure and flow rate changes. On the basis of the values of these parameters and the assumptions of the FAVAD approach, an empirical exponent α was determined. The research included verification as to whether the controlled, step change of pressure during the MNF allows to qualify the states of operation of the water supply network in the DMA. An additional aim of the research was to check whether the empirical values of α exponents, determined for the phases of pressure reduction and increase, can be used as an element of classification of operating states of water supply systems. In the research conducted so far, the FAVAD method was used to determine the amount of unexpected leakages of water as a result of failure at variable pressure. The new approach presented in the paper allows to consider the determination of the exponent linking the flow rate–pressure relationship, which is an analytical problem that has not yet been addressed in the context of water supply network diagnostics.
The paper is organized in four Sections. In Section 2 the operating parameters of the water supply system are described. The same Section outlines measurement events proposed for analysis, FAVAD method assumptions and its modifications that lead to the calculation of the empirical exponent and methods used to assess the accuracy of classifiers. Research results presented in Section 3 are thematically organised into two parts. In the first, the values of exponents for both the pressure reduction and growth phases are analyzed. The second part contains the results of the classification of the empirical exponent with the use of supervised and unsupervised learning systems as well as the assessment of accuracy of classifiers. The final conclusions are provided in Section 4.
2. Materials and Methods
2.1. Monitoring of Hydraulic Parameters and Study Area
The recording of the operating parameters of the water supply system—flow rate and pressure—was carried out on a main pipeline with a nominal diameter of 800 mm. Water is supplied through the pipeline to a separate water supply of the DMA, which is under the management of Municipal Water and Sewage Company S.A. in Wroclaw (Poland). The selected region is inhabited by about 22,400 people and the DMA daily receives 4000 m3 of water. The night-time pressure reduction procedure is carried out by a zone water pumping station, in which three pump sets are operated, each consisting of four single-stage centrifugal pumps with a power of 18.5 kW. The total capacity of the pump sets is 2184 m3/h and the head is 35 mH2O. In each pump set, one pump unit cooperates with a variable frequency drive and the others are equipped with soft-start devices and a soft-braking controller, which prevents excessive pressure amplitudes.
Changes in pressure and flow rate in the experimental facility were recorded from April 2017 to January 2018. Flow rate measurements were taken from a permanently installed electromagnetic flow meter with a measurement accuracy of ±0.25%. The measurement interval in the period considered was 1 min and the momentary value of the signal was measured at a given interval. Pressure value measurements were performed with a portable electronic set to measure and record data. The pressure sensor used in the device was characterized by a measurement error of ±0.05%. The time step of pressure recording was equal to 1 s for the daytime period and 0.01 s for the night-time pressure reduction.
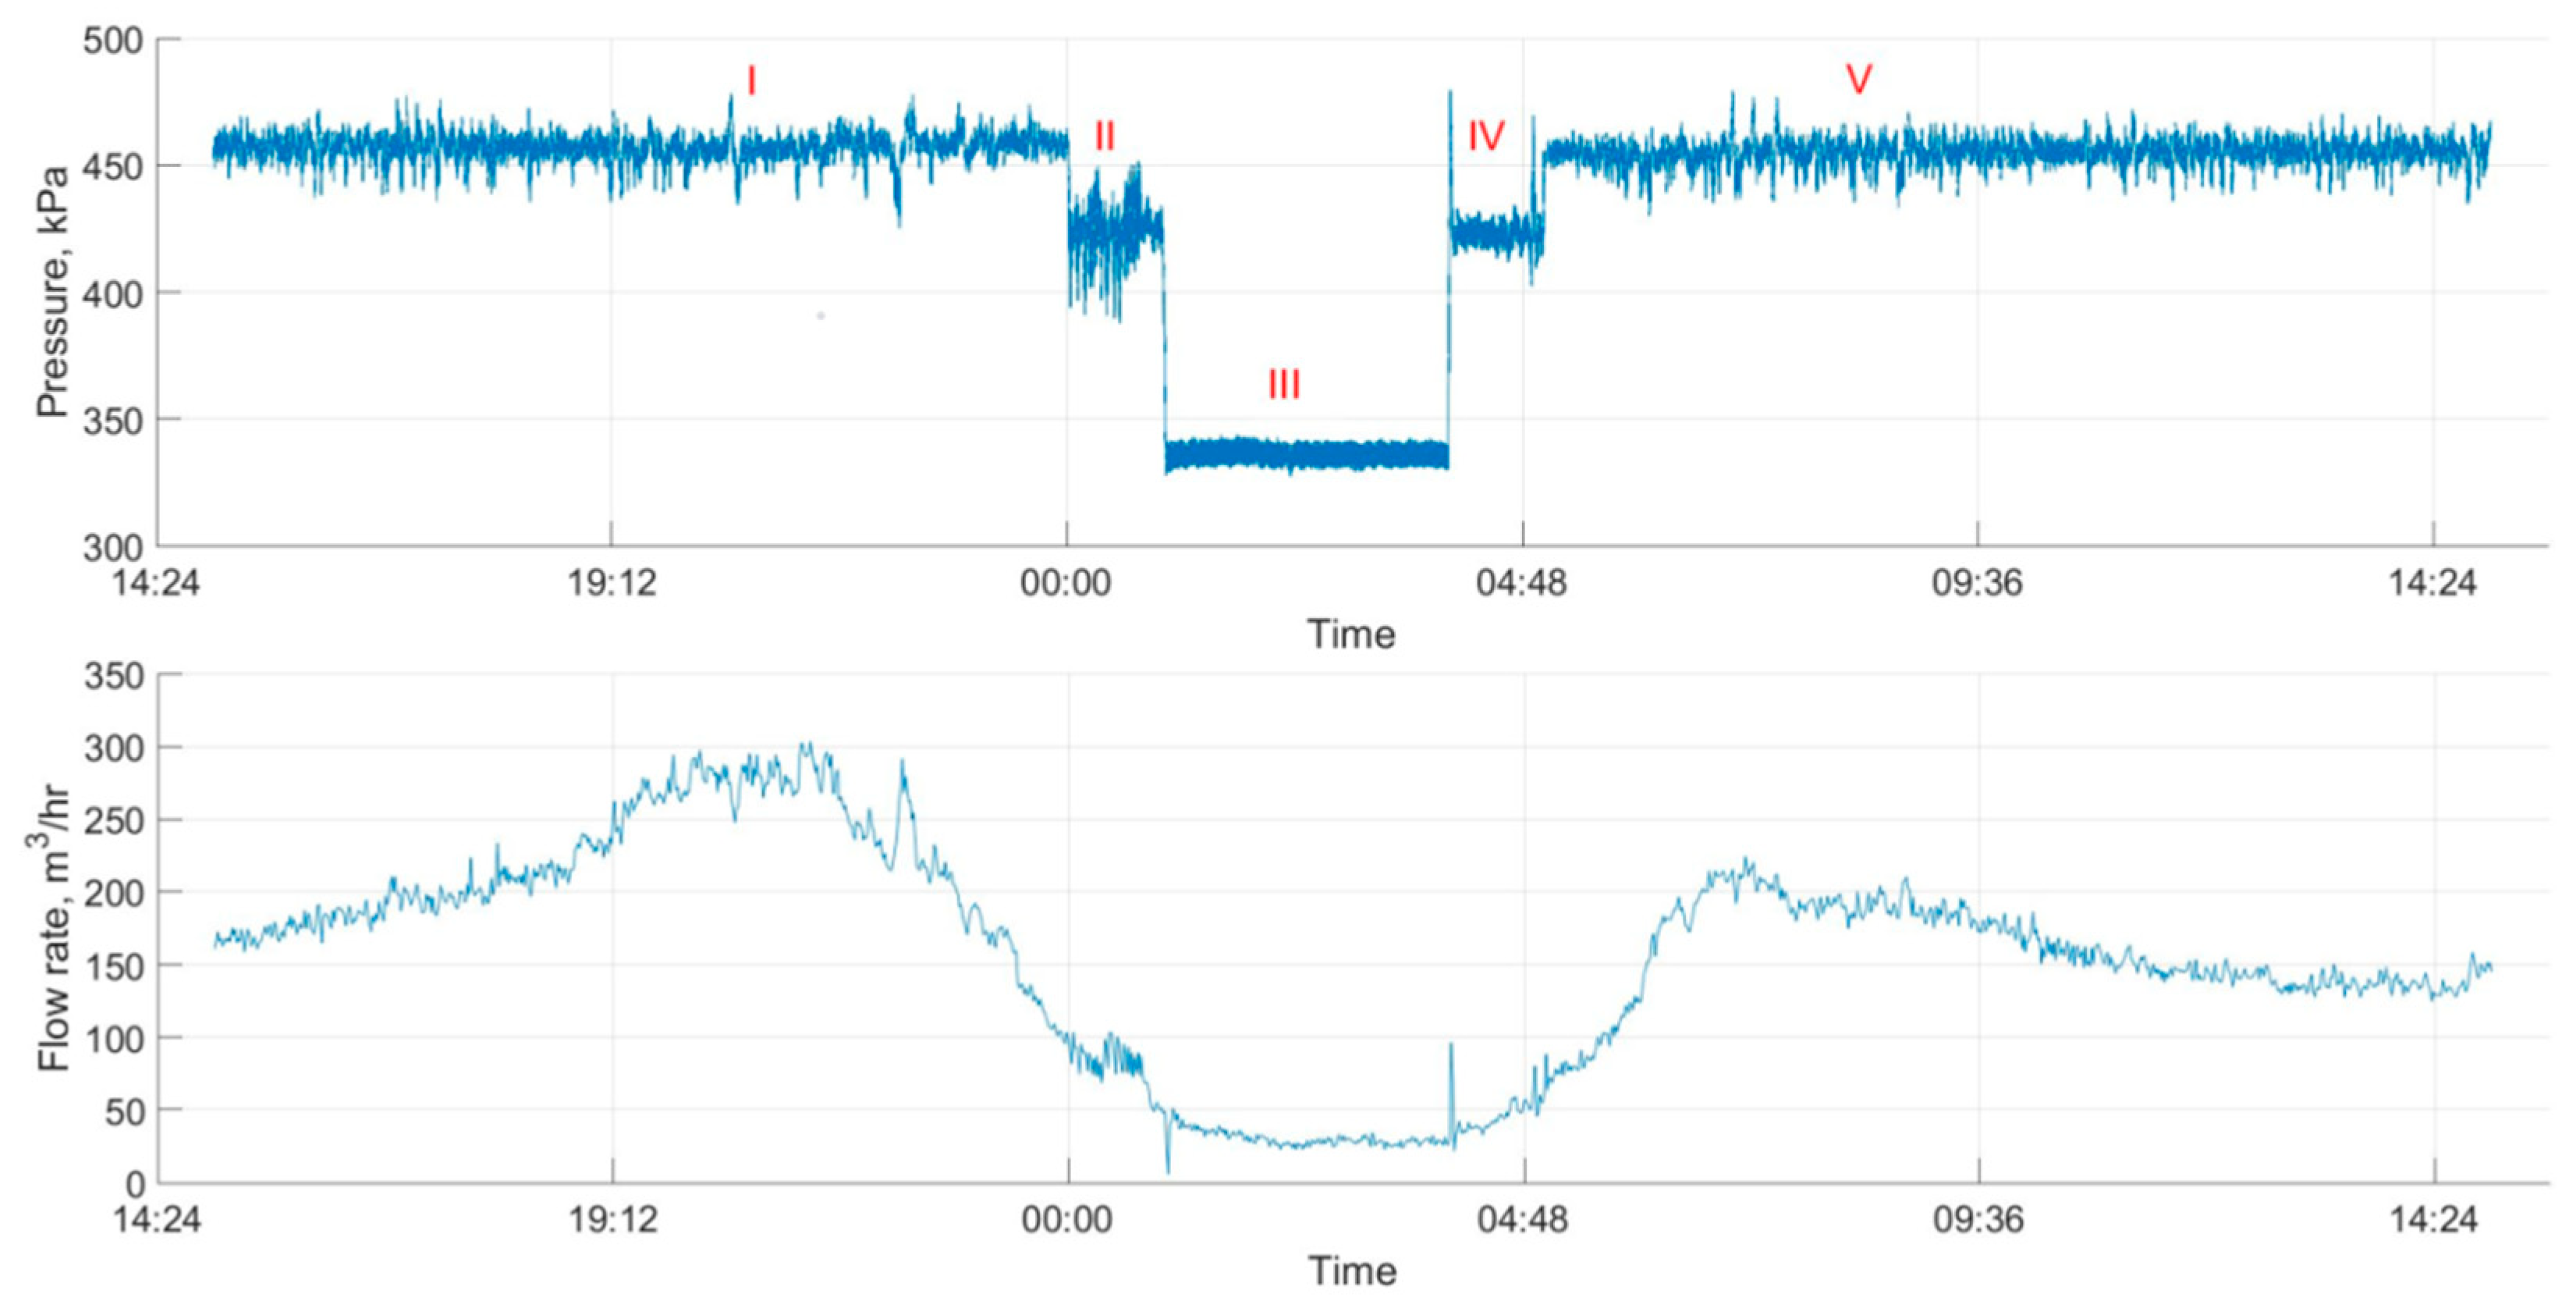
Figure 1 shows examples of pressure and flow rate changes at the pumping station located before the selected DMA. For this area, a FAVAD strategy was implemented to reduce the actual night-time water losses. The step-by-step pressure function forces a controlled change in the operating parameters of the water supply system in the DMA. It should be noted that the controlled pressure change is a deterministic action, as opposed to pressure changes caused by random factors during the traditional operation of water supply systems. After a sudden change in pressure, the observed changes in this parameter are the result of random factors connected with dynamic changes in water consumption by consumers. For the purposes of the research, a definition of a water supply day was introduced, calculated from 15:00 on the current day to 15:00 the following day. During the day, a constant pressure at the level of about 450 kPa (phases I and V) was maintained. From 00:00 to 05:00, the pressure was reduced by applying a two-stage pressure reduction from approximately 450 kPa to approximately 420 kPa (phase II) and then 340 kPa (phase III). The pressure was increased in the reverse order (phases IV and V in turn). The pressure changes between the individual phases lasted about 2 min. The duration of phases II and IV was 50 min, and phase III lasted 3 h and 50 min. The duration of 50 min for transition phases II and IV was caused by the necessity of avoiding too rapid pressure reductions and increases that could lead to water hammers, which, in turn, contribute to pipe failures. Phase III is a period of almost steady-state water supply operation conditions during the minimum night flow.
2.2. Modification of the FAVAD Method
The possibilities of the FAVAD method, in which the dependence of the magnitude of the leakage on the pressure is shown, was a prerequisite for undertaking the original tests. The original assumptions of the FAVAD method can be described as Equation (1):
where:
- L1
- leak flow rate at adjusted pressure P1, m3/h;
- L0
- initial leak flow rate at pressure P0, m3/h;
- P1
- adjusted average zone pressure at leak flow rate L1, Pa;
- P0
- initial average zone pressure at leak flow rate L0, Pa;
- α*
- leakage exponent, -.
The leakage exponent α*, which is usually calculated under laboratory conditions during steady-state water flows and with no water demand, is affected by the type of leakage, the size of the pipe crack, the material of which the pipeline is made, the flow conditions (laminar, turbulent) and the type of ground in which the pipe is placed. Leak areas vary with pressure depending on the pipe material’s behavior [26]. The purpose of the base approach is to present how the leakage volume changes for a given value of the empirical exponent due to failure during various pressure conditions. Methodological meaning was inverted in the research presented in the article. The aim was to calculate the empirical exponent based on a known flow rate and pressure. It has been shown that in the conditions of the actual water supply network, when the empirical exponent α differs from the laboratory values, it is necessary to monitor the leakage exponent parameter, which is additionally affected by the dynamic and random character of water consumption. Its calculation and analysis during the operation of a real water supply system becomes, therefore, a multi-faceted task, because not only the emergency status of the water supply network is taken into account, but also the operational status variability. In the presented research, an attempt was made to analyze the empirical exponent in the context of assessing the condition of a single pipe with known and invariable material and soil properties and variable operating status of the water supply (failure, holiday events, working days). Due to the labor needed and time-consuming nature of the chosen method in the future, its automation will allow to develop tests taking into account other pipes made of different materials and different locations of the DMA zones.
Within the framework of these tests, the original assumptions of the FAVAD method have been modified. In order to link the values of average flows with the average values of pressure, recorded in each of the five phases of the water supply day, an empirical relationship analogous to Equation (1) in the form of Equation (2) was proposed:
where:
- average flow rate in the k-th phase of the experiment, m3/s;
- average flow rate in the n-th phase of the experiment, m3/s;
- average pressure at k-th phase of the experiment, Pa;
- average pressure in the n-th phase of the experiment, Pa;
- empirical exponent binding the average values of pressure and average values of flow rate in the k and n phases of the experiment, -.
The final form of the empirical exponent between the different phases of the experiment was determined with Equation (3):
Equation (3) has no theoretical justification, but it allows to determine the empirical relationship between the data sets recorded in the time domain for each phase of the system’s operation. The calculation of exponent values is simple to analyze, so it can be implemented to detect the operating status of the water supply system, being a specific characteristic of a selected DMA, combining the parameters of flow rate, depending on the demand for water, and pressure.
2.3. Database
The database consists of 30 measurement events which were selected for analysis. They were recorded in the period from 26 April 2017 to 14 January 2018 (Table 1). Most of them were selected randomly, but the following public holidays were purposefully analyzed: 15 August 2017 (in Poland it is the church holiday of the Blessed Virgin Mary), 25–26 December 2017 (Christmas Day), 31 December 2017 to 1 January 2018 (New Year’s Eve) and holidays (weekends). During the measurement period, there was a serious failure of the water mains (7 May 2017), which resulted in the lack of water in many places in Wroclaw and, practically in the whole city, a reduced pressure in the network was observed. This event was also included in the input database. In Table 1, holidays are marked in blue, events analyzed in the context of an accident in red and weekends in green (Saturday–Sunday). Events on the 26–27 April 2017 and 5–6 May 2017 were analyzed with reference to the days preceding the failure occurring on 7 May 2017, while events from the 09–10 May 2017 were analyzed 24 h after the failure.
Each water supply day was divided, according to the chosen methodology, into five phases of the experiment (see Figure 1). This procedure was applied both to mean values of flow rate and pressure. Finally, 150 time series of pressure and 150 flow rates were obtained for the analyses, on the basis of which empirical coefficients were determined. for experimental phase relationships during pressure reduction: II–I (), III–I () and III–II () and also during its morning increase for phases: IV–III (), V–III () and V–IV ().
After the stage of determining the size of empirical exponents, machine learning was used to classify the operating states of the water supply network of a selected DMA on the basis of . Cluster Analysis (CA) with the use of hierarchical trees was used as a method of unsupervised learning. CA included grouping algorithms based on Euclidean distance measurement separately for the process of pressure reduction and increase. Euclidean distance is understood as a measure expressed in a straight line between measuring points located in a two-dimensional system of coordinates. It can be expressed by means of Equation (4):
where:
- x,y
- vectors of values of properties of compared objects in space;
- n
- number of variables.
STATISTICA 13.1 was used to perform cluster analysis. Supervised machine learning was implemented using the Classification Learner library of MATLAB R2019a. Calculations were made using automatic classification based on SVM, algorithm k-kNN (k-Nearest Neighbours), Quadratic Discriminant. Measuring events were divided into three categories: pre-failure and failure condition, working days as a reflection of typical conditions and non-working days, which included holidays and weekends (i.e., Saturday–Sunday). Within these groups, empirical exponents between experimental phases were analyzed: II–I, III–I, III–II, IV–III, V–III and V–IV. Receiver Operating Characteristic (ROC) curves and Area Under Curve (AUC) were used to assess the accuracy of classifiers. The percentage of proper matching in the three groups of water supply system states was determined on the basis of error matrix and positive matching rates for particular real and predictive classes, known in the literature under the acronym True Positive Rates (TPR), percentage of False Negative Rate (FNR), Positive Predictive Value (PPV) and percentage of False Discovery Rate (FDR).
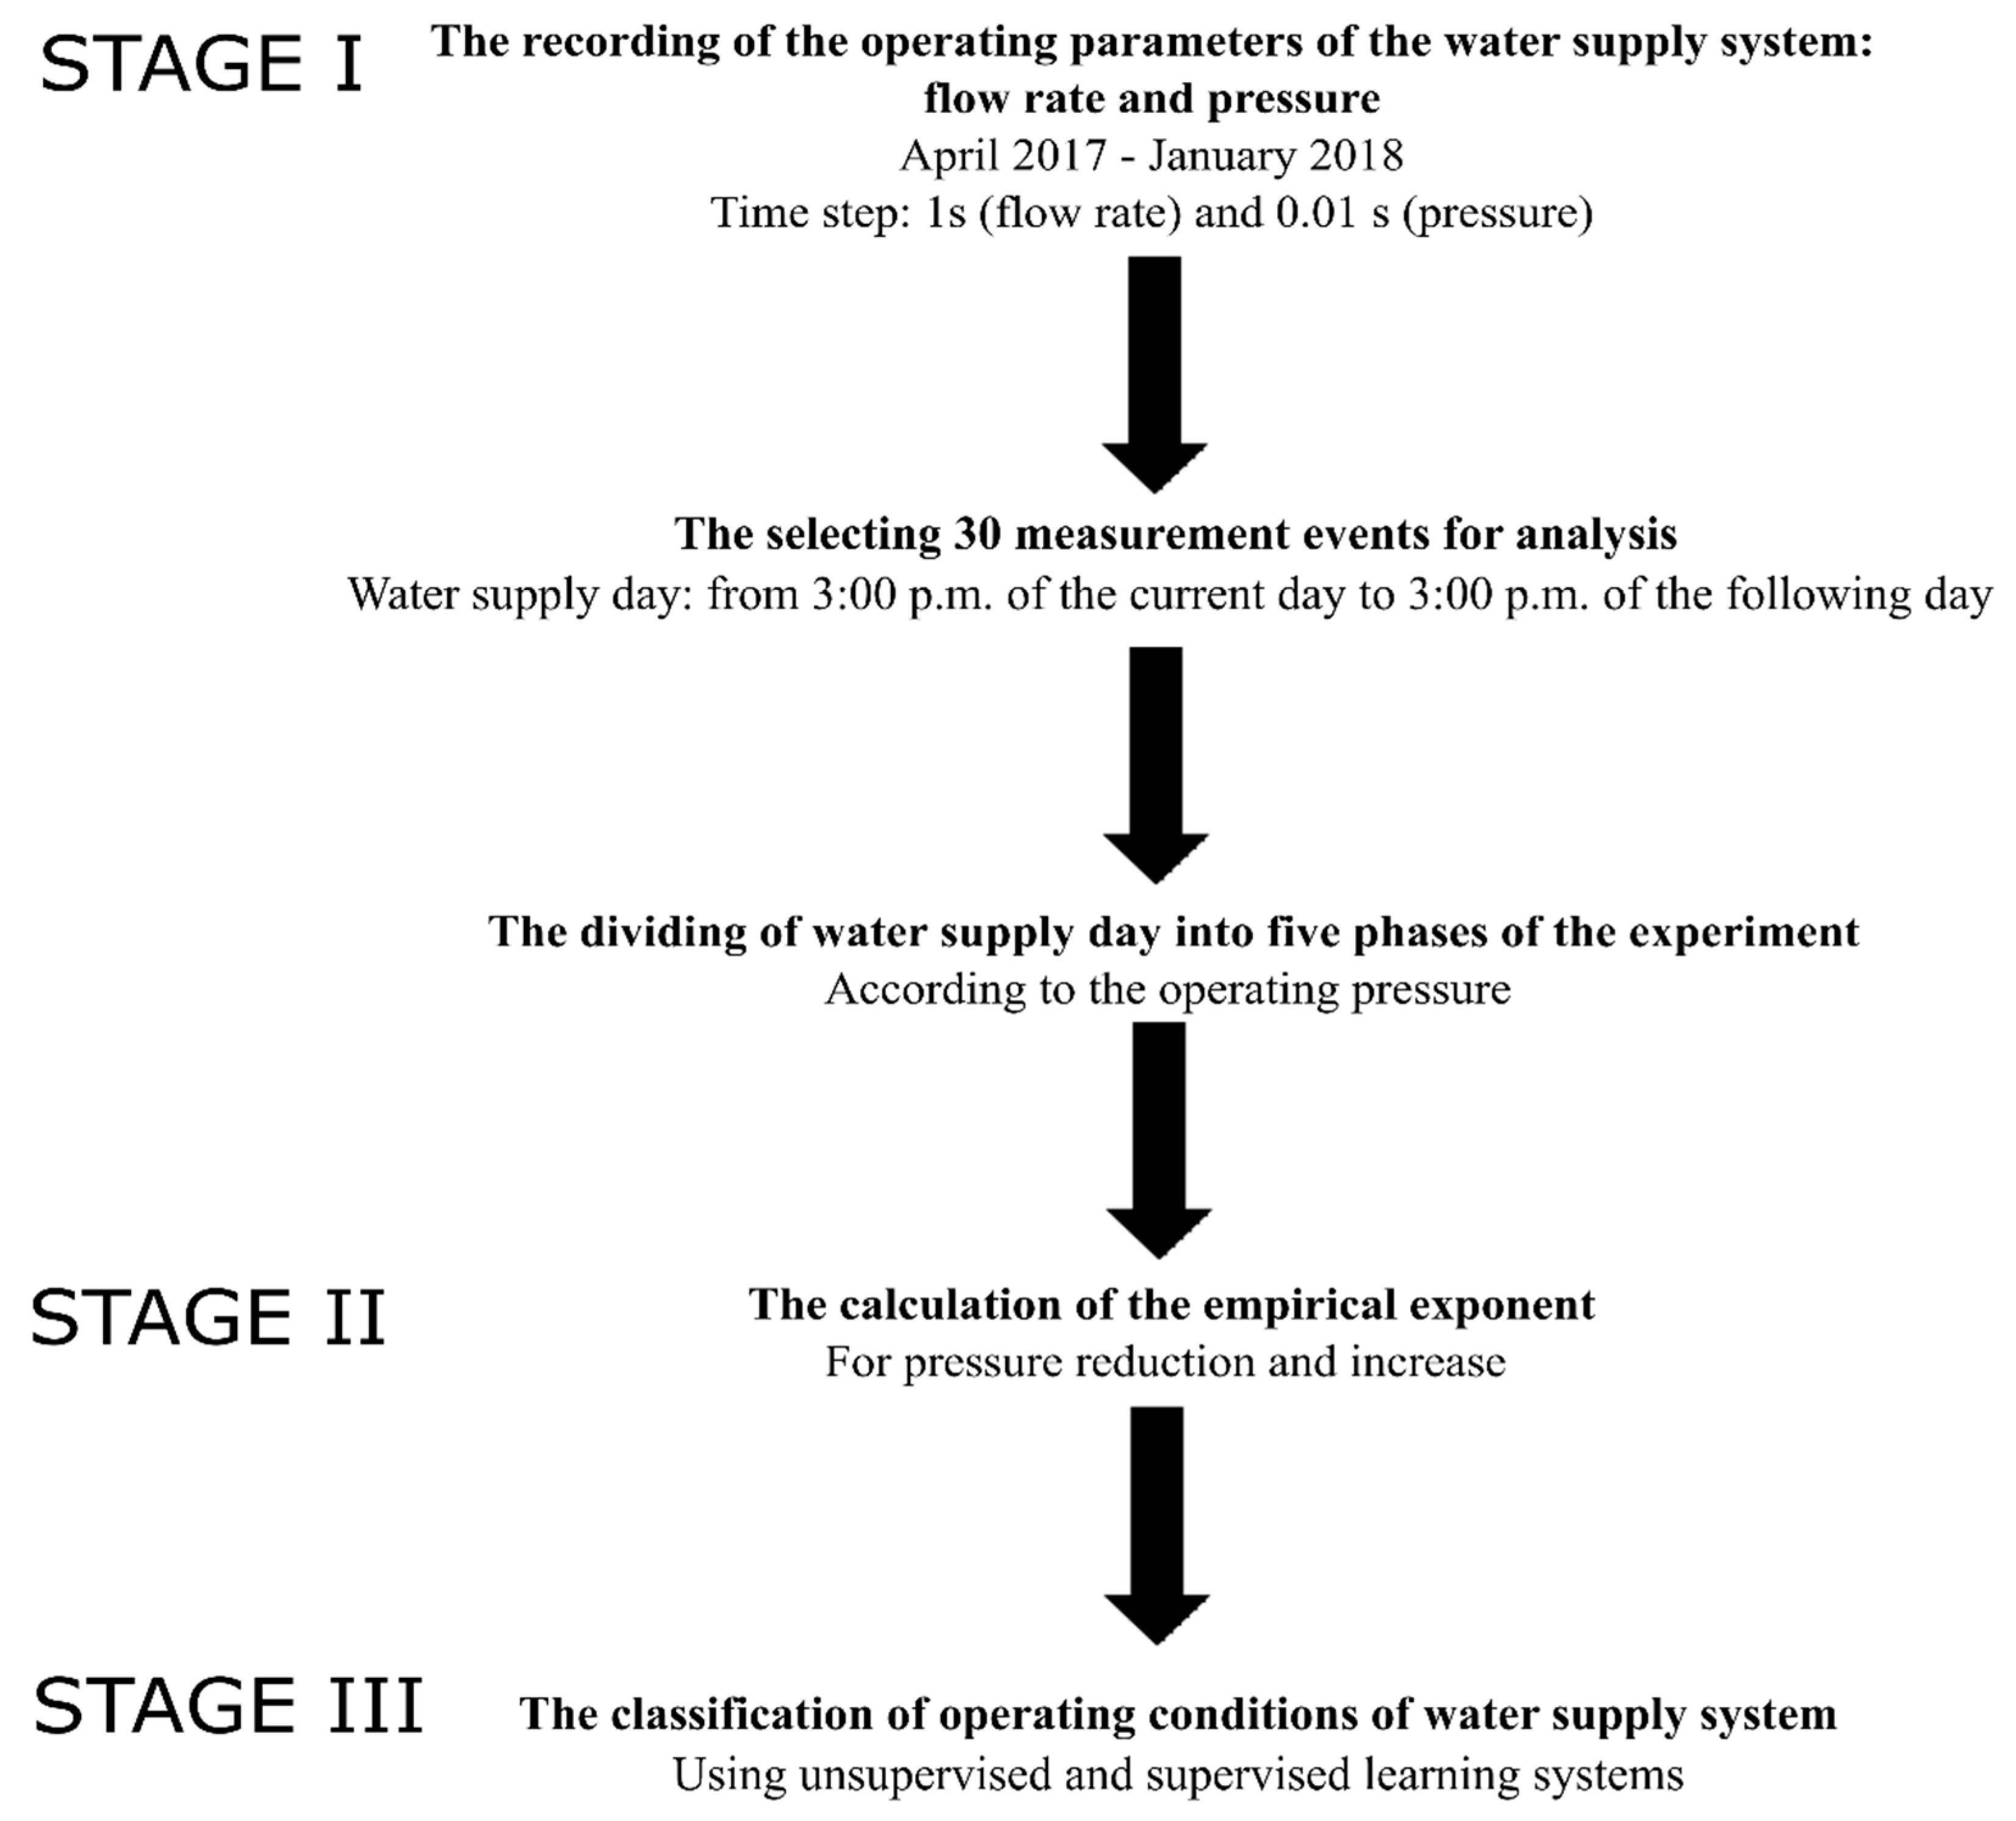
A schematic representation of the research stages is presented in Figure 2.
3. Results and Discussion.
3.1. Tests on the Value of Empirical Exponents for Pressure Reduction and Increase
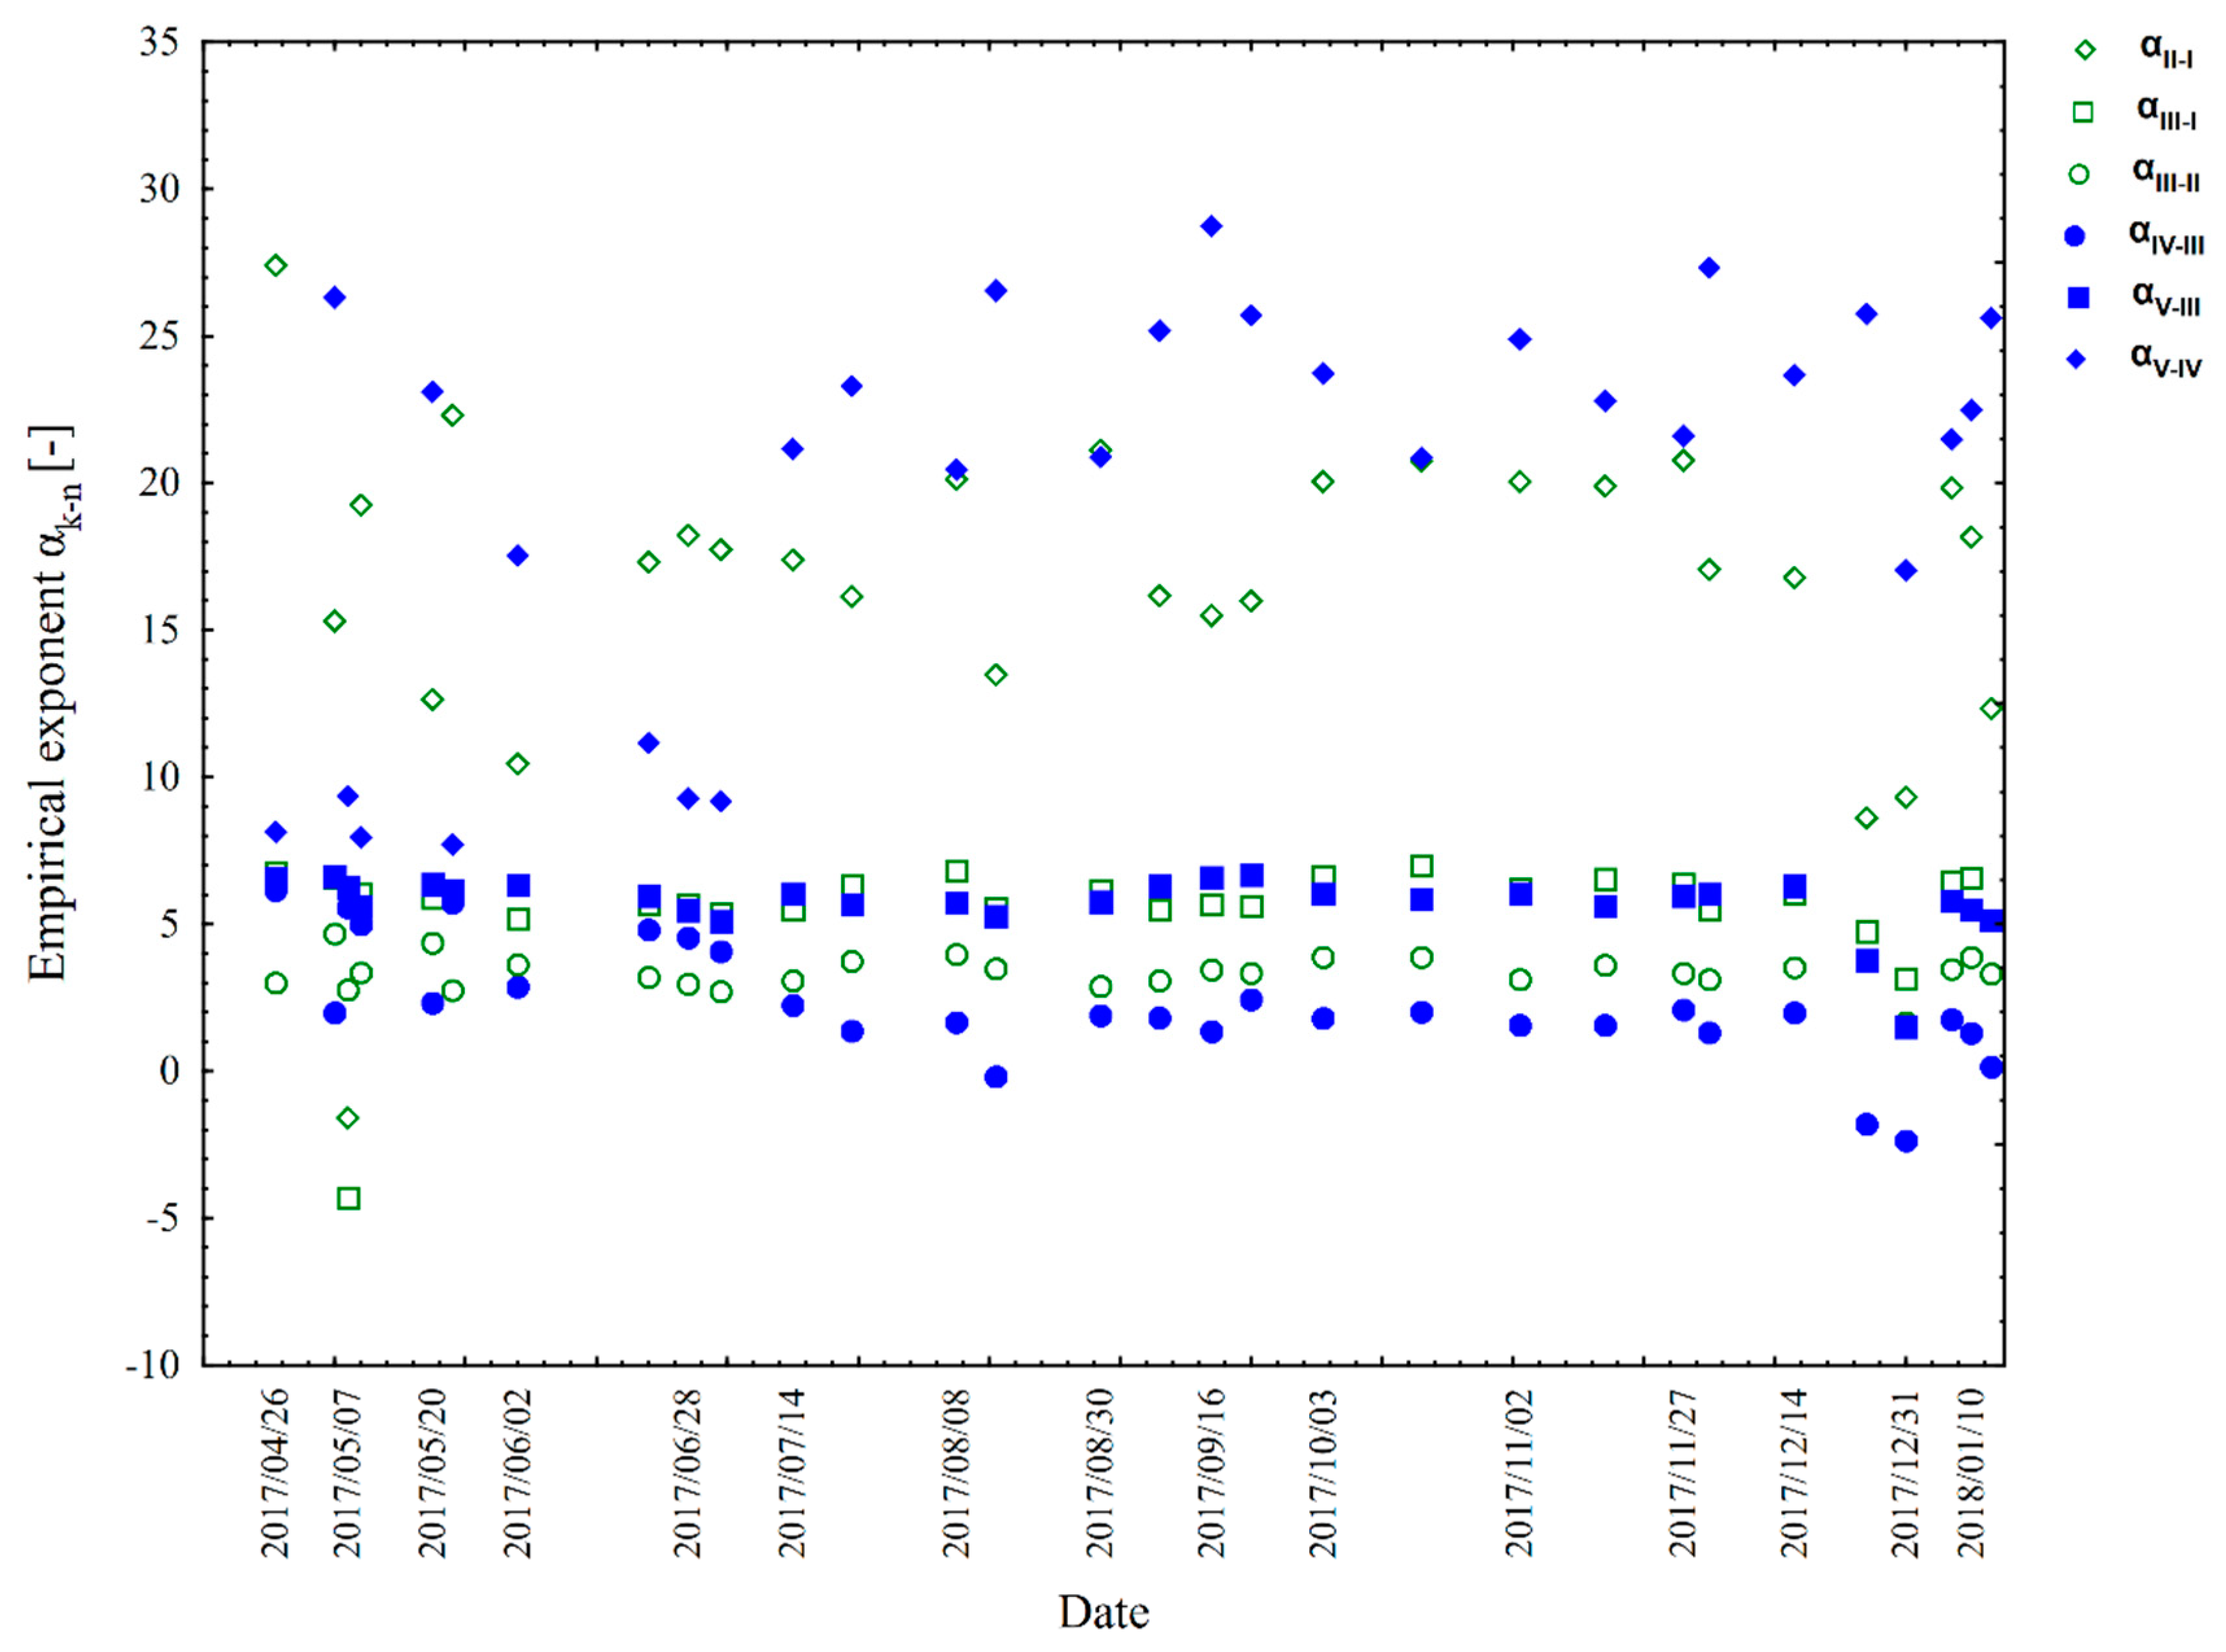
In accordance with the adopted methodology, the exponent sizes of were determined for the pressure reduction and pressure increase phases and the calculation results are shown in Figure 3 and in Table 2.
The values of exponents for the pressure reduction phase are shown in Figure 3 by green markers, while the growth is shown by blue markers. The dispersion of the value of rate indicates the existence of a close relationship between its size and the time of the water supply system day. It can be seen that the smallest values of the exponent during the reduction of pressure, network status parameters III and II, are achieved, i.e., when there are minimal night flows. The greatest fluctuations are observed between the second and the first stage, which is the result of the impact of the random nature of water consumption by system users.
Minimum extremes, which correspond to stage II–I and III–II during the emergency day, i.e., 07 May 2017, are noticeable. In addition, a smaller value of the exponent in relation to other measurement events for all relations was obtained also for the holidays 25 December 2017 and New Year’s Day. It was caused by a significant drop in household’s usage of water on these days, which generated lower flow rate values. Analogously to the analyses of the exponent in the variant of pressure reduction, its interpretation was made in the case of pressure increase for the phase relations IV–III, V–III and V–IV. The lowest achieved values of the rate were obtained for ratios of network state parameters for stages IV–III during the pressure increase. The highest were for the time corresponding to the maximum flow rates, i.e., V–IV levels, covering the morning water demand. For degrees IV–III and V–III, a clearly outstanding for 25 December 2017 and New Year was observed.
Table 2 shows holidays in blue, events analyzed in the context of a failure in red and weekends in green (Saturday–Sunday). The remaining events were analyzed in the context of typical states of operation of the water supply system. For the relations of degree II–I, the lowest value of the rate was observed during the failure: −1.59. It then became negative as a result of a drop in pressure and had an almost zero flow rate during an anomaly. A negative value was only calculated for the phase during which a failure took place, which results from the measured pressure values and flow rates between individual phases of the research. Moreover, the public holidays 15 August 2017, 25 December 2017 and New Year’s Day show values of the exponent lower than the average−13.48, 8.62 and 9.32 respectively. The biggest exponent, , was recorded on 26 April 2017, i.e., before the breakdown. It is likely that this day could have been the moment of leakage, which eventually caused a widespread failure on 07 May 2017.
Between the experiment stages III–I, i.e., the minimum night flow MNF and the stage satisfying the evening, maximum water demand, the lowest value of the exponent , results were also negative, recorded for the emergency 24 h as −4.30. On public holidays, is much smaller than its average value for the selected relationship of degrees of network state parameters. The highest value was achieved for the day 18 October 2017, which is a derivative of the recorded mean value of the flow rate. It remained at the level of 218.93 m3/h, whereas typically, for the first level, for all events the average for all events was 184.88 m3/h. It is not possible to unequivocally identify the cause of this state of affairs. Consultations with the network manager did not reveal any failures. This day is also a working day (Wednesday), which suggests the influence of anthropogenic behavior.
The lowest exponent values of are achieved between III–II degree of analyzed parameters. Exponent on average amounts to 3.36 therefore, in relation to the research conducted by Thornton and Lambert [27], it can be concluded that conditions in this period are close to those steady-state. Stage III falls temporarily between 00:00 and 04:00, although according to literature reports, more precise flow in water supply systems takes place between 02:00 and 04:00 [28]. The smallest exponent, , was obtained for the New Year′s Eve, i.e., 1.66. The largest (4.67) for the day preceding the failure, which suggests that its current analysis could lead to earlier detection of a failure and prevent the total destruction of the pipe. Equally, a high was noted for nights during weekends on 20–21 May 2017 (i.e., Saturday–Sunday) and during public holidays 15 August 2017 and 25–26 December 2017.
Between phases of experiment IV and III, in which the MNF are contained, the smallest value of the exponent negative, was recorded for the New Year’s water supply day: −2.38. Negative exponents were also obtained in the case of the holiday of 25 December 2017 and 15 August 2017. Its greatest value was achieved for the water supply day 26 April 2017, analyzed in the context of the breakdown of the preceding day and the day on which it occurred. The mean value of the exponent for relations IV–III degree is 2.23, which corresponds to its limits set by Thornton and Lambert [27]. It can therefore be concluded that the conditions most relevant to those steady-state are between stage IV and stage III.
For the relations of degree V–III, the lowest rate was observed during the New Year’s Eve: 1.50, which is almost four times lower than the average. In addition, the public holiday 25 December 2017 also shows value lower than mean: 3.77. The highest exponent was recorded during the weekend 22 September 2017—6.68—and the day of failure—6.25. An equally high value of , exceeding the mean value for V–III, was recorded for 15 August 2017.
The highest values of the exponent are achieved between V and IV degrees of the analyzed parameters. At this stage of pressure changes, the value of on average amounts to 19.97. The lowest exponent was recorded for the day after the failure, i.e., 9 May 2017 and 23 May 2017 and it was 7.96 and 7.71 respectively. The largest exponent amounting to 28.76 was set for weekend days (16 September 2017 and 1 December 2017) and equally high for public holidays 15 August 2017 (26.55) and 25 December 2017 (25.75).
Initial analysis of demonstrates its close relationship with the state of operation of the water supply system, understood both in technical and operational terms. The dependence on the fact that the exploitation condition is to the greatest extent caused by sociodemographic factors, resulting in irregularity and randomness of water consumption becomes clearly visible. The results of the research confirm the assumptions that the values of the exponents depend to the greatest extent on the random nature of water consumption by consumers on the measuring day, thus reaching the lowest values during the minimum night flow periods. Due to the fact that the obtained test results are difficult to interpret as a point cloud, in the next stage of the study, the following systems of supervised and unsupervised learning were implemented.
3.2. Classification of Operating Conditions of the Water Supply System with the Use of Unsupervised Learning
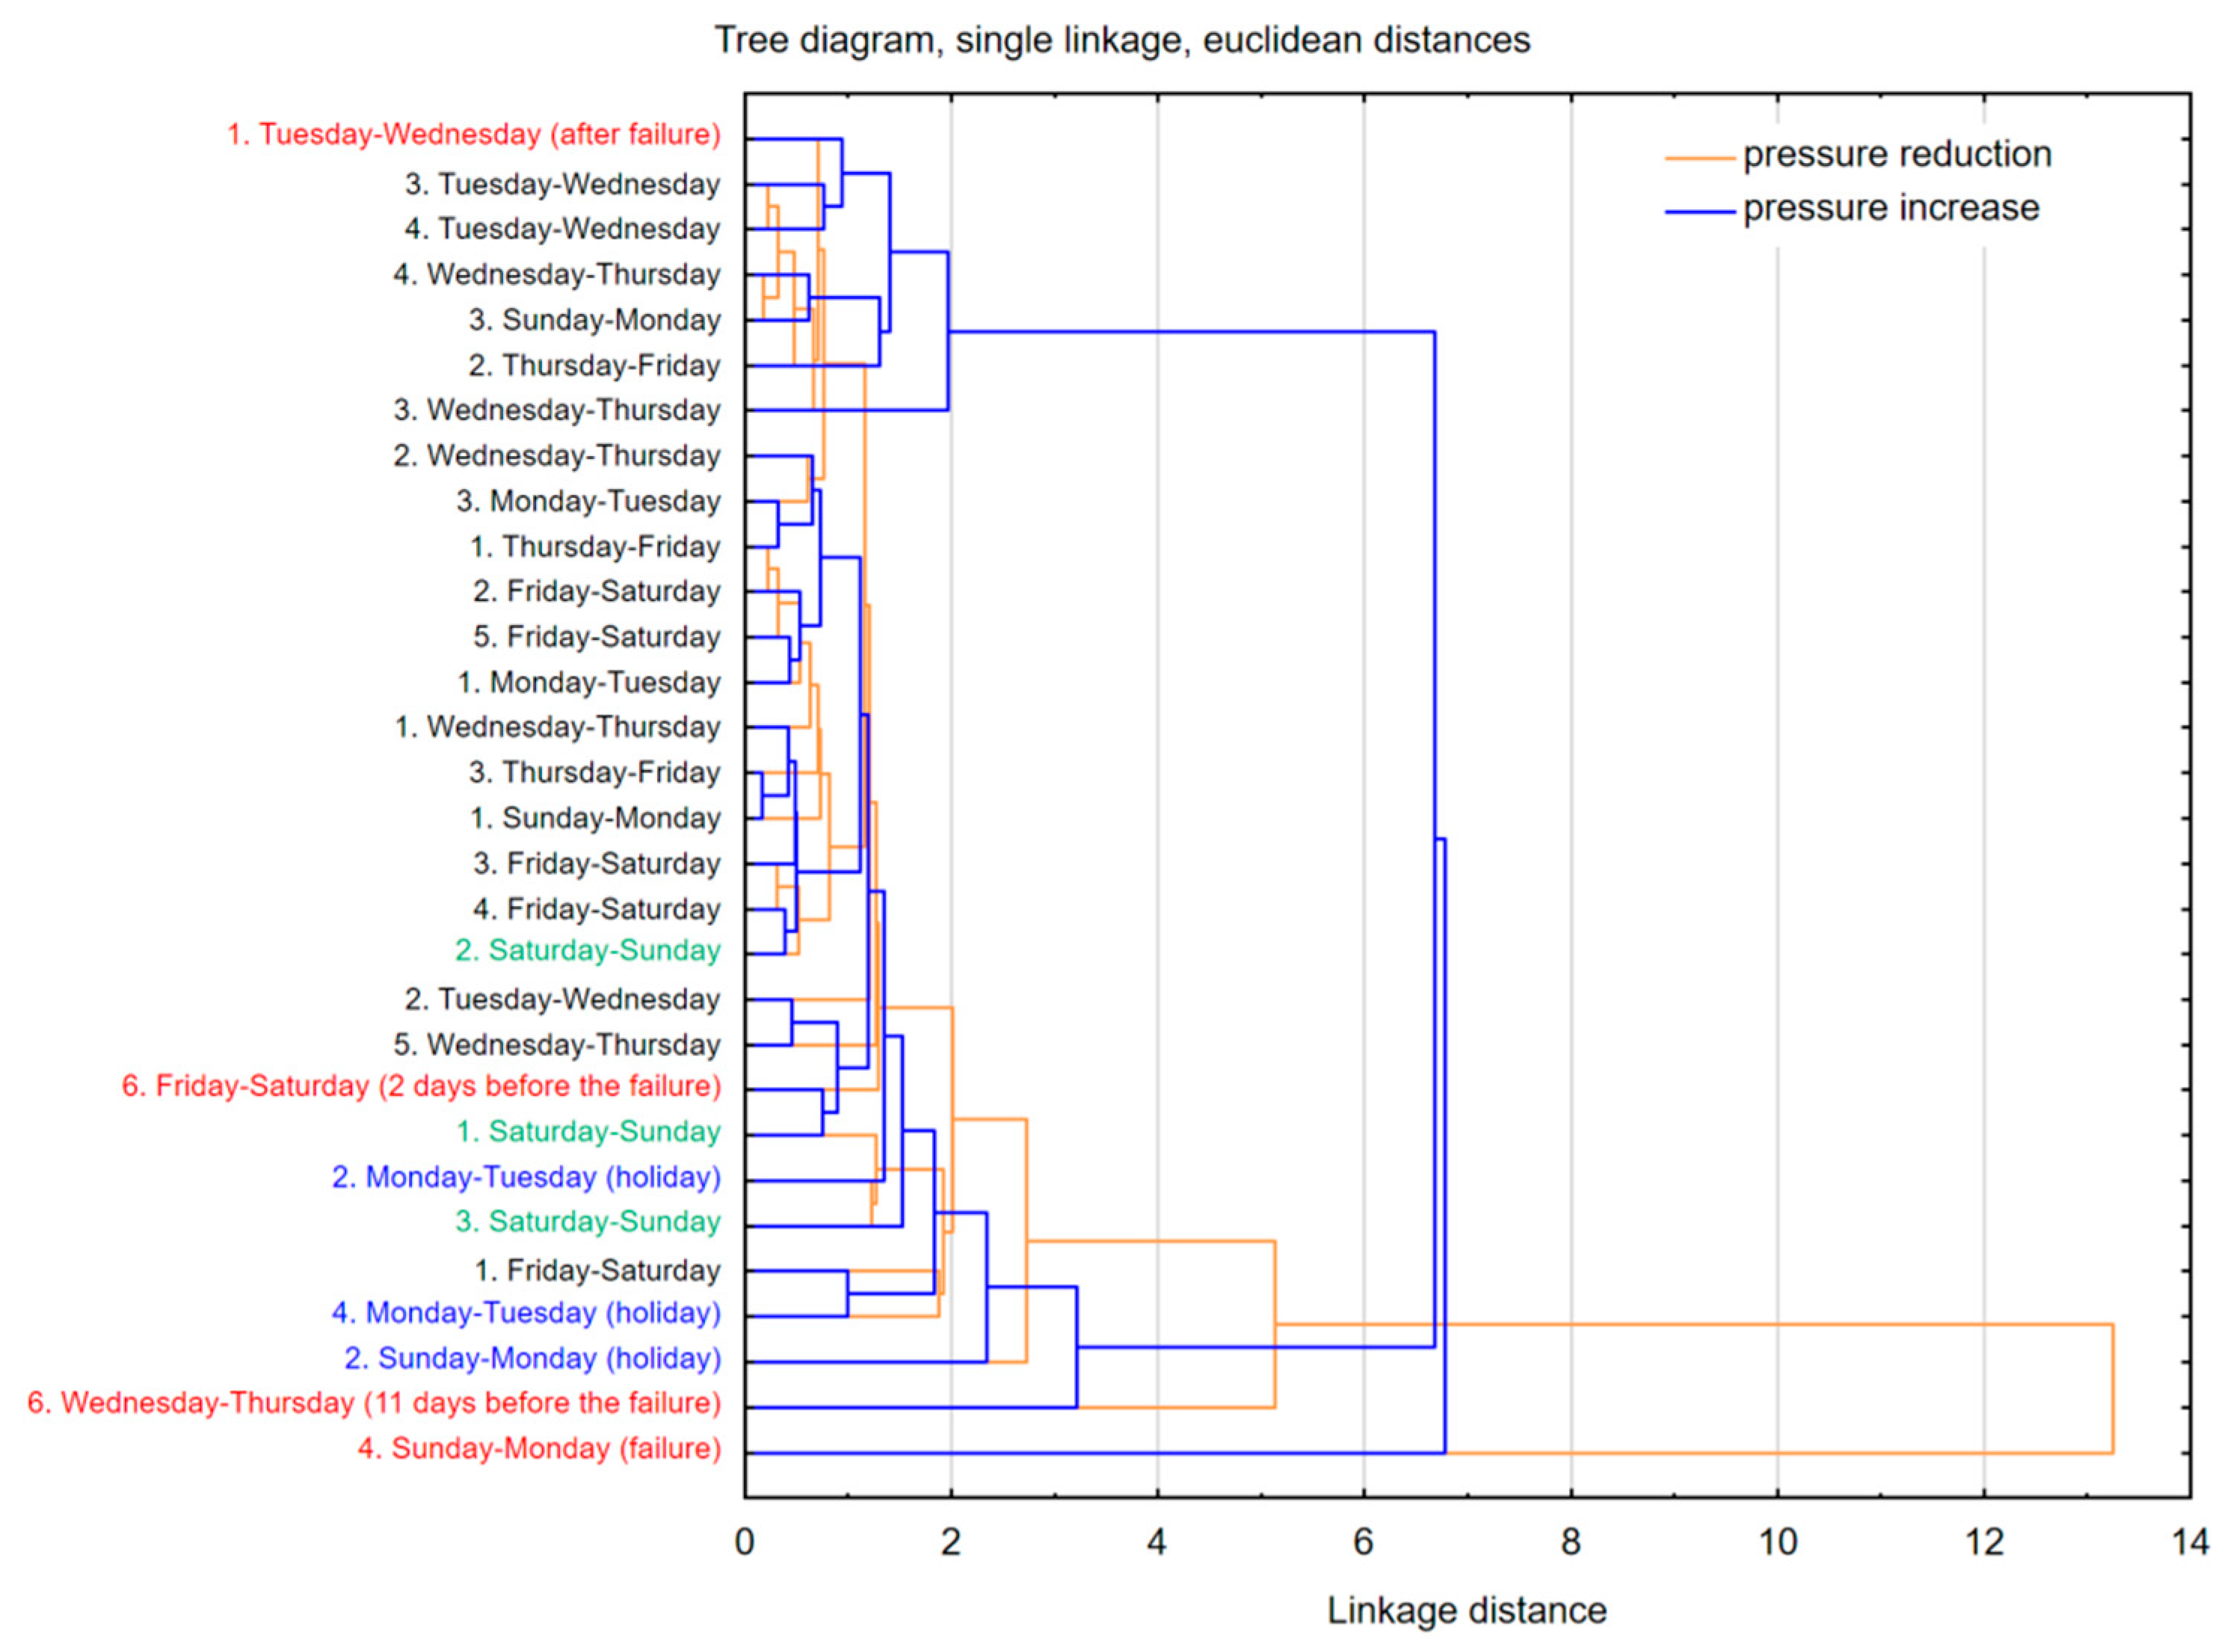
The analysis of the determined values of exponents used cluster analysis with hierarchical trees. Figure 4 shows the dendrograms for the phase of pressure reduction and increase.
Both dendrograms show that the values of the exponents are associated with the day of the week, holidays and their value is also affected by failure conditions. Better diagnostic properties of failure states result from the analysis of values of exponents for the pressure reduction phase, because in this case, greater Euclidean distances were obtained. In addition, the days off from work constitute clusters with the largest Euclidean distances, especially for the pressure reduction process. This suggests that more different habits in the use of tap water are observed as part of the evening consumption than in the morning.
The analytical work carried out showed that it is advisable to continue the research on the multistage change of pressures during the night and to determine the values of exponents , that provide information on the operating statuses of DMAs. It is also important to note that in the phase of pressure reduction, the values of exponents allow to identify more accurately non-typical operating states in DMA compared to the pressure rise phase.
The operator of the water supply network, at the signaling of unusual conditions during the reduction of pressure in the night hours, has the possibility to make a detailed analysis of the results obtained. From the observations of the Wroclaw water supply system, it appears that the failure usually occurs during the pressure increase and the maximum daily demand. The information collected during the pressure reduction phase is pre-emptive in relation to the period of failure occurrence, which is of great diagnostic value.
3.3. Classification of Operating Conditions of a Water Supply System Using Supervised Learning Systems
A set of obtained results in the form of empirical exponents was divided into three categories of events: pre-failure and failure status, working days and non-working days (holidays). The classification with the use of learning methods under supervision was conducted for all six relationships between the various phases of the experiment (II–I, III–I, III–II, IV–III, V–III, V–IV).
Table 3 presents the results of the classification carried out using the designated exponents for the three classification methods for which the best match results were obtained for each data set.
The best classifier match (90.0%) was obtained for the II–I phase relation of the experiment by Quadratic Discriminant and Naive Bayes Classifier during the pressure reduction process. At minimal night-time MNF flows, the accuracy percentage was 73.3% for Quadratic Discriminant analysis. This means that the best effects of diagnosing the state of the water supply system are obtained by analyzing the values of the exponents and during pressure lowering, which are simultaneously determined for the phases with the highest water demand. The accuracy of 83.3% was obtained for the phase IV–III relation between the minimum night flow and the morning pressure increase for . The lowest classifier value (70.0%) was determined for .
The percentage of proper match in the three groups of states of operation of the water supply system was determined on the basis of an error matrix. Table 4 shows the values of positive match rates for each real and predictive class, known in the literature under the acronym TPR. Events from the working day group were best matched. For almost all phases and their exponents, 100% match to the appropriate category of condition of the water supply system was obtained. Within the public holidays class, the best classification value of 83% was obtained for degrees II–I during pressure reduction and IV–III during pressure increase (67%). The lowest match quality, i.e., only 17%, was obtained for the group of non-working days for phase relations during minimum night flows. Breakdowns and pre-failure states were correctly categorized in 67% for phase II–I pressure reduction.
Since the best accuracy of the classification process was obtained on the basis of an empirical exponent , which is responsible for the experimental phases concerning the evening use of the water supply system by users, further on, error matrices for the results obtained through Quadratic Discriminant analyses were prepared. Figure 5a contains the percentage of correct positive predictions of the aforementioned TPR, also known in the literature as sensitivity. The results are the same as in Table 3. Moreover, the percentage of incorrect FNR was determined. It can be noted that within the actual class for holidays, 17% of events were incorrectly predicted to be working days events. In the actual class of failure and pre-failure events, 33% of events were incorrectly classified as working days. Within the true class of working days, only 5% of events were incorrectly predicted to the group characteristic for non-working days. Therefore, it can be concluded that the easiest time to distinguish between the states of water supply system operation is during working days and holidays, while the most difficult is to distinguish pre- and failure states from working days.
Positive Predictive Value (PPV) and False Discovery Rate (FDR) are shown in Figure 5b. PPV is an indicator of the predictive quality of a test and is also called precision. Within the group of days off work, 83% of positive predictions are confirmed with the actual state of affairs, within the group of failure and pre-failure conditions this percentage is 100%, while within the group of working days, 91% of positive predictions are confirmed.
Due to the fact that the process of classification of the states of operation of the water supply system was most successful for empirical exponents , the accuracy of classifiers was evaluated using ROC curves. The vertical axis of the ROC curve, which describes the values of the TPR match factor, is called the “sensitivity” axis, while the horizontal axis determines the frequency of false alarms of FPR and is called the “specificity”. The classification requires the determination of the optimal cut-off point of the ROC curve, which indicates the balance between the sensitivity parameter and the specificity of the classifier. The most optimal cut-off point coordinates are values equal to 0 for specificity and 1 for sensitivity, i.e., coordinates (0,1) [29,30]. A very important parameter in classifier accuracy assessment is the area under the ROC curve, the so called area under ROC curve. The closer the AUC is to 1, the better is the matching accuracy of the classifier. It is assumed that the AUC in the range 0.9–1.0 is of very good may quality, 0.8–0.9 is good and 0.7–0.8 is sufficient.
Figure 6 shows the ROC curves for the three accepted groups of water supply system statuses: failure and pre-failure (Figure 6a), working days (Figure 6b) and holidays (Figure 6c). In terms of the surface area parameter under the AUC diagram, the best classification quality was obtained for the group of events containing failure and pre-failure conditions (AUC = 0.95), which indicates a very good matching quality. Subsequently, a good match was obtained for the working day class (AUC = 0.94) and non-working day class (AUC = 0.92). All ROC curves indicate a very good quality of matching the classification model using Quadratic Discriminant.
The conducted research on classification of operating conditions of water supply systems using supervised learning methods showed that the best accuracy of classifiers was obtained using Quadratic Discriminant. The best classification quality of failure and pre-failure conditions was obtained for empirical exponents of phase II–I of the experiment. The best matching results were obtained for working days (95–100%). This is of particular importance for the implementation of machine learning procedures for data from exploited water supply systems. Each situation for which the measurement results differ from the generated classifier for individual days can be qualified as an abnormal state of operation of the water distribution system and should be subject to detailed analysis by the operator supervising the water supply system.
4. Conclusions
Water losses resulting from uncontrolled and undetected emergency leakages are important problems during the operation and management of a water supply system, as is the need to diagnose them. None of the methods used so far to detect the state of operation of the water supply system is universal. They have numerous advantages and disadvantages, and are differentiated in terms of implementation costs, speed of anomaly detection and the possibility of their classification. The process of assessing the condition of the water supply system should be divided into two main parts. The first consists of a global diagnosis by means of software solutions which analyze the parameters of the working condition recorded within the monitoring framework. The indirect solution (software) has been devoted to this research. Issues related to the indirect detection of the condition of the water supply system are a new field which is undergoing continuous scientific and technological development. Only after the software diagnosis should the detailed detection of causes and/or place of anomalies be implemented by use of precise tools and hardware.
In this article, to assess the state of the operation of the water supply system, the empirical exponent was used based on an analogy to the Fixed and Variable Area Discharges (FAVAD) approach in a modified form. In the research so far, e.g., Thornton and Lambert [27], the FAVAD method was used in order to calculate the volume of uncontrolled water leakages caused by failures in variable pressure. The new approach presented in the paper considers the determination of the exponent binding the flow rate–pressure relationship to assess the condition of the water supply network, which is an analytical problem that has not been addressed so far. The research was conducted into a real water supply network with a dynamic water flow and consumption, which constitutes a multi-faceted task compared to analyses performed under laboratory conditions.
The study was carried out in the Wroclaw DMA of reduced night-time pressure. Based on the results of studies and analytical work, it can be concluded that the introduction of controlled, cascading pressure reduction before the period of minimum night flow and cascading pressure increase before the morning increase of water demand allows to implement new analytical procedures for the analysis of time series of pressure and flow rate. Based on these procedures, it is possible to qualify the operating statuses of the water supply system in the DMA. Analysis of empirical exponents can, according to the original assumption of the FAVAD, be used to assess the operating conditions in separate DMAs of the actual water supply system. Changes in empirical exponents bring important information for diagnosing the operating states of water supply systems due to the fact that this value is a binding parameter of pressure and flow rate, depending on the deterministic random character of water consumption. Supervised and unsupervised learning systems were used in the research. The use of these tools made it possible to classify the operating statuses of the water supply systems with an accuracy of 90%. Despite the fact that neural network, naïve Bayes classifier [31] and decision tree [23] methods are used for the detection of working conditions of water supply networks, machine learning methods, based on the empirical factor that can be considered a base for real-time monitoring in the future, have not been used. The research results may significantly contribute to diagnosing operating conditions of water supply networks and may constitute one of the tools supporting the assessment of water supply network conditions in water supply companies.
It is necessary to implement new technical solutions and procedures, enabling the recording and analysis of the empirical exponent . It is advisable to conduct further research, because increasing the number of recorded events on water supply systems will allow to develop algorithms necessary to implement the classification of operating conditions of water supply systems and to develop consulting systems, using methods of machine learning with supervision and without supervision.
Author Contributions
All authors have contributed substantially to this work, as specified below: J.S., E.B.-A. conceived, designed and wrote the manuscript; J.S. performed the calculations and contributed materials; All authors read and approved the final version of the manuscript.
Funding
This research was supported by financial resources from the statutory activity of the Institute of Environmental Engineering at Wroclaw University of Environmental and Life Sciences.
Acknowledgments
The authors are grateful to Municipal Water and Sewage Company S.A. in Wroclaw (Poland) for providing valuable data and aid which was necessary to carry out research. We wish to thank Professor Janusz Łomotowski for his consultation, valuable comments and tips.
Conflicts of Interest
The authors declare no conflict of interest.
References
- Kowalski, D.; Kowalska, B.; Bławucki, T.; Suchorab, P.; Gaska, K. Impact Assessment of Distribution Network Layout on the Reliability of Water Delivery. Water 2019, 11, 480. [Google Scholar] [CrossRef]
- Barton, N.A.; Farewell, T.S.; Hallett, S.H.; Acland, T.F. Improving pipe failure predictions: Factors effecting pipe failure in drinking water networks. Water Res. 2019, 114926. [Google Scholar] [CrossRef]
- Lousada, S.A.N. Hydraulics: Theory—Volume I; Universidade da Madeira: Funchal, Portugal, 2018; p. 348. ISBN 978-989-8805-48-5. [Google Scholar]
- Kowalski, D.; Miszta-Kruk, K. Failure of water supply networks in selected Polish towns based on the field reliability tests. Eng. Fail. Anal. 2013, 35, 736–742. [Google Scholar] [CrossRef]
- Rezai, A.; Keshavarzi, P.; Moravej, Z. Key management issue in SCADA networks: A review. Eng. Sci. Technol. Int. J. 2017, 20, 354–363. [Google Scholar] [CrossRef]
- Bolzon, G.; Talassi, M. Toward a non-destructive diagnostic analysis tool of exercises pipelines: Models and experiences. Procedia Struct. Integr. 2018, 13, 648–651. [Google Scholar] [CrossRef]
- Patton, R.J.; Frank, P.M.; Clark, R.N. Issues of Fault Diagnosis for Dynamic Systems; Springer Science & Business Media: Berlin, Germany, 2013; ISBN 1-4471-3644-6. [Google Scholar]
- Heracleous, C.; Miciolino, E.E.; Setola, R.; Pascucci, F.; Eliades, D.G.; Ellinas, G.; Panayiotou, C.G.; Polycarpou, M.M. Critical Infrastructure Online Fault Detection: Application in Water Supply Systems. In Proceedings of the 9th International Conference on Critical Information Infrastructures Security, CRITIS 2014, Limassol, Cyprus, 13–15 October 2014; pp. 94–106. [Google Scholar]
- Fellini, S.; Vesipa, R.; Boano, F.; Ridolfi, L. Real-time measurement fault detection and remote-control in a mountain water supply system. EPiC Ser. Eng. 2018, 3, 698–705. [Google Scholar]
- Fayaz, M.; Ahmad, S.; Hang, L.; Kim, D. Water Supply Pipeline Risk Index Assessment Based on Cohesive Hierarchical Fuzzy Inference System. Processes 2019, 7, 182. [Google Scholar] [CrossRef]
- Datta, S.; Sarkar, S. A review on different pipeline fault detection methods. J. Loss Prevent Proc. Ind. 2016, 41, 97–106. [Google Scholar] [CrossRef]
- Latchoomun, L.; King, R.A.; Busawon, K. A new approach to model development of water distribution networks with high leakage and burst rates. Procedia Eng. 2015, 119, 690–699. [Google Scholar] [CrossRef]
- Ociepa, E.; Mrowiec, M.; Deska, I. Analysis of Water Losses and Assessment of Initiatives Aimed at their Reduction in Selected Water Supply Systems. Water 2019, 11, 1037. [Google Scholar] [CrossRef]
- Silva, M.A.; Amado, C.; Loureiro, D. Propagation of uncertainty in the water balance calculation in urban water supply systems—A new approach based on high-density regions. Measurement 2018, 126, 356–368. [Google Scholar] [CrossRef]
- Zyoud, S.H.; Kaufmann, L.G.; Shaheen, H.; Samhan, S.; Fuchs-Hanusch, D. A framework for water loss management in developing countries under fuzzy environment: Integration of Fuzzy AHP with Fuzzy TOPSIS. Expert Syst. Appl. 2016, 61, 86–105. [Google Scholar] [CrossRef]
- Patelis, M.; Kanakoudis, V.; Gonelas, K. Pressure management and energy recovery capabilities using PATs. Procedia Eng. 2016, 162, 503–510. [Google Scholar] [CrossRef]
- Lambert, A.O. International report: Water losses management and techniques. Water Sci. Technol. Water Supply 2002, 2, 1–20. [Google Scholar] [CrossRef]
- Puust, R.; Kapelan, Z.; Savic, D.; Koppel, T. A review of methods for leakage management in pipe networks. Urban Water J. 2010, 7, 25–45. [Google Scholar] [CrossRef]
- Ostapkowicz, P. Leak detection in liquid transmission pipelines using simplified pressure analysis techniques employing a minimum of standard and non-standard measuring devices. Eng. Struct. 2016, 113, 194–205. [Google Scholar] [CrossRef]
- Zhang, T.; Tan, Y.; Zhang, X.; Zhao, J. A Novel Hybrid Technique for Leak Detection and Location in Straight Pipelines. J. Loss Prevent Proc. Ind. 2015, 35, 157–168. [Google Scholar] [CrossRef]
- Rashid, S.; Akram, U.; Khan, S.A. WML: Wireless Sensor Network Based Machine Learning for Leakage Detection and Size Estimation. Procedia Comp. Sci. 2015, 63, 171–176. [Google Scholar] [CrossRef]
- Li, S.; Song, Y.; Zhou, G. Leak detection of water distribution pipeline subject to failure of socket joint based on acoustic emission and pattern recognition. Measurement 2018, 115, 39–44. [Google Scholar] [CrossRef]
- Winkler, D.; Haltmeier, M.; Kleidorfer, M.; Rauch, W.; Tscheikner-Gratl, F. Pipe Failure Modelling for Water Distribution Networks Using Boosted Decision Trees. Struct. Infrastruct. Eng. 2018, 14, 1402–1411. [Google Scholar] [CrossRef]
- Knobloch, A.; Guth, N.; Klingel, P. Automated Water Balance Calculation for Water Distribution Systems. Procedia Eng. 2014, 89, 428–436. [Google Scholar] [CrossRef]
- Colombo, A.F.; Lee, P.; Karney, B.W. A Selective Literature Review of Transient-Based Leak Detection Methods. J. Hydro-Environ. Res. 2009, 2, 212–227. [Google Scholar] [CrossRef]
- Ben-Mansour, R.; Habib, M.A.; Khalifa, A.; Youcef-Toumi, K.; Chatzigeorgiou, D. Computational fluid dynamic simulation of small leaks in water pipelines for direct leak pressure transduction. Comput. Fluids 2012, 57, 110–123. [Google Scholar] [CrossRef]
- Thornton, J.; Lambert, A. Progress in practical prediction of pressure: Leakage, pressure: Burst frequency and pressure: Consumption relationships. In Proceedings of the IWA Special Conference ‘Leakage 2005’, Halifax, NS, Canada, 12–14 September 2005. [Google Scholar]
- Cheung, P.B.; Girol, G.V.; Abe, N.; Propato, M. Night flow analysis and modeling for leakage estimation in a water distribution system. In Integrating Water Systems; Boxall, J., Maksimovic, Č., Eds.; CRC Press: Boca Raton, FL, USA, 2010; pp. 509–513. [Google Scholar]
- Debón, A.; Carrión, A.; Cabrera, E.; Solano, H. Comparing risk of failure models in water supply networks using ROC curves. Reliab. Eng. Syst. Saf. 2010, 95, 43–48. [Google Scholar] [CrossRef]
- Gajowniczek, K.; Ząbkowski, T.; Szupiluk, R. Estimating the ROC curve and its significance for classification models’assessment. Metody Ilościowe w Badaniach Ekonomicznych 2014, 15, 382–391. [Google Scholar]
- Soldevila, A.; Fernandez-Canti, R.M.; Blesa, J.; Tornil-Sin, S.; Puig, V. Leak localization in water distribution networks using Bayesian classifiers. J. Process. Control. 2017, 55, 1–9. [Google Scholar] [CrossRef] [Green Version]
Figure 1.
Daily changes in flow rate and pressure using five-stage pressure control in a selected district metered area (DMA).
Figure 1.
Daily changes in flow rate and pressure using five-stage pressure control in a selected district metered area (DMA).

Figure 2.
Research methodology scheme.

Figure 3.
Diagram of dispersion of exponents for the pressure reduction (green markers) and pressure increase (blue markers) phases.
Figure 3.
Diagram of dispersion of exponents for the pressure reduction (green markers) and pressure increase (blue markers) phases.

Figure 4.
Dendrograms obtained using cluster analysis of exponents during pressure reduction and increase.
Figure 4.
Dendrograms obtained using cluster analysis of exponents during pressure reduction and increase.

Figure 5.
Error matrix of TPR and FNR (a) and Positive Predictive Value (PPV) and False Discovery Rate (FDR) (b) classification of water supply system operating conditions for empirical exponent .
Figure 5.
Error matrix of TPR and FNR (a) and Positive Predictive Value (PPV) and False Discovery Rate (FDR) (b) classification of water supply system operating conditions for empirical exponent .

Figure 6.
Receiver Operating Characteristic curves for created groups of states of water supply system operation: failure and pre-failure states (a), working days (b) and holidays (c).
Figure 6.
Receiver Operating Characteristic curves for created groups of states of water supply system operation: failure and pre-failure states (a), working days (b) and holidays (c).


Table 1.
Summary of the measurement days included in the analysis (blue: holidays, red: pre-failure, after and failure days, green: weekends, black: working days).
Table 1.
Summary of the measurement days included in the analysis (blue: holidays, red: pre-failure, after and failure days, green: weekends, black: working days).
| Event Number | Start Time | End Time | Event Number | Start Time | End Time | Event Number | Start Time | End Time |
|---|---|---|---|---|---|---|---|---|
| 1 | 9 May 2017 | 10 May 2017 | 11 | 14 August 2017 | 15 August 2017 | 21 | 1 December 2017 | 2 December 2017 |
| 2 | 20 May 2017 | 21 May 2017 | 12 | 30 August 2017 | 31 August 2017 | 22 | 14 December 2017 | 15 December 2017 |
| 3 | 23 May 2017 | 24 May 2017 | 13 | 8 September 2017 | 9 September 2017 | 23 | 25 December 2017 | 26 December 2017 |
| 4 | 2 June 2017 | 3 June 2017 | 14 | 16 September 2017 | 17 September 2017 | 24 | 31 December 2017 | 1 January 2018 |
| 5 | 22 June 2017 | 23 June 2017 | 15 | 22 September 2017 | 23 September 2017 | 25 | 7 January 2017 | 8 January 2018 |
| 6 | 28 June 2017 | 29 June 2017 | 16 | 3 October 2017 | 04 October 2017 | 26 | 10 January 2018 | 11 January 2018 |
| 7 | 3 July 2017 | 4 July 2017 | 17 | 18 October 2017 | 19 October 2017 | 27 | 13 January 2018 | 14 January 2018 |
| 8 | 14 July 2017 | 15 July 2017 | 18 | 2 November 2017 | 3 November 2017 | 28 | 26 April 2017 | 27 April 2017 |
| 9 | 23 July 2017 | 24 July 2017 | 19 | 15 November 2017 | 16 November 2017 | 29 | 5 May 2017 | 6 May 2017 |
| 10 | 8 August 2017 | 9 August 2017 | 20 | 27 November 2017 | 28 November 2017 | 30 | 7 May 2017 | 8 May 2017 |
Table 2.
Values and statistics of the rate for selected measurement events during the reduction and increase of pressure (blue: holidays, red: pre-failure, after and failure days, green: weekends, black: working days).
Table 2.
Values and statistics of the rate for selected measurement events during the reduction and increase of pressure (blue: holidays, red: pre-failure, after and failure days, green: weekends, black: working days).
| Event Number | Start Time | End Time | Pressure Reduction | Pressure Increase | ||||
|---|---|---|---|---|---|---|---|---|
| αII−I | αIII−I | αIII−II | αIV−III | αV−III | αV−IV | |||
| 1 | 9 May 2017 | 10 May 2017 | 19.25 | 6.05 | 3.35 | 4.99 | 5.58 | 7.96 |
| 2 | 20 May 2017 | 21 May 2017 | 12.64 | 5.88 | 4.35 | 2.32 | 6.35 | 23.11 |
| 3 | 23 May 2017 | 24 May 2017 | 22.31 | 6.17 | 2.74 | 5.72 | 6.12 | 7.71 |
| 4 | 2 June 2017 | 3 June 2017 | 10.44 | 5.18 | 3.62 | 2.87 | 6.33 | 17.54 |
| 5 | 22 June 2017 | 23 June 2017 | 17.31 | 5.69 | 3.18 | 4.80 | 5.96 | 11.16 |
| 6 | 28 June 2017 | 29 June 2017 | 18.22 | 5.68 | 2.96 | 4.54 | 5.46 | 9.28 |
| 7 | 3 July 2017 | 4 July 17 | 17.74 | 5.37 | 2.70 | 4.06 | 5.09 | 9.18 |
| 8 | 14 July 2017 | 15 July 17 | 17.39 | 5.51 | 3.08 | 2.24 | 6.04 | 21.15 |
| 9 | 23 July 2017 | 24 July 17 | 16.15 | 6.30 | 3.74 | 1.36 | 5.65 | 23.30 |
| 10 | 8 August 2017 | 9 August 17 | 20.12 | 6.82 | 3.96 | 1.66 | 5.73 | 20.46 |
| 11 | 14 August 2017 | 15 August 2017 | 13.48 | 5.53 | 3.47 | −0.20 | 5.27 | 26.55 |
| 12 | 30 August 2017 | 31 August 2017 | 21.12 | 6.13 | 2.88 | 1.88 | 5.75 | 20.89 |
| 13 | 8 September 2017 | 09 September 2017 | 16.16 | 5.52 | 3.08 | 1.81 | 6.30 | 25.18 |
| 14 | 16 September 2017 | 17 September 2017 | 15.49 | 5.69 | 3.44 | 1.34 | 6.60 | 28.75 |
| 15 | 22 September 2017 | 23 September 2017 | 15.99 | 5.62 | 3.32 | 2.43 | 6.68 | 25.71 |
| 16 | 3 October 2017 | 4 October 2017 | 20.05 | 6.63 | 3.87 | 1.80 | 6.05 | 23.73 |
| 17 | 18 October 2017 | 19 October 2017 | 20.75 | 7.01 | 3.88 | 2.00 | 5.86 | 20.85 |
| 18 | 2 November 2017 | 3 November 2017 | 20.05 | 6.20 | 3.11 | 1.56 | 6.05 | 24.90 |
| 19 | 15 November 2017 | 16 November 2017 | 19.9 | 6.53 | 3.60 | 1.55 | 5.62 | 22.80 |
| 20 | 27 November 2017 | 28 November 2017 | 20.77 | 6.36 | 3.32 | 2.08 | 5.95 | 21.61 |
| 21 | 1 December 2017 | 2 December 2017 | 17.05 | 5.51 | 3.11 | 1.30 | 6.05 | 27.33 |
| 22 | 14 December 2017 | 15 December 2017 | 16.79 | 6.04 | 3.51 | 1.98 | 6.31 | 23.66 |
| 23 | 25 December 2017 | 26 December 2017 | 8.62 | 4.75 | 3.74 | −1.82 | 3.77 | 25.75 |
| 24 | 31 December 2017 | 1 January 2018 | 9.32 | 3.13 | 1.66 | −2.38 | 1.50 | 17.04 |
| 25 | 07 January 2017 | 8 January 2018 | 19.84 | 6.43 | 3.47 | 1.75 | 5.79 | 21.50 |
| 26 | 10 January 2018 | 11 January 2018 | 18.17 | 6.56 | 3.87 | 1.29 | 5.50 | 22.48 |
| 27 | 13 January 2018 | 14 January 2018 | 12.33 | 5.12 | 3.30 | 0.14 | 5.14 | 25.62 |
| 28 | 26 April 2017 | 27 April 2017 | 27.40 | 6.77 | 2.99 | 6.16 | 6.58 | 8.12 |
| 29 | 5 May 2017 | 6 May 2017 | 15.31 | 6.60 | 4.67 | 2.00 | 6.61 | 26.32 |
| 30 | 7 May 2017 | 8 May 2017 | −1.59 | −4.30 | 2.76 | 5.57 | 6.25 | 9.36 |
| Statistics | Minimum | −1.59 | −4.30 | 1.66 | −2.38 | 1.50 | 7.71 | |
| Maximum | 27.40 | 7.01 | 4.67 | 6.16 | 6.68 | 28.75 | ||
| Average | 16.62 | 5.55 | 3.36 | 2.23 | 5.73 | 19.97 | ||
| Median | 17.35 | 5.96 | 3.34 | 1.93 | 5.96 | 22.05 | ||
Table 3.
Results of classification of water supply system operation states.
| Phase of the Experiment | Classification Method | Accuracy of the Classifier (%) |
|---|---|---|
| II–I | Quadratic discriminant | 90.0 |
| Naive Bayes Classifier | 90.0 | |
| Support Vector Machine | 86.7 | |
| III–I | Support Vector Machine | 76.7 |
| Naive Bayes Classifier | 76.7 | |
| Quadratic discriminant | 76.7 | |
| III–II | Quadratic discriminant | 73.3 |
| Support Vector Machine | 70.0 | |
| k-Nearest Neighbors algorithm | 70.0 | |
| IV–III | Support Vector Machine | 83.3 |
| Naive Bayes Classifier | 80.0 | |
| Quadratic discriminant | 76.7 | |
| V–III | Linear discriminant | 76.7 |
| Ensemble Classifier | 76.7 | |
| Support Vector Machine | 70.0 | |
| V–IV | Support Vector Machine | 70.0 |
| k-Nearest Neighbors algorithm | 70.0 | |
| Ensemble Classifier | 70.0 |
Table 4.
Values of true positive rates (TPR) for individual system operating states for individual phases of the experiment.
Table 4.
Values of true positive rates (TPR) for individual system operating states for individual phases of the experiment.
| Phase of the Experiment | Classification Method | Accuracy of the Classification (%) | ||
|---|---|---|---|---|
| Pre-Failure and Failure Condition | Working Days | Holidays | ||
| II–I | Quadratic discriminant | 67 | 95 | 83 |
| III–I | Support Vector Machine | 0 | 100 | 33 |
| III–II | Quadratic discriminant | 0 | 100 | 17 |
| IV–III | Support Vector Machine | 0 | 100 | 67 |
| V–III | Linear discriminant | 0 | 100 | 33 |
| V–IV | Support Vector Machine | 0 | 100 | 0 |
© 2019 by the authors. Licensee MDPI, Basel, Switzerland. This article is an open access article distributed under the terms and conditions of the Creative Commons Attribution (CC BY) license (http://creativecommons.org/licenses/by/4.0/).
Share and Cite
MDPI and ACS Style
Stańczyk, J.; Burszta-Adamiak, E. The Analysis of Water Supply Operating Conditions Systems by Means of Empirical Exponents. Water 2019, 11, 2452. https://doi.org/10.3390/w11122452
AMA Style
Stańczyk J, Burszta-Adamiak E. The Analysis of Water Supply Operating Conditions Systems by Means of Empirical Exponents. Water. 2019; 11(12):2452. https://doi.org/10.3390/w11122452
Chicago/Turabian StyleStańczyk, Justyna, and Ewa Burszta-Adamiak. 2019. "The Analysis of Water Supply Operating Conditions Systems by Means of Empirical Exponents" Water 11, no. 12: 2452. https://doi.org/10.3390/w11122452
Note that from the first issue of 2016, this journal uses article numbers instead of page numbers. See further details here.