Article

Dynamics of Cyanobacteria and Related Environmental Drivers in Freshwater Bodies Affected by Mitten Crab Culturing: A Study of Lake Guchenghu, China

1
State Key Laboratory of Lake Science and Environment, Nanjing Institute of Geography and Limnology, Chinese Academy of Sciences, Nanjing 210008, China
2
University of Chinese Academy of Sciences, Beijing 100049, China
*
Author to whom correspondence should be addressed.
Water 2019, 11(12), 2468; https://doi.org/10.3390/w11122468
Submission received: 11 October 2019 / Revised: 20 November 2019 / Accepted: 22 November 2019 / Published: 23 November 2019
(This article belongs to the Special Issue Advancing Knowledge on Cyanobacterial Blooms in Freshwaters)

Abstract

:
Mitten crab aquaculture is prevalent in China, however, knowledge about the threat of cyanobacteria in mitten crab aquaculture-impacted water bodies is limited. Here, seasonal variations of cyanobacteria and their relationships with environmental factors were investigated for Lake Guchenghu area. Results suggested the changes of cyanobacteria community in crab ponds distinguished from the adjacent lake. In the lake, cyanobacterial biomass (3.86 mg/L, 34.6% of the total phytoplankton) was the highest in autumn with the dominance of Oscillatoria, Aphanocapsa and Pesudanabaena. By contrast, in crab ponds, cyanobacteria (46.80 mg/L, 97.2% of the total phytoplankton biomass) were the most abundant in summer when Pesudanabaena and Raphidiopsis were the dominant species. Of particular note was that obviously higher abundance of filamentous and potentially harmful species (e.g., Raphidiopsis raciborskii and Dolichospermum circinale) were observed in ponds compared to the lake. Specifically, water depth (WD), permanganate index (CODMn), total phosphorus (TP), N:P ratio, and NO 2 -N were the key environmental variables affected cyanobacteria composition. For crab ponds, N:P ratio, water temperature (WT) and TP were the potential environmental drivers of cyanobacteria development. This study highlighted the fact that mitten crab culture had non-negligible influences on the cyanobacteria community and additional attention should be paid to the cyanobacteria dynamics in mitten crab culture-impacted water bodies, especially for those potentially harmful species.

1. Introduction

Cyanobacteria are ubiquitous in diverse aquatic environments throughout the world, including lakes, reservoirs, ponds, etc. With accelerating industrial and agricultural development, the rising nutrient pollution intensified the proliferation of cyanobacteria in freshwater bodies worldwide [1,2,3]. The impact of aquaculture on water quality and the expansion of harmful cyanobacteria is a major environmental issue. Given the increase in intensive aquaculture, many environmental challenges emerged, among which environmental degradation associated with cyanobacterial blooms appeared to be the most alarming [4]. The noxious cyanobacterial blooms would cause various problems associated with unpleasant tastes, odors and toxic metabolite production which could threaten aquatic products and human health [2,4,5,6,7].
Over the past few years, mitten crab culture has become one of the most economically important freshwater aquacultures in China, with current yield of this species increasing dramatically (from 8.4 × 10³ tons in 1991 to 8.2 × 10⁵ tons in 2015) [8]. Whilst previous studies suggested that crab farming was less detrimental to water environments than fish or shrimp farming, the concentrations of total nitrogen (TN) and total phosphorus (TP) in crab culturing ponds were higher than those in neighboring lake areas [9]. In addition, most crab ponds are shallow, small, and stagnant, which are likely to deteriorate the water environment. Thus, the influence of crab culture on the cyanobacteria dynamics should not be neglected because crab culture, to some extent, changes the physical and chemical properties of water bodies, and biotic community structure [10]. Although many studies investigated cyanobacteria dynamics in fish or shrimp ponds, little is known about the ecology of cyanobacteria in crab ponds. Furthermore, crab culture is also regarded as one of the significant sources of surface water pollution because most of the effluents from crab ponds are eventually discharged into their surrounding lakes [9,10,11]. Hence, cyanobacteria, as a key group in response to nutrient pollution processes, should be paid attention in crab aquaculture-impacted water bodies.
To mitigate the risk of cyanobacterial blooms, knowledge about the environmental drivers of cyanobacteria dynamics is essential for establishing appropriate management strategies. Until recently, known driving factors on cyanobacteria variations include physical and chemical parameters like nutrient conditions, water temperature, pH, dissolved oxygen, water depth and so on [12,13,14]. Most investigators have advocated for the consideration of nitrogen and phosphorus as the major causes of eutrophication and cyanobacterial blooms [1,15,16,17]. Nonetheless, the general consensus is that cyanobacterial blooms are complex events, typically caused by multiple factors occurring simultaneously instead of a single environmental factor [18,19,20,21]. Due to the complexity of growth regulators, investigation concerning the effects of environmental factors on the abundance of cyanobacteria requires further efforts.
Lake Guchenghu, a significant water body in the middle-lower area of the Yangtze River in China, is well-known for Chinese mitten crab culture and also provides drinking water for nearby residents. Mitten crab ponds are located in the reclamation area around the lake; with the production of mitten crab increasing rapidly since the 1990s. It has become one of the commercially successful industries, with the largest aquaculture area and the highest output in China [10]. However, environmental pollution problems in Lake Guchenghu have become serious over time [11]. In recent years, water quality of Lake Guchenghu has declined, and it exhibited symptoms of eutrophication where crab culture is one of the key pollution sources [11,22]. An earlier research reported that cyanobacteria dominated in this lake in April and July, accounting for 56%–80% of the total phytoplankton [22]. The dominance of cyanobacteria might be further enhanced if the water quality deteriorates in the future. Notwithstanding the Lake Guchenghu and adjacent mitten crab ponds are located in the same watershed and the ponds withdraw water from the lake, the abundance and diversity of cyanobacteria in crab ponds might be different from those in lake. Nevertheless, there is still a lack of fundamental research about the characteristics of cyanobacteria composition and seasonal variation, and its driving factors in this crab aquaculture-impacted subtropical lake area.
Understanding the dynamics of cyanobacteria and how they relate to the environmental factors in mitten crab culture-impacted water bodies are crucial for unraveling the response of cyanobacteria to mitten crab culture activity, and for helping future management to select precise strategies to ensure aquatic product safety and human health. To this end, the objectives of the current study are to: (1) Determine the composition and abundance of cyanobacteria and related environmental variables in Lake Guchenghu and surrounding mitten crab ponds in different seasons; (2) reveal the influence of mitten crab culture on seasonal variations of the cyanobacteria community; (3) clarify the major environmental factors that affect the development of cyanobacteria; and (4) assess the threat of cyanobacteria in mitten crab culture-impacted water bodies.

2. Materials and Methods
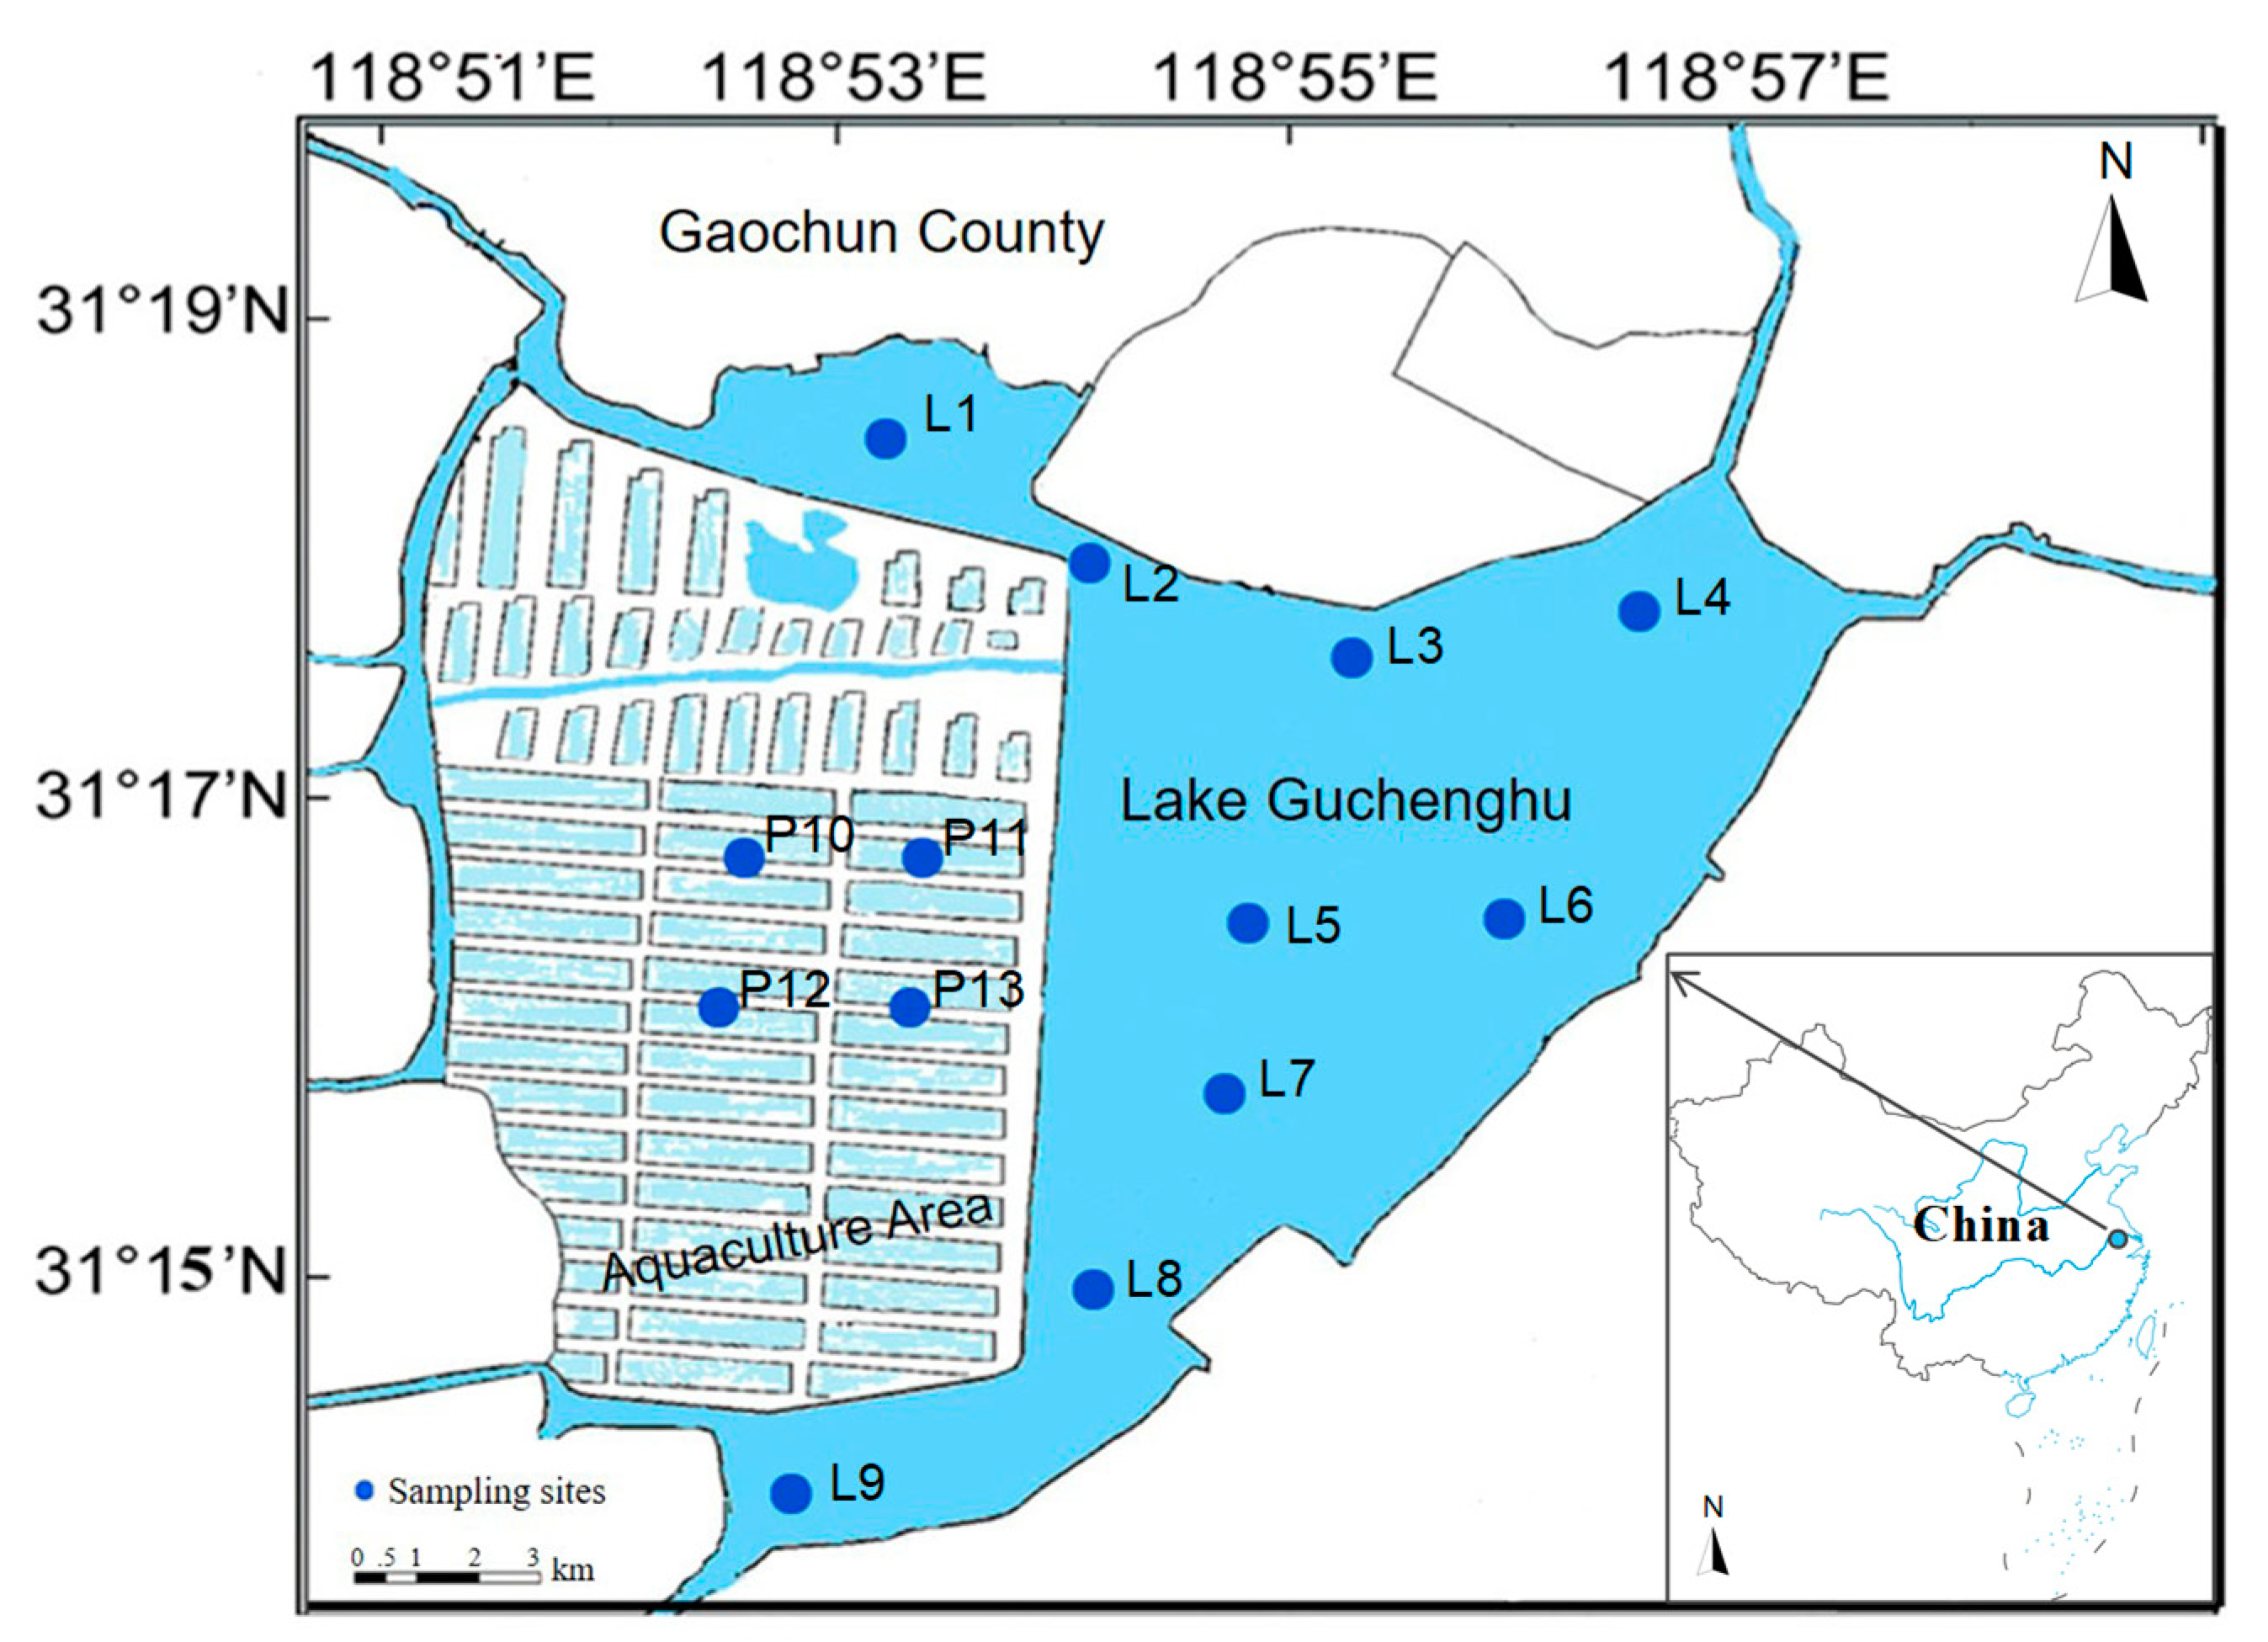
2.1. Study Area

The Lake Guchenghu (Latitude: 31°14′–31°18′ N, Longitude: 118°53′–118°57′ E, Area: 3300 hm2; Figure 1) located in Nanjing City (Jiangsu Province, China) is a crucial water source for the commercial aquaculture of mitten crab, and provides drinking water to part of the local residents. The lake is in the subtropical monsoonal climate zone and the annual average precipitation is 1105.1 mm, of which the summer rainfall is 428.6 mm (i.e., about 40% of the annual precipitation). Mitten crab ponds are located in the reclamation area around the Lake Guchenghu, pumping water from the lake in spring and discharging wastewater back into the lake in autumn. Due to the reclamation, the lake area is only 39 km2, while the storage volume is 65 million m3.

2.2. Sample Collection

Water samples were collected from nine sites (L1–L9) in Lake Guchenghu and four sites (P10-P13) in mitten crab ponds (Figure 1). These water samples were gathered in May (spring), August (summer) and November (autumn), 2017 and February (winter), 2018. At each site, about 2 L of water sample was collected from the surface layer (0–0.5 m) with a 2.5 L plexiglass water sampler. The phytoplankton sample (1 L) was extracted from the surface water sample, stored in clean 1 L plastic containers and 15 mL of Lugols iodone solution was instantly added. All samples were stored in a portable refrigerator (about 4 °C) and then immediately transported to the laboratory. To analyze the composition of phytoplankton, it was concentrated to 30 mL to obtain a quantitative sample of phytoplankton after standing for 48 h.

2.3. Analysis Methods

The basic physicochemical parameters, i.e., water temperature (WT), pH, turbidity and dissolved oxygen (DO), were measured using a YSI multiparameter water-quality monitor (HORIBA U-5000, HORIBA, Ltd., Kyoto, Japan). Water depth (WD) was determined using a precision bathometer (SpeedTech SM-5, SpeedTech, Ltd., USA). The standard analysis methods of total nitrogen (TN), total phosphorus (TP), ammonia nitrogen (NH4+-N), nitrate nitrogen ( NO 3 -N), nitrite nitrogen (NO2-N), permanganate index (CODMn) and suspended solids (SS) concentrations adopted in current study are described in Jin and Tu (1990). Phytoplankton samples were identified and counted using a microscope (Eclipse Ni-U, Nikon Co., Tokyo, Japan) 10 × 40 magnification with a 0.1 mL counting chamber following earlier studies [23,24]. Each sample was counted three times. The cell density was recorded as cells/L. The measure of algal abundance was based on cell counts. The mean cell volumes of the algae were calculated based on appropriate geometric configurations [25] and converted into biomass with the algal cell density (1 mm3 ≈ 1 mg fresh weight).

2.4. Statistical Analysis

One-way analysis of variance (ANOVA) was performed to analyze the differences in environmental factors between lakes and ponds in different months using SPSS 16.0 software (SPSS Inc., Chicago, IL, USA). Based on the cyanobacteria relative abundance dataset, the taxa richness, dominance, evenness and Shannon, Simpson and Margalef indices were determined using PAST 3.0 (Øyvind Hammer, Natural History Museum, University of Oslo [ohammer(at)nhm.uio.no], http://folk.uio.no/ohammer/past/). The Kruskal–Wallis non-parametric test was conducted to assess discrepancies in environmental variables among the thirteen sampling sites. To understand the temporal variation of cyanobacteria community structure in the lake and ponds, non-metric multidimensional scaling (NMDS) was performed using PAST 3.0 according to Gower dissimilarity. Analysis of similarities (ANOSIM) was conducted by PRIMER 5.0 software (PRIMER-E, Ltd., Plymouth, United Kingdom) in order to evaluate whether there is a significant difference in cyanobacteria community structure among different months and sampling sites. We adopted redundancy analysis (RDA) to identify the physicochemical parameters affecting the dynamics of cyanobacteria. Before the forward-selection process, all cyanobacteria and water quality data were transformed into log10(x + 1) format (except pH). All the statistical analyses (RDA) were conducted using CANOCO 4.5. According to the value of the first gradient length of standard deviations, canonical correspondence analysis (CCA) analyses were selected. The RDA results were visualized in the form of ordination diagrams. Species scores are shown as triangles. Each water quality variable is represented by an arrow, which determines an axis. The projection of a taxon on this axis indicates the level of the variable where the taxon is most abundant. Variables with lines that are close to each other and oriented in the same direction are highly positively correlated, while those oriented in opposite directions are highly negatively correlated. Two lines at a 90° angle demonstrate that the corresponding variables are uncorrelated. Pearson correlations between cyanobacteria abundance and environmental factors were performed using SPSS 18.0 software.

3. Results

3.1. Environmental Parameters

The temporal variations of physicochemical parameters in Lake Guchenghu and the crab ponds are presented in Table 1. During the study period, the pH values in Lake and ponds were all above 7.0, ranging from 7.06 to 9.15. WT varied widely throughout the year with ranges of 3.10–29.47 °C and 3.12–31.01 °C in the lake and ponds, respectively. The lowest WT was recorded in February, while the highest WT was observed in August. In May and August, the WT of ponds the was significantly higher than that of the lake (P < 0.05). DO varied considerably over time in the ponds, with an average of 11.9 mg/L (lake) and 14.12 mg/L (ponds) with no obvious temporal pattern. The WD of the lake fluctuated (2.82–4.19 m) across different seasons, while the ponds exhibited small changes in WD all year round. The turbidity of the lake peaked in August, while the higher turbidity in the ponds occurred in November and February.
Regarding the nutrient concentrations, NO 2 -N and NO3-N in the lake were higher than those in adjacent ponds for most of the months. By contrast, the concentrations of NH 4 +-N, TN and TP in the ponds were evidently higher compared with those in the lake; their concentrations in November and February were higher than in May and August. This could be because the harvest season for crab is in autumn with the discharge of farmed tail water increasing, resulting in higher nitrogen and phosphorus concentrations. The N:P ratio in the ponds (from 4.39 to 23.02) was lower than in the lake (from 5.75 to 62.54) because TP concentration in the pond was significantly higher than that of the lake throughout the four seasons (P < 0.05). Moreover, the CODMn levels in the ponds were higher than in the lake during studied period, with ranges of concentrations 4.64–9.19 mg/L (ponds) and 2.86–4.37 mg/L (lake), respectively. These results indicate that most of the environmental factors of the ponds are significantly different from the lake in May and August.

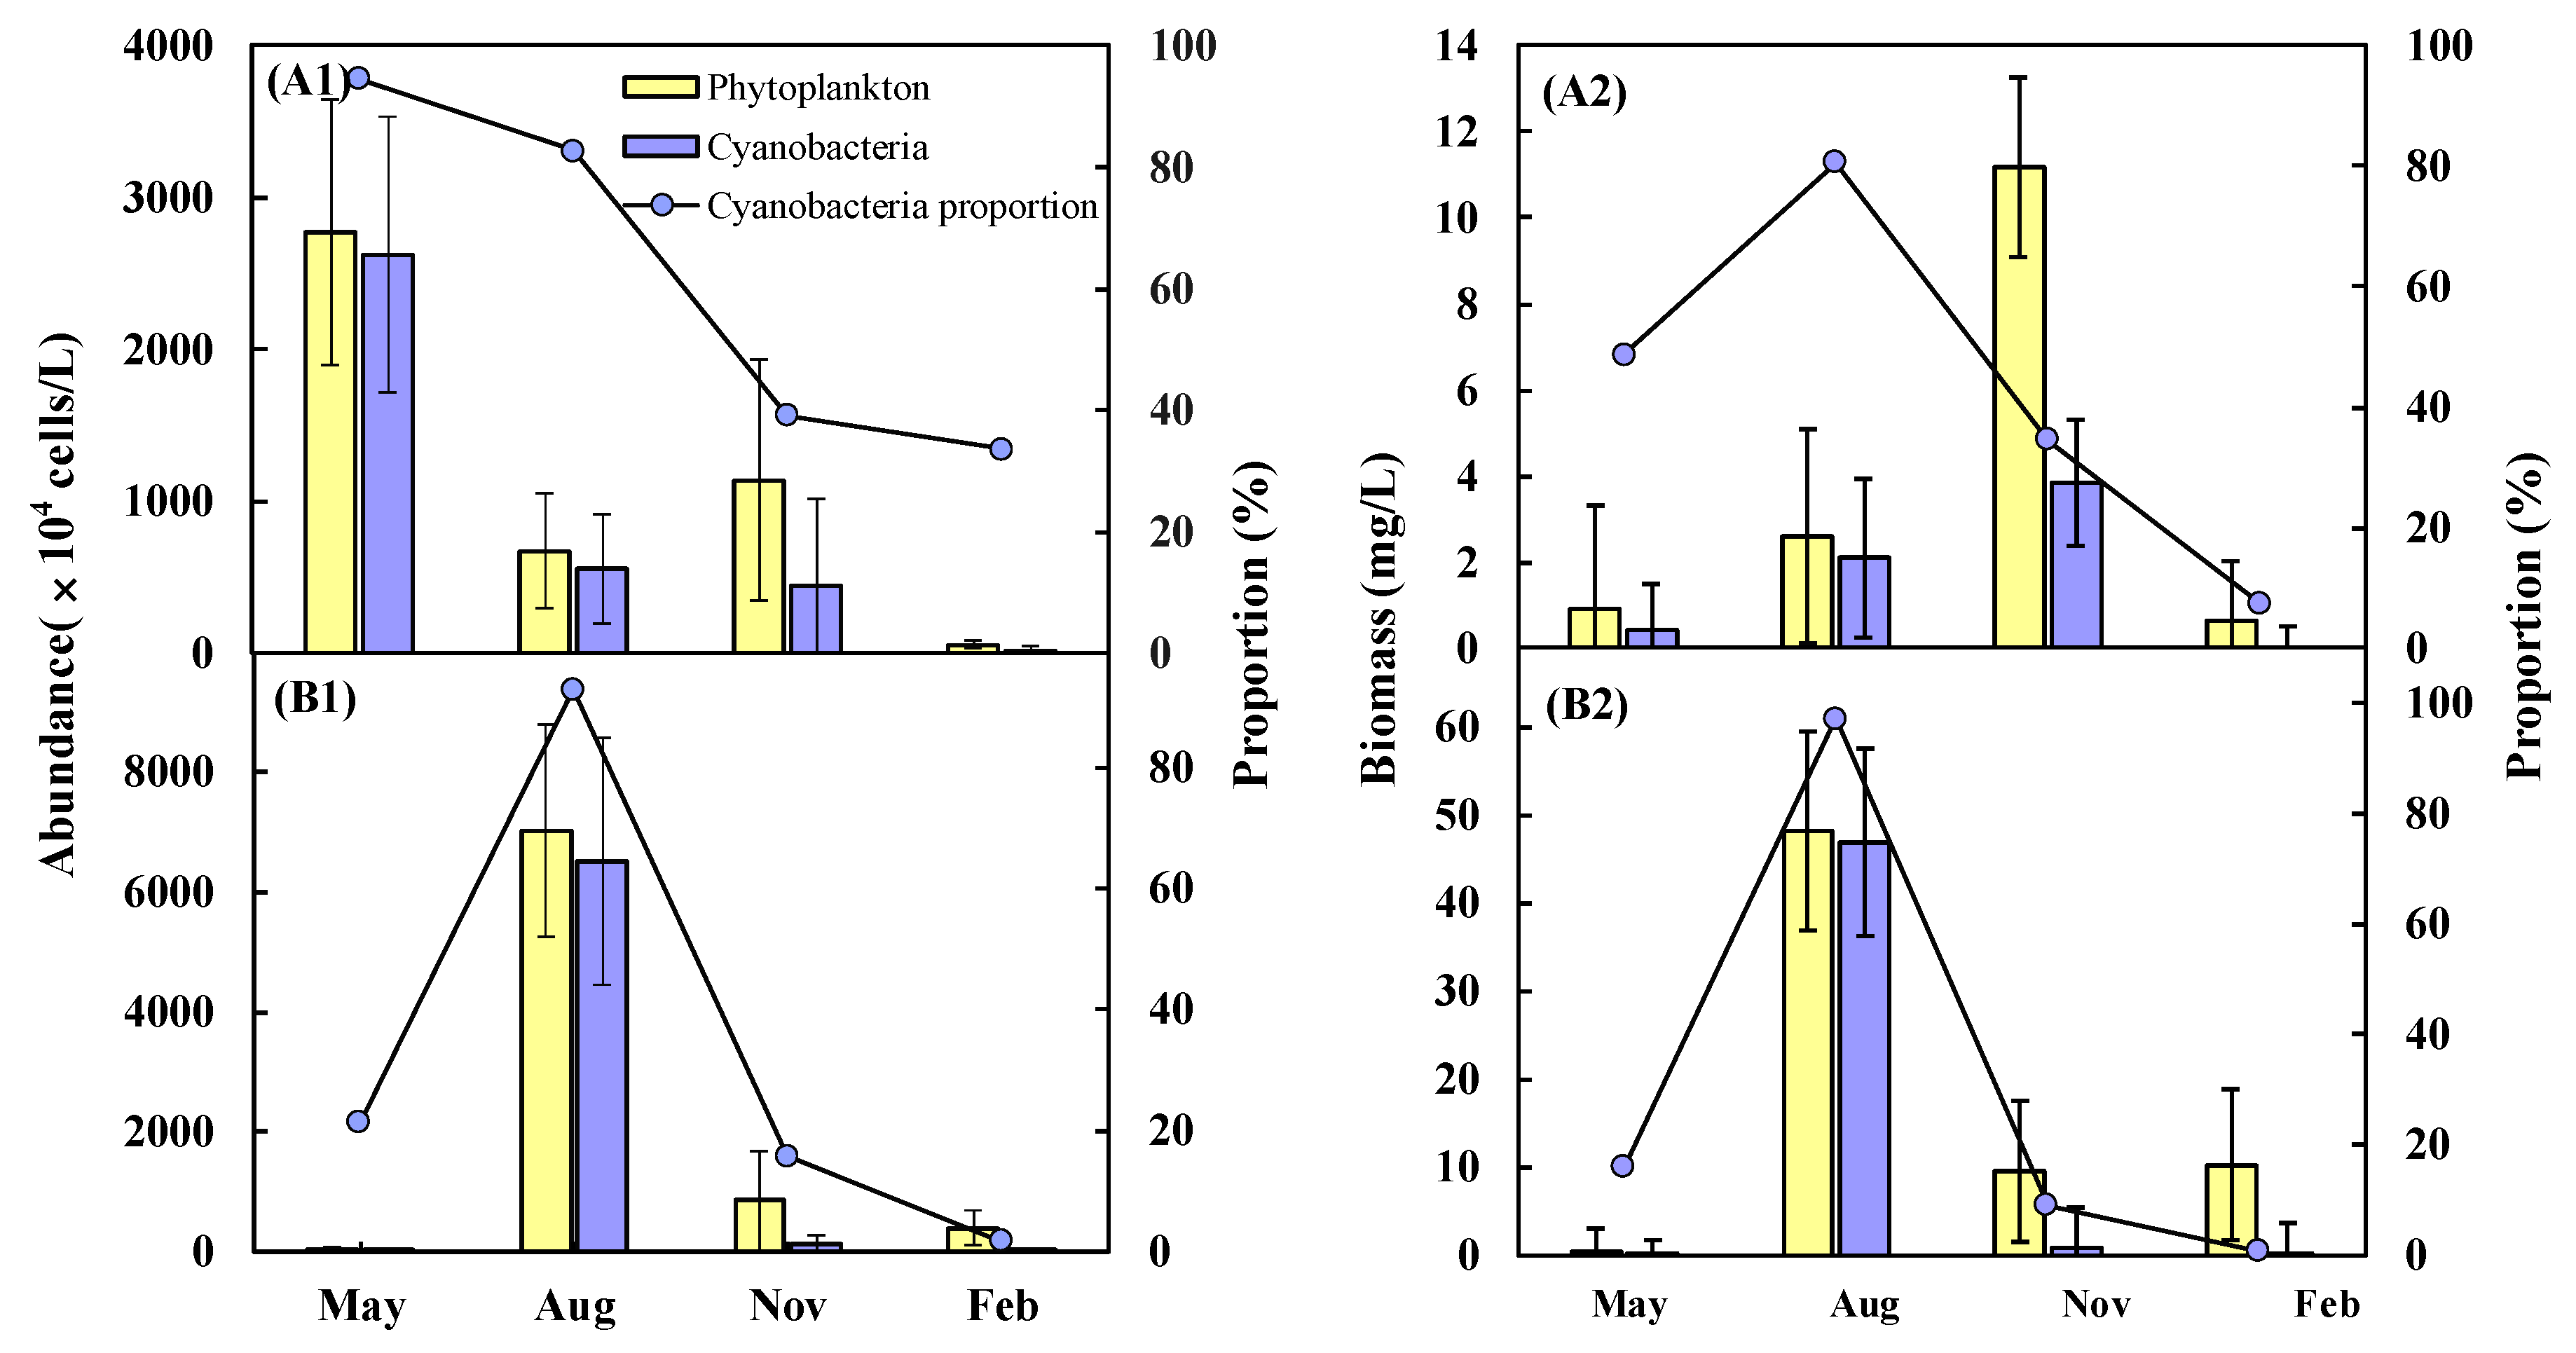
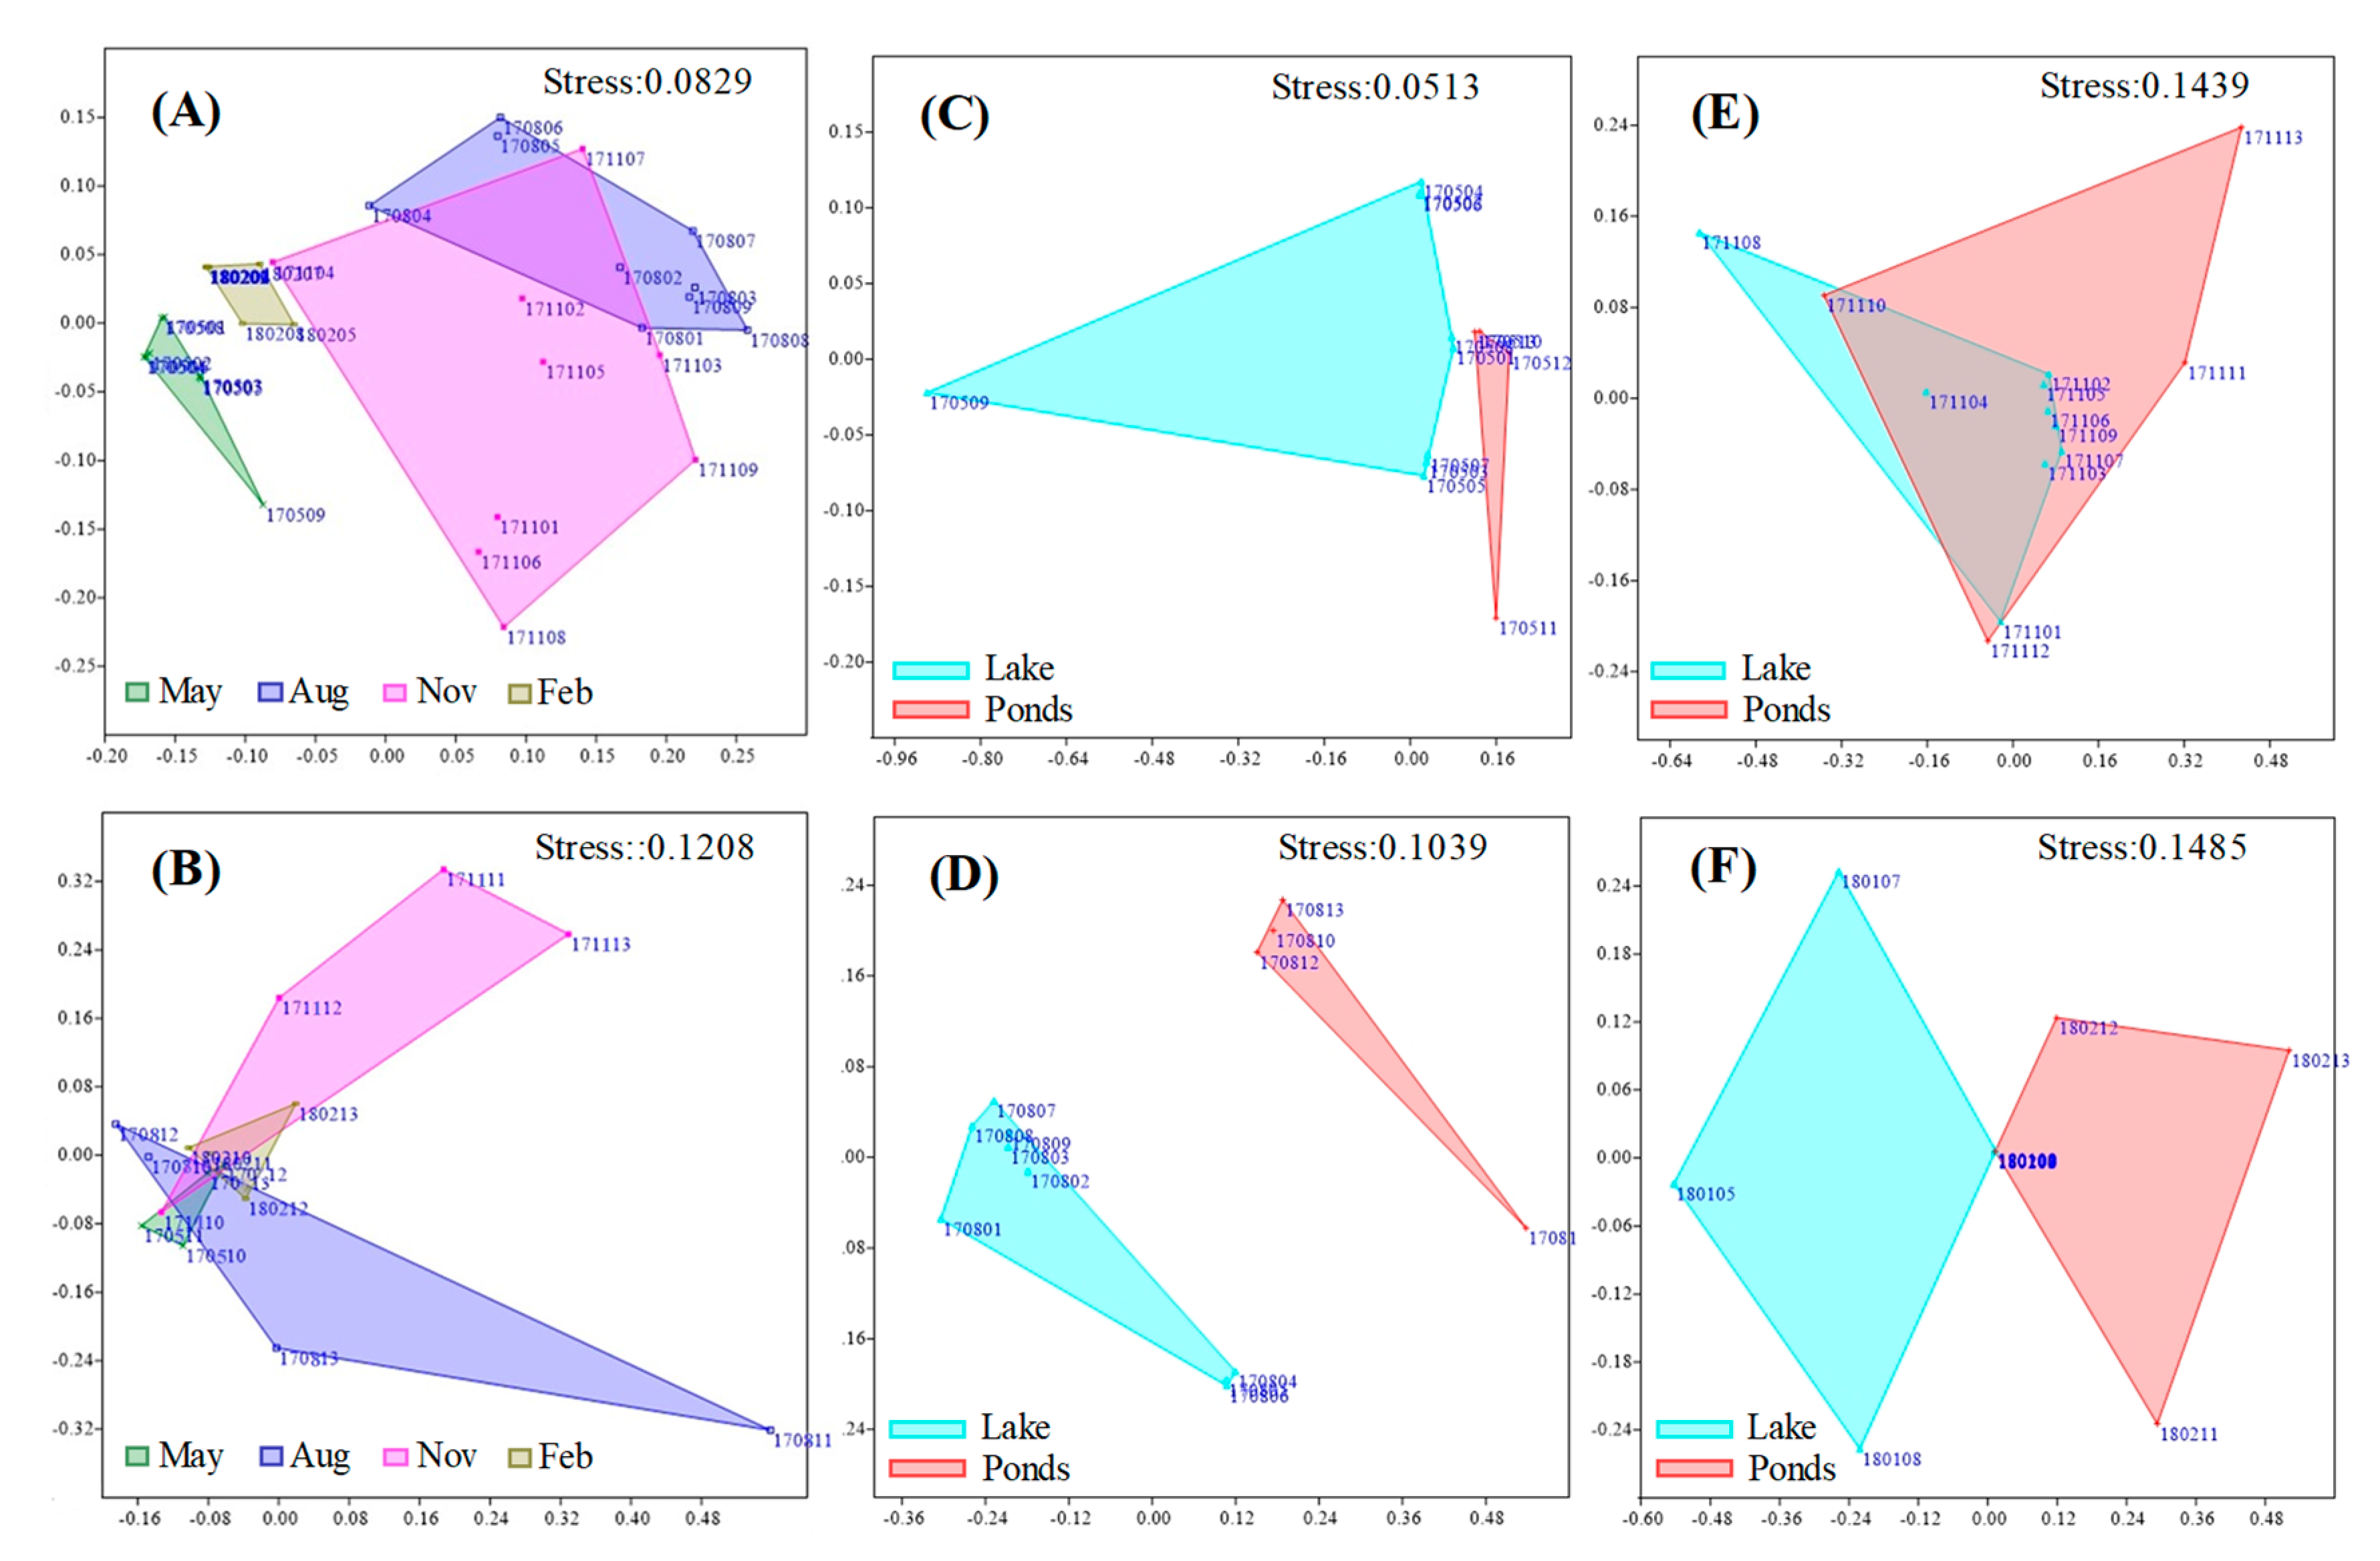
3.2. Seasonal Variations of Cyanobacteria

In the study period, a total of 52 cyanobacteria species belonging to 21 genera were detected in Lake Guchenghu; while 16 genera and 32 cyanobacteria species were identified in ponds (Table S1). The genera Aphanothece, Planktothrix, Romeria, Phormidium and Spirulina were only found in the lake, whereas the genus Anabaenopsis were only recorded in ponds. Cyanobacteria richness and species diversity in August and November were greater than those in May and February in both lake and ponds (Table S2).
The relative abundance of cyanobacteria exhibited distinct seasonal changes. Cyanobacteria abundance demonstrated wide variations throughout the year with ranges from 1.12 × 10⁵ cells/L to 2.62 × 10⁷ cells/L in the lake, and the biomass of cyanobacteria varied from 0.05 mg/L to 3.86 mg/L (Figure 2(A1,A2)). In May, cyanobacteria abundance reached the maximum value of 2.62 × 10⁷ cells/L (accounting for more than 94.5% of the total phytoplankton), where Merismopedia was the dominant cyanobacteria taxa with 97.7% of relative abundance. Nonetheless, the maximum biomass of cyanobacteria appeared in November (3.86 mg/L, 34.6% of the total phytoplankton) instead of May (Figure 2(A2)). The difference may be due to the fact that the size of the cells of different species can vary widely. Merismopedia spp. prevalent in May are tiny sized species which despite being present in very large cell numbers actually contributed little to the total cyanobacterial biomass present in the lake at that time. From Figure 3A, Oscillatoria increased and became the dominant genus in August (19.1%) and November (23.8%). In addition, Dolichospermum (15.9%) and Pesudanabaena (14.0%) were abundant in August; whereas Aphanocapsa (13.8%) and Pesudanabaena (13.0%) were flourishing in November (Figure 3A).
For the ponds, cyanobacteria abundance and biomass both peaked in August (Figure 2(B1,B2)), with 6.51 × 10⁷ cells/L and 46.80 mg/L (i.e., 92.8% of the total phytoplankton abundance and 97.2% of the total phytoplankton biomass), where Pesudanabaena (48.4%) and Raphidiopsis (12.4%) were the dominant species (Figure 3B). The maximum value of cyanobacteria biomass in the ponds was much greater than that of the lake. In November, the abundance of cyanobacteria decreased rapidly with less than 2 × 10⁶ cells/L (about 39.1% of the total phytoplankton). The dominant cyanobacteria were Planktolyngbya, Aphanizomenon and Oscillatoria, accounting for 33.9%, 24.4% and 15.1% of the total phytoplankton, respectively (Figure 3B). Notably, cyanobacteria taxa occurred in examined water bodies with the high abundance were filamentous forms (except in May for lake) (e.g., Oscillatoria, Pesudanabaena, Raphidiopsis, Planktolyngbya, and Aphanizomenon). The proportion of filamentous cyanobacteria in the ponds was higher than that in the lake over the study period, in May and November in particular (P < 0.01) (Figure 4).
During the study periods, five potentially harmful species, all occurred in August and/or November, were identified in the lake and ponds (Table 2). In August, the maximum abundances of the potential toxin producing species in the ponds were much higher than those in lake area. Especially, the abundances of Dolichospermum circinale and Raphidiopsis raciborskii hit 3.6 × 10⁶ and 8.2 × 10⁶ cells/L in August, respectively. In November, the abundance of potentially harmful cyanobacteria species in the ponds significantly declined.

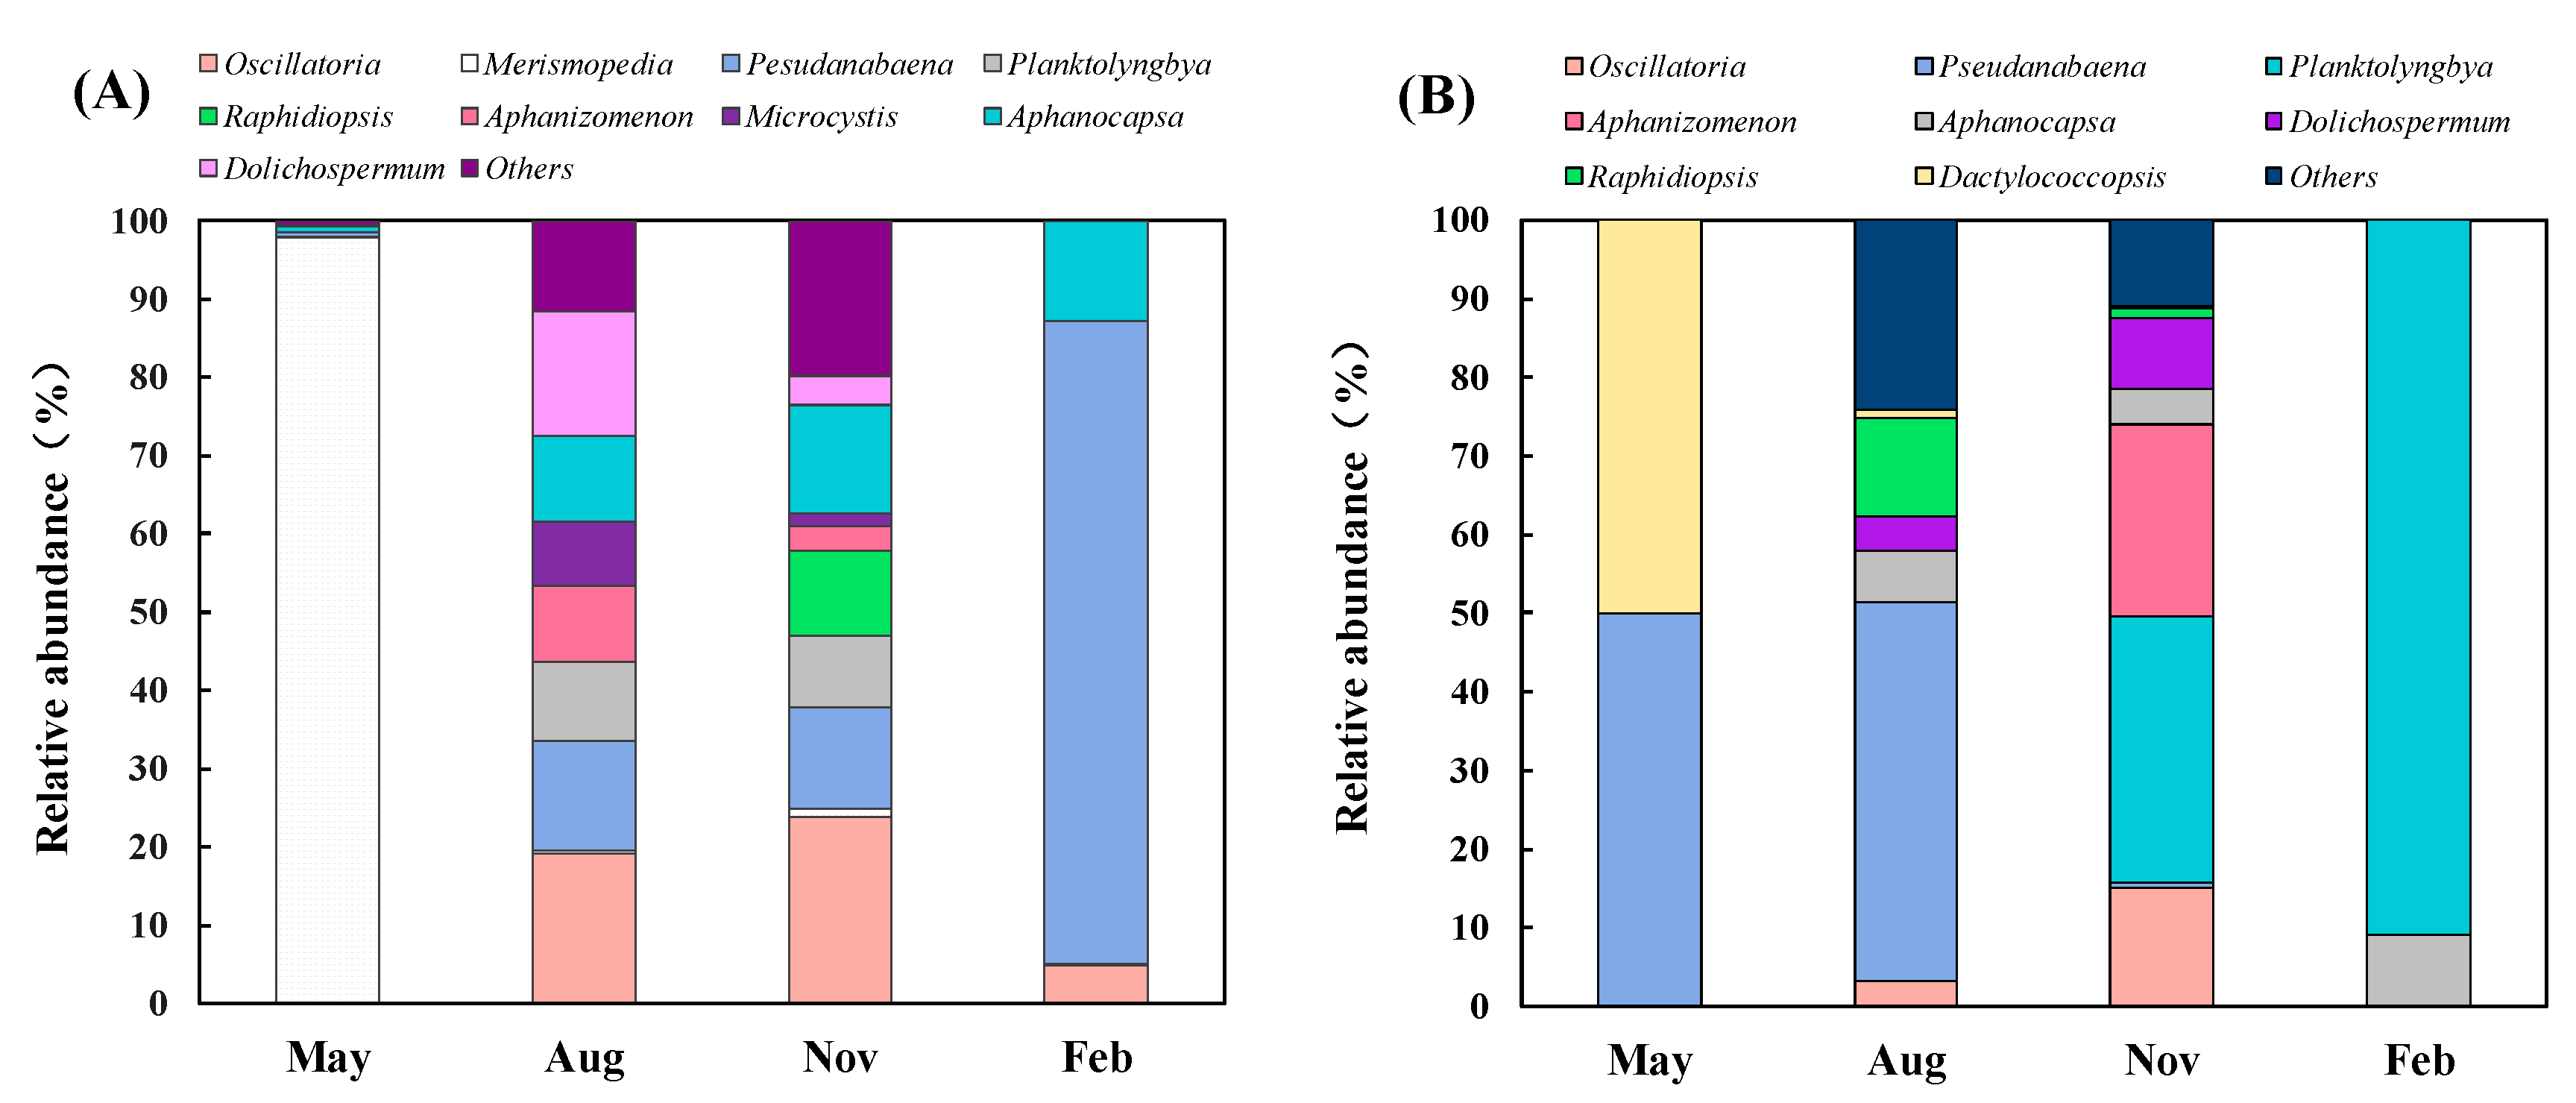
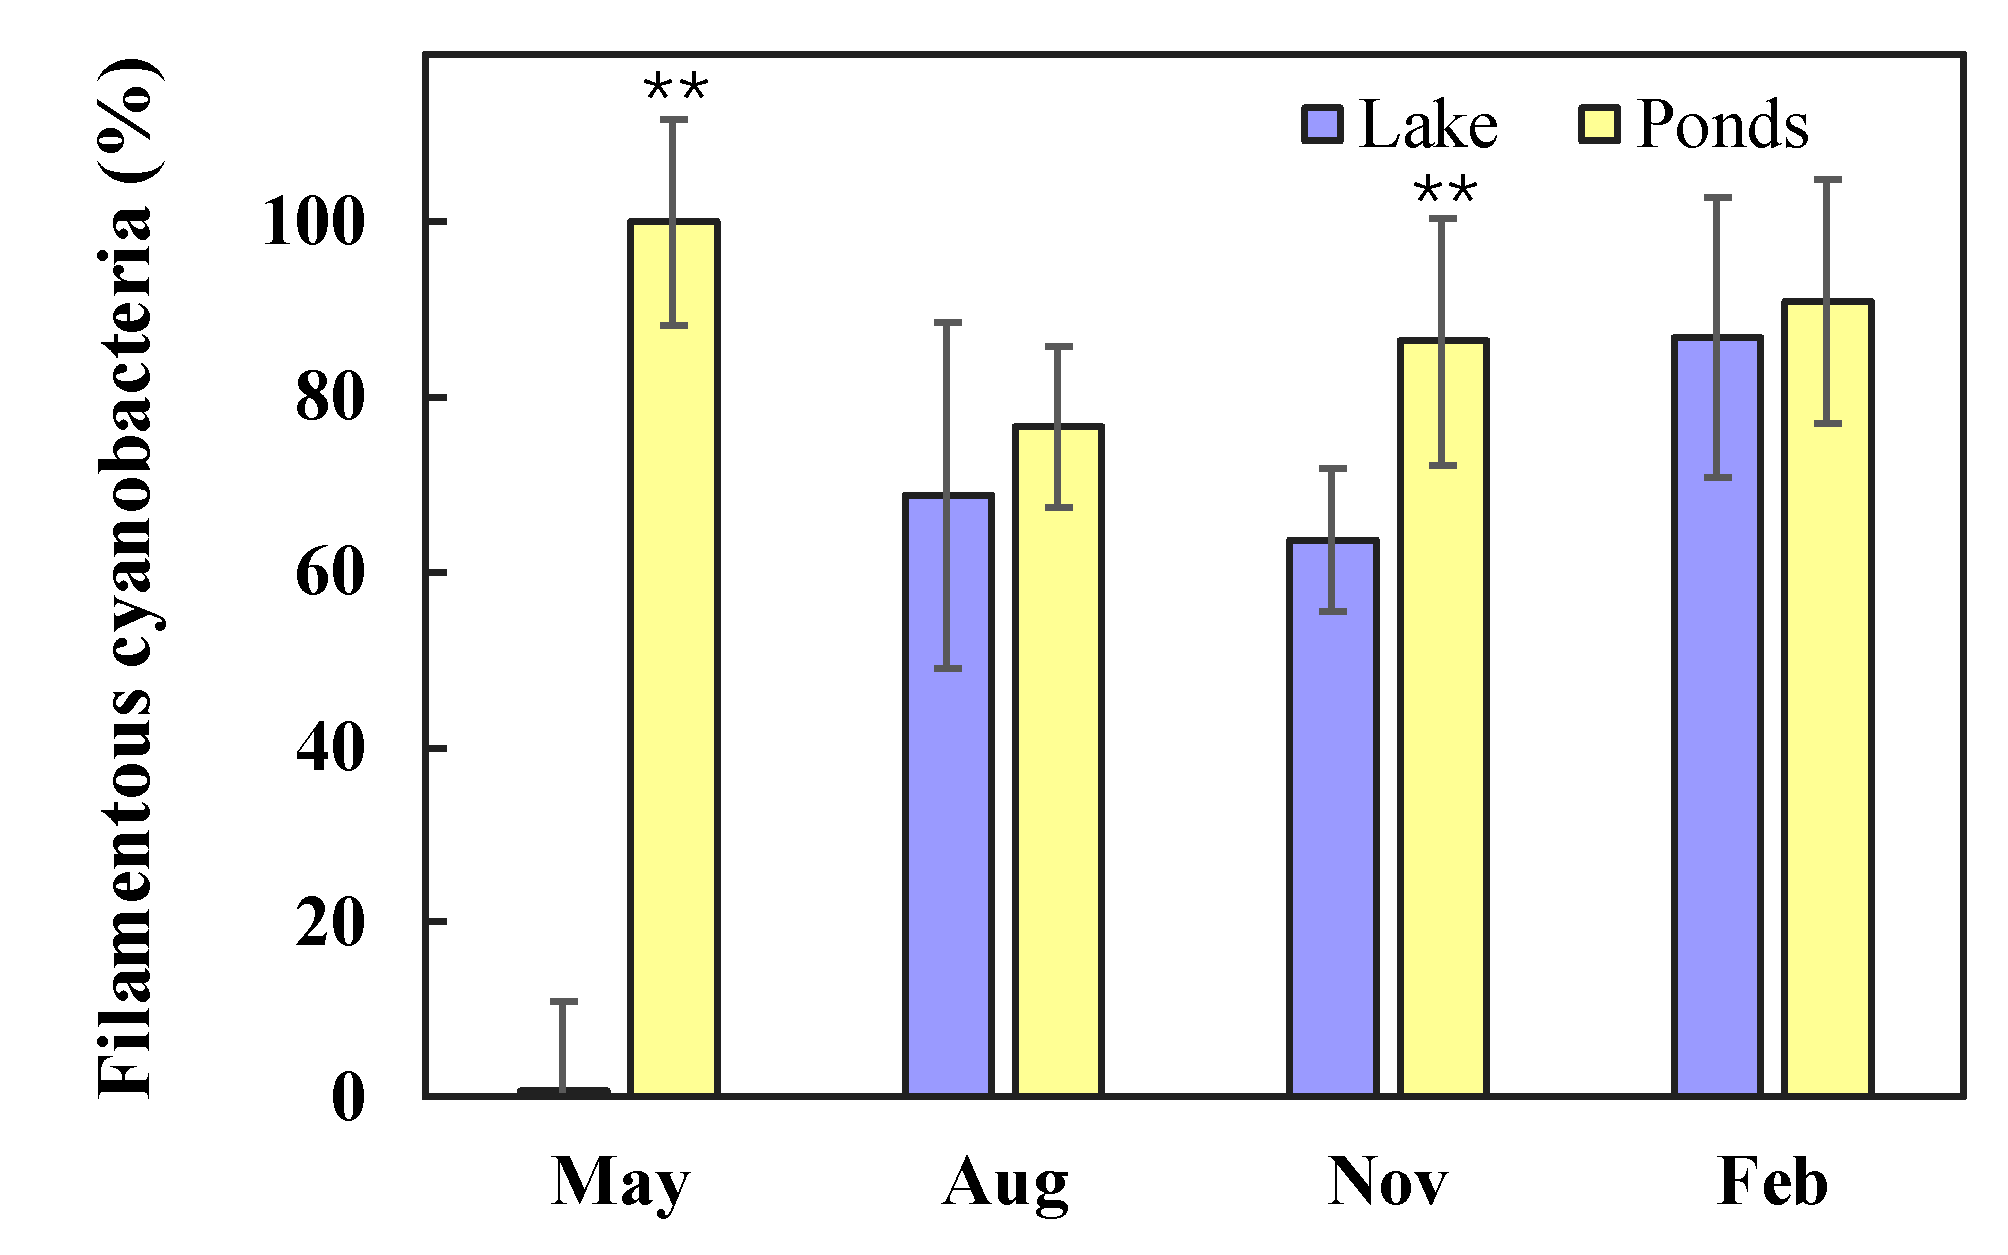
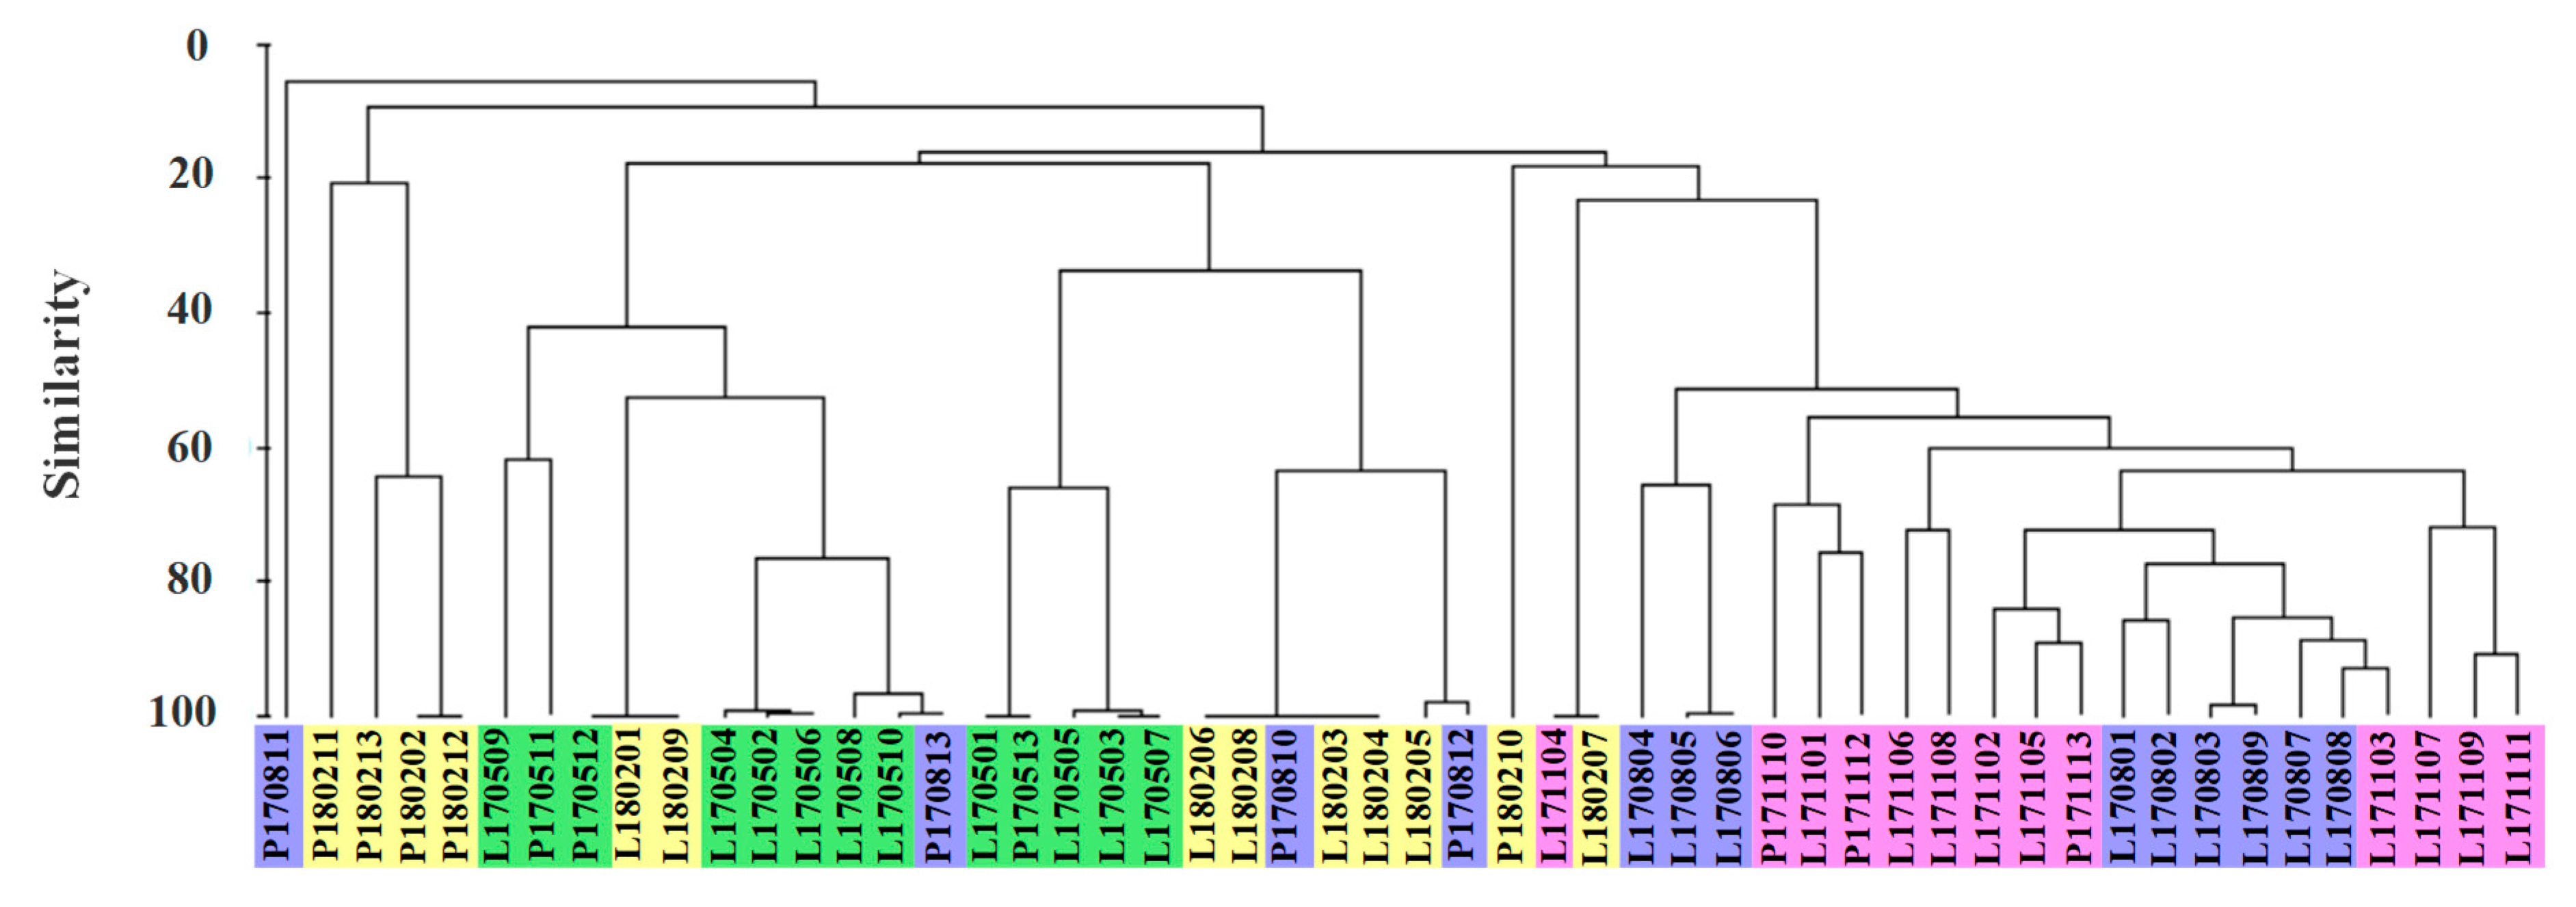
3.3. Quantitative Seasonal Changes in Cyanobacteria Communities

Seasonal variations of cyanobacteria communities at the genera level in the lake and ponds were evident (Figure 5). A remarkable temporal shift in cyanobacteria taxa was observed at the sampling sites in both lake and ponds (Figure 5A,B). All stress values were less than or slightly above 0.1, indicating a good fit by using NMDS analysis [27]. The results of ANOSIM further confirmed distinct discrepancies in the cyanobacteria communities in the lake and ponds among different seasons (P < 0.01, Table S3). Figure 5C–F shows that the similarity in cyanobacterial communities between lake and ponds was relatively high in November, but the similarities were not obvious in May and February. In August, the characteristic of cyanobacterial community in the ponds was significantly different from that of the lake (P < 0.01, Table S3).
According to cluster analysis (Figure 6), the similarity was relatively high in the same habitat and the same season. In August, the difference in cyanobacterial composition among the sampling sites was significant, especially in the ponds. Consistent with the NMDS analysis (above), Figure 6 reveals that the cyanobacterial composition for the lake and ponds was similar in November, and was significantly discrepant in August.

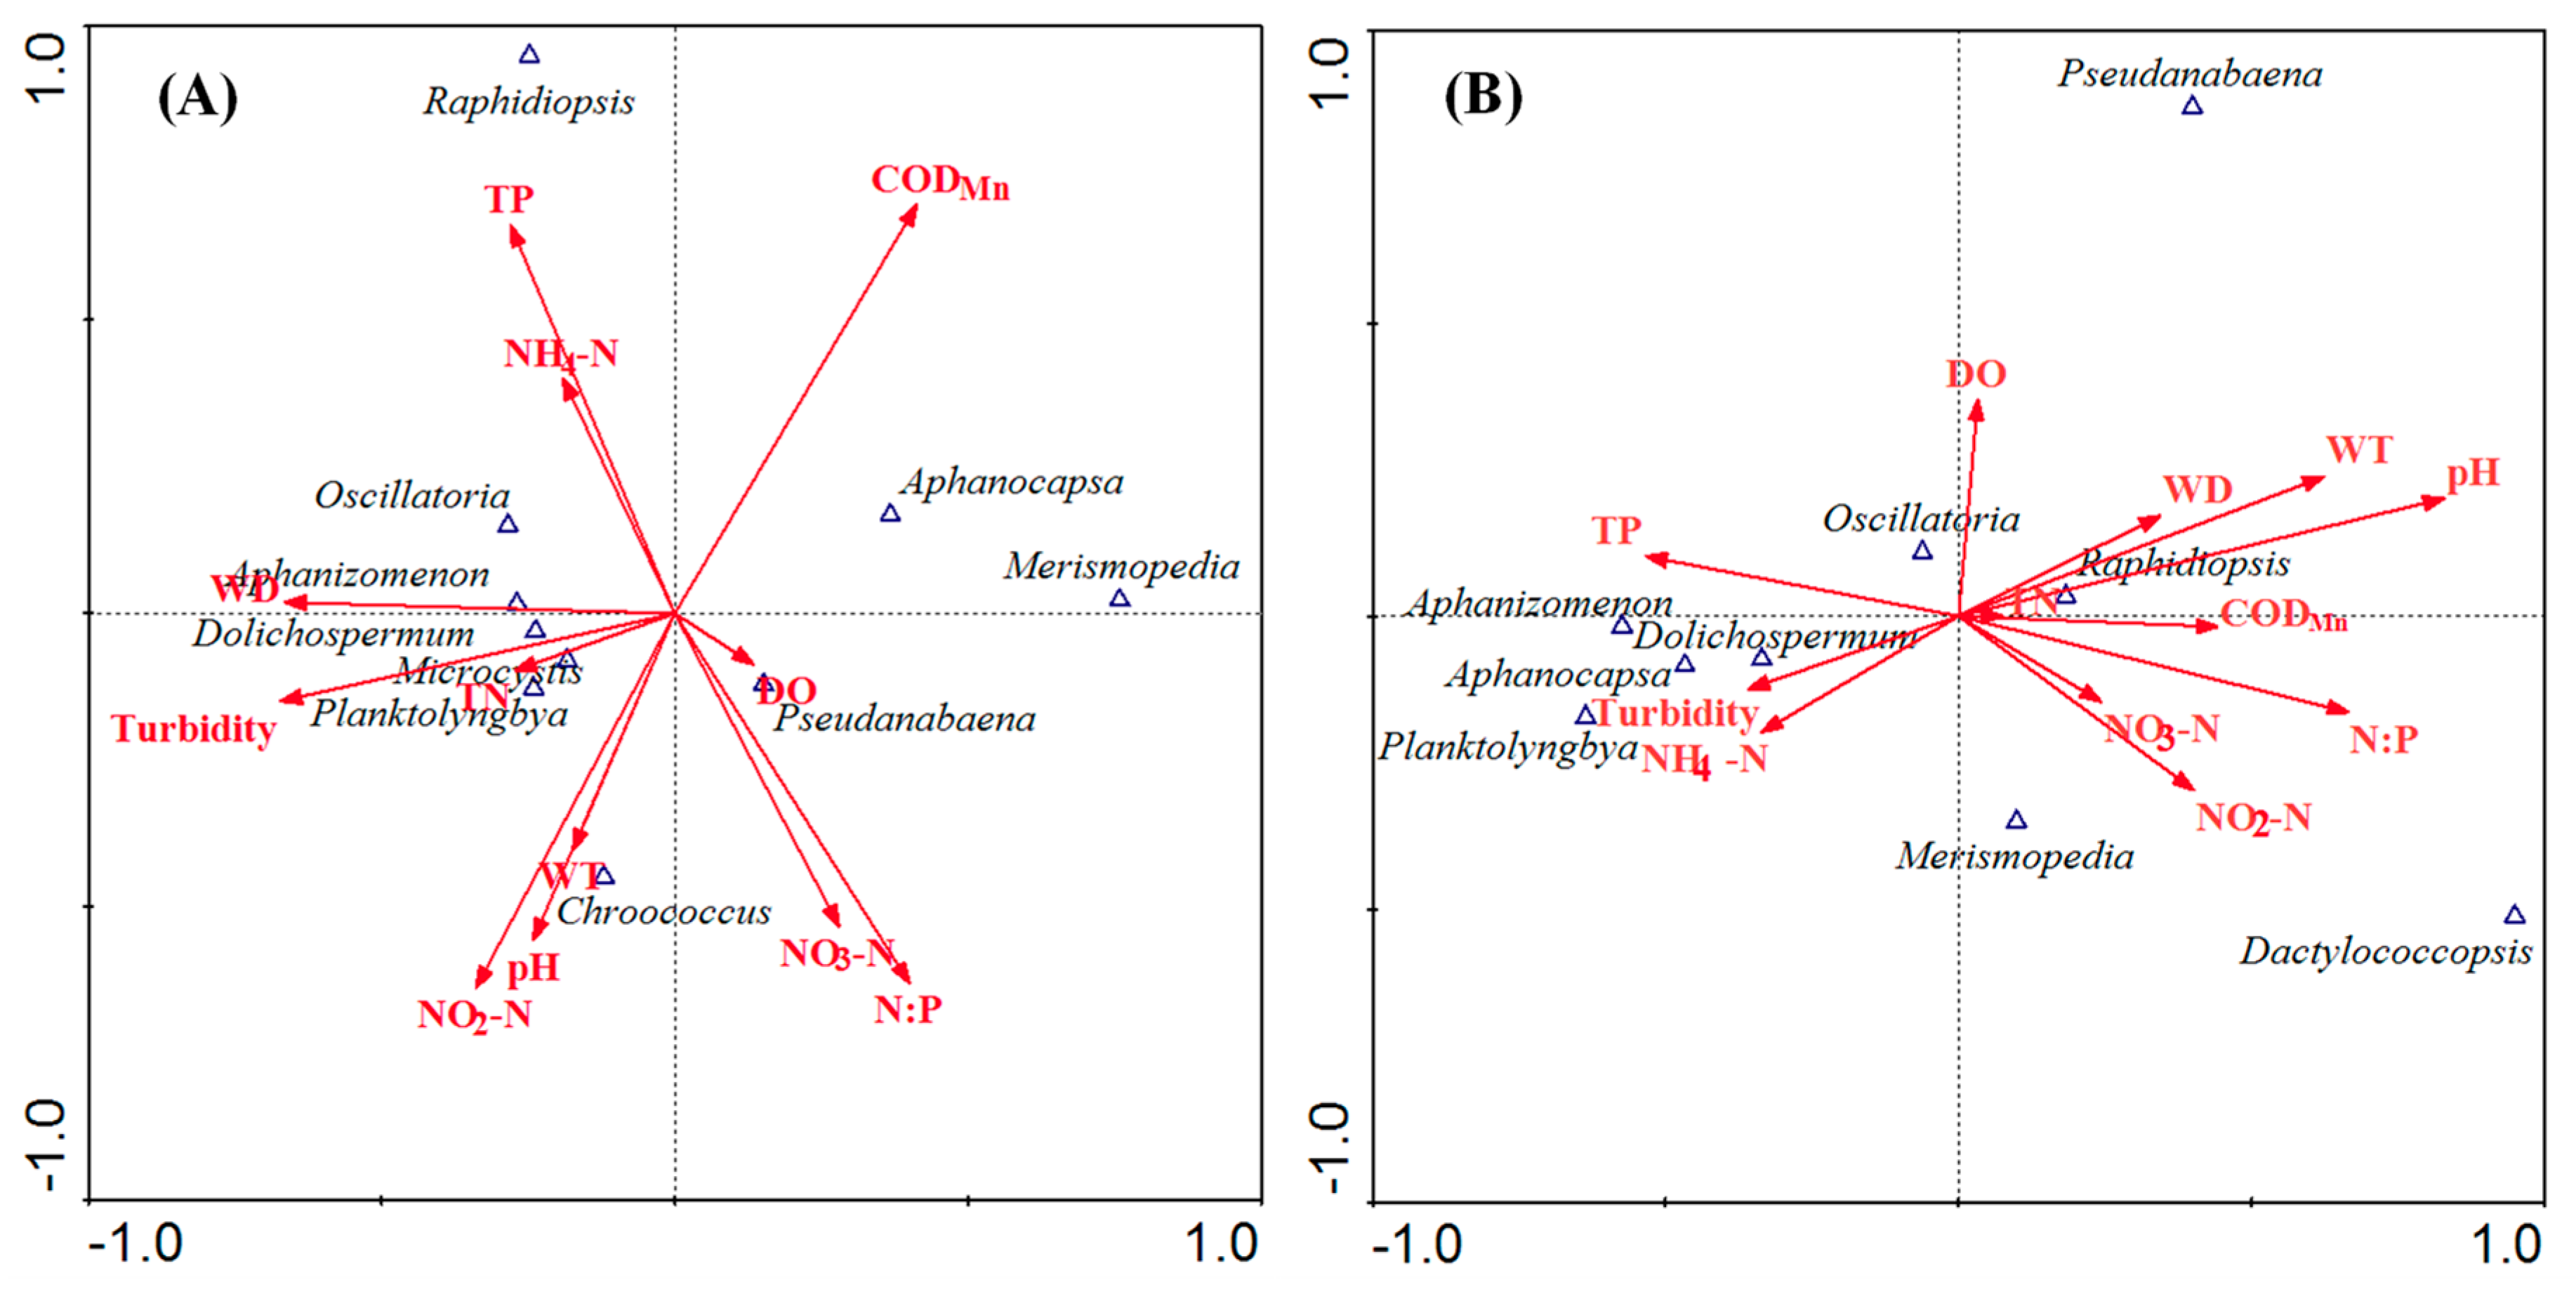
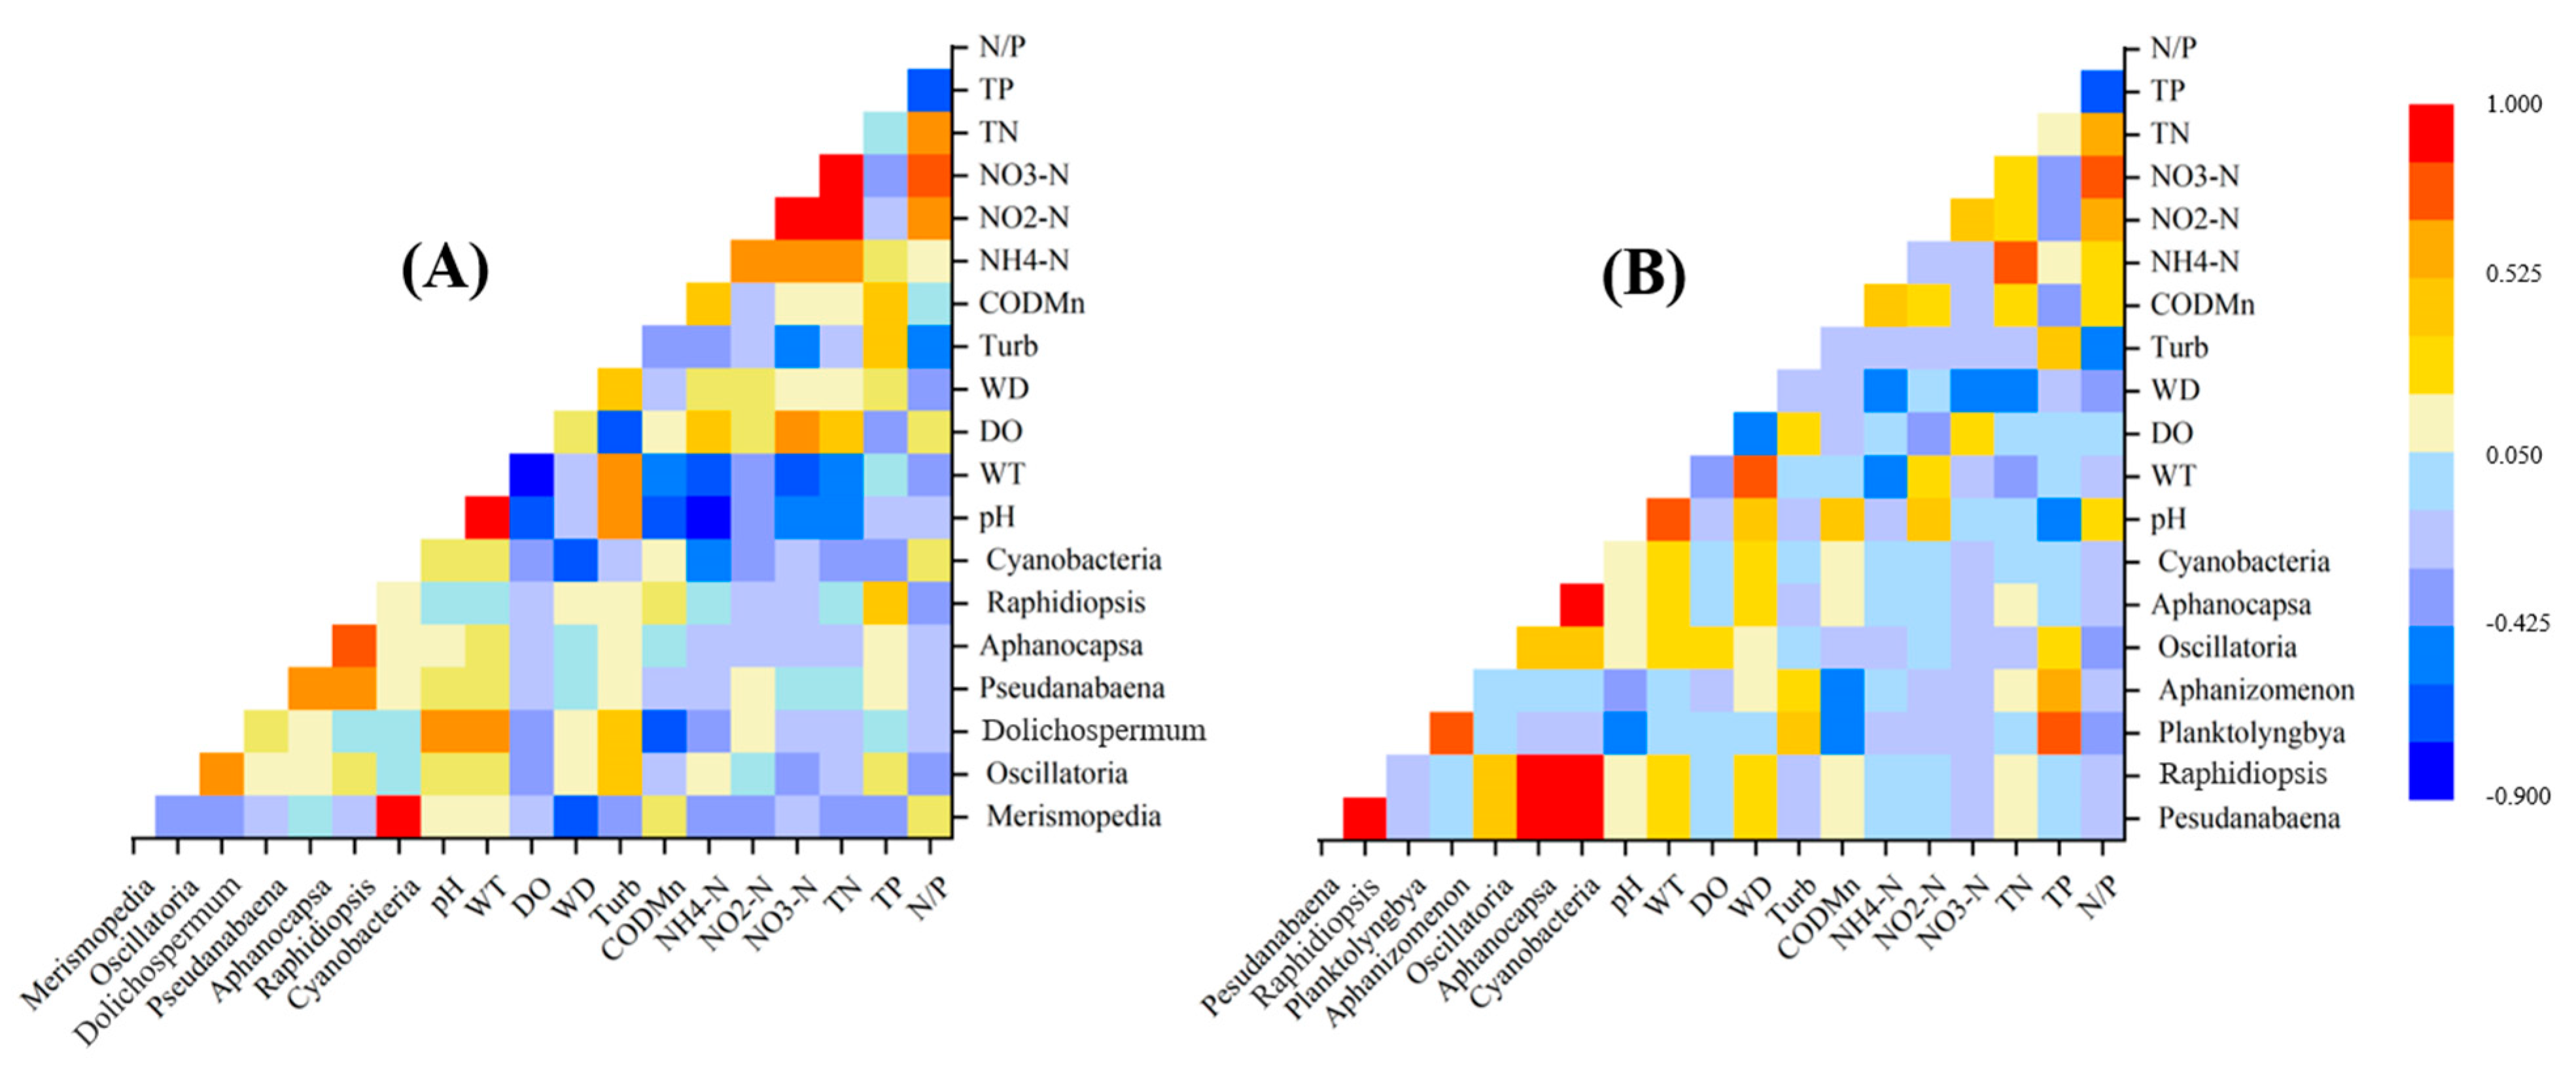
3.4. Relationships between Cyanobacteria Dynamics and Environmental Variables

RDA analysis revealed the relationship between cyanobacteria communities and environmental factors (Figure 7). The environmental variables (details in Table S4) explained 41.8% (54.6%) of the total variance of species distribution in the lake (ponds). In the lake, from 2017 to 2018, the eigenvalues (λ) for RDA axis 1 and axis 2 were 0.356 and 0.136, respectively. The interpretation rate of species-environment relationship for the first two axes was 71.0% (Table S4), which can better explain the relationship between the cyanobacteria community and environmental factors. In crab ponds, the eigenvalues for RDA axis 1 (λ: 0.562) and axis 2 (λ: 0.379) explained a total of 54.6% of the species-environment relation.
The RDA ordination indicated that WD, TN:TP ratio, CODMn, TP and NO 2 -N are the dominant environmental factors for cyanobacterial composition. For the ponds, N:P ratio, WT, and TP were significant factors of cyanobacteria development from May 2017 to February 2018 (Figure 7; Tables S5 and S6). Our results show that different cyanobacteria taxa contain different environment adaptation abilities. In the lake (Figure 7A), Oscillatoria preferred higher TP and NH4+-N concentrations; but the opposite was observed in genera like Chroococcus, Pseudanabaena and Merismopedia. WD and turbidity were positively correlated with Aphanizomenon, Dolichospermum, Planktolyngbya and Oscillatoria; but were negatively correlated with Merismopedia. Raphidiopsis abundance was positively correlated with TP and CODMn, and negatively correlated with N:P ratio. In the ponds (Figure 7B), WT and pH were positively correlated with Raphidiopsis and Pesudanabaena; but negatively correlated with Planktolyngbya, Aphanizomenon and Aphanocapsa. Besides, many genera clusters (including Planktolyngbya Aphanizomenon, Raphidiopsis and Dolichospermum) were positively correlated with TP; negatively correlated with N:P ratio. On the other hand, the same environmental factors could cause different effects in different habitats. Planktolyngbya and Dolichospermum were positively correlated with WT and pH in the lake, but negatively associated in the ponds. Oscillatoria had a positive correlation with NH4+-N in the lake, while the opposite was found in the ponds.
In addition to the RDA results, Pearson correlation coefficients revealed several statistically significant correlations (Figure 8; Table S7). In the lake, cyanobacteria abundance experienced significant positive correlation with TP, but it was negatively correlated with WD, NH4+-N, NO2-N and TN. Regarding the predominant species, Merismopedia abundance correlated positively with the N:P ratio, but negatively with the WD, turbidity, NH4+-N, NO2-N and TP. Oscillatoria abundance correlated positively with pH, WT, turbidity and TP, but negatively with the N:P ratio. Dolichospermum abundance exhibited a positive correlation with WD, pH, WT and turbidity, but a negative correlation with CODMn and N:P. Raphidiopsis abundance only demonstrated significant positive correlation with TP. In ponds, whilst cyanobacteria abundance was positively correlated with WT, WD, pH and TP, such correlation was insignificant. Planktolyngbya abundance correlated positively with TP, but negatively with pH. Aphanizomenon abundance correlated positively with TP, but negatively with CODMn. The Pearson correlation analysis results (above) are in good agreement with the RDA analysis.

4. Discussion

The present study revealed that crab aquaculture has an adverse effect on water quality based on the fact that concentrations of nutrients in crab ponds were evidently higher than those in the adjacent lake area (Table 1). The discharge from the crab ponds (with these nutrients) would increase the risk of pollution in the nearby lake. Regional nutrient enrichment within watersheds might exert a diverse and complex impact on the prevalence and persistence of cyanobacteria over time [13,28]. NMDS analysis indicated that the cyanobacteria community structure had significant seasonal variation in Lake Guchenghu area. Seasonal succession of cyanobacteria has been recorded in many previous studies [29,30]. Physical indicators, limited nutrients, overwintering, and ecological competition all contribute to the temporal variation of the cyanobacteria community.
Our observations revealed that mitten crab culturing had non-negligible impacts on the development of cyanobacteria. The cyanobacterial community in the ponds was different from that of the lake (Figure 5 and Figure 6), especially in August, which was primarily due to the disparities in environmental factors of the two distinctive systems (Table 2). The results of the RDA analysis indicated that WT, WD, turbidity, TP and NH4-N played an important role in structuring cyanobacteria assemblages and had a significant influence on cyanobacteria abundance in the lake area. The highest cyanobacteria abundance with the dominance of Merismopedia in the lake in spring (May) could have been ascribed to the relative low turbidity and water depth. The low turbidity in May might have contributed to the development of Merismopedia, simply because Merismopedia was usually the dominant species in clear lakes [31]. Furthermore, Yang et al. (2016) suggested that the water level could alter the patterns of phytoplankton communities and a decline in water level could boost cyanobacteria dominance [32]. The Pearson correlation analysis in the current study also confirmed that a significant negative correlation existed between cyanobacteria abundance and water depth. In fact, WD is never constant in the lake. WD can influence the ecological processes and patterns of waterbodies through water column mixing, light transmission change and nutrient availability [33,34]. However, the species of cyanobacteria are unitary in May, and this change in species composition followed an increase in phosphorus in August and November, which likely promoted the increase in filamentous species such as Oscillatoria, Dolichospermum, Pesudanabaena and Planktolyngbya (Figure 3). Most of them, similarly to Nostocales, are nitrogen-fixing species [35]. The dominance of nitrogen-fixing cyanobacteria was mainly due to its significant positive correlation with TP, and negative correlation with TN, NH4+-N and NO2-N (Figure 7 and Figure 8). With an increase in TP and decrease in N:P ratio from August to November 2017, the abundance of nitrogen-fixing species increased dramatically. Another reason may be that the precipitation increases in summer and autumn in this subtropical monsoonal climate zone, and the water level fluctuates frequently, resulting in many benthic species like Oscillatoria being mobilised and becoming entrained within the water column due to the water in the lake being shallow.
By contrast, WT, TP, pH, and N:P ratio were important environmental variables that influenced cyanobacteria development in the ponds, which were different compared to the lake. This confirmed that similar set of environmental factors might not always drive the cyanobacteria development in different types of habitats (lake and ponds). Unlike the lake, the greatest cyanobacteria abundance was observed in ponds where Pesudanabaena and Raphidiopsis dominated in August (Figure 3), and the maximum abundance was 2.5 times the lake’s greatest abundance over the studied period. The WT and TP concentrations in the ponds were evidently higher compared to those in the lake. Especially, in August, the TP concentration in the ponds was six times higher than that in the lake because nutrient control in ponds was more difficult given the need to regularly feed farmed animal and the excretion of waste. Cyanobacteria are known to flourish with relatively high WT and nutrient levels, conditions prevailing in crab culture ponds. Furthermore, crab ponds with distinctly lower values of TN:TP ratios were characterized by a higher proportion of filamentous cyanobacteria compared to the lake, which may be attributed to the fact that most of filamentous cyanobacteria have the capacity of nitrogen fixation [35].
Whilst some studies suggested that cyanobacteria can dominate in both low and high phosphorus conditions [36], our study found that the total phosphorus was the major positive driving factor in governing the cyanobacteria abundance, and nitrogen was not a limiting factor for cyanobacteria proliferation. Numerous studies revealed that increased phosphorus concentrations could lead to high cyanobacteria abundance [37,38]. For example, Andersson et al. (2015) reported the increase of Nostocales was caused by the rise of total phosphorus and decrease of dissolved inorganic nitrogen in the coastal Bothnian Sea, which could support our results. Furthermore, the abundance of cyanobacteria was also related to the alkaline conditions. For instance, the dominant species Oscillatoria and Dolichospermum were positively correlated with pH in the lake (Figure 7 and Figure 8). However, some of the cyanobacteria taxa (e.g., Planktolyngbya, Aphanizomenon, Raphidiopsis, etc.) in the aquaculture ponds were negatively correlated with pH, where the water was alkaline on average. On one hand, high pH is the result of photosynthesis of cyanobacteria, where the consumption of carbon dioxide would lead to a rise in the pH of the water [39]. On the other hand, such alkaline conditions foreordained cyanobacteria being dominant owing to the reduced efficiency of other phytoplankton species to utilize carbon at high pH [40].
Despite the growing interest in investigating the dynamics of cyanobacteria in freshwater bodies, little effort has been made to account for the composition of cyanobacteria and its threat in crab aquaculture-impacted water bodies, especially crab-culturing ponds. From the results of the present study, the known potential cyanotoxin producers, species like R. raciborskii (synonym: Cylindrospermopsis raciborskii) and D. circinale (synonym: Anabaena circinale) [26,41], were abundant taxa found in the crab ponds and the peak abundances of these species occurred in summer. In the ponds, R. raciborskii and D. circinale were positively correlated with WT, WD, CODMn and TP; negatively correlated with NO3-N and N:P ratio (Figure 7 and Figure 8). Crab ponds with the higher values of WT, WD, TP and CODMn concentration and the lower concentration of NO3-N and N:P ratio would benefit these species in summer. Their excessive expansion suggests a high risk of potential cyanotoxins existing in the ponds and associated cyanotoxins to humans through intake of aquatic products, which could cause serious social and economic losses simultaneously [42,43]. With intensifying eutrophication and global warming, R. raciborskii as an invasive species began to dominate many lakes and reservoirs in China, and the known concentration of CYNs could hit 8.25 μg/L in reservoirs [44,45]. Nonetheless, the current study did not evaluate cyanotoxin levels in freshwater and “seafood” products. Hence, future studies should investigate cyanotoxin, taste and odor levels associated with the abundance of harmful cyanobacteria.
The current study reflected the importance of establishing rational management of the crab culturing industry and controlling the excessive expansion of cyanobacteria in crab culture ponds. Moreover, it is necessary to strengthen the treatment of crab culture wastewater before being discharged into the neighboring lakes in order to reduce the pollution in the lake. According to the survey results of pollution sources and pollution load of Lake Guchenghu in 2012, the main pollution sources were aquaculture culture, industrial wastewater, domestic sewage and crop farming. Aquaculture culture has become the primary source of pollutants in the Lake Guchenghu area [11]. Regular monitoring of cyanobacteria and cyanotoxin in these mitten crab culture-impacted water bodies is recommended in order to avoid the large-scale cyanobacteria proliferation, and control their harmful impact on freshwater “seafood” products and human health.

5. Conclusions

The present study demonstrated that the activities of mitten crab culture played a certain role in the change of cyanobacterial community structure. In mitten crab ponds, whilst cyanobacteria could be found throughout the year, the period related to the highest risk was August (summer) because cyanobacteria (including several potentially harmful species) were most abundant during this time of the year with biomass reaching 46.80 mg/L. By contrast, the cyanobacteria biomass (3.86 mg/L) peaked in November in the nearby lake, accounting for a smaller proportion of the total phytoplankton biomass which have relatively low risk. RDA and Pearson correlation analyses indicated that N:P ratio, CODMn, TP and NO2-N had significant influence on cyanobacteria abundance in the lake, whereas WT, N:P ratio and TP played an important role in cyanobacteria dynamics in mitten crab culture ponds. This also confirmed that cyanobacteria development was not always affected by the same set of environmental factors in different types of habitats. The results of this study suggested that regular monitoring on cyanobacteria dynamics in aquaculture-impacted water bodies is necessary to accurately evaluate cyanobacteria species’ responses to environmental changes, and predict the risk of harmful cyanobacterial blooms.

Supplementary Materials

The following are available online at https://www.mdpi.com/2073-4441/11/12/2468/s1, Table S1: The list of cyanobacteria species in Lake Guchenghu and adjacent mitten crab ponds (May 2017–February 2018); Table S2: Cyanobacteria community metrics (mean ± standard deviation) observed over four study seasons in Lake Guchenghu basin. Values were calculated from all sites for each season; Table S4: Summary of redundancy analysis between environmental factors and cyanobacteria abundance in Lake Guchenghu and adjacent mitten crab ponds; Table S5: The correlation matrix between RDA axes and environmental factors in Lake Guchenghu from May 2017 to February 2018; Table S6: The correlation matrix between RDA axes and environmental factors in mitten crab ponds from May 2017 to February 2018; Table S7: Results of Pearson correlation between dominant cyanobacteria species and environmental parameters in Lake Guchenghu and adjacent mitten crab ponds.

Author Contributions

Conceptualization, X.G. and H.L.; Methodology, H.C. and Z.M.; Formal analysis, H.L., H.C. and H.D.; Investigation, H.C., Z.M. and Q.Z.; Writing-original draft preparation, H.L.; Writing-review and editing, H.L., H.C. and Z.M.

Funding

This work was supported by the National “Twelfth Five-Year” Plan for Science & Technology (No. 2015BAD13B06), National Natural Science Foundation of China (No. 31870449), Water Conservancy Science and Technology Project of Jiangsu Province (No. 2017013), Water environment governance projects of Taihu (TH2018303), the National Key R & D Program of China (No. 2018YFD0900804) and the Major Science and Technology Program for Water Pollution Control and Treatment (2017ZX07204005).

Acknowledgments

We thank Yuting Wang for her guidance in the data analysis phase.

Conflicts of Interest

The authors declare no conflict of interest.

References

  1. Cremona, F.; Tuvikene, L.; Haberman, J.; Nõges, P.; Nõges, T. Factors controlling the three-decade long rise in cyanobacteria biomass in a eutrophic shallow lake. Sci. Total Environ. 2018, 621, 352–359. [Google Scholar] [CrossRef]
  2. Havens, K.E.; Ji, G.; Beaver, J.R.; Fulton, R.S.; Teacher, C.E. Dynamics of cyanobacteria blooms are linked to the hydrology of shallow Florida lakes and provide insight into possible impacts of climate change. Hydrobiologia 2019, 829, 43–59. [Google Scholar] [CrossRef]
  3. Lenard, T.; Ejankowski, W.; Poniewozik, M. Responses of Phytoplankton Communities in Selected Eutrophic Lakes to Variable Weather Conditions. Water 2019, 11, 1207. [Google Scholar] [CrossRef]
  4. Hu, X.; Zhang, R.; Ye, J.; Wu, X.; Zhang, Y.; Wu, C. Monitoring and research of microcystins and environmental factors in a typical artificial freshwater aquaculture pond. Environ. Sci. Pollut. Res. 2018, 25, 5921–5933. [Google Scholar] [CrossRef] [PubMed]
  5. Ndlela, L.L.; Oberholster, P.J.; Van, W.J.H.; Cheng, P. An overview of cyanobacterial bloom occurrences and research in Africa over the last decade. Harmful Algae 2016, 60, 11–26. [Google Scholar] [CrossRef]
  6. Liao, J.; Zhao, L.; Cao, X.; Sun, J.; Gao, Z.; Wang, J.; Jiang, D.; Fan, H.; Huang, Y. Cyanobacteria in lakes on Yungui Plateau, China are assembled via niche processes driven by water physicochemical property, lake morphology and watershed land-use. Sci. Rep. 2016, 6, 36357. [Google Scholar] [CrossRef]
  7. Alvarez, S.; Lupi, F.; Solís, D.; Thomas, M. Valuing Provision Scenarios of Coastal Ecosystem Services: The Case of Boat Ramp Closures Due to Harmful Algae Blooms in Florida. Water 2019, 11, 1250. [Google Scholar] [CrossRef]
  8. Zeng, Q.; Jeppesen, E.; Gu, X.; Mao, Z.; Chen, H. Cannibalism and Habitat Selection of Cultured Chinese Mitten Crab: Effects of Submerged Aquatic Vegetation with Different Nutritional and Refuge Values. Water 2018, 10, 1542. [Google Scholar] [CrossRef]
  9. Cai, C.; Gu, X.; Huang, H.; Dai, X.; Ye, Y.; Shi, C. Water quality, nutrient budget, and pollutant loads in Chinese mitten crab (Eriocheir sinensis) farms around East Taihu Lake. Chin. J. Oceanol. Limn. 2012, 30, 29–36. [Google Scholar] [CrossRef]
  10. Zeng, Q.; Gu, X.; Chen, X.; Mao, Z. The impact of Chinese mitten crab culture on water quality, sediment and the pelagic and macrobenthic community in the reclamation area of Guchenghu Lake. Fish. Sci. 2013, 79, 689–697. [Google Scholar] [CrossRef]
  11. Gu, X.K.; Gu, X.H.; Zeng, Q.F.; Mao, Z.G.; Li, X.G.; Wang, Y.P.; Wang, W.X. Spatial-Temporal Variation and Developing Tendency of Water Quality in Gucheng Lake and Inlets and Outlets of the Lake. J. Ecol. Rural Environ. 2016, 32, 68–75. [Google Scholar]
  12. Fortin, N.; Aranda-Rodriguez, R.; Jing, H.; Pick, F.; Bird, D.; Greer, C.W. Detection of microcystin-producing cyanobacteria in Missisquoi Bay, Quebec, Canada, using quantitative PCR. Appl. Environ. Microbiol. 2010, 76, 5105–5112. [Google Scholar] [CrossRef] [PubMed]
  13. Brasil, J.; Attayde, J.L.; Vasconcelos, F.R.; Dantas, D.D.; Huszar, V.L. Drought-induced water-level reduction favors cyanobacteria blooms in tropical shallow lakes. Hydrobiologia 2016, 770, 145–164. [Google Scholar] [CrossRef]
  14. Yang, C.; Nan, J.; Li, J. Driving factors and dynamics of phytoplankton community and functional groups in an estuary reservoir in the Yangtze River, China. Water 2019, 11, 1184. [Google Scholar] [CrossRef]
  15. Bullerjahn, G.S.; McKay, R.M.; Davis, T.W.; Baker, D.B.; Boyer, G.L.; Anglada, L.V.; Doucette, G.J.; Ho, J.C.; Irwin, E.G.; Kling, C.L. Global solutions to regional problems: Collecting global expertise to address the problem of harmful cyanobacterial blooms. A Lake Erie case study. Harmful Algae 2016, 54, 223–238. [Google Scholar] [CrossRef]
  16. Funari, E.; Manganelli, M.; Buratti, F.M.; Testai, E. Cyanobacteria blooms in water: Italian guidelines to assess and manage the risk associated to bathing and recreational activities. Sci. Total Environ. 2017, 598, 867–880. [Google Scholar] [CrossRef]
  17. Conley, D.J.; Paerl, H.W.; Howarth, R.W.; Boesch, D.F.; Seitzinger, S.P.; Havens, K.E.; Lancelot, C.; Likens, G.E. Controlling eutrophication: Nitrogen and phosphorus. Science 2009, 323, 1014–1015. [Google Scholar] [CrossRef]
  18. Heisler, J.; Glibert, P.M.; Burkholder, J.M.; Anderson, D.M.; Cochlan, W.; Dennison, W.C.; Dortch, Q.; Gobler, C.J.; Heil, C.A.; Humphries, E. Eutrophication and harmful algal blooms: A scientific consensus. Harmful Algae 2008, 8, 3–13. [Google Scholar] [CrossRef]
  19. Chan, F.; Pace, M.L.; Howarth, R.W.; Marino, R.M. Bloom formation in heterocystic nitrogen-fixing cyanobacteria: The dependence on colony size and zooplankton grazing. Limnol. Oceanogr. 2004, 49, 2171–2178. [Google Scholar] [CrossRef]
  20. Lee, T.A.; Rollwagen-Bollens, G.; Bollens, S.M.; Faber-Hammond, J.J. Environmental influence on cyanobacteria abundance and microcystin toxin production in a shallow temperate lake. Ecotoxicol. Environ. Saf. 2015, 114, 318–325. [Google Scholar] [CrossRef]
  21. Woodhouse, J.N.; Kinsela, A.S.; Collins, R.N.; Bowling, L.C.; Honeyman, G.L.; Holliday, J.K.; Neilan, B.A. Microbial communities reflect temporal changes in cyanobacterial composition in a shallow ephemeral freshwater lake. ISME J. 2016, 10, 1337–1351. [Google Scholar] [CrossRef] [PubMed]
  22. Zeng, Q.; Gu, X.; Mao, Z.; Sun, M.; Gu, X. Assessment of trophic levels and phytoplankton variation in Guchenghu Lake and canal route. Chin. Environ. Sci. 2012, 32, 1487–1494. [Google Scholar]
  23. Jin, X.C.; Tu, Q.Y. The Standard Methods for Observation and Analysis in Lake Eutrophication; China Environmental Science Press: Beijing, China, 1990; p. 240. [Google Scholar]
  24. Hu, H. The Freshwater Algae of China: Systematics, Taxonomy and Ecology; Science Press: Beijing, China, 2006. [Google Scholar]
  25. Hillebrand, H.; Dürselen, C.; Kirschtel, D.; Pollingher, U.; Zohary, T. Biovolume calculation for pelagic and benthic microalgae. J. Phycol. 1999, 35, 403–424. [Google Scholar] [CrossRef]
  26. Carmichael, W.W. Health Effects of Toxin-Producing Cyanobacteria: “The CyanoHABs”. Hum. Ecol. Risk Assess. Int. J. 2001, 7, 1393–1407. [Google Scholar] [CrossRef]
  27. Clarke, K.R. Non-parametric multivariate analyses of changes in community structure. Aust. J. Ecol. 1993, 18, 117–143. [Google Scholar] [CrossRef]
  28. Walls, J.T.; Wyatt, K.H.; Doll, J.C.; Rubenstein, E.M.; Rober, A.R. Hot and toxic: Temperature regulates microcystin release from cyanobacteria. Sci. Total Environ. 2018, 610, 786–795. [Google Scholar] [CrossRef]
  29. Pilkaitytė, R.; Razinkovas, A. Seasonal changes in phytoplankton composition and nutrient limitation in a shallow Baltic lagoon. Boreal Environ. Res. 2007, 12, 551–559. [Google Scholar]
  30. Dalu, T.; Wasserman, R.J. Cyanobacteria dynamics in a small tropical reservoir: Understanding spatio-temporal variability and influence of environmental variables. Sci. Total Environ. 2018, 643, 835–841. [Google Scholar] [CrossRef]
  31. Qin, X.B.; Huang, P.Y.; Liu, M.H.; Ma, C.X.; Yu, H.X. Phytoplankton assemblage classification in Anbang river wetland in summer. South Chin. Fish. Sci. 2007, 3, 1–7. [Google Scholar]
  32. Yang, J.; Lv, H.; Liu, L.; Yu, X.; Chen, H. Decline in water level boosts cyanobacteria dominance in subtropical reservoirs. Sci. Total Environ. 2016, 557, 445–452. [Google Scholar] [CrossRef]
  33. Liu, L.; Liu, D.F.; Johnson, D.M.; Yi, Z.Q.; Huang, Y.L. Effects of vertical mixing on phytoplankton blooms in Xiangxi Bay of Three Gorges Reservoir: Implications for management. Water Res. 2012, 46, 2121–2130. [Google Scholar] [CrossRef] [PubMed]
  34. Wantzen, K.M.; Rothhaupt, K.O.; Mörtl, M.; Cantonati, M.; László, G.; Fischer, P. Ecological effects of water-level fluctuations in lakes: An urgent issue. Hydrobiologia 2008, 613, 1–4. [Google Scholar] [CrossRef]
  35. Bothe, H.; Schmitz, O.; Yates, M.G. Newton WE Nitrogen fixation and hydrogen metabolism in cyanobacteria. Microbiol. Mol. Biol. Rev. 2010, 74, 529–551. [Google Scholar] [CrossRef]
  36. Carey, C.C.; Ibelings, B.W.; Hoffmann, E.P.; Hamilton, D.P.; Brookes, J.D. Eco-physiological adaptations that favour freshwater cyanobacteria in a changing climate. Water Res. 2012, 46, 1394–1407. [Google Scholar] [CrossRef] [PubMed]
  37. An, W.C.; Li, X.M. Phosphate adsorption characteristics at the sediment—Water interface and phosphorus fractions in Nansi Lake, China, and its main inflow rivers. Environ. Monit. Assess. 2009, 148, 173–184. [Google Scholar] [CrossRef]
  38. Andersson, A.; Höglander, H.; Karlsson, C.; Huseby, S. Key role of phosphorus and nitrogen in regulating cyanobacterial community composition in the northern Baltic Sea. Estuar. Coast. Shelf Sci. 2015, 164, 161–171. [Google Scholar] [CrossRef] [Green Version]
  39. Paerl, H.W.; Paul, V.J. Climate change: Links to global expansion of harmful cyanobacteria. Water Res. 2012, 46, 1349–1363. [Google Scholar] [CrossRef]
  40. Dokulil, M.T.; Teubner, K. Cyanobacterial dominance in lakes. Hydrobiologia 2000, 438, 1–12. [Google Scholar] [CrossRef]
  41. Antunes, J.T.; Leão, P.N.; Vasconcelos, V.M. Cylindrospermopsis raciborskii: Review of the distribution, phylogeography, and ecophysiology of a global invasive species. Front. Microbiol. 2015, 6, 473. [Google Scholar] [CrossRef] [Green Version]
  42. Kozak, A.; Celewicz-Gołdyn, S.; Kuczyńska-Kippen, N. Cyanobacteria in small water bodies: The effect of habitat and catchment area conditions. Sci. Total Environ. 2019, 646, 1578–1587. [Google Scholar] [CrossRef]
  43. Drobac, D.; Tokodi, N.; Lujić, J.; Marinović, Z.; Subakov-Simić, G.; Dulić, T.; Važić, T.; Nybom, S.; Meriluoto, J.; Codd, G.A. Cyanobacteria and cyanotoxins in fishponds and their effects on fish tissue. Harmful Algae 2016, 55, 66–76. [Google Scholar] [CrossRef] [PubMed]
  44. Lei, L.; Peng, L.; Huang, X.; Han, B. Occurrence and dominance of Cylindrospermopsis raciborskii and dissolved cylindrospermopsin in urban reservoirs used for drinking water supply. South China Environ. Monit. Assess. 2014, 186, 3079–3090. [Google Scholar] [CrossRef] [PubMed]
  45. Liu, L.; Chen, H.; Liu, M.; Yang, J.R.; Xiao, P.; Wilkinson, D.M.; Yang, J. Response of the eukaryotic plankton community to the cyanobacterial biomass cycle over 6 years in two subtropical reservoirs. ISME J. 2019, 13, 2196–2208. [Google Scholar] [CrossRef] [PubMed] [Green Version]
Figure 1. Location of sampling points in Lake Guchenghu and adjacent mitten crab ponds.
Water 11 02468 g001
Figure 2. Changes of total phytoplankton abundance and biomass, cyanobacteria abundance and biomass, and cyanobacteria proportion in Lake Guchenghu and adjacent mitten crab ponds from May 2017 to February 2018 ((A1,A2): Lake; (B1,B2): Ponds).
Water 11 02468 g002
Figure 3. Seasonal variation of cyanobacteria community in Lake Guchenghu and adjacent mitten crab ponds from May 2017 to February 2018 (A): Lake; (B): Ponds.
Water 11 02468 g003
Figure 4. The proportion of filamentous cyanobacteria to total cyanobacteria in Lake Guchenghu and adjacent mitten crab ponds from May 2017 to February 2018. Asterisks above the bars indicate significant differences with respect to the lake area (* P < 0.05, ** P < 0.01).
Water 11 02468 g004
Figure 5. Non-metric multidimensional scaling (NMDS) ordination of cyanobacteria community in Lake Guchenghu and adjacent mitten crab ponds among different months. ((A): Lake; (B): Ponds; (C): May 2017; (D): August 2017; (E): November 2017; (F): February 2018. The first four digits of the number represent the sampling time, and the last two digits represent the sampling point.).
Water 11 02468 g005
Figure 6. Similarity analysis for cyanobacteria community in Lake Guchenghu and adjacent mitten crab ponds among different months by cluster analysis. (Green for May; Blue for August; Pink for November; and Yellow for February.) (“L” represents Lake; “P” represents Ponds; the first four digits of the number represent the sampling time, and the last two digits represent the sampling point.).
Water 11 02468 g006
Figure 7. Ordination diagram of redundancy analysis (RDA) for cyanobacteria community associated with environmental factors in Lake Guchenghu and adjacent mitten crab ponds ((A): Lake; (B): Ponds).
Water 11 02468 g007
Figure 8. The results of Pearson correlation between predominant cyanobacteria species and environmental parameters in Lake Guchenghu and adjacent mitten crab ponds ((A): lake; (B): ponds).
Water 11 02468 g008
Table 1. Mean ± standard deviation (SD) value of environmental parameters in thirteen sampling stations of Lake Guchenghu and adjacent mitten crab ponds measured from May 2017 to February 2018.
VariableMay, 2017August, 2017November, 2017February, 2018
LakePondsLakePondsLakePondsLakePonds
pH8.23 ± 0.198.76 ± 0.42 *9.15 ± 0.178.24 ± 0.41 *7.61 ± 0.237.06 ± 0.25 *7.43 ± 0.137.45 ± 0.06
WT/(°C)21.15 ± 0.7524.93 ± 1.81 *29.47 ± 0.3131.01 ± 1.54 *18.37 ± 0.2518.40 ± 0.183.10 ± 0.143.12 ± 1.53
DO/(mg/L)12.43 ± 2.0410.23 ± 0.75 *11.19 ± 0.3916.49 ± 4.82 *10.37 ± 0.7612.89 ± 4.7513.68 ± 7.3316.90 ± 2.67 *
WD/(m)2.82 ± 0.891.11 ± 0.02 *4.12 ± 0.551.13 ± 0.01 *4.19 ± 0.330.98 ± 0.02 *4.05 ± 0.310.74 ± 0.27 *
Turb/(NTU)7.02 ± 4.8419.5 ± 7.81 *26.3 ± 12.0827.9 ± 6.9318.9 ± 1.6245.2 ± 24.8 *4.46 ± 1.1045.9 ± 19.71 *
NO2-N/(mg/L)0.03 ± 0.000.02 ± 0.01 *0.04 ± 0.010.025 ± 0.010.02 ± 0.010.01 ± 0.010.07 ± 0.050.03 ± 0.03
NO 3 -N/(mg/L)0.56 ± 0.070.32 ± 0.28 *0.45 ± 0.140.23 ± 0.18 *0.13 ± 0.040.16 ± 0.131.87 ± 1.110.67 ± 1.01
NH4+-N/(mg/L)0.05 ± 0.020.34 ± 0.30 *0.05 ± 0.020.17 ± 0.14 *0.11 ± 0.040.17 ± 0.140.15 ± 0.032.51 ± 3.81
TN/(mg/L)1.02 ± 0.112.00 ± 0.54 *1.18 ± 0.171.57 ± 0.48 *1.25 ± 0.071.66 ± 0.752.47 ± 1.493.04 ± 2.62
TP/(mg/L)0.02 ± 0.010.09 ± 0.02 *0.03 ± 0.010.18 ± 0.10 *0.22 ± 0.020.36 ± 0.11 *0.04 ± 0.000.14 ± 0.08 *
N:P59.6 ± 17.622.5 ± 9.62 *35.5 ± 4.7411.4 ± 5.75 *5.75 ± 0.344.39 ± 0.87 *62.5 ± 41.823.0 ± 16.8
CODMn/(mg/L)4.14 ± 0.309.19 ± 1.31 *2.86 ± 0.196.22 ± 1.28 *4.37 ± 0.184.64 ± 2.074.05 ± 0.617.62 ± 3.03
WT—water temperature; DO—dissolved oxygen; WD—water depth; TN—total nitrogen; Turb—turbidity; TP—total phosphorous; N:P—ratio of total nitrogen to total phosphorus; CODMn—permanganate index (chemical oxygen demand). Asterisks beside the data of ponds indicate significant differences with respect to the value of lake area (* P < 0.05).
Table 2. Potential toxin producing species recorded in Lake Guchenghu and adjacent mitten crab ponds.
Species aFamilyMaximum Abundance
LakePonds
Planktothrix agardhiiOscillatoriaceae1.1 × 105 cells/L in November--
Dolichospermum circinale (synonym: Anabaena circinale)Nostocaceae1.2 × 105 cells/L in August3.6 × 106 cells/L in August
Raphidiopsis raciborskii(synonym: Cylindrospermopsis raciborskii)Nostocaceae--8.2 × 10⁶ cells/L in August
Cuspidothrix issatschenkoi (synonym: Aphanizomenon issatschenkoi”)Nostocaceae--4.5×10⁴ cells/L in November
Aphanizomenon flos-aquaeNostocaceae1.9 × 105 cells/L in August--
a Potential toxin producing species were identified based on [26] --Nonexistence.

