Transport of Microplastic Particles in Saturated Porous Media

1
Department of Soil and Water Sciences, China Agricultural University, Beijing 100193, China
2
Department of Environmental Engineering, Tianjin University, Tianjin 300072, China
3
College of Pratacultural and Environmental Science, Xinjiang Agricultural University, Urumqi 830052, Xinjiang, China
*
Author to whom correspondence should be addressed.
Water 2019, 11(12), 2474; https://doi.org/10.3390/w11122474
Submission received: 5 October 2019
/
Revised: 10 November 2019
/
Accepted: 16 November 2019
/
Published: 24 November 2019
(This article belongs to the Special Issue Colloid and Pathogen Transport in Groundwater)
Abstract
:This study used polystyrene latex colloids as model microplastic particles (MPs) and systematically investigated their retention and transport in glass bead-packed columns. Different pore volumes (PVs) of MP influent suspension were first injected into the columns at different ionic strengths (ISs). The breakthrough curves (BTCs) were obtained by measuring the MP concentrations of the effluents. Column dissection was then implemented to obtain retention profiles (RPs) of the MPs by measuring the concentration of attached MPs at different column depths. The results showed that the variation in the concentrations of retained MPs with depth changed from monotonic to non-monotonic with the increase in the PV of the injected influent suspension and solution IS. The non-monotonic retention was attributed to blocking of MPs and transfer of these colloids among collectors in the down-gradient direction. The BTCs were well simulated by the convection-diffusion equation including two types of first-order kinetic deposition (i.e., reversible and irreversible attachment). However, this model could not well simulate the non-monotonic retention profiles due to the fact that the transfer of colloids among collectors was not considered. The results in this study are critical to developing models to simulate the fate and transport of MPs in porous media such as soil.
1. Introduction
Plastic, such as polyethylene and polystyrene polymer, is widely used due to the fact of its easy manufacturing, low cost, and stable chemical properties [1]. The extensive production and use of plastics have caused considerable release of them into the environment. The released plastic products can be decomposed into microplastic particles (MPs), i.e., plastic particles or flakes with diameters ranging from 100 nm to 5 mm [2,3]. The MPs are widely found in rivers [4], sedimentary habitats [5], and soil [6,7]. These MPs can further enter into the food chain and pose threat to humans and organisms [6]. Therefore, it is of significant importance for understanding the fate and transport of MPs in the environment, such as soil, to accurately assess their environmental risks.
The well-known colloid filtration theory (CFT) has been widely utilized to predict the transport of colloid particles in soil porous media [8,9,10]. The CFT takes deposition as the major process controlling particle transport in porous media, which is controlled by Brownian diffusion, interception, and sedimentation. The deposition is quantified by calculating the single collector removal efficiency (η) in the CFT which is defined as the ratio of the rate of colloid deposition onto a collector to the convective transport of upstream particles toward the projected area of the collector [11,12].
The CFT successfully predicted colloid transport in porous media by determining the value of η under favorable chemical conditions (i.e., in the absence of repulsive Derjaguin–Landau–Verwey–Overbeek (DLVO) interaction energies). However, considerable discrepancies existed between the CFT prediction and experimental observations under unfavorable chemical conditions. In this case, an empirical parameter (i.e., attachment efficiency α) was introduced, and the value of η is a product of α and η0 (single collector contact efficiency). The η0 means the rate at which particles strike a collector surface to the rate at which particles flow toward the collector [11,12]. The α describes the fraction of collisions with collectors that cause attachment.
The value of η0 can be theoretically calculated by various correlation equations developed in the literature as summarized in Shen et al. [10] and Molnar et al. [13]. The value of α can be experimentally determined by conducting column experiments to obtain breakthrough curves (BTCs). In addition to the BTCs, the retention profiles (RPs, the variation in the concentration of retained MPs with depth of a column) can also be obtained by column dissection to reveal mechanisms controlling colloid transport in porous media [14,15,16]. For example, the CFT predicts that the concentration of retained colloids in porous media decreases exponentially with increasing travel distance. The results are in agreement with the experimental observations conducted under favorable conditions. However, the RPs were frequently found to be non-exponential under unfavorable conditions [15,17,18,19,20,21,22,23,24,25]. For example, hyper-exponential RPs have been frequently observed [9,20,21,26,27] which are attributed to the heterogeneities of collector surfaces or colloid populations [28,29,30] and staining [9,31,32].
Non-monotonic RPs, the concentration of retained colloids which firstly increase and then decrease with the distance from the column inlet, have also been reported [22,23,24,25,30,33,34]. Surface heterogeneity has been used to explain non-monotonic RPs [35]. Specifically, the surface heterogeneity can cause the depth of the secondary minimum varying from 0 kT to several tens of kT (k is Boltzmann constant and T is absolute temperature). The secondary minima with depths comparable to the average kinetic energy of a colloid (i.e., 1.5 kT) can only temporarily immobilize colloids. These colloids can be released by Brownian diffusion and then reattached onto collectors in a down-gradient direction. Release and reattachment have been observed in microscopic experiments [36]. Such detachment and reattachment could cause the non-monotonic RPs. In addition, several theoretical studies hypothesized that the transfer of colloids via secondary-minimum association among collectors could also cause the non-monotonic RPs [24,34,37,38,39]. However, such transfer of colloids via secondary-minimum association among collectors in porous media has not been experimentally observed to date.
The objective of this study was thus to testify to whether the transfer of colloids among collectors that existed in porous media could occur for MPs by conducting column experiments using carboxyl-modified polystyrene latex colloids as model MP colloids. Different pore volumes (PVs) of MP influent suspensions were injected into the glass bead-packed columns, and the column dissections were done to measure the RPs. We observed down-gradient movement of the peaks of the RPs with the increase in the PV, verifying the transfer of MPs among collectors. The findings in this study are important for developing models to accurately predict fate and transport of MPs in the subsurface environments.
2. Materials and Methods
2.1. MPs and Porous Media
The model MPs used were polystyrene latex colloids with carboxyl functional groups which had a density of 1.055 g cm−3 and an average diameter of 1 μm. The latex colloids were added into NaCl electrolyte solution at different ionic strengths (ISs, i.e., 0.001, 0.01, 0.1, and 0.2 M), resulting in a concentration of 20 mg L−1 MP suspensions for column transport experiments. We adjusted the pH of the MP suspensions to 7 by adding HCl and NaOH. A Zetasizer Nano ZS90 was adopted to measure the hydrodynamic diameters and zeta potentials of MPs at different ISs.
Glass beads, ranging in size from 250 to 300 μm, were used as model collectors for packing the columns. The method of Elimelech and O’Melia [40] was used to remove impurities from the glass bead surfaces. In brief, the glass beads were thoroughly washed by deionized (DI) water, soaked in 1 M HNO3 for 10 h at 20 °C, and cleaned with DI water. The zeta potentials of the glass beads were measured by the method of Tufenkji and Elimelech [41]. Briefly, 7 g of clean glass beads were placed in 15 mL electrolyte solution at different ISs, followed by sonicating of the suspension for 20 min. Then the supernatant was taken for the measurement.
2.2. Column Transport Experiments
Transport experiments of MPs were carried out in acrylic columns that were wet-packed with clean glass beads. The inner diameter of the acrylic column was 3 cm and the length was 10 cm. The porosities of the packed columns (f) were approximately 0.36 which were calculated according to the following equation:
where m is the dry mass of the glass beads in packed columns, ρ is the glass beads density, and V is the column volume.
All column transport experiments adopted a flow velocity of 3 × 10⁻⁵ m s−1. Prior to each transport experiment, 20 PVs of background NaCl electrolyte solution was injected into the column firstly to balance the pore aqueous solution chemistry. Then, different PVs (2, 10, or 50 PVs) of the MP suspension were delivered to the column to allow the MPs attached on the surfaces of the glass beads (phase 1). Finally, a background electrolyte solution with no MPs was injected to displace the MPs that remained in the pores of the porous media (phase 2). A UV-Vis spectrophotometry was used for the determination of the effluent concentration of the MPs at a wavelength of 430 nm.
2.3. Column Dissection Experiments
The packed bed in each column was divided into ten 1 cm long segments following the transport experiment to gain the RPs of the MPs using the method by Li et al. [33]. Briefly, attached MPs were released by placing the glass beads from the dissection into DI water. The suspension was sonicated for 1 min and shaken for a few seconds, and the concentrations of released MPs in the supernatant samples were determined. Blank experiments were also done to check whether colloidal impurities could be released from glass beads. Specially, the column experiments were done using the same procedure as above expect that an MP-free suspension was used in phase 1 instead of MP suspensions.
The fractions of MPs recovered from the column experiments in different phases (M12, phase 1 and 2; Ms, column dissection; MT, total mass recovery = M12 + M2) were calculated by dividing the recovered mass of each phase by the total input mass.
2.4. Calculation of Attachment Efficiency
The value of α can be obtained by conducting column experiments and calculated by the following expression:
where C is the MP concentration in the aqueous phase, C0 is the initial influent concentration, dc is the glass beads’ diameter, f is the porosity of the packed column, and L is the length of the column. The value of C/C0 was obtained from BTCs by averaging those measured between PVs 1.8 and 2 [41,42,43].
2.5. DLVO Interaction Energy Calculations
The mechanisms of attachment of the MPs on the glass beads were interpreted by calculating interaction energies at different ISs using the DLVO theory. The surfaces of MPs and the glass beads were assumed to be spherical and planar, respectively. The total DLVO energy (U) between a sphere and a planar surface was the summation of van der Waals attraction (UVDW), Born repulsion (UBR), and double layer interaction energy (UDL) [42,43,44,45,46,47]. The UVDW, UBR, and UDL were calculated using the expressions developed by Gregory [48], Ruckenstein and Prieve [49], and Hogg et al. [50], respectively.
where A is Hamaker constant for a glass–water–polystyrene system, ap is the MP radius, h is the separation distance between MPs and glass beads, λ is the characteristic wavelength of the dielectric, usually taken to be 100 nm, χ is the Born collision parameter, taken to be 0.5 nm, ε0 is the permittivity of free space, ε is the permittivity of water, ψp and ψc are the zeta potentials of the MP and glass beads, respectively, and κ is the inverse Debye screening length. A value of 1 × 10⁻²⁰ was chosen for the Hamaker constant of a glass–water–polystyrene system, as has been adopted in previous studies [40,51,52].
2.6. Transport Model
Under unfavorable conditions, colloids could be retained in both primary and secondary minima which are considered to be reversible and irreversible, respectively [41,47]. As is discussed later, both primary and secondary minimum attachments of MPs occur in the porous media. Therefore, both attachments were considered in the model. The one-dimensional convection–dispersion equation including the two attachments is written as:
where C is the MP concentration in the aqueous phase, t is time, ρ is the bulk density of porous media, S is the solid phase concentration, with subscripts 1 and 2 representing the aforementioned two attachment sites, x is the transport distance, D is the diffusion coefficient, and v is the Darcy’s flux. S1 and S2 are described as:
where ka and kd are the rate of first-order deposition (attachment) and entrainment (detachment), respectively, and ψ is a dimensionless colloid retention function, which is used to explain the blocking effects. The blocking means that colloids deposited on collector surfaces inhibited the attachment of subsequent approach colloids from solution [31]. A Langmuirian dynamics equation [53] has been proposed for ψ to describe the blocking as:
where Smax is the maximum solid phase concentration.
The model adopted a zero initial influent concentration, pulse input, and a zero concentration-gradient boundary concentration [54]. Similar to previous studies [55,56,57], the value of D for the porous media of glass beads were determined by simulating the BTCs data of tracer Cl− using the model with both ka and kd equal to 0. Note that the value of D for the MPs and tracer Cl− might be different [58]. The values of attachment parameters were obtained by simulating the MP breakthrough data using the transport model [59]. The aforementioned simulations were done using the Hydrus 1-D software.
3. Results and Discussion
3.1. Electrokinetic Properties of MPs and Collectors
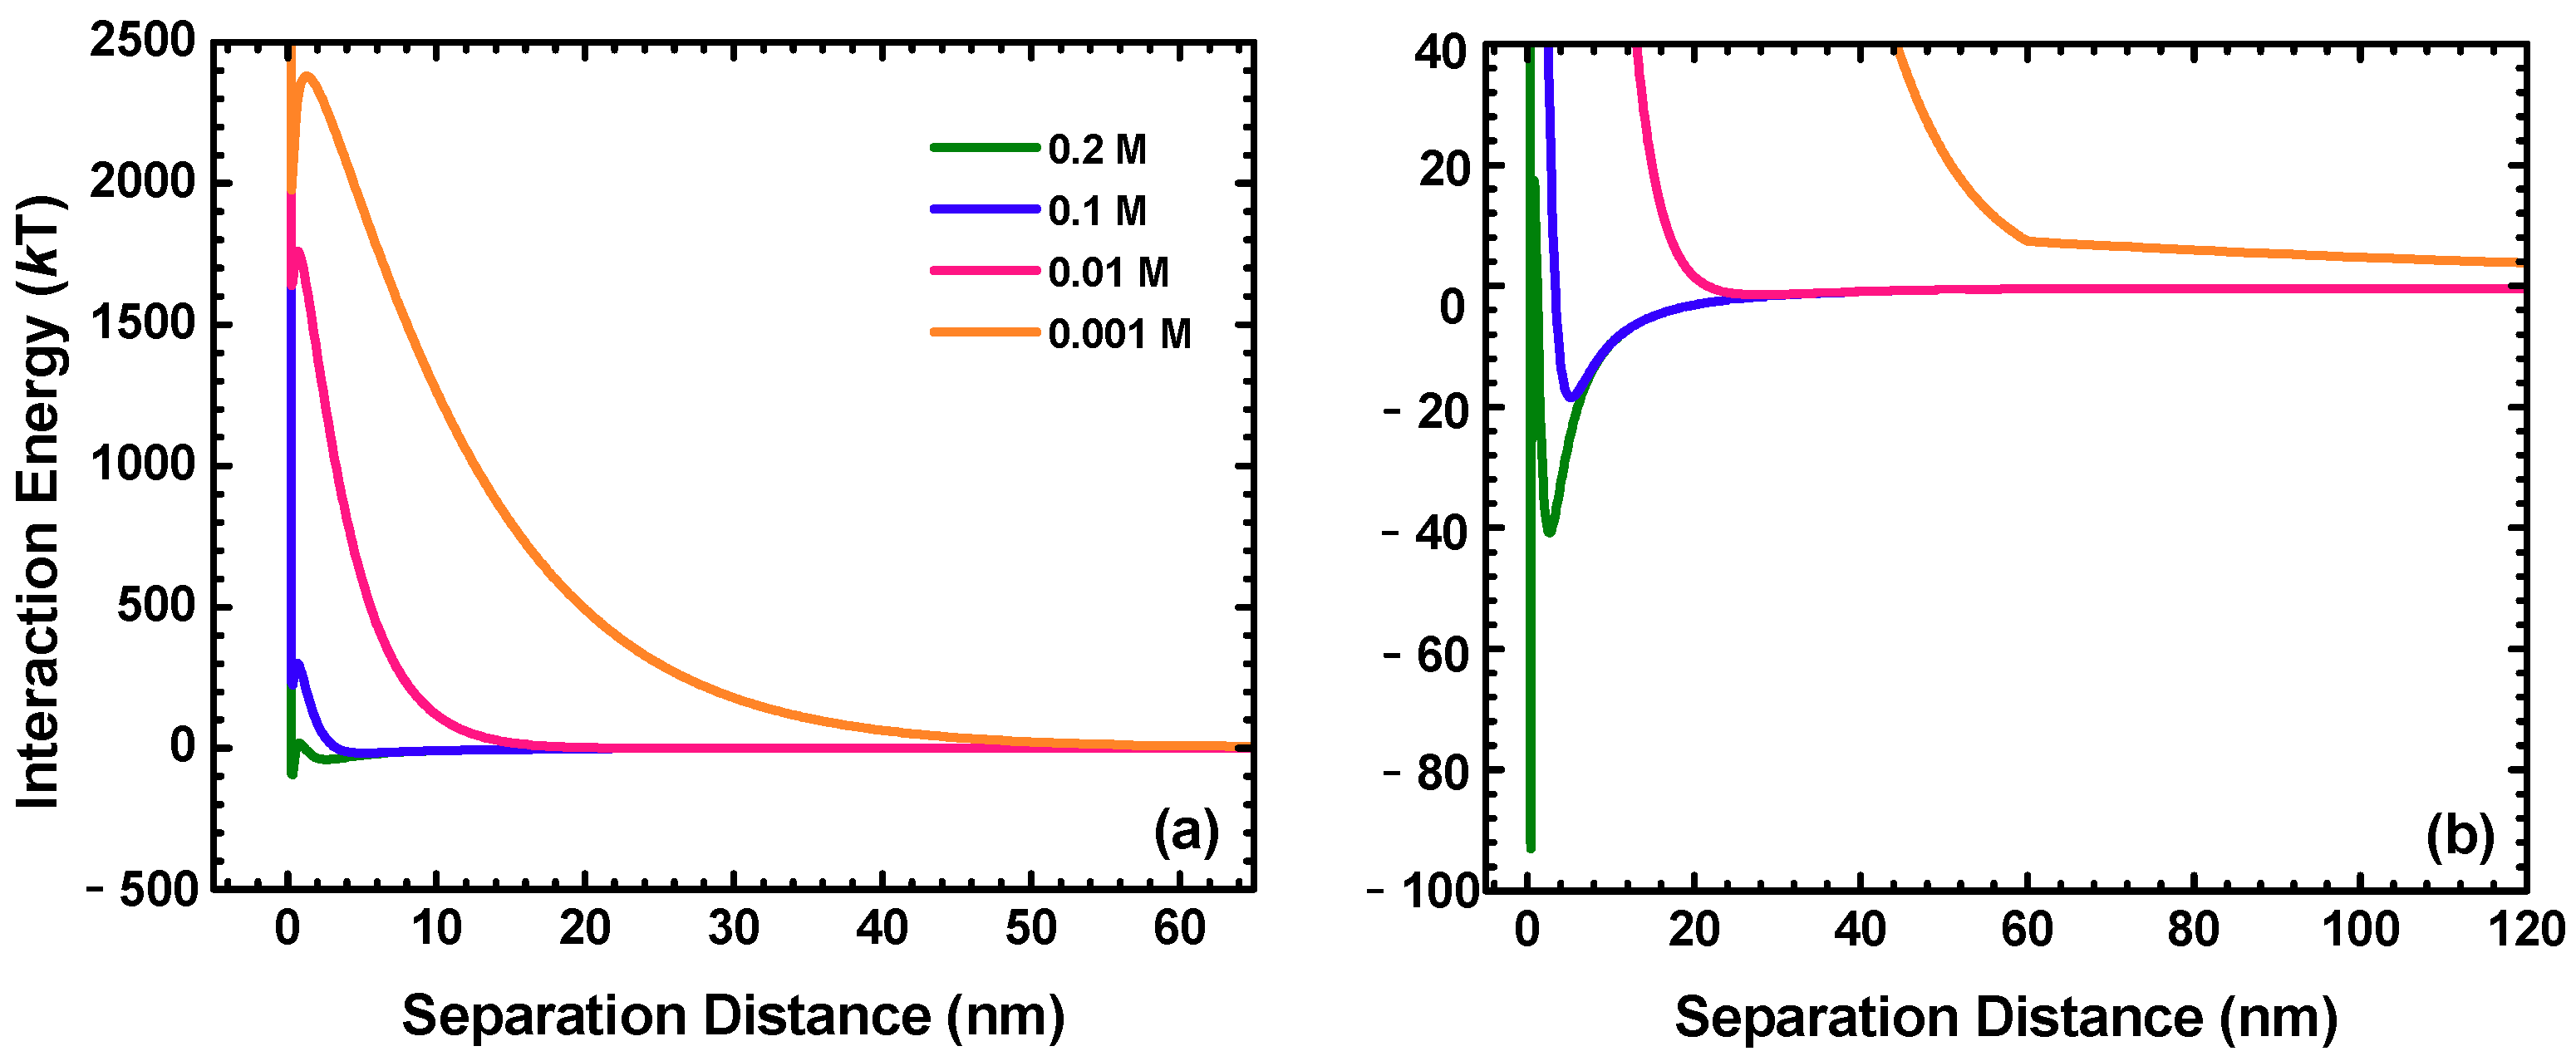
The zeta potentials and hydrodynamic diameters of MPs and zeta potentials of glass beads at different ISs are presented in Table 1. The zeta potentials of the MPs and glass beads were negative at all of the tested ISs, indicating that the MP deposition was unfavorable. An increase in the IS caused the zeta potentials to become less negative because of the compression of the electrical double layer. There was only a very slight change in the diameters of the MPs, illustrating that the aggregation of MPs was minor at the solution ISs considered in this study. These measured values of zeta potentials and sizes were used to calculate DLVO interaction energies between the MPs and glass bead surfaces as shown in Figure 1.
3.2. BTCs of MPs
Figure 2 presents the BTCs for the MPs with the injection of different PVs of MP influent suspensions. The value of C/C0 was plotted as a function of PV. Pore volume was defined as the ratio of the volume of injected MP suspension to the total pore volume of a porous medium.
The total of the PVs of the MP influent suspension for a BTC is denoted as TPV later in the paper. The values of C/C0 were close to 0 at high ISs, indicating that almost all colloids were completely deposited under these chemical conditions. The DLVO interaction energy calculations (see Figure 1 and Table 2) show that the secondary minima were deep at high ISs (≥0.1 M) and the energy barriers (from 17.3 kT to 301.6 kT) were much larger than the average kinetic energy of a colloid (1.5 kT). Hence, the MPs were favorably deposited at the secondary minima at the high ISs. However, colloids could also be deposited in primary minima because the energy barrier could be reduced or even eliminated by the physical and chemical heterogeneities that existed on glass bead surfaces [15,52,60]. Fewer MPs were attached in the columns at a lower IS as indicated by the high values of C/C0. This was due to the reason that decreasing solution IS increased the repulsive energy barrier and decreased the depth of the secondary minimum (see Figure 1 and Table 2). Therefore, both the deposition at the primary and secondary minima were reduced at low ISs [61,62]. Note that even if the attachment occurred at physical and chemical heterogeneities, such attachment was still influenced by the solution IS under unfavorable chemical conditions [52].
The value of C/C0 almost kept constant when 2 TPVs of MP influent suspension were injected (Figure 2a), indicating that the deposition sites on the glass bead surfaces were enough and no blocking existed. The blocking became more prominent with an increase in the TPV of the MP influence suspension and the solution IS as indicated by the rising values of C/C0 at the plateaus of BTCs in Figure 2b,c. The BTCs in Figure 2 showed that tails existed at all solution ISs in phase 2. The tails were particularly prominent at low ISs. This was because the energy barriers were high at low ISs, which reduced the attachment in the primary minima. Moreover, more shallow secondary energy wells existed at the low ISs. The colloids attached at the shallow energy wells could detach into the solution spontaneously by Brownian diffusion [10,17,19,63].
Note that Wang et al. [46] showed that the colloids attached atop nanoscale protruding asperities via primary minimum association could also spontaneously detach by Brownian diffusion because the nanoscale protruding asperities could reduce the depth of primary minimum. Spontaneous detachment will occur if the depths of primary minima are comparable to the average kinetic energy of a colloid.
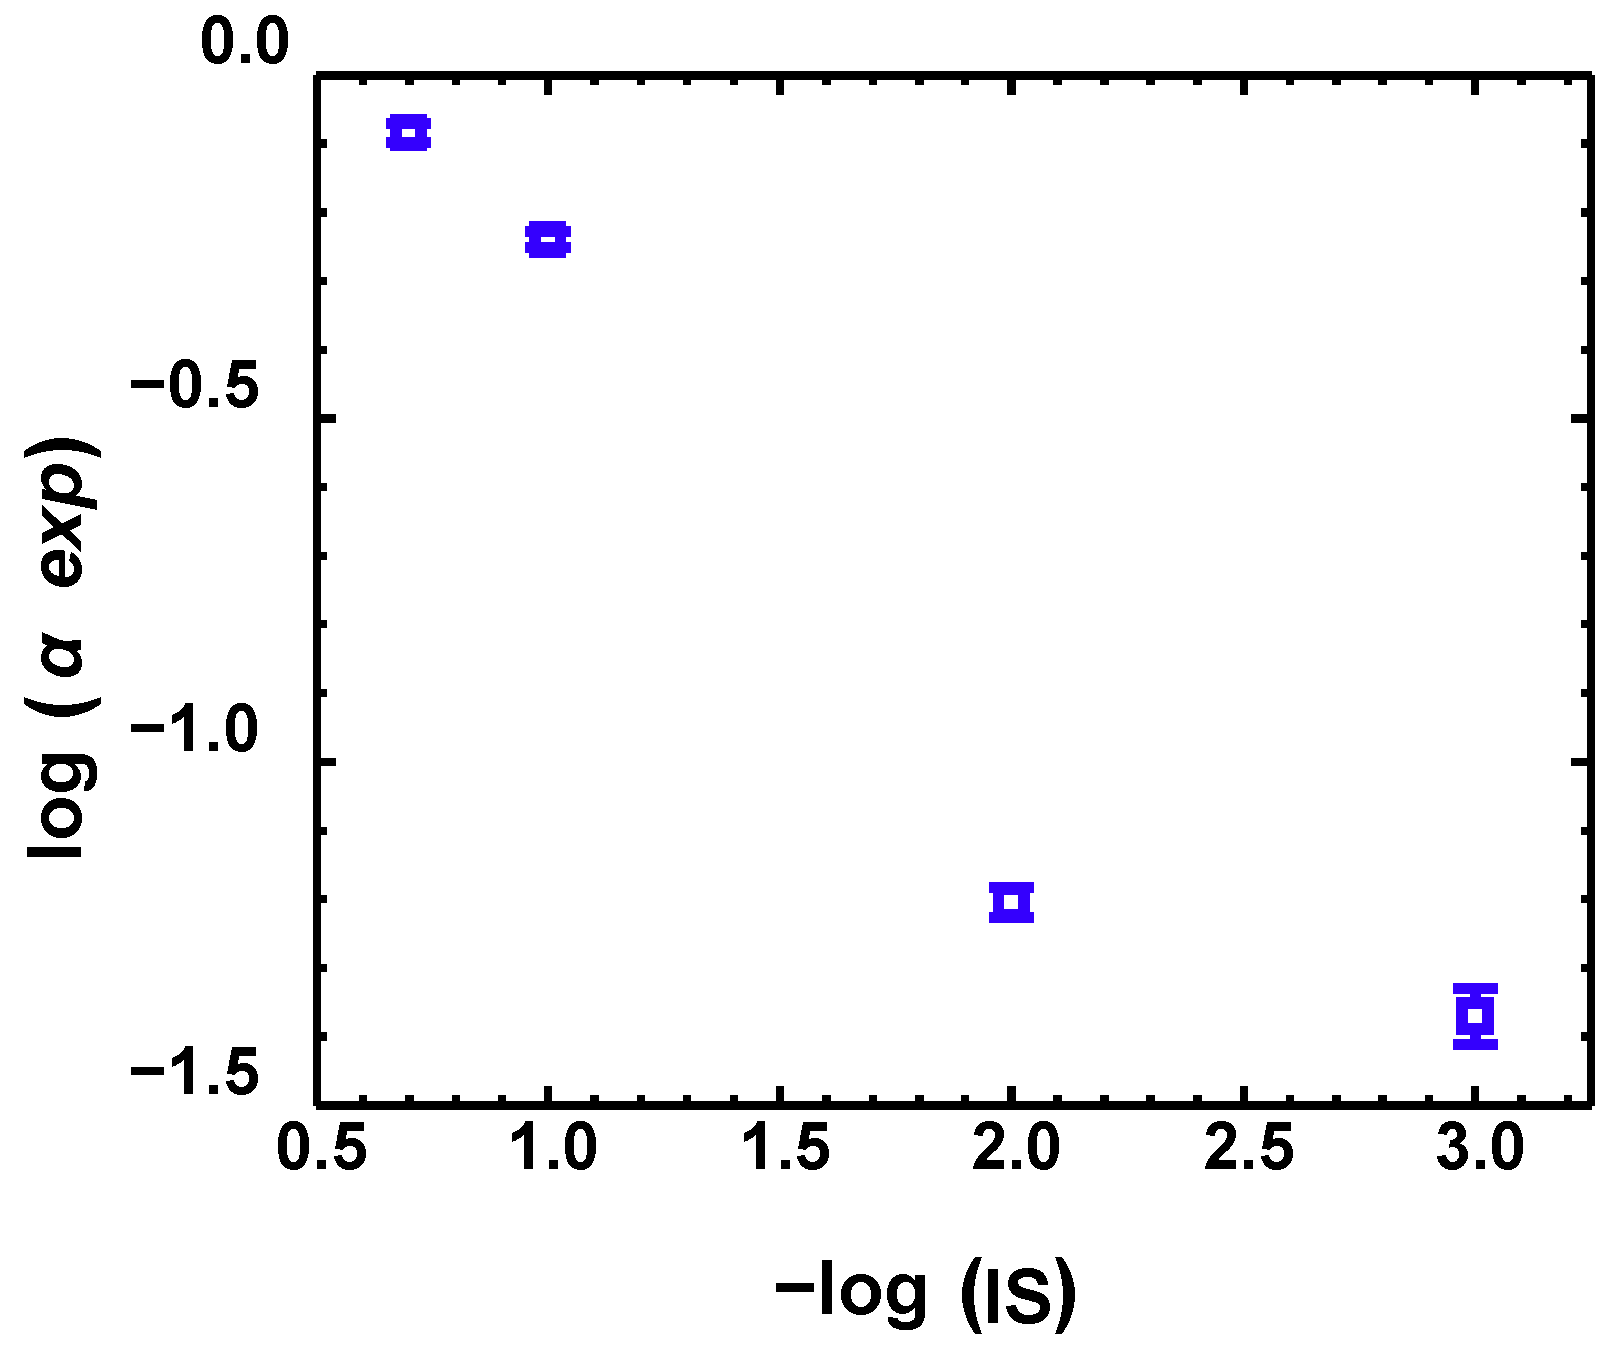
The obtained BTCs were used to calculate the experimental attachment efficiency (α) using Equation (1) at different ISs. The values of C/C0 between 1.8 and 2.0 PVs for a BTC were used for the calculations [14,15,16]. The attachment efficiency at different ISs increased from 0.04 to 0.82 when the solution IS increased from 0.001 M to 0.2 M (see Figure 3). These values were comparable to those obtained under similar experimental conditions in the literature [37,41,45,47].
3.3. Profiles of Retained Particles
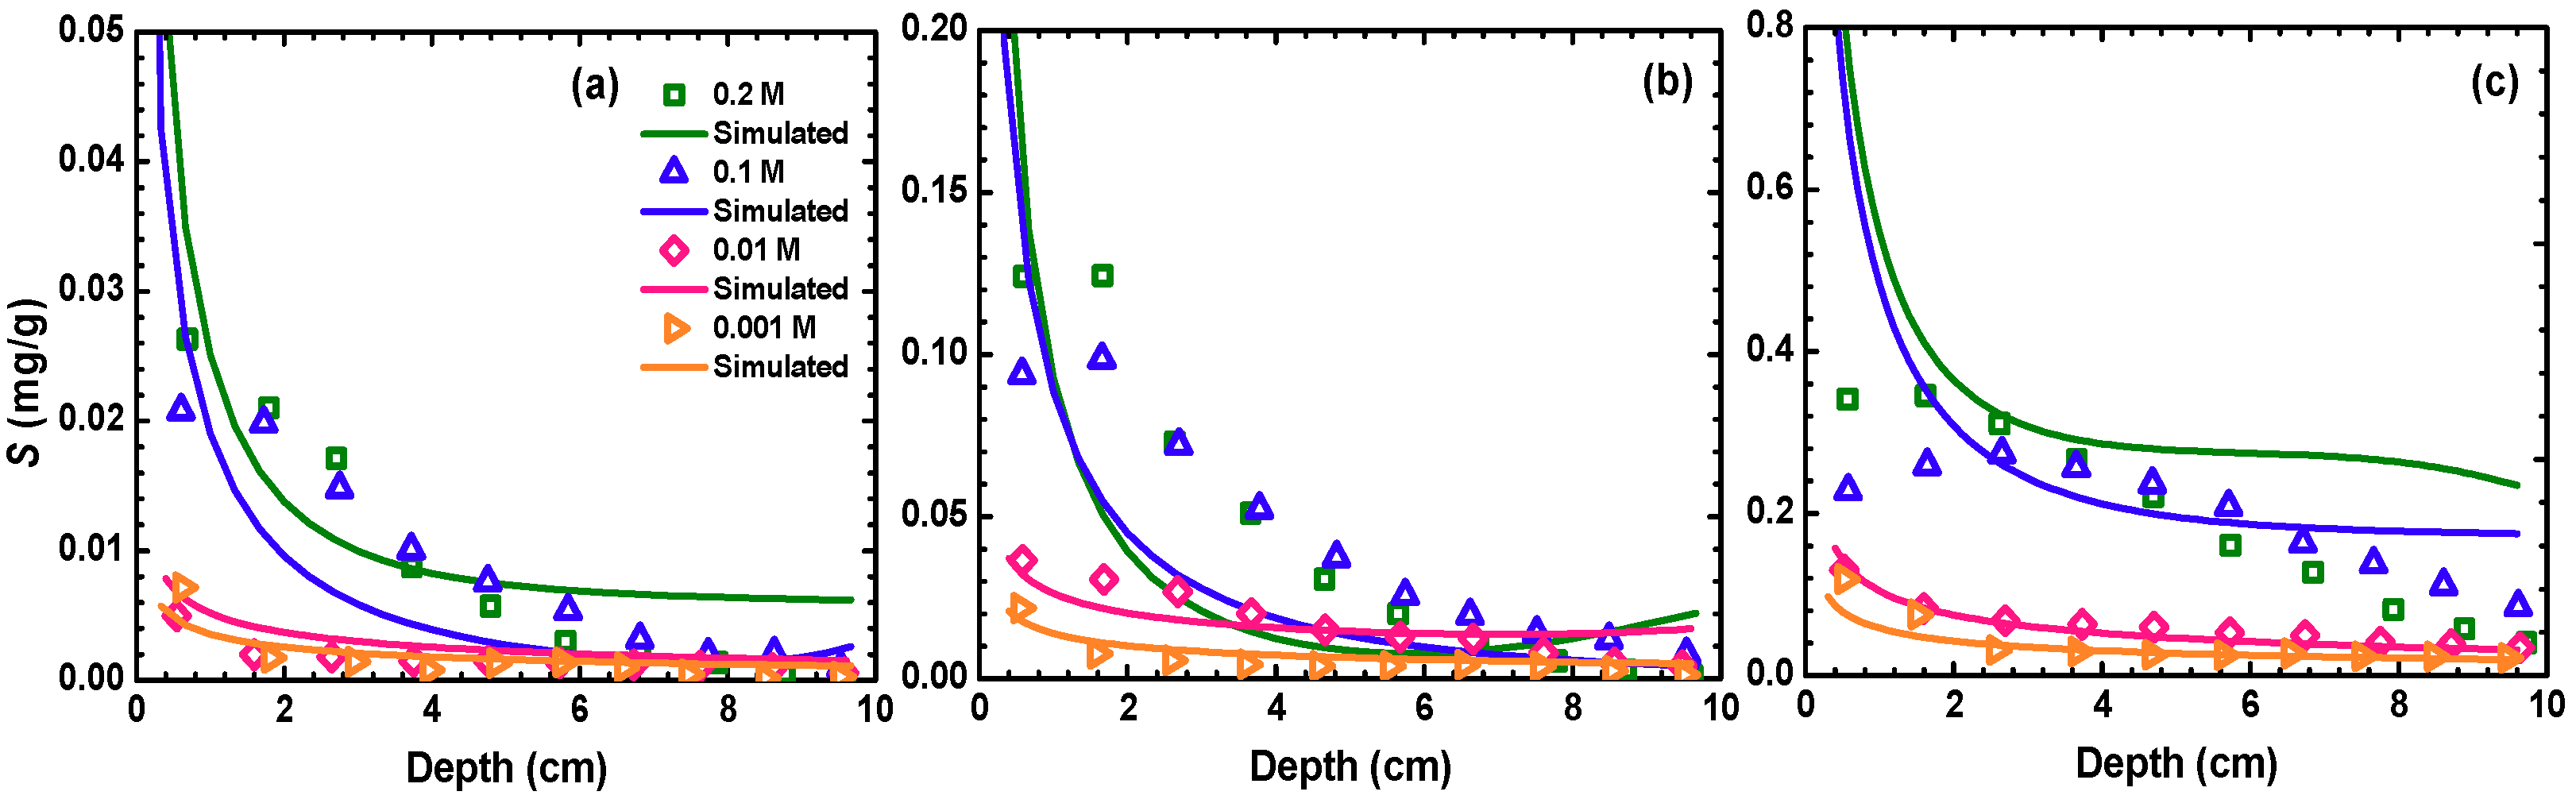
The RPs of MPs are presented in Figure 4, where the MP attachment concentration is plotted as a function of the depth from the column inlet. The RPs of the MPs were found to be dependent on both the IS and injected TPV of MP influent suspension. Specifically, when only 2 TPVs of MP influent suspension were injected, the shapes of RPs were monotonic. In contrast, non-monotonic shapes of RPs were observed at ISs of 0.1 and 0.2 M with injection of 10 and 50 TPVs of MP influent suspension. Specifically, the maximum concentration of retained MPs was located at a distance from the inlet of the column. It is interesting to note that the distance from the column inlet at which the maximum concentration of MPs was located increased with the TPV of MP influent suspension (Figure 4). This indicates that the transfer of MPs among collectors in the down-gradient direction occurred. The total mass recovery reached unity under all conditions expect at 0.1 and 0.2 M with 50 TPVs of injected MP suspension (Table 3). The irreversible attachment was likely the cause of the presence of surface heterogeneity on glass beads. Shen et al. [60] illustrated that colloids attached at large surface charge heterogeneities are very firm, attributable to an increase in the primary minimum depth and adhesion with the increasing size of the charge heterogeneity. These attached colloids cannot be released by IS reduction and increase of flow velocity. Li et al. [47] indicated that the irreversible colloid attachment can also occur at concave locations of the rough collector surfaces.
The transfer of colloids among collectors was regarded to be those deposited at the secondary energy minimum [24]. The secondary minimum deposition was found to be a major retention mechanism for colloid retention under unfavorable conditions even under high IS conditions [15,17,64,65,66]. The colloids associated at secondary minima are located at certain distances from the collector surfaces and can translate and rotate along collector surfaces by hydrodynamic shear [47]. The mobilizing colloids may be released to bulk pore fluid via diffusion or expulsion at stagnation point regions or reattached at physical and chemical heterogeneities on down-gradient glass-bead surfaces at primary minima, causing the non-monotonic RPs. The mobilizing colloids may also be stably deposited at secondary minimum if the hydrodynamic shear is balanced by tangential adhesive forces (e.g., from rough asperities) [10,52]. Note that we did not observe hyper-exponential profiles, indicating that heterogeneities of colloid populations and straining have a minor influence on the MP deposition in our study [10,67].
3.4. Modeling BTCs and RPs
The transport model simulated the BTCs and RPs in Figure 2 and Figure 4, respectively. The model well simulated the BTCs (R2 > 0.99) and the RPs when they exhibited monotonic shape. However, the model could not simulate the non-monotonic shapes of the RPs that occurred at 0.1 and 0.2 M with an injection of 10 and 50 TPVs of influent suspension, because the model did not capture the transfer of colloids among collectors.
Similarly, Li and Johnson [33] and Tong et al. [34] showed that the convection-diffusion equation including a first-order reversible kinetic deposition could not successfully capture the non-monotonic RPs.
Bradford et al. [56] simulated colloid transport in homogeneous porous media by developing a continuum model under unfavorable conditions. This model not only well described the BTCs but also produced a non-monotonic shape of RPs. The model considered that particles via secondary minimum association could roll along the collector surface until they reached the attachment sites where the adhesive torque dominated over the hydrodynamic torque. They introduced a parameter to represent the average distance that particles must transport along the collector surfaces to find an attachment site. Wang et al. [22] used the two-species model and successfully simulated the RPs of polyvinylpyrrolidone-coated silver nanoparticles in ultisol. Modifying these models for the application of them for simulating the transport of MPs is an ongoing topic but beyond the scope of this study.
4. Conclusions
By carrying out saturated porous medium experiments, we showed that the retention of MPs increased with increase of IS which is in agreement with the DLVO prediction that the primary and secondary minimum deposition increases with increasing solution IS. Blocking was more prominent with the injection of more PVs of MP suspension. The shapes of RPs changed from monotonic to non-monotonic with an increase in the input PV of the colloid suspension at high ISs, indicating that the transfer of colloids among collectors in the down-gradient direction occurred. Although the transport model including first-order reversible and irreversible deposition well described the BTCs and monotonic RPs, it could not capture the shapes of the non-monotonic RPs, because it did not consider the colloid transfer. These results have important implications for the development of models for accurate prediction of MP transport in subsurface environments.
Author Contributions
Conceptualization, X.C. and C.S.; methodology, X.C., T.L. and C.S.; software, X.C. and C.S.; validation, Z.L., A.Y. and T.L.; formal analysis, C.S.; investigation, C.S.; resources, C.S.; data curation, X.C.; writing—original draft preparation, X.C.; writing—review and editing, C.S. and A.Y.; supervision, C.S.
Funding
This research was funded by the National Natural Science Foundation of China, grant number 41671222 and 41922047, and National Key Research and Development Program of China, grant number 2017YFD0800300.
Conflicts of Interest
The authors declare no conflict of interest.
References
- John, G.; Nagarajan, S.; Vemula, P.K.; Silverman, J.R.; Pillai, C.K.S. Natural Monomers: A mine for functional and sustainable materials-occurrence, chemical modification and polymerization. Prog. Polym. Sci. 2019, 92, 158–209. [Google Scholar] [CrossRef]
- Alimi, O.S.; Budarz, J.F.; Hernandez, L.M.; Tufenkji, N. Microplastics and nanoplastics in aquatic environments: Aggregation, deposition, and enhanced contaminant transport. Environ. Sci. Technol. 2018, 5252, 1704–1724. [Google Scholar] [CrossRef] [PubMed]
- Hernandez, L.M.; Xu, E.G.; Larsson, H.C.; Tahara, R.; Maisuria, V.B.; Tufenkji, N. Plastic teabags release billions of microparticles and nanoparticles into tea. Environ. Sci. Technol. 2019. [Google Scholar] [CrossRef] [PubMed]
- McCormick, A.; Hoellein, T.J.; Mason, S.A.; Schluep, J.; Kelly, J.J. Microplastic is an abundant and distinct microbial habitat in an urban river. Environ. Sci. Technol. 2014, 4848, 11863–11871. [Google Scholar] [CrossRef] [PubMed]
- Thompson, R.C.; Olsen, Y.; Mitchell, R.P.; Davis, A.; Rowland, S.J.; John, A.W.; Russell, A.E. Lost at sea: Where is all the plastic? Science 2004, 304, 838. [Google Scholar] [CrossRef] [PubMed]
- Rillig, M.C. Microplastic in terrestrial ecosystems and the soil? Environ. Sci. Technol. 2012, 4646, 6453–6454. [Google Scholar] [CrossRef]
- Rillig, M.C.; Ingraffia, R.; de Souza Machado, A.A. Microplastic incorporation into soil in agroecosystems. Front. Plant Sci. 2017, 8, 1805. [Google Scholar] [CrossRef]
- Yao, K.M.; Habibian, M.T.; O’Melia, C.R. Water and waste water filtration. Concepts and applications. Environ. Sci. Technol. 1971, 55, 1105–1112. [Google Scholar] [CrossRef]
- Bradford, S.A.; Yates, S.R.; Bettahar, M.; Simunek, J. Physical factors affecting the transport and fate of colloids in saturated porous media. Water Resour. Res. 2002, 3838. [Google Scholar] [CrossRef]
- Shen, C.; Jin, Y.; Zhuang, J.; Li, T.; Xing, B. Role and importance of surface heterogeneities in transport of particles in saturated porous media. Crit. Rev. Environ. Sci. Technol. 2019. [Google Scholar] [CrossRef]
- Ryan, J.N.; Elimelech, M. Colloid mobilization and transport in groundwater. Colloid Surf. A 1996, 107, 1–56. [Google Scholar] [CrossRef]
- Ng, W.K.; Jegatheesan, V.; Lee, S.H. Influence of particle concentration on initial collection efficiency and surface coverage in porous media filtration. Korean J. Chem. Eng. 2006, 2323, 333–342. [Google Scholar] [CrossRef]
- Molnar, I.L.; Johnson, W.P.; Gerhard, J.I.; Willson, C.S.; O’Carroll, D.M. Predicting colloid transport through saturated porous media: A critical review. Water Resour. Res. 2015, 5151, 6804–6845. [Google Scholar] [CrossRef]
- Tufenkji, N.; Redman, J.A.; Elimelech, M. Interpreting deposition patterns of microbial particles in laboratory-scale column experiments. Environ. Sci. Technol. 2003, 3737, 616–623. [Google Scholar] [CrossRef]
- Tufenkji, N.; Elimelech, M. Correlation equation for predicting single-collector efficiency in physicochemical filtration in saturated porous media. Environ. Sci. Technol. 2004, 3838, 529–536. [Google Scholar] [CrossRef]
- Tufenkji, N.; Elimelech, M. Breakdown of colloid filtration theory: Role of the secondary energy minimum and surface charge heterogeneities. Langmuir 2005, 21, 841–852. [Google Scholar] [CrossRef]
- Hahn, M.W.; O’Melia, C.R. Deposition and reentrainment of Brownian particles in porous media under unfavorable chemical conditions: Some concepts and applications. Environ. Sci. Technol. 2004, 38, 210–220. [Google Scholar] [CrossRef]
- Li, X.; Scheibe, T.D.; Johnson, W.P. Apparent decreases in colloid deposition rate coefficients with distance of transport under unfavorable deposition conditions: A general phenomenon. Environ. Sci. Technol. 2004, 38, 5616–5625. [Google Scholar] [CrossRef]
- Shen, C.; Li, B.; Huang, Y.; Jin, Y. Kinetics of coupled primary-and secondary-minimum deposition of colloids under unfavorable chemical conditions. Environ. Sci. Technol. 2007, 41, 6976–6982. [Google Scholar] [CrossRef]
- Kasel, D.; Bradford, S.A.; Simunek, J.; Heggen, M.; Vereecken, H.; Klumpp, E. Transport and retention of multi-walled carbon nanotubes in saturated porous media: Effects of input concentration and grain size. Water Res. 2013, 47, 933–944. [Google Scholar] [CrossRef]
- Liang, Y.; Bradford, S.A.; Simunek, J.; Vereecken, H.; Klumpp, E. Sensitivity of the transport and retention of stabilized silver nanoparticles to physicochemical factors. Water Res. 2013, 47, 2572–2582. [Google Scholar] [CrossRef]
- Wang, D.; Ge, L.; He, J.; Zhang, W.; Jaisi, D.P.; Zhou, D. Hyperexponential and non-monotonic retention of polyvinylpyrrolidone-coated silver nanoparticles in an Ultisol. J. Contam. Hydrol. 2014, 164, 35–48. [Google Scholar] [CrossRef]
- Chequer, L.; Russell, T.; Behr, A.; Genolet, L.; Kowollik, P.; Badalyan, A.; Bedrikovetsky, P. Non-monotonic permeability variation during colloidal transport: Governing equations and analytical model. J. Hydrol. 2018, 557, 547–560. [Google Scholar] [CrossRef]
- Hilpert, M.; Johnson, W.P. A binomial modeling approach for upscaling colloid transport under unfavorable attachment conditions: Emergent prediction of non-monotonic retention profiles. Water Resour. Res. 2018, 54, 46–60. [Google Scholar] [CrossRef]
- He, J.; Wang, D.; Zhou, D. Transport and retention of silver nanoparticles in soil: Effects of input concentration, particle size and surface coating. Sci. Total Environ. 2019, 648, 102–108. [Google Scholar] [CrossRef]
- Bradford, S.A.; Bettahar, M. Straining, attachment, and detachment of Cryptosporidium oocysts in saturated porous media. J. Environ. Qual. 2005, 34, 469–478. [Google Scholar] [CrossRef]
- Tong, M.; Johnson, W.P. Colloid population heterogeneity drives hyperexponential deviation from classic filtration theory. Environ. Sci. Technol. 2007, 41, 493–499. [Google Scholar] [CrossRef]
- Schijven, J.F.; Hoogenboezem, W.; Hassanizadeh, M.; Peters, J.H. Modeling removal of bacteriophages MS2 and PRD1 by dune recharge at Castricum, Netherlands. Water Resour. Res. 1999, 35, 1101–1111. [Google Scholar] [CrossRef]
- Harter, T.; Wagner, S.; Atwill, E.R. Colloid transport and filtration of Cryptosporidium parvum in sandy soils and aquifer sediments. Environ. Sci. Technol. 2000, 34, 62–70. [Google Scholar] [CrossRef]
- Redman, J.A.; Estes, M.K.; Grant, S.B. Resolving macroscale and microscale heterogeneity in virus filtration. Colloid Surf. A 2001, 191, 57–70. [Google Scholar] [CrossRef]
- Bradford, S.A.; Simunek, J.; Bettahar, M.; van Genuchten, M.T.; Yates, S.R. Modeling colloid attachment, straining, and exclusion in saturated porous media. Environ. Sci. Technol. 2003, 37, 2242–2250. [Google Scholar] [CrossRef] [PubMed]
- Bradford, S.A.; Bettahar, M.; Simunek, J.; van Genuchten, M.T. Straining and attachment of colloids in physically heterogeneous porous media. Vadose Zone J. 2004, 3, 384–394. [Google Scholar] [CrossRef]
- Li, X.; Johnson, W.P. Non-monotonic variations in deposition rate coefficients of microspheres in porous media under unfavorable deposition conditions. Environ. Sci. Technol. 2005, 39, 1658–1665. [Google Scholar] [CrossRef] [PubMed]
- Tong, M.; Li, X.; Brow, C.N.; Johnson, W.P. Detachment-influenced transport of an adhesion-deficient bacterial strain within water-reactive porous media. Environ. Sci. Technol. 2005, 39, 2500–2508. [Google Scholar] [CrossRef]
- Li, Y.; Wang, Y.; Pennell, K.D.; Abriola, L.M. Investigation of the transport and deposition of fullerene (C60) nanoparticles in quartz sands under varying flow conditions. Environ. Sci. Technol. 2008, 42, 7174–7180. [Google Scholar] [CrossRef]
- Liu, Y.; Janjaroen, D.; Kuhlenschmidt, M.S.; Kuhlenschmidt, T.B.; Nguyen, T.H. Deposition of Cryptosporidium parvum oocysts on natural organic matter surfaces: Microscopic evidence for secondary minimum deposition in a radial stagnation point flow cell. Langmuir 2009, 25, 1594–1605. [Google Scholar] [CrossRef]
- Li, X.; Zhang, P.; Lin, C.L.; Johnson, W.P. Role of hydrodynamic drag on microsphere deposition and re-entrainment in porous media under unfavorable conditions. Environ. Sci. Technol. 2005, 39, 4012–4020. [Google Scholar] [CrossRef]
- Rasmuson, A.; Pazmino, E.; Assemi, S.; Johnson, W.P. Contribution of nano-to microscale roughness to heterogeneity: Closing the gap between unfavorable and favorable colloid attachment conditions. Environ. Sci. Technol. 2017, 51, 2151–2160. [Google Scholar] [CrossRef]
- Johnson, W.P.; Rasmuson, A.; Pazmiño, E.; Hilpert, M. Why variant colloid transport behaviors emerge among identical individuals in porous media when colloid–surface repulsion exists. Environ. Sci. Technol. 2018, 52, 7230–7239. [Google Scholar] [CrossRef]
- Elimelech, M.; O’Melia, C.R. Kinetics of deposition of colloidal particles in porous media. Environ. Sci. Technol. 1990, 24, 1528–1536. [Google Scholar] [CrossRef]
- Tufenkji, N.; Elimelech, M. Deviation from the classical colloid filtration theory in the presence of repulsive DLVO interactions. Langmuir 2004, 20, 10818–10828. [Google Scholar] [CrossRef] [PubMed]
- Redman, J.A.; Walker, S.L.; Elimelech, M. Bacterial adhesion and transport in porous media: Role of the secondary energy minimum. Environ. Sci. Technol. 2004, 38, 1777–1785. [Google Scholar] [CrossRef] [PubMed]
- Bradford, S.A.; Simunek, J.; Walker, S.L. Transport and straining of E. coli O157: H7 in saturated porous media. Water Resour. Res. 2006, 42. [Google Scholar] [CrossRef] [Green Version]
- Hoek, E.M.; Agarwal, G.K. Extended DLVO interactions between spherical particles and rough surfaces. J. Colloid Interface Sci. 2006, 298, 50–58. [Google Scholar] [CrossRef]
- Shen, C.; Zhang, M.; Zhang, S.; Wang, Z.; Zhang, H.; Li, B.; Huang, Y. Influence of surface heterogeneities on reversibility of fullerene (nC60) nanoparticle attachment in saturated porous media. J. Hazard. Mater. 2015, 290, 60–68. [Google Scholar] [CrossRef]
- Wang, Z.; Wang, D.; Li, B.; Wang, J.; Li, T.; Zhang, M.; Shen, C. Detachment of fullerene nC60 nanoparticles in saturated porous media under flow/stop-flow conditions: Column experiments and mechanistic explanations. Environ. Pollut. 2016, 213, 698–709. [Google Scholar] [CrossRef]
- Li, T.; Jin, Y.; Huang, Y.; Li, B.; Shen, C. Observed dependence of colloid detachment on the concentration of initially attached colloids and collector surface heterogeneity in porous media. Environ. Sci. Technol. 2017, 51, 2811–2820. [Google Scholar] [CrossRef]
- Gregory, J. Approximate expressions for retarded van der Waals interaction. J. Colloid Interface Sci. 1981, 83, 138–145. [Google Scholar] [CrossRef]
- Ruckenstein, E.; Prieve, D.C. Adsorption and desorption of particles and their chromatographic separation. Aiche J. 1976, 22, 276–283. [Google Scholar] [CrossRef]
- Hogg, R.; Healy, T.W.; Fuerstenau, D.W. Mutual coagulation of colloidal dispersions. Trans. Faraday Soc. 1966, 62, 1638–1651. [Google Scholar] [CrossRef]
- Elimelech, M.; O’Melia, C.R. Effect of particle size on collision efficiency in the deposition of Brownian particles with electrostatic energy barriers. Langmuir 1990, 6, 1153–1163. [Google Scholar] [CrossRef]
- Shen, C.; Bradford, S.A.; Li, T.; Huang, Y. Can nanoscale surface charge heterogeneity really explain colloid detachment from primary minima upon reduction of solution ionic strength? J. Nanopart. Res. 2018, 20, 165. [Google Scholar] [CrossRef]
- Adamczyk, Z.; Siwek, B.; Zembala, M.; Belouschek, P. Kinetics of localized adsorption of colloid particles. Adv. Colloid Interface Sci. 1994, 48, 151–280. [Google Scholar] [CrossRef]
- Haque, M.E.; Shen, C.; Li, T.; Chu, H.; Wang, H.; Li, Z.; Huang, Y. Influence of biochar on deposition and release of clay colloids in saturated porous media. J. Environ. Qual. 2017, 46, 1480–1488. [Google Scholar] [CrossRef]
- Torkzaban, S.; Tazehkand, S.S.; Walker, S.L.; Bradford, S.A. Transport and fate of bacteria in porous media: Coupled effects of chemical conditions and pore space geometry. Water Resour. Res. 2008, 44, W04403. [Google Scholar] [CrossRef]
- Bradford, S.A.; Torkzaban, S.; Kim, H.; Simunek, J. Modeling colloid and microorganism transport and release with transients in solution ionic strength. Water Resour. Res. 2012, 48. [Google Scholar] [CrossRef] [Green Version]
- Wu, J.; Shen, C.; Wang, C.; Yan, A.; Zhang, H. The failure of using equilibrium adsorption of fosthiazate onto montmorillonite clay particles to predict their cotransport in porous media as revealed by batch and column studies. J. Soil Sediment. 2019, 19, 917–928. [Google Scholar] [CrossRef]
- Zhang, P.; Simunek, J.; Bowman, R.S. Nonideal transport of solute and colloidal tracers through reactive zeolite/iron pellets. Water Resour. Res. 2004, 40, W04207. [Google Scholar] [CrossRef] [Green Version]
- Simunek, J.; van Genuchten, M.T.; Sejna, M. The Hydrus-1D software package for simulating the one-dimentional movement of water. In Heat, and Multiple Solutes in Variably-Saturated Media; Version 3.0; Department of Environmental Science, University of California Riverside: Riverside, CA, USA, 2005. [Google Scholar]
- Shen, C.; Lazouskaya, V.; Zhang, H.; Li, B.; Jin, Y.; Huang, Y. Influence of surface chemical heterogeneity on attachment and detachment of microparticles. Colloid Surf. A 2013, 433, 14–29. [Google Scholar] [CrossRef]
- Zhang, C.; Yan, A.; Wang, G.; Jin, C.; Chen, Y.; Shen, C. Impact of flow velocity on transport of graphene oxide nanoparticles in saturated porous media. Vadose Zone J. 2018, 17, 180019. [Google Scholar] [CrossRef] [Green Version]
- Zhao, K.; Chen, C.; Cheng, T.; Shang, J. Graphene oxide-facilitated uranium transport and release in saturated medium: Effect of ionic strength and medium structure. Environ. Pollut. 2019, 247, 668–677. [Google Scholar] [CrossRef]
- Hahn, M.W.; Abadzic, D.; O’Melia, C.R. Aquasols: on the role of secondary minima. Environ. Sci. Technol. 2004, 38, 5915–5924. [Google Scholar] [CrossRef]
- Franchi, A.; O’Melia, C.R. Effects of natural organic matter and solution chemistry on the deposition and reentrainment of colloids in porous media. Environ. Sci. Technol. 2003, 37, 1122–1129. [Google Scholar] [CrossRef]
- Walker, S.L.; Redman, J.A.; Elimelech, M. Role of cell surface lipopolysaccharides in Escherichia coli k12 adhesion and transport. Langmuir 2004, 20, 7736–7746. [Google Scholar] [CrossRef]
- Liang, Y.; Bradford, S.A.; Simunek, J.; Klumpp, E. Mechanisms of graphene oxide aggregation, retention, and release in quartz sand. Sci. Total Environ. 2019, 656, 70–79. [Google Scholar] [CrossRef] [PubMed] [Green Version]
- Babakhani, P.; Bridge, J.; Doong, R.; Phenrat, T. Continuum-based models and concepts for the transport of nanoparticles in saturated porous media: A state-of-the-science review. Adv. Colloid Interface Sci. 2017, 246, 75–104. [Google Scholar] [CrossRef] [PubMed] [Green Version]
Figure 1.
(a) Calculated Derjaguin–Landau–Verwey–Overbeek (DLVO) interaction energy plotted as a function of separation distance at different ISs. (b) Re-plotted interaction energy profiles of (a) to highlight depth and location of secondary energy minima.
Figure 1.
(a) Calculated Derjaguin–Landau–Verwey–Overbeek (DLVO) interaction energy plotted as a function of separation distance at different ISs. (b) Re-plotted interaction energy profiles of (a) to highlight depth and location of secondary energy minima.

Figure 2.
Measured (symbols) and simulated (lines) breakthrough curves (BTCs) for the MPs from saturated columns packed with glass beads. Phase 1—injection of MP influent suspension: (a) 2 pore volumes (PVs); (b) 10 PVs; (c) 50 PVs at different ISs (orange, 0.001 M; pink, 0.01 M; blue, 0.1 M; green, 0.2 M); Phase 2—elution with MP-free electrolyte solution.

Figure 3.
Calculated experimental attachment efficiency αexp as a function of IS.

Figure 4.
Measured (symbols) and simulated (lines) retention profiles (RPs) after injection of MP influent suspension for (a) 2 PVs, (b) 10 PVs, (c) 50 PVs at different ISs (i.e., orange, 0.001 M; pink, 0.01 M; blue, 0.1 M; green, 0.2 M).
Figure 4.
Measured (symbols) and simulated (lines) retention profiles (RPs) after injection of MP influent suspension for (a) 2 PVs, (b) 10 PVs, (c) 50 PVs at different ISs (i.e., orange, 0.001 M; pink, 0.01 M; blue, 0.1 M; green, 0.2 M).


Table 1.
Zeta potentials of microplastic particles (MPs) and glass beads, and sizes of the MPs at different ionic strengths (ISs).
Table 1.
Zeta potentials of microplastic particles (MPs) and glass beads, and sizes of the MPs at different ionic strengths (ISs).
| IS (M) | Zeta Potential (mV) | MP Size (nm) | |
|---|---|---|---|
| Glass Beads | MPs | ||
| 0.2 | −26.1 | −34.1 | 997.2 |
| 0.1 | −31.7 | −43.9 | 982.4 |
| 0.01 | −50.4 | −67.3 | 943.1 |
| 0.001 | −53.6 | −75.7 | 910.4 |
Table 2.
Calculated maximum energy barriers (Umax), detachment energy barriers from primary minimum (ΔU) (i.e., Umax−Upri, where Upri is the primary minimum), secondary minimum depths (−Usec), and distances for the MPs interacting with glass beads at different ISs.
Table 2.
Calculated maximum energy barriers (Umax), detachment energy barriers from primary minimum (ΔU) (i.e., Umax−Upri, where Upri is the primary minimum), secondary minimum depths (−Usec), and distances for the MPs interacting with glass beads at different ISs.
| IS (M) | Umax (kT) | ΔU (kT) | −Usec | |
|---|---|---|---|---|
| Depth (kT) | Distance (nm) | |||
| 0.2 | 17.3 | 110.4 | 40.8 | 2.7 |
| 0.1 | 301.6 | 77.9 | 18.4 | 5.3 |
| 0.01 | 1761.3 | 123.8 | 1.4 | 28.0 |
| 0.001 | 2379.8 | 402.1 | 0.1 | 625.1 |
Table 3.
MPs mass balance in different phases of column experiments. M12, phase 1 and 2; Ms, dissection experiments; MT, total mass recovery (= M12 + Ms).
Table 3.
MPs mass balance in different phases of column experiments. M12, phase 1 and 2; Ms, dissection experiments; MT, total mass recovery (= M12 + Ms).
| PV of Injected MP Suspension | IS (M) | M12 (%) | MS (%) | MT (%) |
|---|---|---|---|---|
| 2 | 0.2 | 0.49 | 103.14 | 103.63 |
| 2 | 0.1 | 4.03 | 101.18 | 105.21 |
| 2 | 0.01 | 82.51 | 23.58 | 106.09 |
| 2 | 0.001 | 90.37 | 19.65 | 110.02 |
| 10 | 0.2 | 0.73 | 101.38 | 102.1 |
| 10 | 0.1 | 3.93 | 99.21 | 103.14 |
| 10 | 0.01 | 72.3 | 37.52 | 109.82 |
| 10 | 0.001 | 93.91 | 13.36 | 107.27 |
| 50 | 0.2 | 2.36 | 90.22 | 92.57 |
| 50 | 0.1 | 8.29 | 88.06 | 96.35 |
| 50 | 0.01 | 77.52 | 27.47 | 104.99 |
| 50 | 0.001 | 89.9 | 17.96 | 107.86 |
© 2019 by the authors. Licensee MDPI, Basel, Switzerland. This article is an open access article distributed under the terms and conditions of the Creative Commons Attribution (CC BY) license (http://creativecommons.org/licenses/by/4.0/).
Share and Cite
MDPI and ACS Style
Chu, X.; Li, T.; Li, Z.; Yan, A.; Shen, C. Transport of Microplastic Particles in Saturated Porous Media. Water 2019, 11, 2474. https://doi.org/10.3390/w11122474
AMA Style
Chu X, Li T, Li Z, Yan A, Shen C. Transport of Microplastic Particles in Saturated Porous Media. Water. 2019; 11(12):2474. https://doi.org/10.3390/w11122474
Chicago/Turabian StyleChu, Xianxian, Tiantian Li, Zhen Li, An Yan, and Chongyang Shen. 2019. "Transport of Microplastic Particles in Saturated Porous Media" Water 11, no. 12: 2474. https://doi.org/10.3390/w11122474
Note that from the first issue of 2016, this journal uses article numbers instead of page numbers. See further details here.