Article

“Garbage in, Garbage Out” Does Not Hold True for Indigenous Community Flood Extent Modeling in the Prairie Pothole Region

1
School of Environment and Sustainability, University of Saskatchewan, Saskatoon, SK S7N 5A2, Canada
2
Department of Geography and Planning, University of Saskatchewan, Saskatoon, SK S7N 5C8, Canada
3
Special Projects, Mistawasis Nêhiyawak, Leask, SK S0J 1M0, Canada
4
Lands & Resources Department, Mistawasis Nêhiyawak, Leask, SK S0J 1M0, Canada
*
Author to whom correspondence should be addressed.
Water 2019, 11(12), 2486; https://doi.org/10.3390/w11122486
Submission received: 30 September 2019 / Revised: 20 November 2019 / Accepted: 22 November 2019 / Published: 25 November 2019
(This article belongs to the Section Water Resources Management, Policy and Governance)

Abstract

:
Extensive land use changes and uncertainties arising from climate change in recent years have contributed to increased flood magnitudes in the Canadian Prairies and threatened the vulnerabilities of many small and indigenous communities. There is, thus, a need to create modernized flood risk management tools to support small and rural communities’ preparations for future extreme events. In this study, we developed spatial flood information for an indigenous community in Central Saskatchewan using LiDAR based DEM and a spatial modeling tool, the wetland DEM ponding model (WDPM). A crucial element of flood mapping in this study was community engagement in data collection, scenario description for WDPM, and flood map validation. Community feedback was also used to evaluate the utility of the modelled flood outputs. The results showed the accuracy of WDPM outputs could be improved not only with the quality of DEM but also with additional community-held information on contributing areas (watershed information). Based on community feedback, this accessible, spatially-focused modeling approach can provide relevant information for community spatial planning and developing risk management strategies. Our study found community engagement to be valuable in flood modeling and mapping by: providing necessary data, validating input data through lived experiences, and providing alternate scenarios to be used in future work. This research demonstrates the suitability and utility of LiDAR and WDPM complemented by community participation for improving flood mapping in the Prairie Pothole Region (PPR). The approach used in the study also serves as an important guide for applying transdisciplinary tools and methods for establishing good practice in research and helping build resilient communities in the Prairies.

1. Introduction

Floods are considered to be natural processes [1]; however, in recent years, the global increase in flooding incidents has been associated with climate change [2,3]. Higher number and frequencies of floods increase the risk of damaging properties, destroying infrastructures, and reducing the overall well-being of people. Many communities who are perhaps ‘accustomed’ to flooding and once felt that occasional flooding was part of their lives are at greater risk [1,4]. This narrative stands true for many small and rural communities living in the Canadian Prairies.
The landscape of the Canadian Prairies, which is part of the greater North American Prairie Pothole Region (PPR), is characterized by millions of wetland depressions, also known as potholes [5,6]. While many of these depressions are isolated, they can occasionally connect at times of high overland water flow through a mechanism known as ‘fill and spill’ [5,7]. These wetland depressions have high water storage capacities and capture the majority of runoff generated from snowmelt [8]. The extensive land use change in the PPR and uncertainties arising from changing climate change, however, have increased flood magnitudes in the Prairies [6,8]. These increases intensify vulnerabilities in rural communities. While in the past, rain-on-snow incidents were rare in the Prairies, they are becoming more frequent. The flooding between 2011 and 2016 in Saskatchewan and Manitoba was a result of a rain-on-snow contribution [9]. There is, therefore, a need to create modernized flood risk management tools to support community preparation for future events brought on by the climate emergency.
Flood risk management involves identifying and managing hazards and inundated areas as well as the particular population’s vulnerability when confronted with unexpected inundated areas [4]. Hydrological and hydraulic models are often used to produce flood inundation maps that provide information on the spatial extent of floodwater. These maps can be useful for first responders, risk managers, policy-makers, and engineers [10]. There are, however, several challenges to using conventional hydrological models for flood mapping in the PPR. First, the complex and dynamic nature of the PPR hydrology presents challenges in using well-developed hydrological and hydraulic models which often rely on rainfall-runoff data as input and are not capable of reproducing the spring runoff processes dominated by snowmelt and ‘fill and spill’ hydrology [11,12]. Additionally, PPR basins may not contain any naturally-formed streams. Local attributes such as wetlands and weather conditions, can lead to small-scale, localized flooding [5]. Second, hydrological models which rely in part on historical data often lack spatially relevant information that is required to identify hazard areas and implement locally-relevant flood management strategies [3]. Third, effective flood risk management requires improved communication between experts and stakeholders [13]. Improved communication does not only involve disseminating model findings to the public, it should additionally focus on encouraging participation in identifying flood concerns that will help produce information relevant to local contexts [14]. The three needs exemplify recent calls for transdisciplinary methodologies that allow the integration of different methods and knowledge systems for accurate and relevant flood mapping [15].
Public participation in flood-related spatial modeling and analysis has seen increasing appreciation and acceptance in the last decade, and led to advances in disaster awareness [16] as well as in risk planning and management [17,18]. Innovative tools, data gathering methods, and processing techniques have provided opportunities for researchers to engage with local people and establish processes that create benefits for local communities [19,20]. New participatory processes for flood mapping and planning promote inclusivity and empower communities to develop their management plans [21]. The level of public participation in spatial analysis can vary. Stakeholders and community members can measure or provide data to be fed directly into geoprocessing software; help in the interpretation of data or information; provide context, experience, and knowledge of historical events; put forward opinions and needs; and assess methods, tools, or results [20]. Public participation in spatial modeling provides ways to integrate public knowledge, including local spatial knowledge and indigenous knowledge with conventional scientific approaches [22,23].
In this study, we detail one such integrative participatory approach for flood mapping for an indigenous community in the PPR using spatial data and modeling techniques. We evaluate the utility of different spatial data and modeling outputs for community flood preparedness and management. First, we discuss the opportunities for using light detection and ranging digital elevation model (LiDAR DEM) and wetland DEM ponding model (WDPM) for flood mapping in the PPR. Then, using an actual LiDAR DEM combined with a spatially distributed model wetland digital elevation model (DEM) ponding model (WDPM), we display our locally relevant flood map. The map provides an initial overview of flood extent rather than a detailed analysis of flood dynamics, which was beyond the scope of this paper. Instead, we responded to the community’s need to have an accessible and up-to-date spatial tool that supports community decision making for flood resilience. The three objectives of the study were to:
  • Assess the ability to combine data from LiDAR, a physical survey of culverts, and WDPM to accurately portray flood extent in PPR;
  • Model flood extent through community-driven flood scenarios and produce meta-data to support community decision making for flood resilience;
  • Evaluate the utility of the modeling pathway and meta-data using satellite imagery and community reflection.

2. Materials and Methods

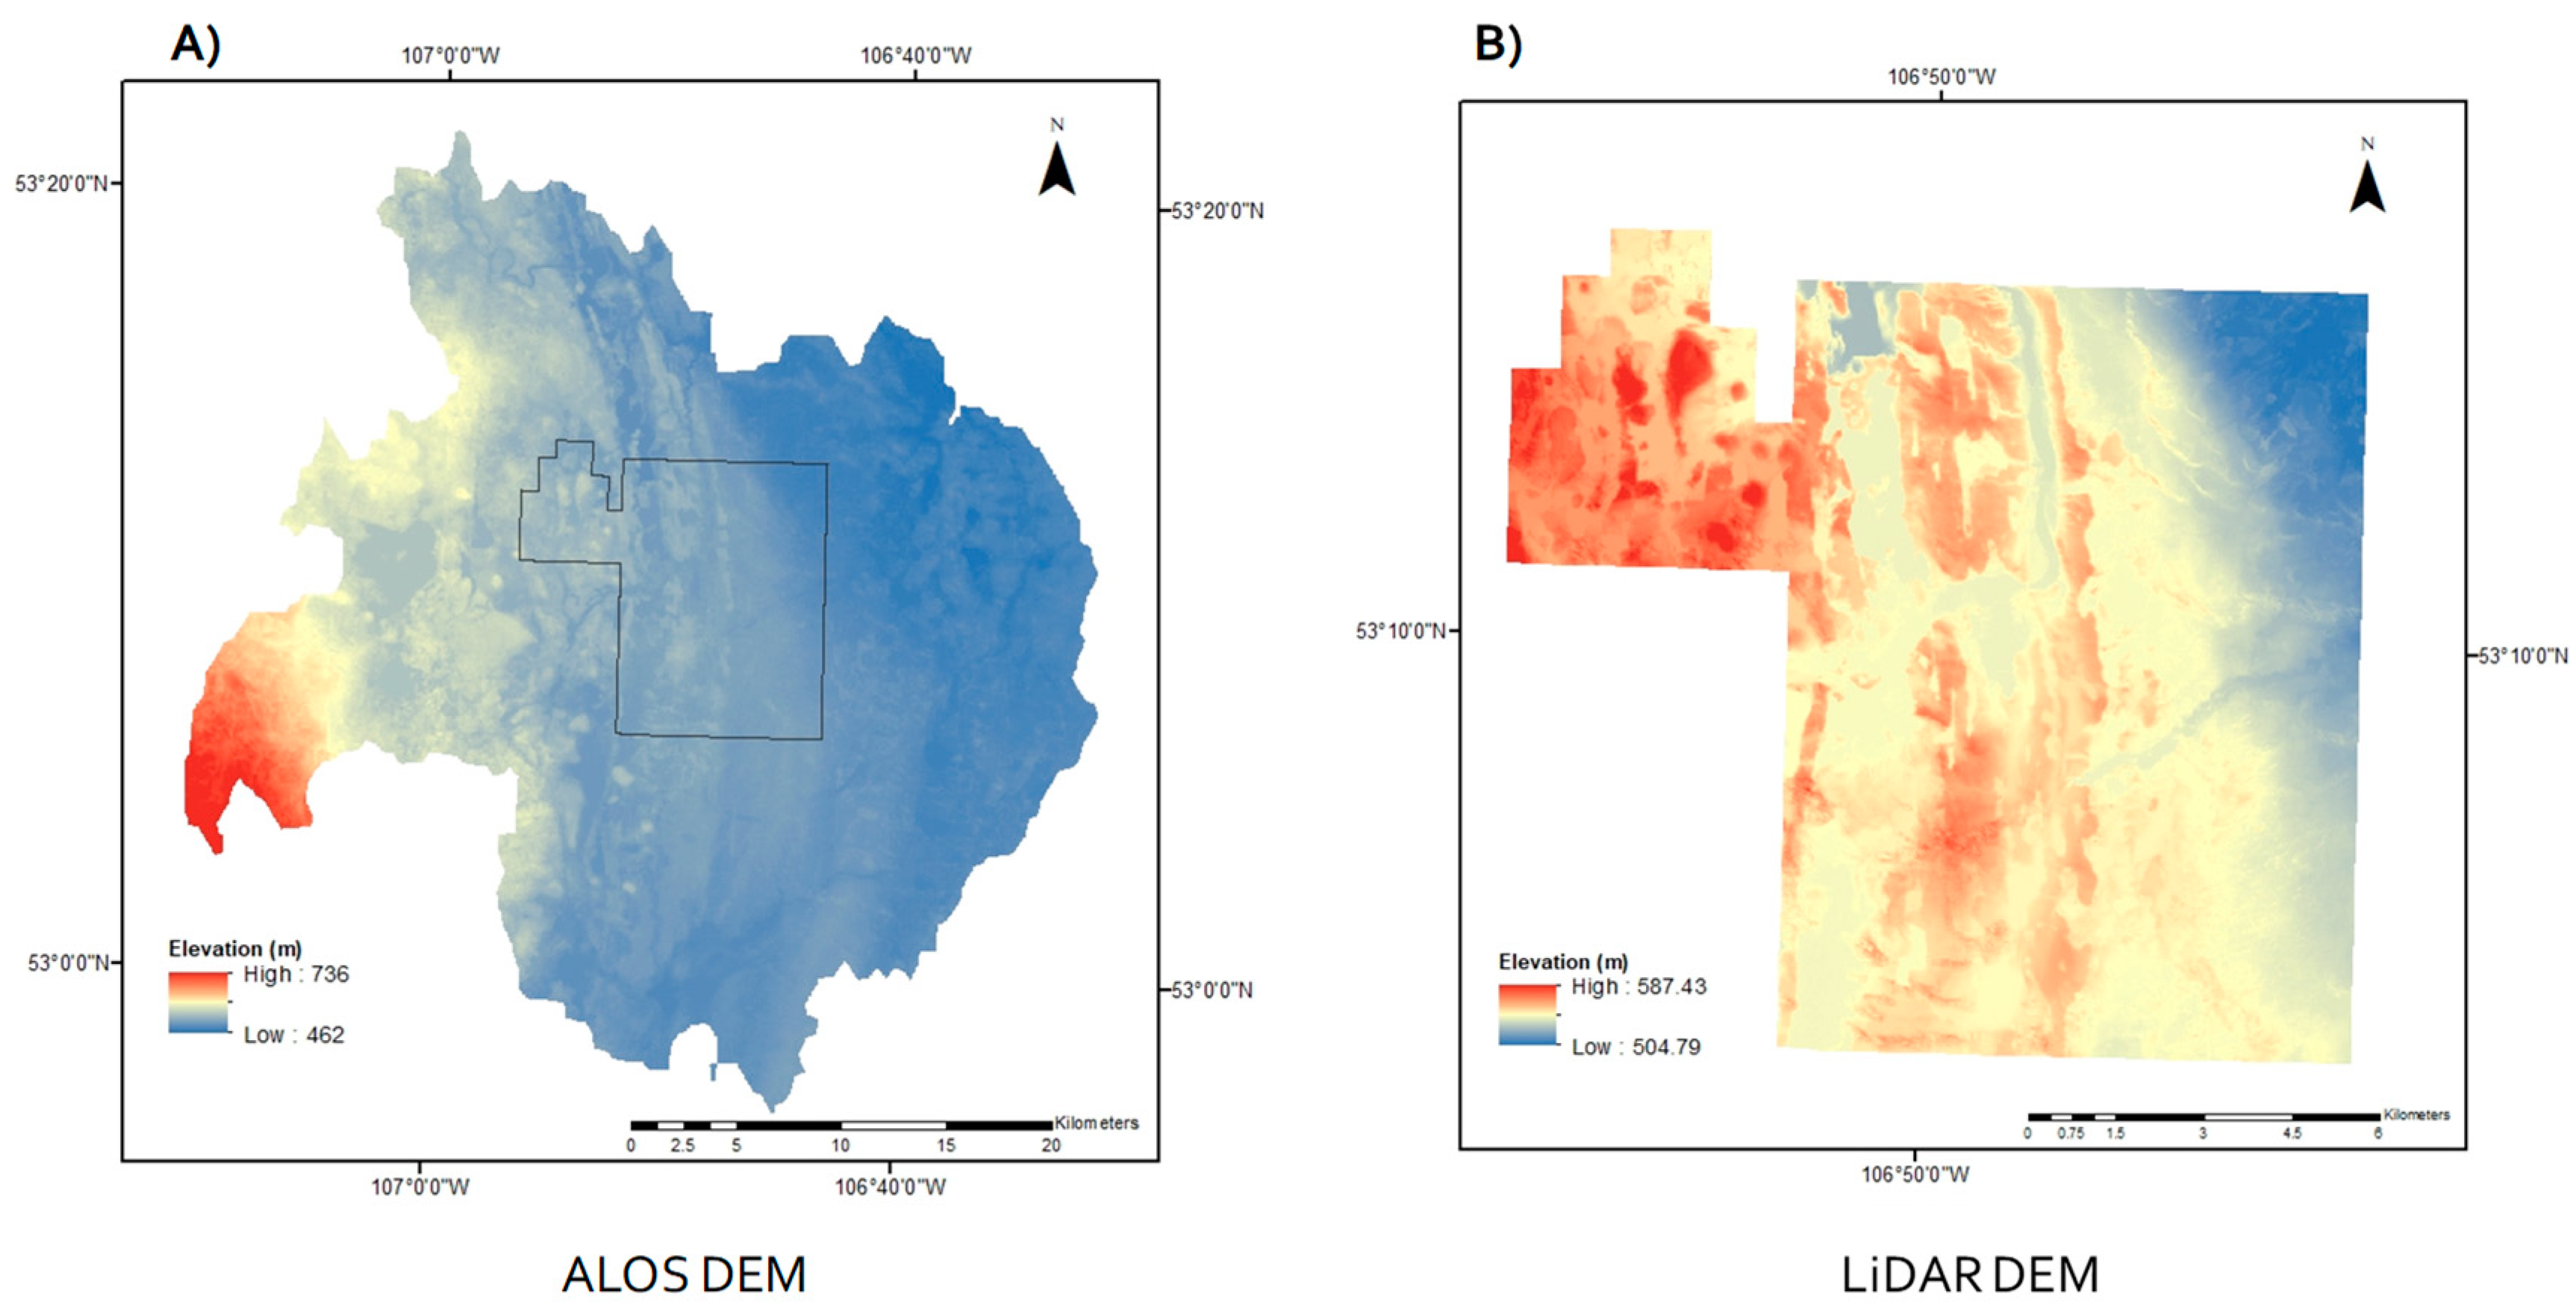
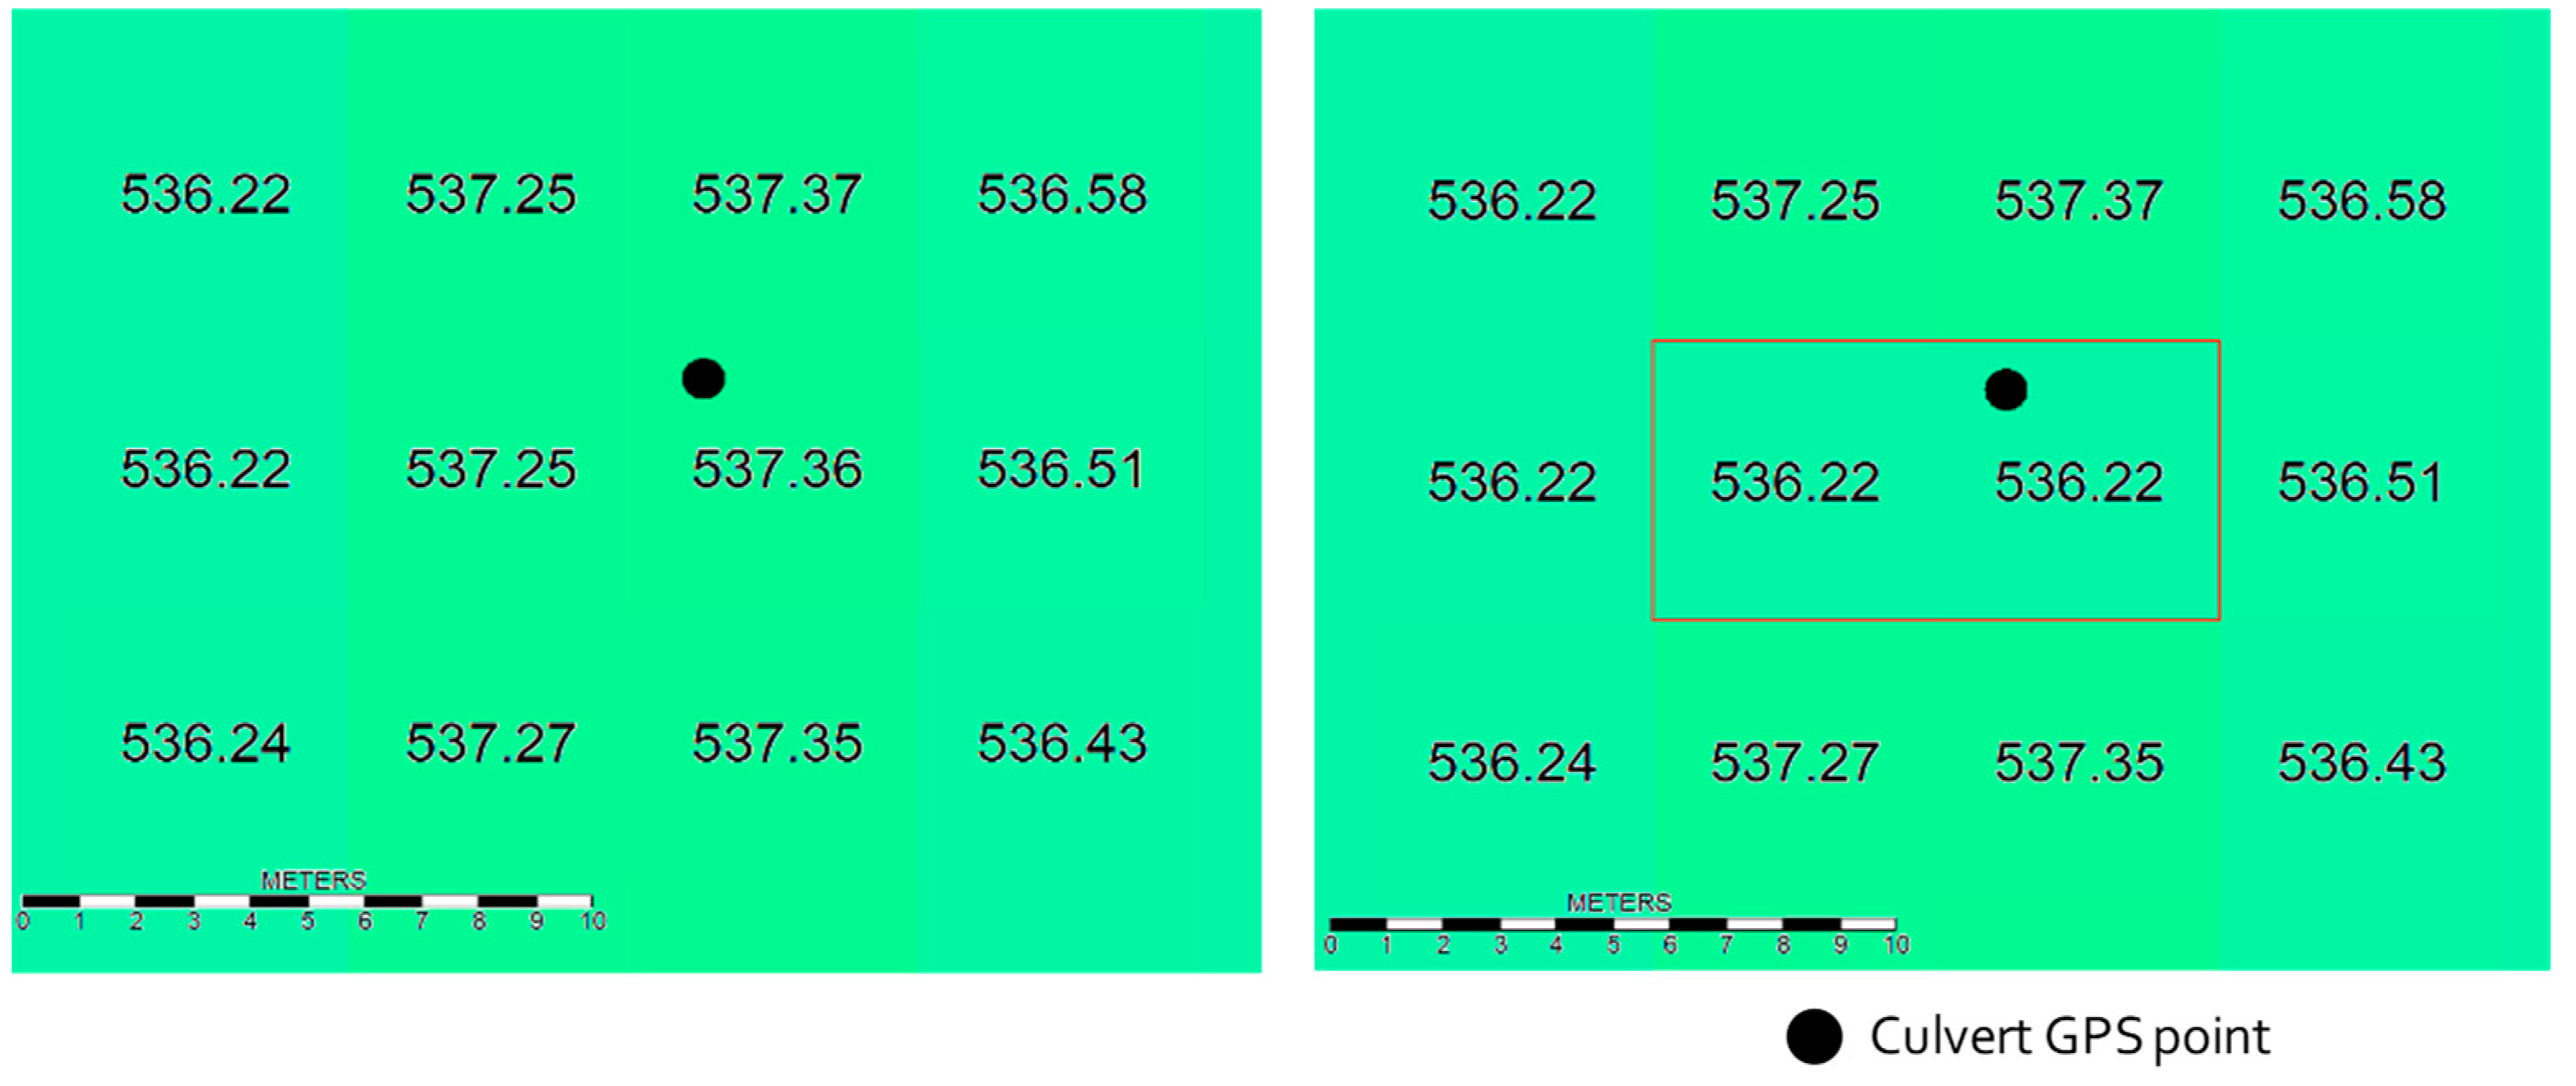
2.1. LiDAR DEM for Flood Mapping

Remote sensing (RS) techniques have proven an asset in flood delineation and assessment globally [3,24,25,26,27]. The current growing significance of RS in flood studies and monitoring comes from the fact that in many parts of the world, gauging stations are either damaged or absent, which results in inadequate ground data to feed into models [3,24]. In addition, RS’s additional spatial coverage and ability to demonstrate flood extent from local to catchment scales, is advantageous [3]. A recent RS development, the light detection and ranging (LiDAR) system, provides opportunities for creating detailed and accurate flood mapping and monitoring in ungauged basins and flat areas like the PPR [8,24,28].
LiDAR surveys can be processed to provide accurate topographic datasets known as digital elevation models (DEM), used for a variety of purposes. Most freely available global DEMs, such as the Shuttle Radar Topography Mission DEM (SRTM DEM), have vertical accuracies of greater than 15 m, whereas the vertical accuracy of LiDAR DEM is usually between 15 and 25 cm root mean square error [24,28]. Global SRTM DEMs were acquired in 2000, and hence, run the risk of not accurately representing current topographic features, especially in places where there have been extensive land use changes [29]. Schumann et al. [30] previously conducted a comparative flood modeling study using SRTM and LiDAR DEM. They found that although SRTM DEM provided good initial flood information at the catchment scale, it was ineffective at providing detailed flood mapping at local scales compared to the LiDAR DEM. Similarly, Armstrong et al. [11] compared the flood extent maps generated from SRTM and LiDAR DEM and found that the SRTM outputs are not useful in densely vegetated and low topographic relief areas. LiDAR DEM-based outputs are better at local scales, in flat landscapes, and can additionally be coupled with flood models to simulate flood scenarios that are visually interpretable using GIS. We used one such diagnostic processing example, LiDAR DEM, to provide the potential spatial extent of runoff and flood hazard over the relatively flat PPR landscape.

2.2. Wetland Digital Elevation Model (DEM) Ponding Model (WDPM)
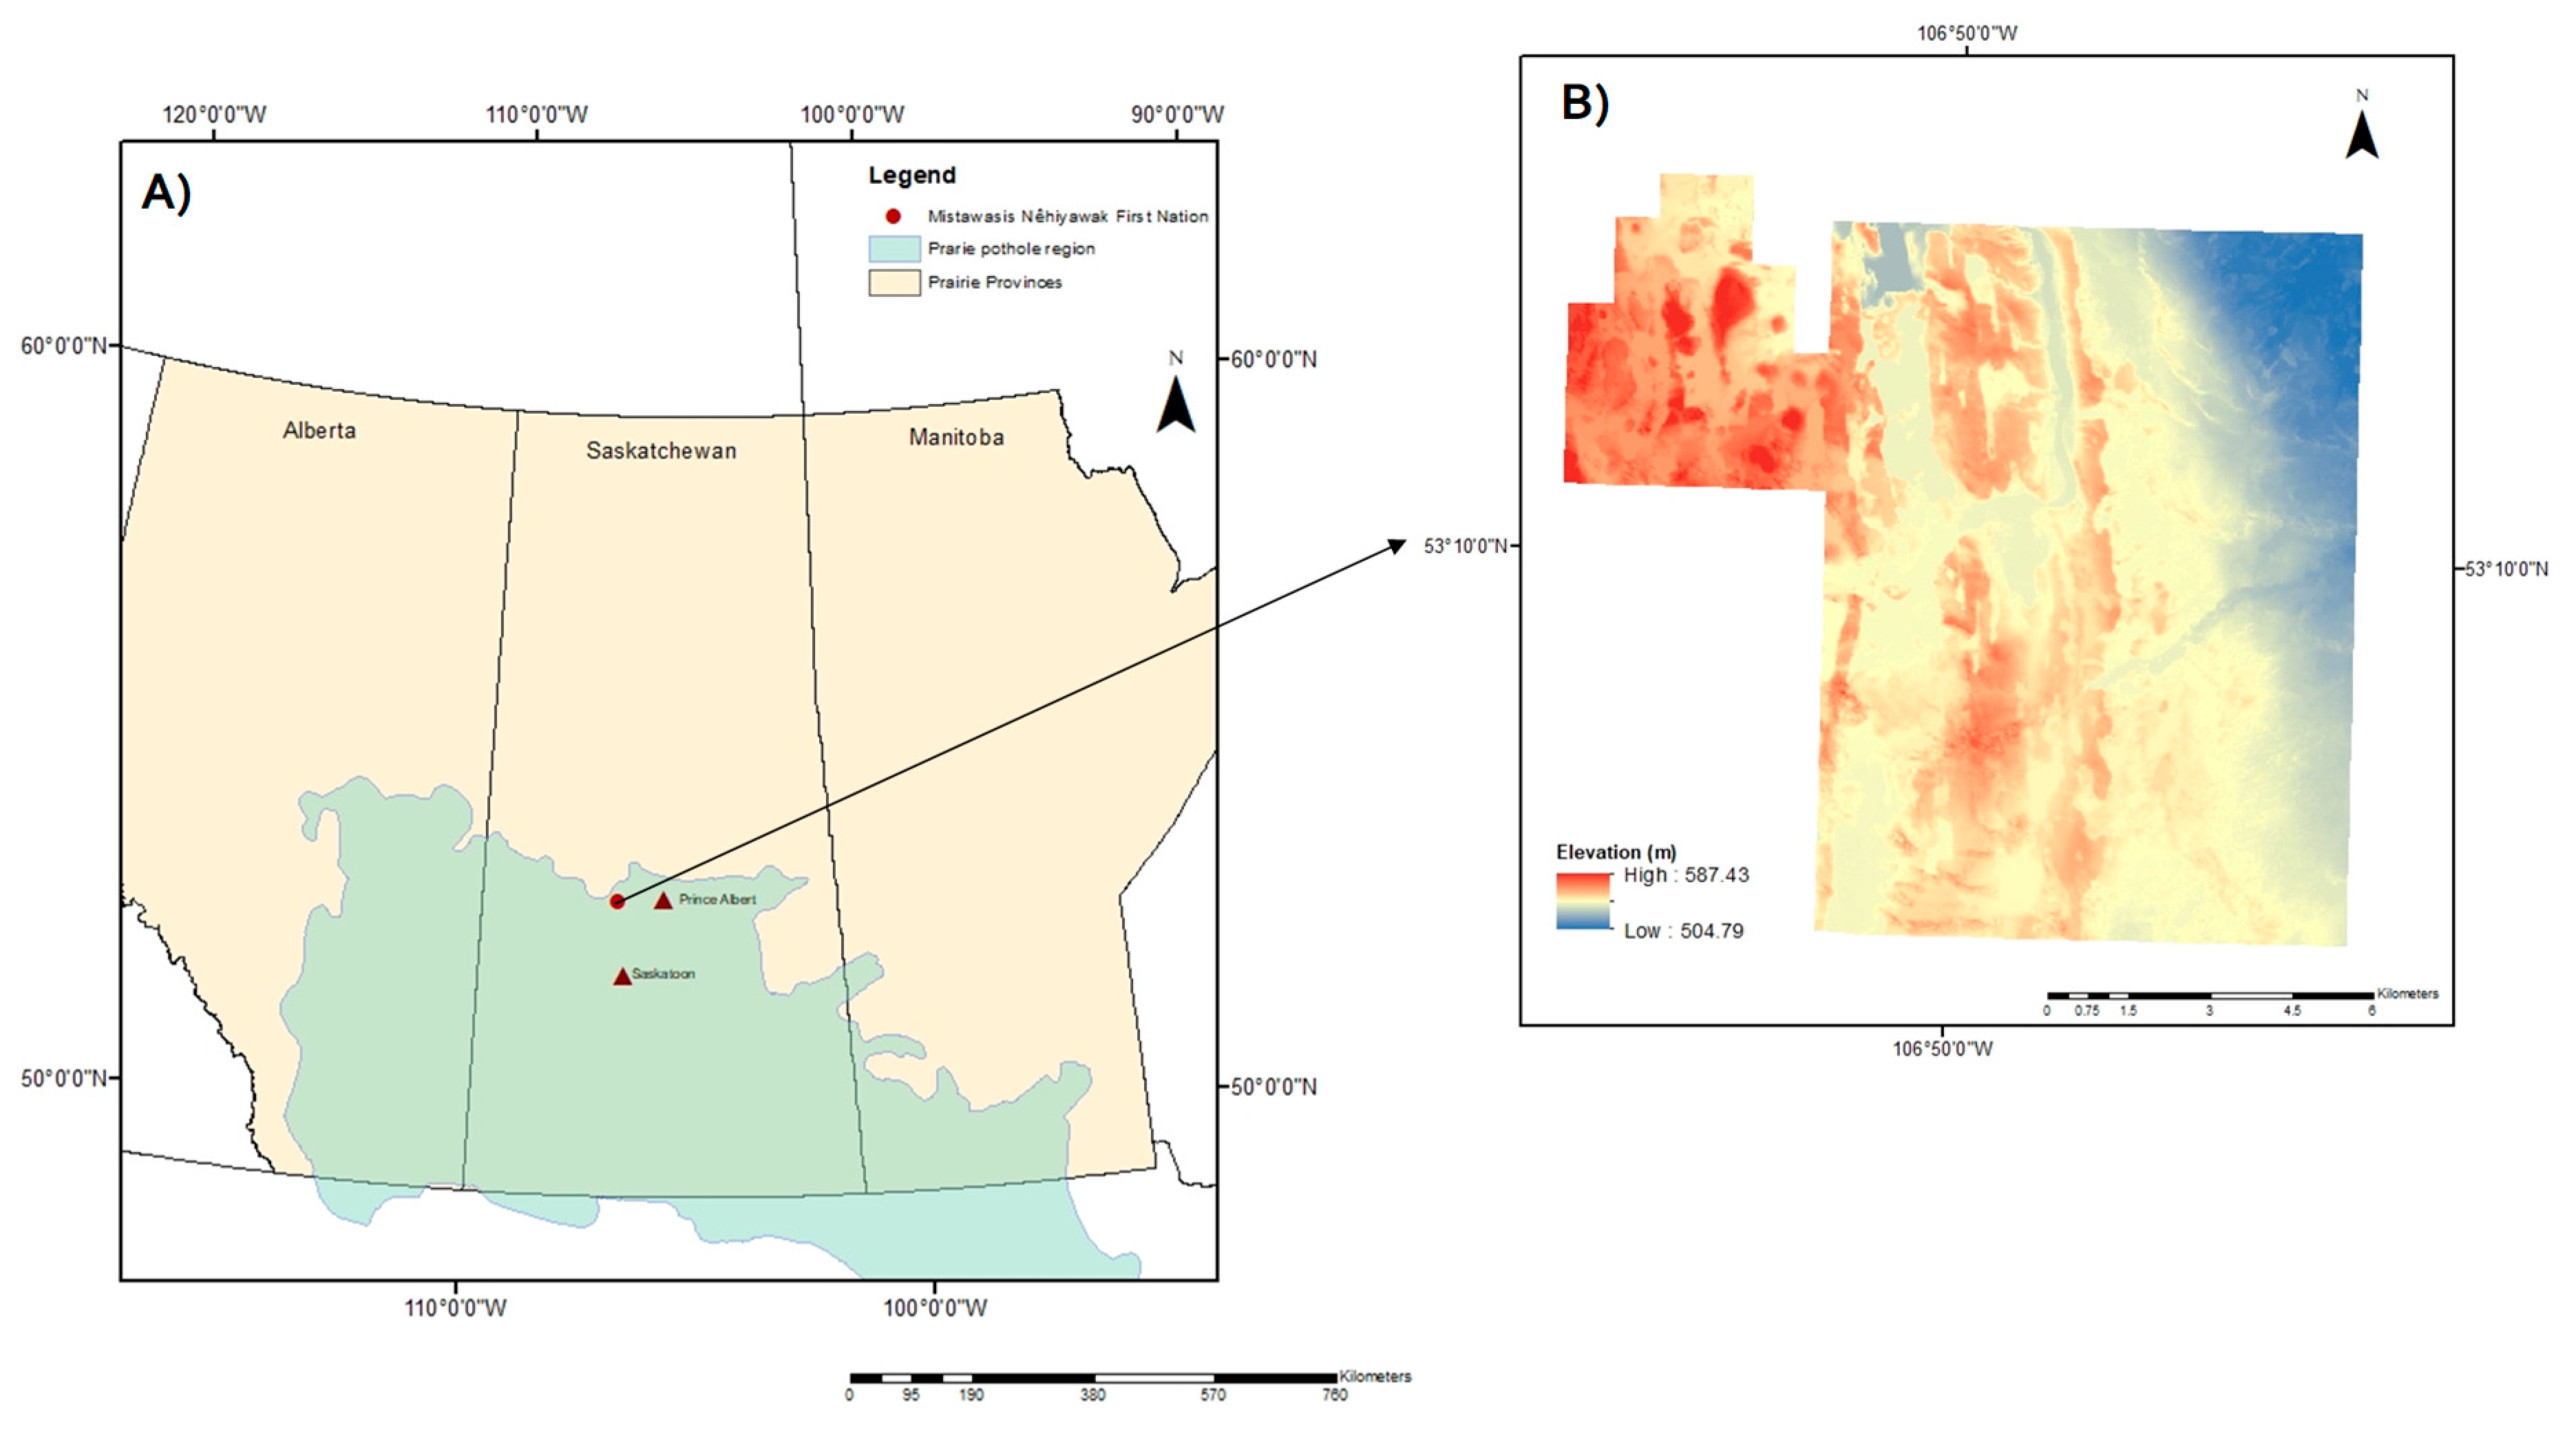
The landscape of the PPR of North America is dominated by millions of closed-basin surface depressions which are remnants from the recent glacial retreat. Most of these potholes are considered to be geographically isolated because they do not contribute to local streamflow [31]. During wet years when the depressions are filled, they may connect to other surface waterbodies (ponds, wetlands, and streams) and sometimes contribute to local flooding [32,33].
The wetland DEM ponding model (WDPM) stimulates the spatial distribution of excess runoff on a PPR landscape [32]. The original purpose of the model was to understand the complexities of contributing areas of prairie basins, which are often governed by the amount of water in the depressional features [31]. WDPM has also been deployed as a diagnostic tool in determining flooding extent, such as in the land and infrastructure resiliency assessment (LIRA) studies in the Canadian Prairies [11].
WDPM models the fill and spill behavior of depressional storages or wetlands using the Shapiro and Westervelt algorithm [34]. The WDPM tool requires two inputs: a DEM in ESRI ASCII (.asc) format, and the reference depth of water to be applied over the DEM. This depth of water can either be chosen arbitrarily or reference water depths can be used based on historical flood events (e.g., the Vanguard flood, SK in 2000) and return periods (e.g., 1:50 years, 1:100 years.) [11]. The model then applies the reference water depth over a DEM uniformly [31].
The uniform application of water over a landscape can lead to the simulations being an exaggeration of actual flooding extents. Since the model cannot determine the final location or distribution of excess water, however, the output can be useful in providing a qualitative description of flooding extent in a worst-case scenario [11,31]. The output from the program is a water depth file that can be imported to a GIS program and overlaid on an aerial image, DEM, or other community-relevant spatial information [32].
Unlike other conventional drainage algorithms, the algorithm used in WDPM [34] allows water to be drained in more than just one direction. The algorithm used in the model allows the simulation of dynamic changes in the wetland-dominated landscape when water is added, removed, or drained [32]. This means that the algorithm physically moves the water between the neighboring cells across the DEM iteratively, and therefore, can be extremely slow depending on the size of the DEM, depth of water added and the type of computer processor used [5]. The model is only capable of simulating runoff extent above the elevations of water which was present when the LiDAR survey was performed, and currently, model simulations cannot be executed in real time [31]. This means that it may be necessary to establish the initial water distribution in the DEM. Nevertheless, WDPM has been proven to be a useful exploratory tool for simulating runoff extent in the PPR and has been applied in both academic and operational purposes [11,31,35].

2.3. The Study Area

Mistawasis Nêhiyawak is a Cree First Nation community located in Treaty 6 Territory, north of Saskatoon, Saskatchewan (Figure 1). The community covers an area of 145 m2 and is inhabited by approximately 681 [36] to 1400 people (local reports). In the spring of 2011, following an extremely wet winter and heavy rainfall, the community experienced a major flooding event. The 2011 flood was described as one of the worst floods since 1955/56. Since 2011, the community has experienced elevated water levels every spring. An example is evident in Turner Lake, fully contained within reserve boundaries, where the water levels have risen approximately seven feet in five years’ time [37]. The increased water levels have wrecked structures such as dams and levees previously used in the community to prevent flood damage. Localized flooding has resulted in numerous negative social and environmental impacts, including degradation of source water, riparian habitat, road inundation, and the displacement of animals that are important to local people [37]. The current flood mitigation strategies are reactive and technical in nature, and include water diversions, berms, and culvert expansions [37].
In the spring of 2014, the community experienced another major flood. Following the 2014 flood, a light detection and ranging (LiDAR) survey was performed for the community. The LiDAR survey was done to identify water features on reserve and for land-use planning. Due to limited technological capacity and resources, the LiDAR data had not been used until we started our work with the community. Responding to both the community’s desire to utilize this spatial data and their focus on adapting to ongoing flooding, we processed the LiDAR data and used WDPM to generate community flood maps.

2.4. Spatial Datasets

On 12 August 2014, an airborne LiDAR survey was performed for Mistawasis Nêhiyawak by LiDAR Services International (LSI). The LiDAR data was collected using a Riegl LMS-Q780 at the height of 910 m above the ground level with a horizontal resolution of 1 m and a vertical RMS error of 0.036 m. The LiDAR was delivered in a point cloud in LAS v1.2 format referenced to Universal Transverse Mercator (UTM) Zone 13, NAD83 horizontally and CGVD2013 vertically. An aerial image was also delivered in addition to point clouds. The collection and calibration procedure is documented in detail by LSI [38]. We acquired the LiDAR data from Mistawasis First Nation on 20 June 2018. The data was used to derive a 5 m resolution digital elevation model (DEM) with the help of the Spatial Initiative Lab at the University of Saskatchewan (Figure 2).
In addition to the LiDAR dataset, we georeferenced the culvert locations in the community with the help of the local director of lands. Altogether, 52 GPS points were collected at locations where the culverts had been placed. For this study, we were only interested in where the culverts were, not on their physical parameters such as length, diameter of culvert pipe, and bridge span [39]. The culvert points, stored as vector point features, were manually digitized and inserted into the LiDAR-derived DEM using a free open source GIS software called System for Automated Geoscientific Analyses (SAGA) GIS v6.3.0. The rationale for including the culverts into the DEM was to allow water to be distributed properly while modeling and avoiding water backing up as a result of road networks [11,32,40]. Digitized culvert features represented the potential low elevation point allowing water to flow through (Figure 3) [41].
A freely available coarser resolution DEM dataset was used to compare results with LiDAR-DEM. ALOS/PALSAR DEM was obtained from the Alaska Satellite Facility (ASF) Distributed Active Archive Center (DAAC). ALOS DEM has a finer resolution (12.5 m) compared to SRTM DEM (5 m) but lower spectral resolution compared to LiDAR data [41]. It is freely available and generally error free; however, its vertical accuracy is 1 m. A change in vertical accuracy of 1 m can have large effects in the PPR. We obtained ALOS DEM (Figure 2B) covering the entire community and surrounding areas that contribute water during precipitation events. Table 1 describes the dataset used in the study.
Finally, WDPM simulations for both LiDAR DEM and ALOS DEM were compared to satellite imagery for accuracy assessment.

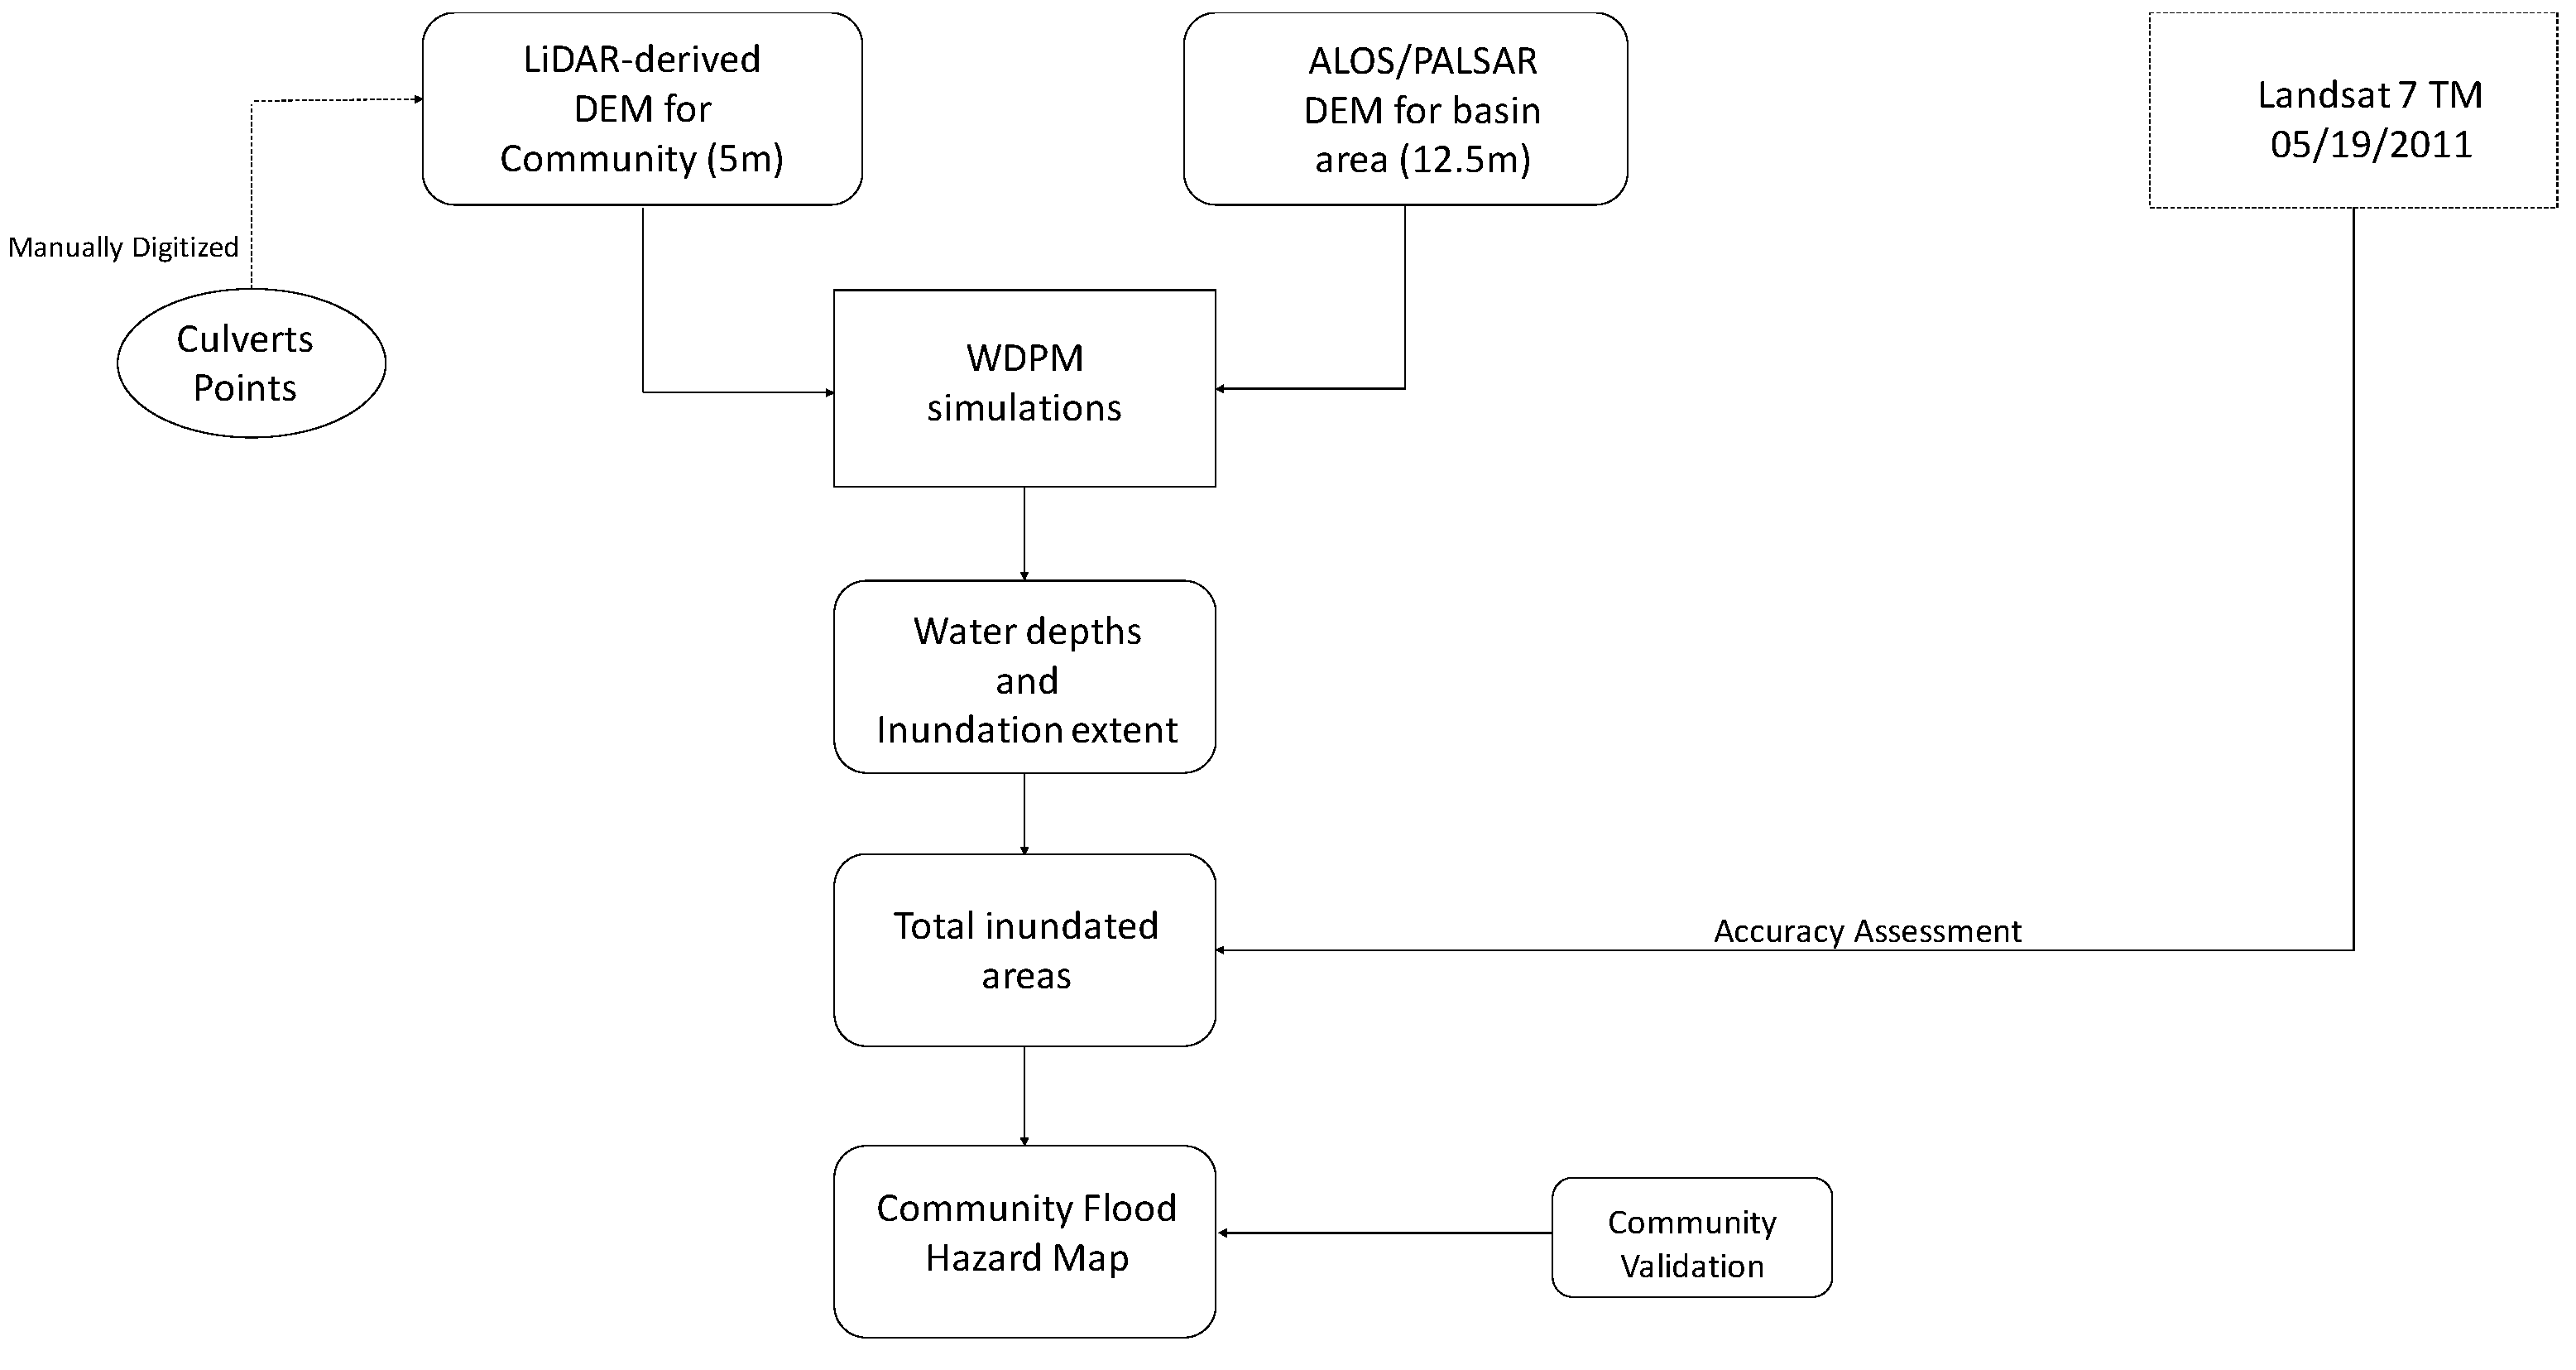
2.5. Methodology for Generating Flood Extent Maps: Overview

A flowchart of the process we used to generate a community flood hazard map is shown in Figure 4.
Water depths of 10, 20, 42, and 82 mm were used as reference depths for WDPM simulations to observe the flooding extent for different precipitation amounts. These depths were derived from the interest of the community as they represented minimal, average, and extreme storms. In addition, starting with small amounts of water depth and moving to extreme storm events allowed us to establish more or less the initial water distribution in the DEM; i.e., fill up permanent wetlands and lakes. The reference depth 42 mm corresponded to the average Snow Water Equivalent (SWE) depth calculated from 38 years (1970–2011) of snow depth data. It was used to represent the average water level during the snowmelt in the spring. For deriving this SWE depth, the snow density model described in Sturm et al. [42] was used. This method was selected because it allowed a quick estimate of SWE without having to do snow surveys with daily snow depth data available from the Environment Climate Change Canada website [42,43]. Existing data from 38 winters (late November to March) were used. The years September 2008 and October 2009, which had missing data, were omitted from the calculations. The reference depth of 82 mm corresponded to a 100-year flood event (24 h rainfall depth) that was obtained from frequency analyses using the Gumbel Distribution method for 38 years of rainfall data (1975–2012) and confirmed with Environment Canada’s (2012) Gumbel distribution of annual maximum rainfalls.
The algorithm used in WDPM prevents any of the water applied from leaving the DEM, making the edges of the DEM act as blockades or dams [32]. Therefore, after adding successive reference depths, the DEMs were also drained to avoid backing up of the water and to more accurately mimic natural PPR water cycles.
The Shapiro and Westervelt [34] algorithm moves the water in multiple directions and considers all potential pathways for water flow. Thus, for each simulation, the model shows the dynamic changes in the spatial extent of simulated flooding [32]. The outputs from WDPM are water depth files which were exported to and further analyzed in ArcMap version 10.6.1 (Esri, Redlands, CA, USA). Water depths obtained for LiDAR-DEM were assessed for each reference depth and then classified across six categories based on the inundation depths that corresponded to increasing hazard levels [44,45,46]. For each inundation depth, the percentage of inundated areas was calculated. Water depths from WDPM for the 100 year event were also used for flood mapping. Finally, to evaluate the performance of two spatial datasets and WDPM, we compared the total inundated areas for LiDAR DEM and ALOS/PALSAR DEM with Landsat 7 TM imagery from May 2011, the closest date to flooding reported by community members.
For assessment with local community members, a workshop was held in 21 March 2019 in the community to gain insights on the utility of WDPM-generated flood maps and discuss their viewpoints on the model. The workshop design and survey questionnaires were approved by University of Saskatchewan (BEH-17-396). A brief presentation was given to introduce LiDAR, LiDAR importance, modeling approaches, the comparison of WDPM-generated flood maps versus satellite imagery, and the limitations of our work. We then asked the participants to complete a survey to assess the value of the model outputs for community flood management. A focus group [47,48] discussion after the presentation provided more feedback on the model and outputs.

3. Results

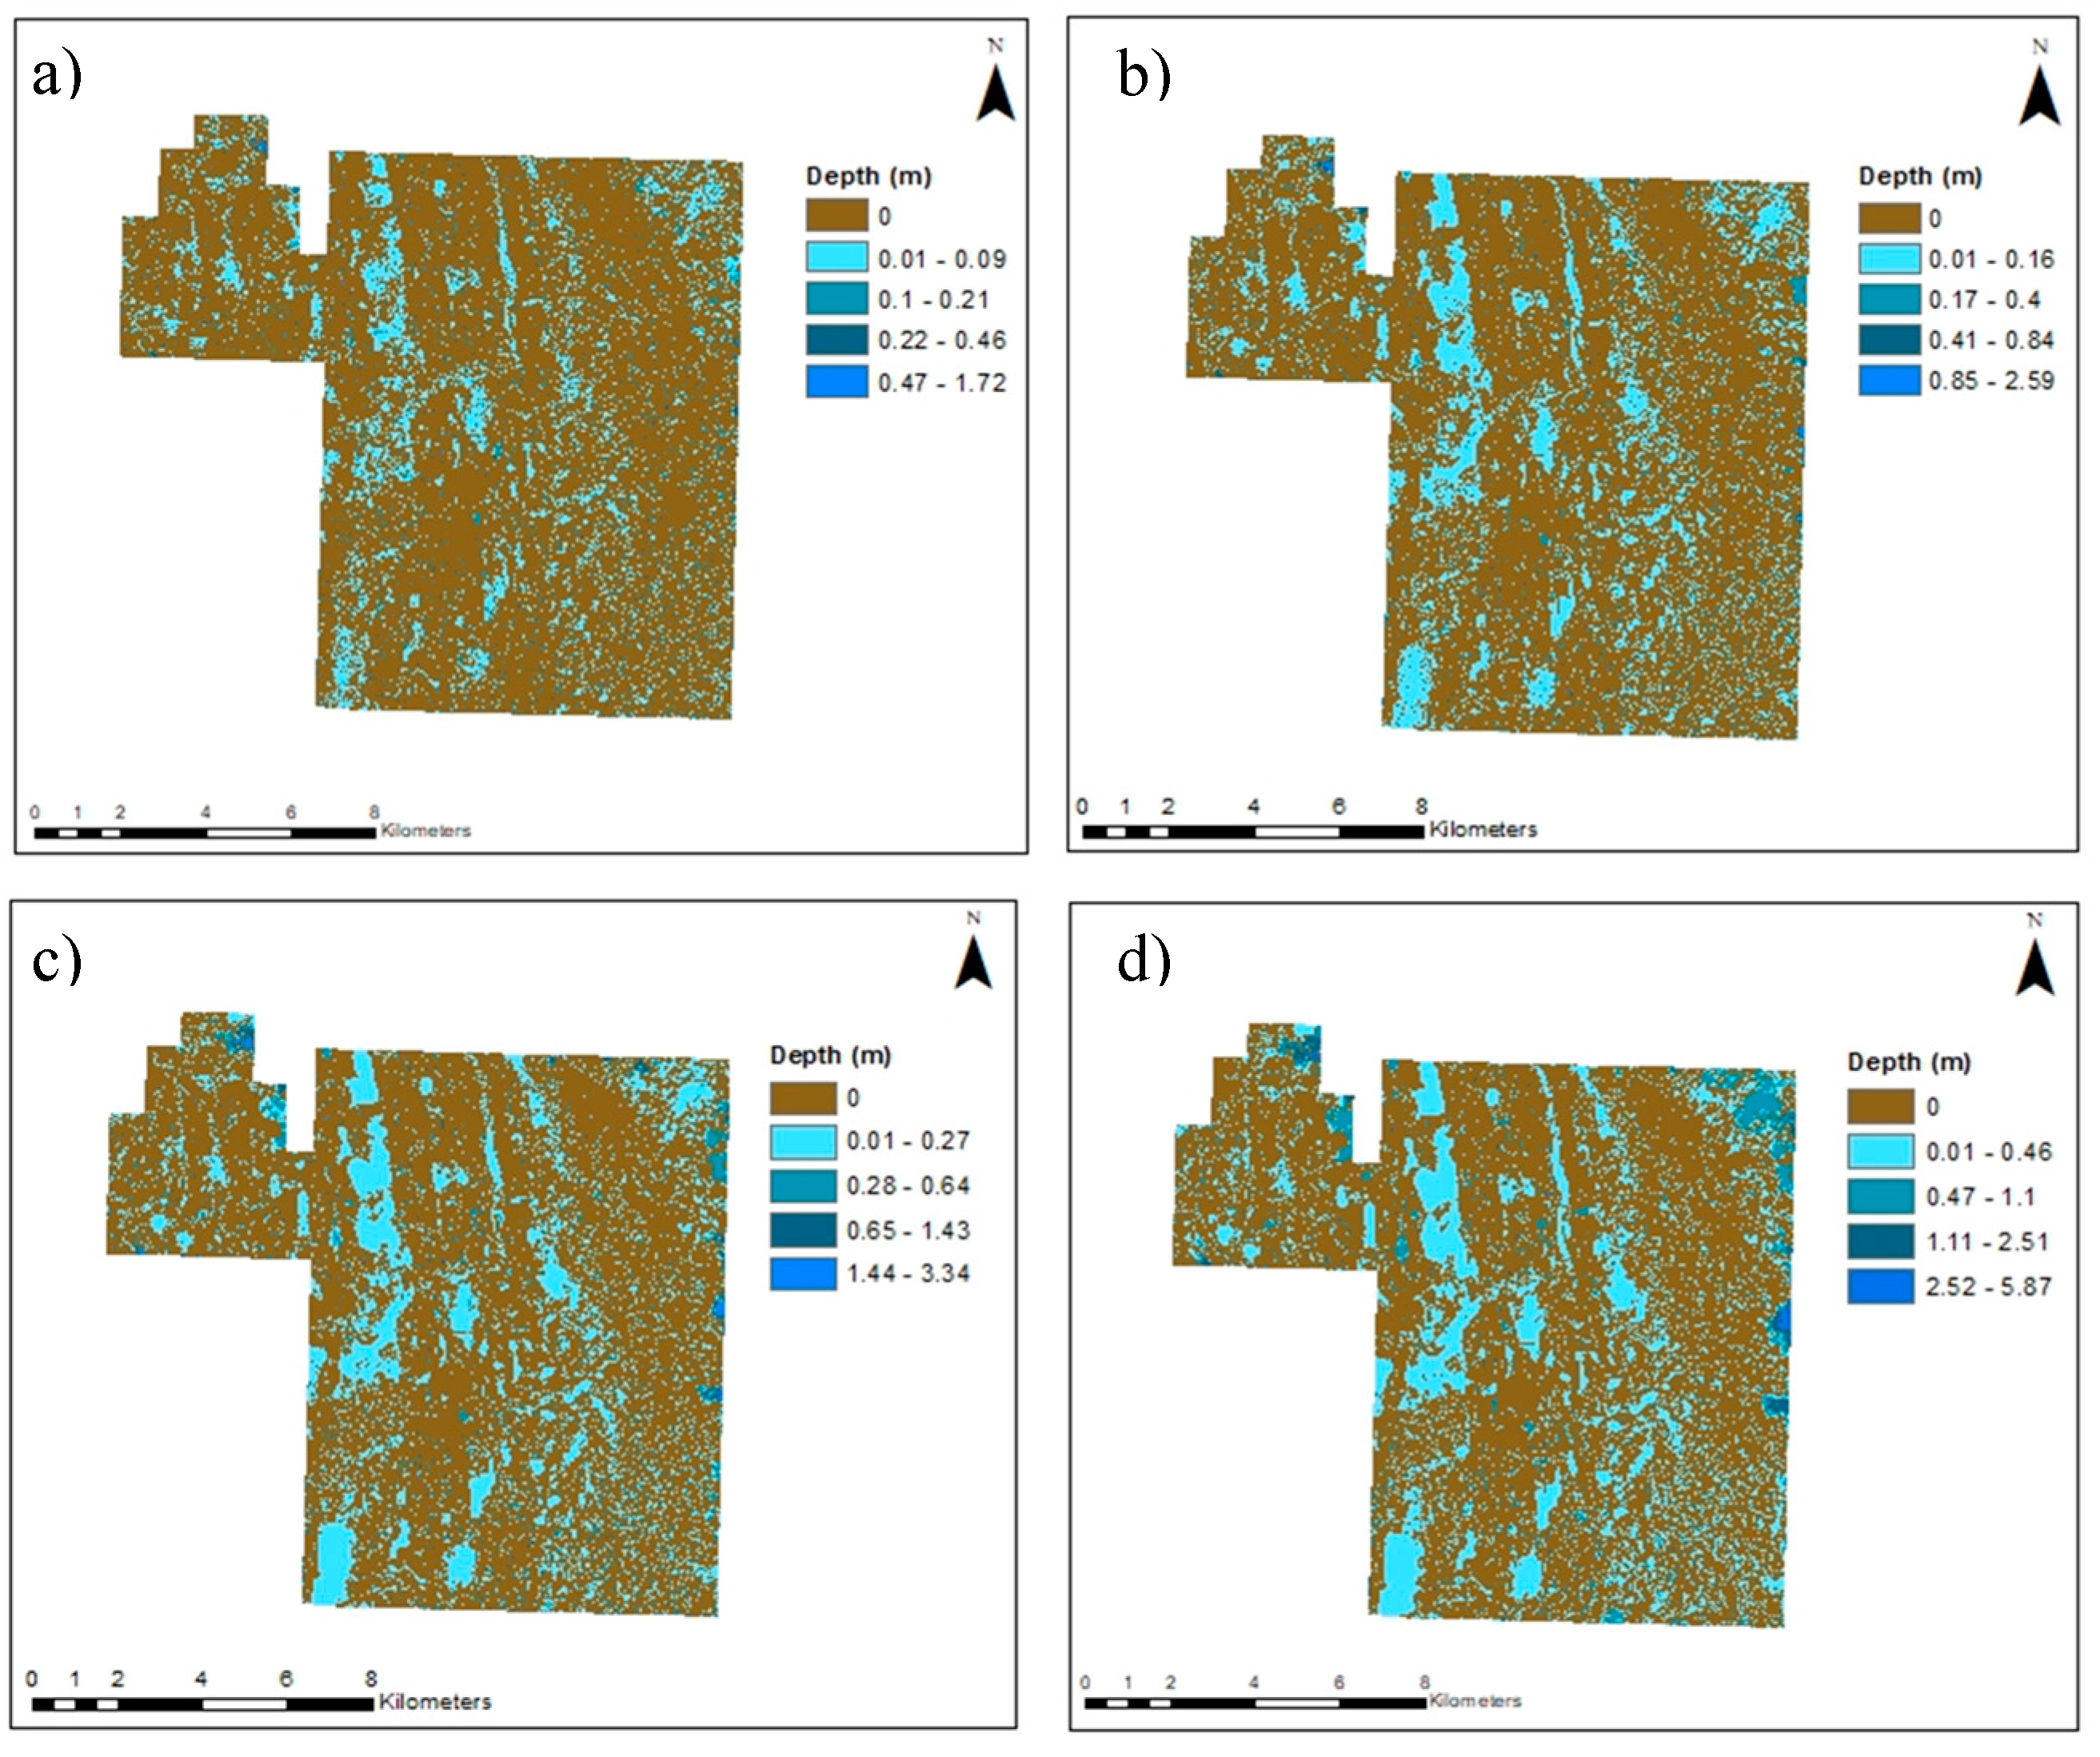
3.1. Evaluation of WDPM: Water Depth and Flood Hazard Map

Runtimes for scenarios of the four reference depths (Table 2) were limited by the model’s ability to incorporate time step and the range of processes that influence wetland dynamics in the PPR (see [5,31,32]).
The final spatial distributions of simulated runoff for Mistawasis Nêhiyawak LiDAR DEM are shown in Figure 5 for the four scenarios.
The output file contained information of water depth in each cell in the DEM. With the water depth information, the inundation area can be calculated in ArcMap [45]. Table 3 summarizes the water depth and area covered with water observed from WDPM simulations. The extent of the inundated area increased from 17.65% to 27.93% in the region of interest. The inundation extent also increased for increasing depths of water applied to the DEM with a maximum of 27.93% inundated area when 82 mm water was applied (1 in 100 year event).
To establish the accuracy of the model outputs, we assessed the inundation extent for a 100 year flood event (82 mm reference depth) by comparing results with the aerial photographs taken after the 2011 flood events. Figure 6 shows the observed extent of flooding in different parts of the community. The accumulation areas simulated from WDPM fit within the actual accumulation zones on the aerial photographs, demonstrating that WDPM can provide an accurate representation of flooding extent and potential “hotspots” or accumulation zones.
Finally, with the water depth information, we also created a flood hazard map that showed both the inundation depth and flood extent Figure 7.

3.2. Evaluation of WDPM: Accuracy Assessment

3.2.1. ALOS/PALSAR DEM

The WDPM was also tested using a coarser ALOS/PALSAR DEM which has a resolution of 12.5 m with a vertical accuracy of 1 m. While we only had the LiDAR-DEM for the community within the reserve’s political boundaries, in the case of the ALOS/PALSAR DEM, we included the surrounding contributing areas (Table 1). For ALOS/PALSAR DEM, we added 42 and 82 mm of water. The total inundated areas were found to be 1610.47 and 2134.13 ha for 42 and 82 mm of water added respectively (Table 4). These were much lower than the total inundated areas covered in LiDAR-DEM for the same amount of water added, which were 3766.97 and 4185.07 ha for 42 and 82 mm (1 in 100 flood, 24 h rainfall) reference depths. Next, we compared the results with satellite images and evaluated the overall performance of WDPM with the two different DEMs.

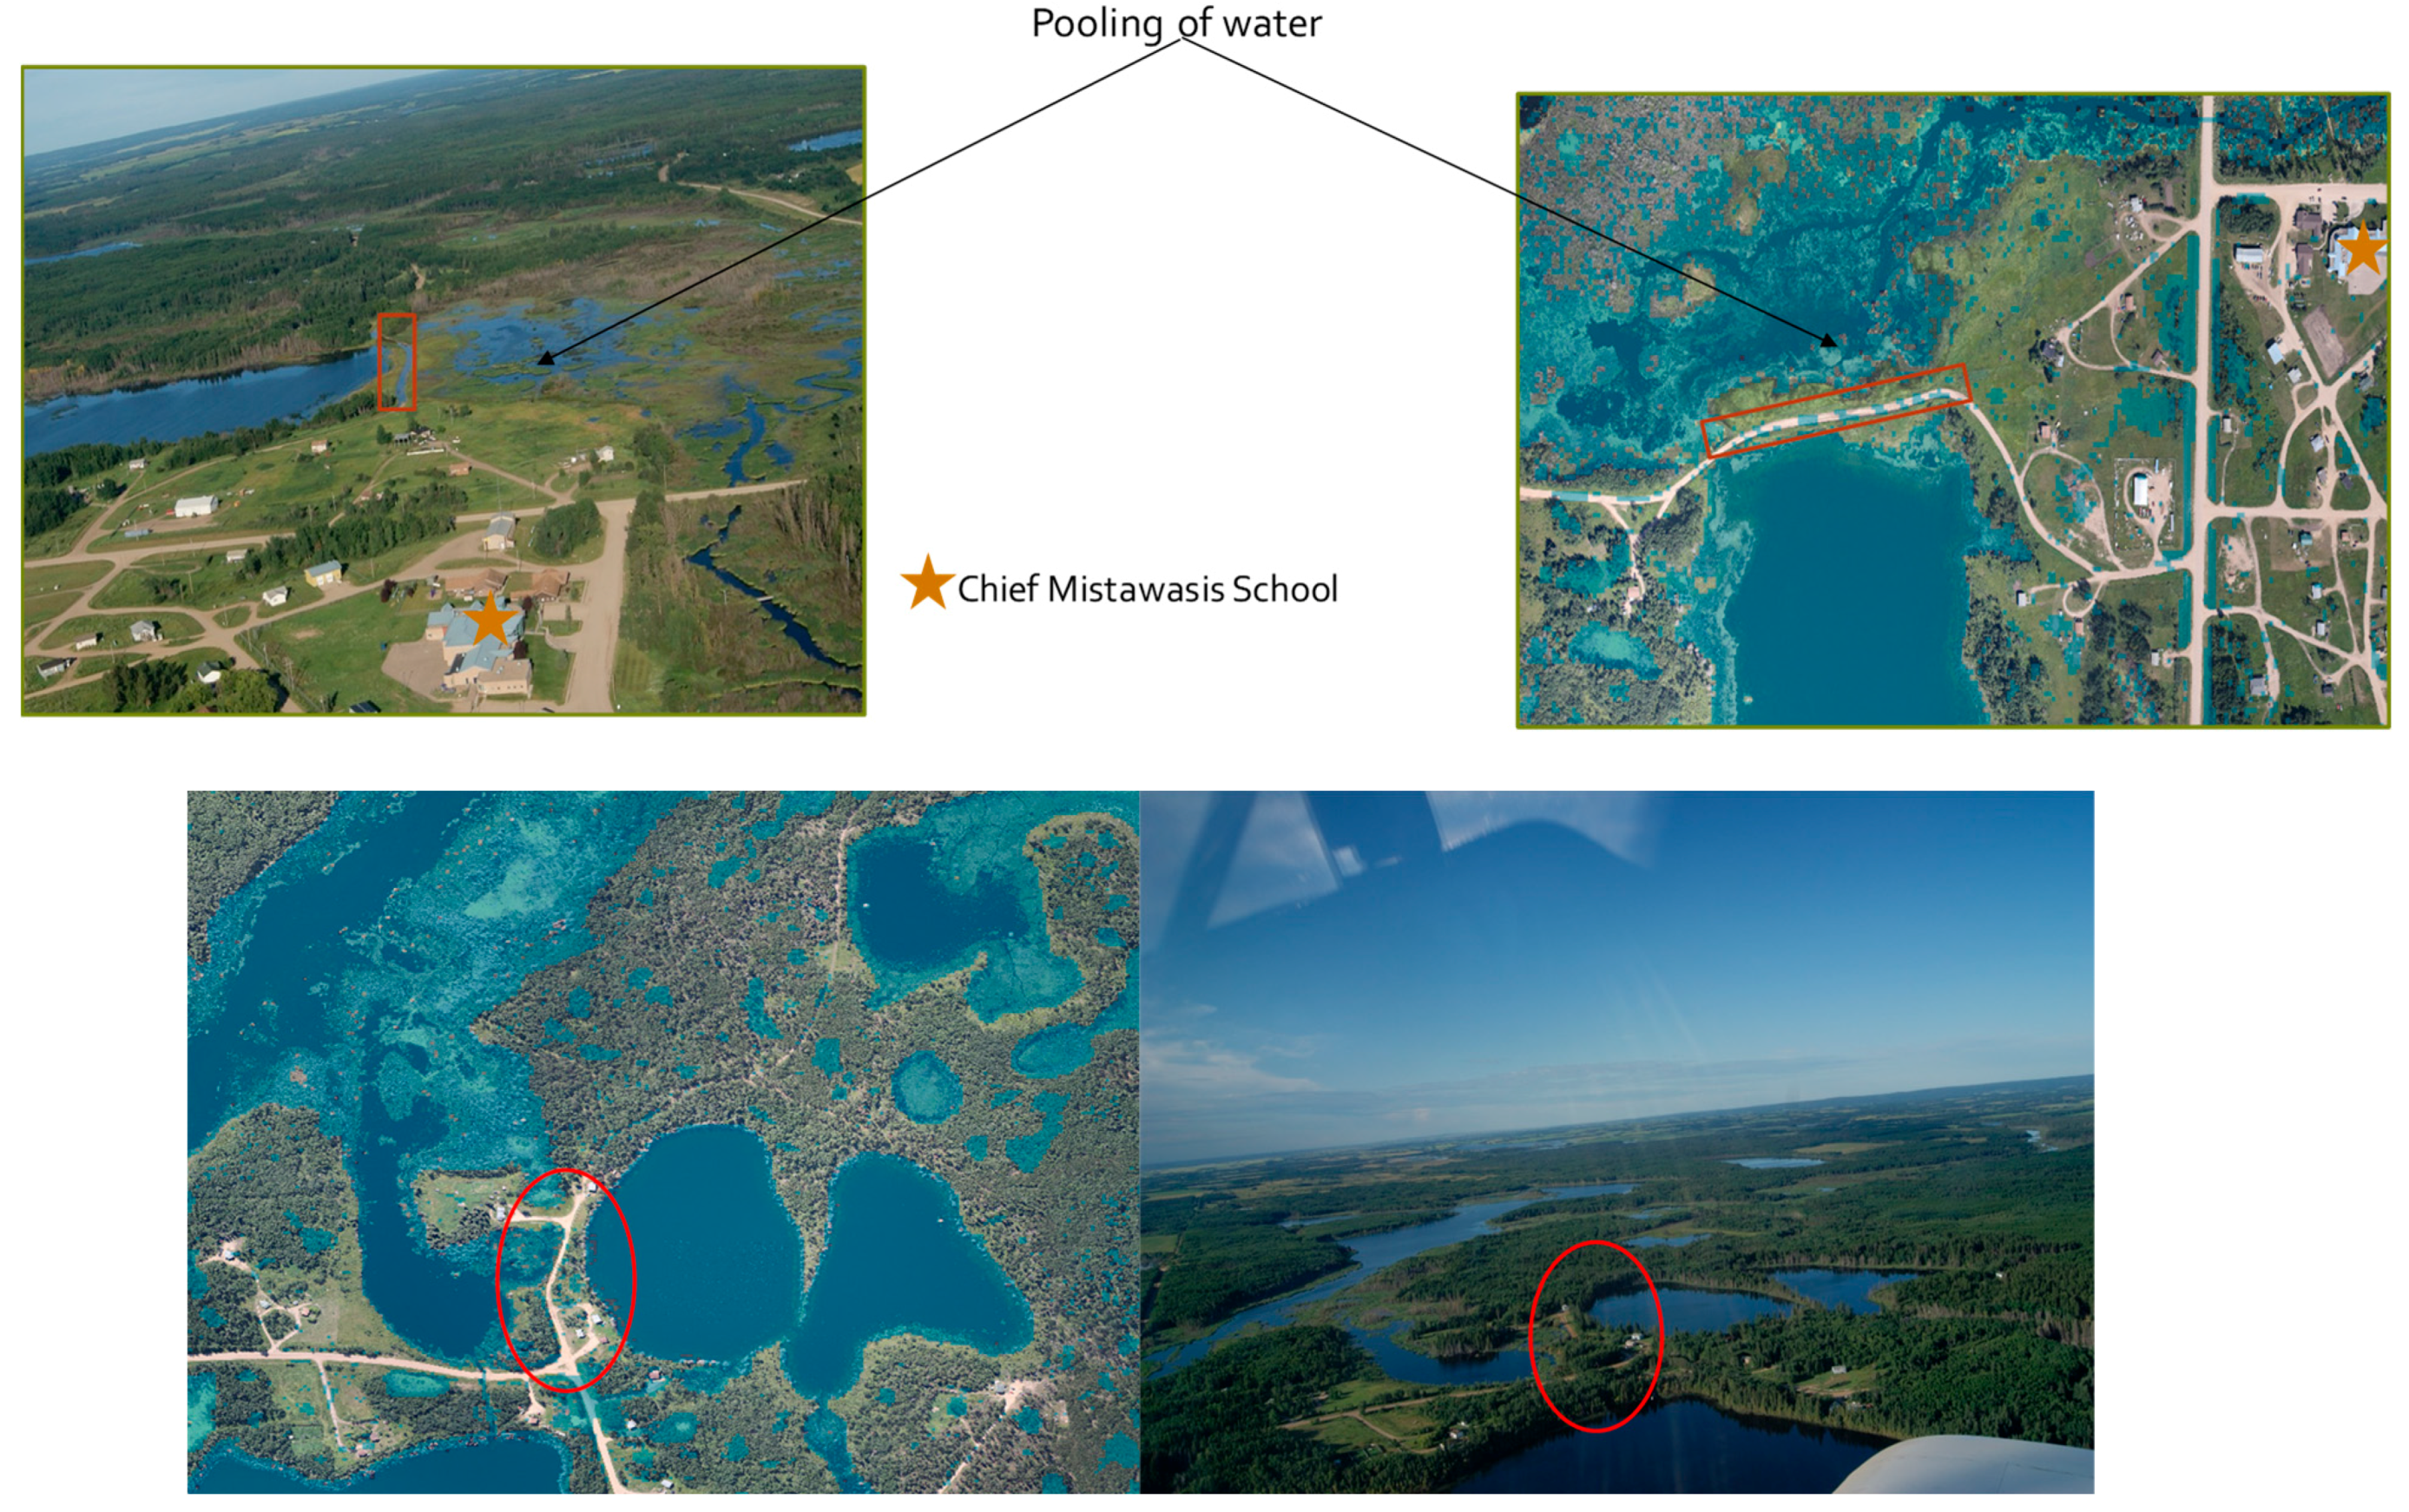
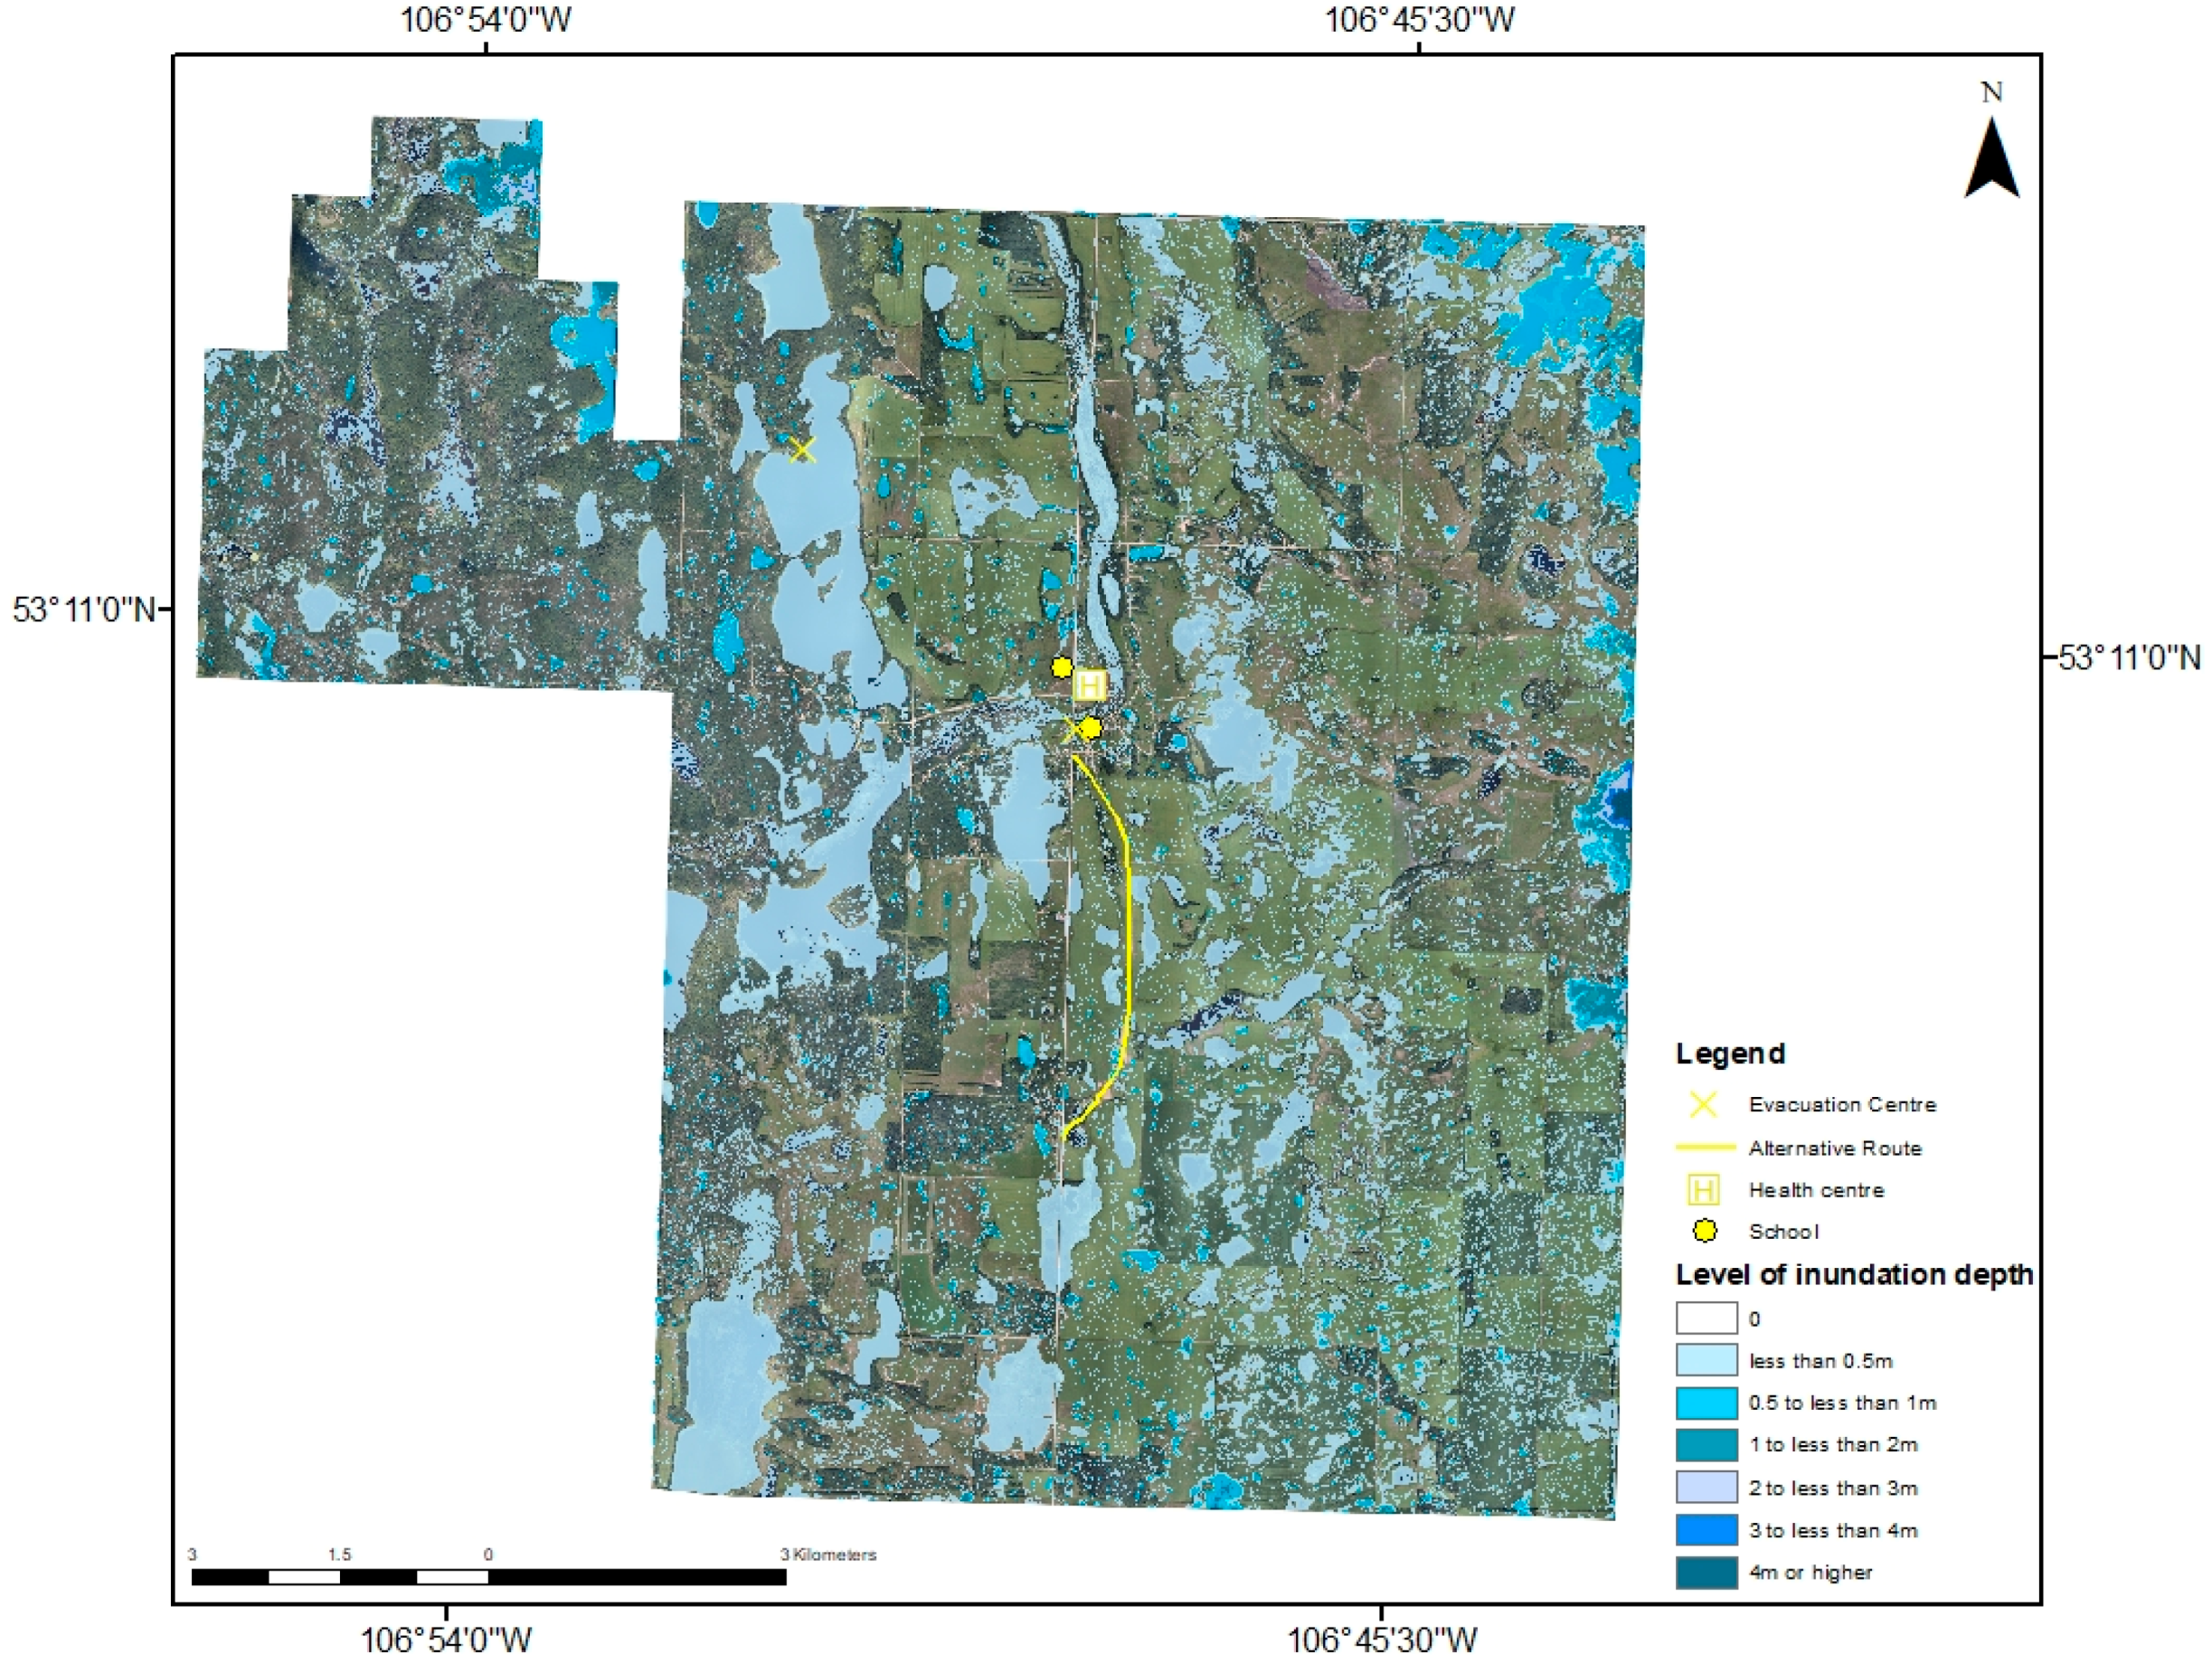
3.2.2. Satellite Imagery:

The total water area that was extracted from the freely available satellite image (Landsat 5 TM) for 19 May 2011, was used as the reference value. The data on the specified date was used because it was taken on the closest time to the spring runoff processes and actual flooding. The inundated areas calculated for WDPM simulation using two DEM datasets were then compared with extracted total water area from the Landsat data, and the accuracies were calculated [49] (Table 4). The LiDAR-DEM demonstrated much larger inundation areas for most of the reference depths with slightly better performance for 10 mm reference depth.
On the other hand, ALOS/PALSAR produced a close representation of inundation areas with Landsat data, particularly for 42 mm water (accuracy 84.05%) which was used to replicate the spring runoff. This indicated that WDPM was able to simulate the runoff extent during spring. For the 100 year event, the accuracy calculated via total inundated area/actual inundated area based on the pixels, was low for both DEMs, particularly for LiDAR DEM [49]. It should be noted that we did not have the satellite image for the actual flood event. In the future, WDPM outputs can be assessed with satellite images wherever available.

3.3. Evaluation of Flood Maps: Community Reflection

The workshop attendees represented personnel from different sectors in the community including: leadership, elders, lands division, public affairs, health care, school, and water and climate change related project managers (n = 9; gender: F = 5; M = 4). Attendees completed an open-ended survey (Appendix A) and focus group discussion after the workshop to assess the relevance of the model-generated flood maps for community decision support. A summary of the survey results is shown in Table 5. Despite the limitations of the data and model, attendees, in general, found the model valuable for flood management and preparedness in the community.

Focus Group Discussion

Workshop participants shared their experiences from 2011 flooding throughout the presentation of flood maps. For instance, one participant explained, pointing to the flood extent map shown in Figure 6:
“This is the lake village we saw on, in the earlier map. So, this is where my brother used to be. So again, similar to what we’ve experienced around 2011–2012 when water was all pooling up here. These two houses almost had to be evacuated”—(MN-3).
Most people in the workshop were interested in the extent of flooding rather than an estimate of flood depth and velocity. They were curious to see what would be the extent of flooding in their community in worst-case scenarios or in similar amounts to the flooding experienced elsewhere in the PPR:
“In the ends of like a flash flood, you get crazy amount of precipitation over like few hours, kind of how other places [Yorkton, Vanguard] did. Would the model give you an estimate of how it would look? […] that would give us more of an outline of something that would happen in the case of flash flood”—(MN-6).
The flood maps also allowed participants to visualize how different parts of the community may be impacted in case of extreme flood events.
“We travel on certain roads so we can see where the [flood] impacts are but having the picture of the whole reserve, there are places that we don’t go and don’t know have been impacted”—(MN-8).
Finally, the flood maps generated insightful dialogue for preparing for future extreme events in the community and the need for data and studies to support preparedness.
“It opens my eyes to the importance of planning and being prepared. We need to do more in our preparation and in the studies and fill in all the blanks”—(MN-3).
Overall, validating the flood maps with local experience allowed us to gain insights on how future flood modeling studies can support small and rural communities in the PPR. These insights can inform model developers in selecting relevant parameters and scenarios for supporting flood management decisions.

4. Discussion

Given the complexity of hydrological processes in the PPR, the WDPM modeling approach for flood mapping presented in our case study suggests utility in other regions in the PPR to demonstrate its practicality and feasibility on a larger scale. With finer precision DEMs such as LiDAR DEM, it is possible to produce detailed water extent map for flooding scenarios, providing information such as connectivity of water bodies, water accumulation zones or ‘hotspots,’ and accurate water depth in each cell [24,28]. While in previous work [11], coarser DEM datasets did not produce accurate flooded areas compared to LiDAR DEM, in our study, we found ALOS DEM produced the most accurate flooded areas. Findings from earlier work and this study indicate that without the information of the surrounding contributing areas extending to the hydrosheds, and in the best case, watershed boundaries, the use of LIDAR DEM with WDPM leads to an exaggerated inundation area. This may be because the software does not recognize what to do with water at an edge interface. Future versions are planned that can better manage this situation. Nevertheless, we have found that having the DEM for basin or even sub-basin areas improves the performance and accuracy of WDPM.
Various modeling approaches have been proposed and reviewed for flood mapping, such as hydrological models [50], hydrodynamic approaches [51,52], and integrated modeling [53]. In the context of Prairies, however, the combined WDPM and DEM process provided a diagnostic approach to assess flood extent with minimum data requirements. WDPM-derived water depths, in our study, were useful for calculating total inundated areas, qualitatively describing the flood extent, assessing the hazard areas based on accumulation zones, and simulating different runoff events. With land-use information for the community, it may also be possible in the future to calculate percentage area covered with water for different land-use types (e.g., agricultural, residential, and administrative), but this was not within the scope of the current study.
There are, however, some limitations to the model. Although WDPM provides a simple modeling approach to improve flood mapping for the PPR, the model’s execution time is slow. The runtime depends on the DEM size and tolerance, and the processor used, which can make WDPM computationally expensive at present. In our case study, we found that running WDPM with a powerful processor could reduce the runtime for the model at the expense of computations. Increasing the tolerance can help reduce the runtime; however, doing so affects the output from the model as we found from the running simulations at both 1 mm and 100 mm elevation tolerances. In addition, preprocessing the DEM can take some time (e.g., breaching roads at culvert points) depending on the DEM size. Because the model cannot establish the initial water distribution in the depressional storages when the DEM is created, it is important to establish the initial water distribution before estimating the flooding extent. The process requires access to an aerial photo of the community from the fall or late summer before the LiDAR survey is done, and adding and removing water from the DEM by ‘trial and error’ so that the water distribution more or less matches with the aerial photo [32]. It can, however, be challenging to acquire aerial images for specific times of the year, which was the case in this study, and can take a lot of time trying to match the water distribution.
Additionally, at the moment, runoff depths are generated using straightforward approaches, such as either using arbitrary reference depth or rainfall frequency. For future works, runoff estimates for WDPMs which consider a range of PPR hydrological processes can be used. The cold regions hydrological model (CRHM) can produce such runoff estimates which can be used for assigning runoff depth in WDPM to produce an accurate and detailed spatial representation of flooding in the PPR [54]. There is an ongoing effort to integrate the CRHM’s outputs, including runoff for different watershed classification and evaporation changes, with WDPM. Doing so would account for the loses in the reference water depth due to processes such as evaporation, infiltration, and snow redistribution. However, currently this integration is not feasible.
Having up-to-date information on flood inundation extents and hazards is beneficial in rural and indigenous communities in the PPR for their spatial planning and emergency preparedness. Producing flood maps in most cases is a technical process using hydrological and hydraulic models [12]. The evaluations of flood maps by the end users, however, are rarely done. In our study, we found that community participation in flood mapping could be inclusive of local experiences and memories which can be valuable in evaluating the model-derived flood maps and providing direction for future works. Furthermore, explanation of data and modeling limitations also helped with establishing transparency in the process, which is a vital aspect of engagement [19]. Similar findings have been confirmed by other participatory modeling studies [55,56]. Interestingly, the discussions on the flood maps also led to the understanding that the community is keen towards collecting more data in the future. Our results also provide opportunities for improving flood maps using transdisciplinary methods to combine local and indigenous knowledge of flooding and blend them into model-derived flood maps (e.g., identifying high impacted areas, paying attention to risk perceptions, and locating control structures) [21,57,58].
Doong et al. [57] highlighted the importance of stakeholder engagement for improving flood mapping. In our study, engagement processes in flood mapping were initiated in early stages. Participants were involved in collecting data, determining scenarios for the model, and evaluating the utility of WDPM-generated flood maps for community flood preparedness. Other studies have also described the importance of engaging stakeholders in preliminary stages of any modeling process to increase the trust and legitimacy of modeling outputs [19,56,59]. The feedback from the participants in the workshop shed some light on their preferences for flood maps which could help with the selection of modeling scenarios and risk mitigation strategies in the future [21]. Key community feedback included having more data for the surrounding areas in the future for detailed flood mapping; using historical events in other communities in the PPR as scenarios; and modeling the effect of having control structures versus no control structures. Furthermore, others have noted that integrating community-specific spatial flood information can empower local and indigenous communities to take actions, develop locally relevant adaptation strategies, and build resilient communities in the era of climate change [21,23,58,60].
Lessons from our study draw on the significance of the participation of local and indigenous communities in flood modeling and mapping studies as contributing both to better science and to reconciliation by scientists. Based on this we provide four recommendations:
  • Participation of public, local and indigenous communities is possible in otherwise traditionally top-down modeling practices and contributes to good practice in doing research. It also meets the calls of others doing community-engaged research or participatory research with local and indigenous communities [58,60,61,62,63,64].
  • Engagement with communities facilitates the in-filling of some data gaps, overcoming unideal or incomplete data, and uncertainty in modeling. In our case, we overcame data deficiencies by being gifted access to the community-held data, co-collecting culvert points and co-validating flood maps. Furthermore, engagement can lead to the creation of innovative modeling approaches, the generation of new knowledge, and ultimately, the practicing of science that is relevant to greater society [12].
  • Use of spatially focused tools in small, rural, and indigenous communities in the PPR can provide valuable information for identifying vulnerable regions, better spatial plans, and accordingly, better response or management strategies for floods [11].
  • LiDAR, although an expensive tool, is a worthwhile investment, particularly in relatively flat areas such as the PPR. Investment and access to LiDAR at the catchment scale would improve the estimation of flood extent and flood risk. It would help to plan efficient management strategies and reduce the cost of flood damage and recovery in long run.
The results and findings from our study are based on only one community in the PPR which makes it difficult to say that the accuracy and utility of WDPM in other regions will be equally high. There are cases, however, where WDPM has been used in community planning [11]. Given the growing importance of LiDAR, communities across the Prairies need access to it. In communities where spatial data is available, WDPM can provide quick initial overviews of potential flood extents and assist communities in assessing their vulnerabilities to extreme flood hazards in the future. Furthermore, the model outputs can be easily verified against aerial photographs, satellite images, and lived experiences. Community feedback is valuable for developing scenarios for future modeling works and for creating locally relevant information. While in our study we only evaluated the land covered with runoff estimated from WDPM, future, work can include economic evaluation of flood damage (e.g., roads, buildings, risk to people, etc.). However, for this, more rigorous modeling work may be needed. In our research, we demonstrated the application of WDPM and LiDAR by creating flood extent maps for an indigenous community in the PPR and used community feedback to evaluate the accuracy and utility of flood maps. We hope the methodology we have used in our work could contribute to supporting flood resilience and management in rural and indigenous communities in the PPR.

5. Conclusions

Increasing climate uncertainty and land use changes have led to an increase in extreme flooding events across the PPR, leaving many rural and Indigenous communities vulnerable to the negative impacts. Because of the unique PPR hydrological processes, conventional modeling approaches which are often focused on flooding in rivers and streams, can become insufficient and invalid. In this work, we used a spatially-focused modeling tool, WDPM, to develop flood hazard maps at a local scale. Furthermore, the use of LiDAR DEM provided a detailed estimation of flood hazards (i.e., drainage to trace pathways of runoff over the landscape, and impacts of roads on water pooling) compared to coarser DEM. We also found that without having sufficient information of the contributing areas, the total inundated areas can be exaggerated. Despite the limitations in accuracy, community members found the information to be useful. We also found community engagement to be valuable for co-producing data, providing feedback, and guiding future work.
In general, up-to-date spatial datasets, flood simulations, and accurate and detailed flood hazard maps will be important for designing flood management strategies for many communities across the PPR. Our study demonstrates the feasibility of using LiDAR datasets and WDPM approaches to identify flooding hazards in a small community. In future, more technical rigor can be applied to generate reference depths for simulations using physically-based hydrological models to improve the runoff estimates from WDPM. In addition, with the addition of information such as population, land use types, and infrastructure, WDPM generated runoff maps also have the potential to provide economic evaluations of flood damage in such communities.

Author Contributions

A.T. conceived and developed the methodological approach, analyzed the data, and wrote the original draft of the manuscript; L.B. provided support and guidance for analysis of results, and reviewed and editing the manuscript; G.S. supervised and acquired funding for the research work and provided suggestions for the manuscript; X.Y. provided technical support in processing LiDAR, data collection, and guidance in data analysis; A.J. proposed the idea for flood mapping and provided support with developing a relationship with Mistawasis Néhiyawak; K.W.-D. who helped in data collection, provided LiDAR data and supported in scenario selection.

Funding

We would like to acknowledge funding support from Canada First Research Excellence Fund (grant number 418474) and School of Environment and Sustainability.

Acknowledgments

The authors would like to acknowledge the community members who participated in the workshop and provided us with great insights. The authors acknowledge Michelle Watson for helping us recruit participants and arrange logistics for the workshop. They would further like to thank Kevin Shook for helping them understand the strengths and limitations of the model and providing technical support.

Conflicts of Interest

The authors declare no conflicts of interest.

Appendix A

Survey questionnaires: Evaluating Scientific Evidence—Flood Maps
1. To what extent does the evidence presented support your experience with flood concerns in the community?
Not at all:  1  :  2  :  3  :  4  :  5  : very much
2. To what extent do you trust the evidence presented?
Not at all:  1  :  2  :  3  :  4  :  5  : very much
If not, what was the primary reason for it?
_____ Error in data
_____ Does not include my area of interest in water issue
_____ Biased towards one particular viewpoint
_____ Too simple and does not capture the complexity in the community
If other, please indicate below:
____________________________________________________________________________________
3. How useful do you find the evidence to address flood concerns in your community?
Not at all:  1  :  2  :  3  :  4  :  5  : very much
If not, can you comment on why the evidence was not valuable?
____________________________________________________________________________________

References

  1. Hellman, J. Living with floods and coping with vulnerability. Disaster Prev. Manag. 2015, 24, 468–483. [Google Scholar] [CrossRef]
  2. Kourgialas, N.N.; Karatzas, G.P. Flood management and a GIS modelling method to assess flood-hazard areas—A case study. Hydrol. Sci. J. 2011, 56, 212–225. [Google Scholar] [CrossRef]
  3. Klemas, V. Remote Sensing of Floods and Flood-Prone Areas: An Overview. J. Coast. Res. 2015, 314, 1005–1013. [Google Scholar] [CrossRef]
  4. Samuels, P.; Klijn, F.; Dijkman, J. An analysis of the current practice of policies on river flood risk management in different countries. Irrig. Drain. 2006, 55, 25–27. [Google Scholar] [CrossRef]
  5. Shook, K.; Pomeroy, J.W. Memory effects of depressional storage in Northern Prairie hydrology. Hydrol. Process. 2011, 25, 3890–3898. [Google Scholar] [CrossRef]
  6. Dumanski, S.; Pomeroy, J.W.; Westbrook, C.J. Hydrological regime changes in a Canadian Prairie basin. Hydrol. Process. 2015, 29, 3893–3904. [Google Scholar] [CrossRef]
  7. Spence, C.; Woo, M.K. Hydrology of subarctic Canadian shield: Soil-filled valleys. J. Hydrol. 2003, 279, 151–166. [Google Scholar] [CrossRef]
  8. Wu, Q. GIS and Remote Sensing Applications in Wetland Mapping and Monitoring. Compr. Geogr. Inf. Syst. 2017, 140–157. [Google Scholar] [CrossRef]
  9. Buttle, J.M.; Allen, D.M.; Caissie, D.; Davison, B.; Hayashi, M.; Peters, D.L.; Pomeroy, J.W.; Simonovic, S.; St-Hilaire, A.; Whitfield, P.H. Flood processes in Canada: Regional and special aspects. Can. Water Resour. J. 2016, 41, 7–30. [Google Scholar] [CrossRef]
  10. Cohen, S.; Brakenridge, G.R.; Kettner, A.; Bates, B.; Nelson, J.; McDonald, R.; Huang, Y.F.; Munasinghe, D.; Zhang, J. Estimating Floodwater Depths from Flood Inundation Maps and Topography. J. Am. Water Resour. Assoc. 2018, 54, 847–858. [Google Scholar] [CrossRef]
  11. Armstrong, R.; Kayter, K.; Shook, K.; Hill, H. Using the Wetland Dem Ponding Model. In Putting Prediction in Ungauged Basins into Practice; Canadian Water Resources Association: Canmore, AB, Canada, 2013; pp. 255–270. ISBN 1896513387. [Google Scholar]
  12. Landström, C.; Whatmore, S.J.; Lane, S.N.; Odoni, N.A.; Ward, N.; Bradley, S. Coproducing flood risk knowledge: Redistributing expertise in critical “participatory modelling”. Environ. Plan. A 2011, 43, 1617–1633. [Google Scholar] [CrossRef]
  13. Meyer, V.; Kuhlicke, C.; Luther, J.; Unnerstall, H.; Fuchs, S.; Priest, S.; Dorner, W.; Serrhini, K.; Pardoe, K.; McCarthy, S.; et al. Recommendations for the user-specific enhancement of flood maps. Nat. Hazards Earth Syst. Sci. 2012, 12, 1701–1716. [Google Scholar] [CrossRef]
  14. Minano, A. Using Flood Maps for Community Flood Risk Communication; Natural Resources Canada: Waterloo, ON, Canada, 2018. [Google Scholar]
  15. Forrester, J.; Cook, B.; Bracken, L.; Cinderby, S.; Donaldson, A. Combining participatory mapping with Q-methodology to map stakeholder perceptions of complex environmental problems. Appl. Geogr. 2015, 56, 199–208. [Google Scholar] [CrossRef]
  16. Gaillard, J.C.; Pangilinan, M.L.C.J.D. Participatory mapping for raising disaster risk awareness among the youth. J. Conting. Cris. Manag. 2010, 18, 175–179. [Google Scholar] [CrossRef]
  17. Chingombe, W.; Pedzisai, E.; Manatsa, D.; Mukwada, G.; Taru, P. A participatory approach in GIS data collection for flood risk management, Muzarabani district, Zimbabwe. Arab. J. Geosci. 2015, 8, 1029–1040. [Google Scholar] [CrossRef]
  18. Cheung, W.; Houston, D.; Schubert, J.E.; Basolo, V.; Feldman, D.; Matthew, R.; Sanders, B.F.; Karlin, B.; Goodrich, K.A.; Contreras, S.L.; et al. Integrating resident digital sketch maps with expert knowledge to assess spatial knowledge of flood risk: A case study of participatory mapping in Newport Beach, California. Appl. Geogr. 2016, 74, 56–64. [Google Scholar] [CrossRef]
  19. Voinov, A.; Bousquet, F. Modelling with stakeholders. Environ. Model. Softw. 2010, 25, 1268–1281. [Google Scholar] [CrossRef]
  20. Voinov, A.; Kolagani, N.; McCall, M.K.; Glynn, P.D.; Kragt, M.E.; Ostermann, F.O.; Pierce, S.A.; Ramu, P. Modelling with stakeholders—Next generation. Environ. Model. Softw. 2016, 77, 196–220. [Google Scholar] [CrossRef]
  21. Castillo-Rosas, J.; Diez-Rodríguez, J.; Jiménez-Vélez, A.; Núñez-Andrés, M.; Monguet-Fierro, J. Collection and Integration of Local Knowledge and Experience through a Collective Spatial Analysis. ISPRS Int. J. Geo-Inf. 2017, 6, 33. [Google Scholar] [CrossRef]
  22. Raymond, C.M.; Fazey, I.; Reed, M.S.; Stringer, L.C.; Robinson, G.M.; Evely, A.C. Integrating local and scientific knowledge for environmental management. J. Environ. Manag. 2010, 91, 1766–1777. [Google Scholar] [CrossRef]
  23. Agrawal, A. Agrawal Dismantling the divide between indigenous and western knowledge. Dev. Chang. 1995, 26, 413–439. [Google Scholar] [CrossRef]
  24. Sanyal, J.; Lu, X.X. Application of Remote Sensing in Flood Management with Special Reference to Monsoon Asia: A Review. Nat. Hazards 2004, 33, 283–301. [Google Scholar] [CrossRef]
  25. Webster, T.L.; Forbes, D.L.; Mac Kinnon, E.; Roberts, D. Flood-risk mapping for storm-surge events and sea-level rise using lidar for southeast New Brunswick. Can. J. Remote Sens. 2006, 32, 194–211. [Google Scholar] [CrossRef]
  26. Jain, S.K.; Singh, R.D.; Jain, M.K.; Lohani, A.K. Delineation of flood-prone areas using remote sensing techniques. Water Resour. Manag. 2005, 19, 333–347. [Google Scholar] [CrossRef]
  27. Brivio, P.A.; Colombo, R.; Maggi, M.; Tomasoni, R. Integration of remote sensing data and GIS for accurate mapping of flooded areas. Int. J. Remote Sens. 2002, 23, 429–441. [Google Scholar] [CrossRef]
  28. Wedajo, G.K. LiDAR DEM Data for Flood Mapping and Assessment; Opportunities and Challenges: A Review. J. Remote Sens. GIS 2018, 06, 2015–2018. [Google Scholar] [CrossRef]
  29. Schumann, G.J.-P.; Bates, P.D. Commentary: The Need for a High-Accuracy, Open-Access Global DEM. Front. Earth Sci. 2018, 6. [Google Scholar] [CrossRef]
  30. Schumann, G.; Matgen, P.; Cutler, M.E.J.; Black, A.; Hoffmann, L.; Pfister, L. Comparison of remotely sensed water stages from LiDAR, topographic contours and SRTM. ISPRS J. Photogramm. Remote Sens. 2008, 63, 283–296. [Google Scholar] [CrossRef]
  31. Shook, K.; Pomeroy, J.W.; Spence, C.; Boychuk, L. Storage dynamics simulations in prairie wetland hydrology models: Evaluation and parameterization. Hydrol. Process. 2013, 27, 1875–1889. [Google Scholar] [CrossRef]
  32. Shook, K.R.; Armstrong, R.; Sharomi, O.; Spiteri, R.; Pomeroy, J.W. The WDPM User’s Guide; 2014. Available online: https://www.usask.ca/hydrology/WDPM.php (accessed on 10 November 2018).
  33. Wu, Q.; Lane, C.R. Delineating wetland catchments and modeling hydrologic connectivity using lidar data and aerial imagery. Hydrol. Earth Syst. Sci. 2017, 21, 3579–3595. [Google Scholar] [CrossRef]
  34. Shapiro, M.; Westervelt, J. R.MAPCALC: An Algebra for GIS and Image Processing. 1992. Available online: http://citeseerx.ist.psu.edu/viewdoc/summary?doi=10.1.1.51.9471 (accessed on 3 May 2019).
  35. Saskatoon North Partnership for Growth Regional Plan. Available online: http://partnershipforgrowth.ca (accessed on 3 May 2019).
  36. Statistics Canada. 2016 Census Profile. Available online: https://www.statcan.gc.ca (accessed on 3 May 2019).
  37. Dawe, M.L. Mistawasis Nêhiyawak First NationSource Water Protection Plan. 2016. Available online: https://sens.usask.ca/documents/msem-projects/Mistawasis%20Nehiyawak%20SWP%20Planning%20Initiative_July30.pdf (accessed on 3 May 2019).
  38. LiDAR Services International Inc. Mistawasis LiDAR Survey Report. 2014. Available online: https://cloud.sdsc.edu/v1/AUTH_opentopography/www/metadata/2015SeedProject_Snyder_Nevada.pdf (accessed on 3 May 2019).
  39. Li, R.; Tang, Z.; Li, X.; Winter, J. Drainage Structure Datasets and Effects on LiDAR-Derived Surface Flow Modeling. ISPRS Int. J. Geo-Inf. 2013, 2, 1136–1152. [Google Scholar] [CrossRef]
  40. Lang, M.; McCarty, G.; Oesterling, R.; Yeo, I.Y. Topographic metrics for improved mapping of forested wetlands. Wetlands 2013, 33, 141–155. [Google Scholar] [CrossRef]
  41. Ngula Niipele, J.; Chen, J. The usefulness of alos-palsar dem data for drainage extraction in semi-arid environments in The Iishana sub-basin. J. Hydrol. Reg. Stud. 2019, 21, 57–67. [Google Scholar] [CrossRef]
  42. Sturm, M.; Taras, B.; Liston, G.E.; Derksen, C.; Jonas, T.; Lea, J. Estimating Snow Water Equivalent Using Snow Depth Data and Climate Classes. J. Hydrometeorol. 2010, 11, 1380–1394. [Google Scholar] [CrossRef]
  43. Jonas, T.; Marks, D. Estimating the snow water equivalent from snow depth data. J. Hydrol. 2016, 11, 1–4. [Google Scholar]
  44. Li, J.; Li, J.; Yao, K. Inundation analysis of reservoir flood based on Computer Aided Design (CAD) and Digital Elevation Model (DEM). Water 2018, 10, 530. [Google Scholar] [CrossRef]
  45. Masood, M.; Takeuchi, K. Assessment of flood hazard, vulnerability and risk of mid-eastern Dhaka using DEM and 1D hydrodynamic model. Nat. Hazards 2012, 61, 757–770. [Google Scholar] [CrossRef]
  46. Ronco, P.; Bullo, M.; Torresan, S.; Critto, A.; Olschewski, R.; Zappa, M.; Marcomini, A. KULTURisk regional risk assessment methodology for water-related natural hazards—Part 2: Application to the Zurich case study. Hydrol. Earth Syst. Sci. 2015, 19, 1561–1576. [Google Scholar] [CrossRef] [Green Version]
  47. Basch, C.E. Focus Group Interview: An Underutilized Research Technique for Improving Theory and Practice in Health Education. Heal. Educ. Behav. 1987, 14, 411–448. [Google Scholar] [CrossRef]
  48. Morgan, D. Focus groups Focus Groups. Annu. Rev. Sociol. 1996, 22, 129–152. [Google Scholar] [CrossRef]
  49. Kumar, R.; Acharya, P. Flood hazard and risk assessment of 2014 floods in Kashmir Valley: A space-based multisensor approach. Nat. Hazards 2016, 84, 437–464. [Google Scholar] [CrossRef]
  50. Unduche, F.; Tolossa, H.; Senbeta, D.; Zhu, E. Evaluation of four hydrological models for operational flood forecasting in a Canadian Prairie watershed. Hydrol. Sci. J. 2018, 63, 1133–1149. [Google Scholar] [CrossRef] [Green Version]
  51. Werner, M.G.F. A comparison of flood extent modelling approaches through constraining uncertainties on gauge data. Hydrol. Earth Syst. Sci. 2010, 8, 1141–1152. [Google Scholar] [CrossRef] [Green Version]
  52. Teng, J.; Jakeman, A.J.; Vaze, J.; Croke, B.F.W.; Dutta, D.; Kim, S. Flood inundation modelling: A review of methods, recent advances and uncertainty analysis. Environ. Model. Softw. 2017, 90, 201–216. [Google Scholar] [CrossRef]
  53. Judi, D.R.; Rakowski, C.L.; Waichler, S.R.; Feng, Y.; Wigmosta, M.S. Integrated modeling approach for the development of climate-informed, actionable information. Water 2018, 10, 775. [Google Scholar] [CrossRef] [Green Version]
  54. Pomeroy, J.W. The CRHM model: A platform for basin proees representation and model sturcuture on physical evidence. Hydrol. Process. 2007, 21, 2650–2667. [Google Scholar] [CrossRef]
  55. Carmona, G.; Varela-Ortega, C.; Bromley, J. Participatory modelling to support decision making in water management under uncertainty: Two comparative case studies in the Guadiana river basin, Spain. J. Environ. Manag. 2013, 128, 400–412. [Google Scholar] [CrossRef] [Green Version]
  56. Cockerill, K.; Tidwell, V.; Passell, H. Assessing public perceptions of computer-based models. Environ. Manag. 2004, 34, 609–619. [Google Scholar] [CrossRef] [Green Version]
  57. Doong, D.J.; Lo, W.; Vojinovic, Z.; Lee, W.L.; Lee, S.P. Development of a new generation of flood inundation maps-a case study of the coastal city of Tainan, Taiwan. Water 2016, 8, 521. [Google Scholar] [CrossRef] [Green Version]
  58. Butler, C.; Adamowski, J. Empowering marginalized communities in water resources management: Addressing inequitable practices in Participatory Model Building. J. Environ. Manag. 2015, 153, 153–162. [Google Scholar] [CrossRef]
  59. Olsson, J.A.; Berg, K. Local Stakeholders’ Acceptance of Model-generated Data Used as a Communication Tool in Water Management: The Rönneå Study. AMBIO A J. Hum. Environ. 2009, 34, 507–512. [Google Scholar]
  60. Castleden, H.E.; Hart, C.; Harper, S.; Martin, D.; Cunsolo, A.; Stefanelli, R.; Day, L.; Lauridsen, K. Implementing Indigenous and Western Knowledge Systems in Water Research and Management (Part 1): A Systematic Realist Review to Inform Water Policy and Governance in Canada. Int. Indig. Policy J. 2017, 8. [Google Scholar] [CrossRef] [Green Version]
  61. Bradford, L.; Waldner, C.; McLaughlin, K.; Zagozewski, R.; Bharadwaj, L. A mixed-method examination of risk factors in the truck-to-cistern drinking water system on the Beardy’s and Okemasis First Nation Reserve, Saskatchewan. Can. Water Resour. J. 2018, 43, 383–400. [Google Scholar] [CrossRef]
  62. Castleden, H.; Garvin, T.; First Nation, H. ay aht Modifying Photovoice for community-based participatory Indigenous research. Soc. Sci. Med. 2008, 66, 1393–1405. [Google Scholar] [CrossRef] [PubMed]
  63. Manttyka-Pringle, C.; Jardine, T.D.; Bradford, L.; Bharadwaj, L.; Kythreotis, A.P.; Fresque-Baxter, J.; Kelly, E.; Somers, G.; Doig, L.E.; Jones, P.D.; et al. Bridging science and traditional knowledge to assess cumulative impacts of stressors on ecosystem health. Environ. Int. 2017, 102, 125–137. [Google Scholar] [CrossRef] [PubMed] [Green Version]
  64. Patrick, R.; Machial, L.; Quinney, K.; Quinney, L. Lessons Learned Through Community-Engaged Planning. Int. Indig. Policy J. 2017, 8. [Google Scholar] [CrossRef] [Green Version]
Figure 1. Map showing the location of Mistawasis Nêhiyawak First Nation in the Prairie Pothole Region (PPR); the projection is Universal Transverse Mercator UTM 13. (A) Mistawasis Néhiyawak in the PPR region and (B) LiDAR DEM for the community.
Water 11 02486 g001
Figure 2. Spatial datasets used in the study. (A) ALOS/PALSAR DEM for Mistawasis and the surrounding contributing areas (12.5 m resolution), and (B) LiDAR DEM for Mistawasis (5 m resolution).
Water 11 02486 g002
Figure 3. Example of a culvert burning process in open source GIS software SAGA.
Water 11 02486 g003
Figure 4. Flowchart showing the process for generating community flood map.
Water 11 02486 g004
Figure 5. Spatial distribution of simulated water depths of 10, 20, 42, and 82 mm shown in (ad), respectively. The brown color represents the dry regions or where no water was added. The darker blue represents where the maximum depth of water was accumulated.
Water 11 02486 g005
Figure 6. Flood extent for a 100 year flood event compared with aerial photographs from 2011 flooding. The top image shows the flood extent near the major administrative area and the major road. Bottom image shows flood extent near one of the villages.
Water 11 02486 g006
Figure 7. Flood hazard map for the community for a 100 year flood event (82 mm runoff depth added).
Water 11 02486 g007
Table 1. Information on datasets used in this study.
MetadataLiDAR DEMALOS/PALSAR DEMLandsat 7 TM
Spatial Resolution5 m × 5 m12.5 m × 12.5 m30 m × 30 m
Date of acquisition20 June 201827 February 20193 March 2019
SourceCommunityhttps://vertex.daac.asf.alaska.edu/#https://earthexplorer.usgs.gov/
Table 2. WDPM run summary for different depths of water added.
Water Depth Added (mm)Runtime (h)Number of Iterations to Converge
101.11160,000
201.25168,000
422.68355,000
825.59711,000
Table 3. Analysis of the inundation extent for different depths of water added.
Water Depth10 mm Added20 mm Added42 mm Added82 mm Added
Pixels% area covered with waterPixels% area covered with waterPixels% area covered with waterPixels% area covered with water
No inundation4,935,27882.35467145577.954,485,99474.864,318,75272.07
Less than 0.5 m1,053,80117.581,291,38921.551,428,09923.831,445,77624.13
0.5–1 m35720.0624,0920.4062,9281.05173,1592.89
1–2 m1300.0058240.1012,7180.2142,4400.71
2–3 m00210.0030180.0583320.14
3–4 m0000240.0022040.04
>4 m00000021180.04
Total % area covered with water 1 17.65% 22.05% 25.14% 27.93%
1 The total percentage of area covered with water represents the wet cells in the DEM or wet areas on the landscape where water will likely get accumulated given no infiltration or evaporation (worst case scenario). The remaining percentage is the total dry area on the landscape where water was not added or is not accumulated.
Table 4. Comparison of total inundation area of WDPM output using two different DEMs with satellite image.
WDPM Using LiDAR-DEMWDPM Using ALOS/PALSAR DEMLandsat 5 TM
Reference depths10 mm20 mm42 mm82 mm42 mm82 mm19 May 2011
Total Inundation area (ha)2643.763766.973766.974185.071610.472134.131353.60
Accuracy (%)51.2035.9335.9332.3484.0563.43
Table 5. Workshop attendees’ responses to the relevance and significance of the model and model-generated flood maps.
Survey QuestionVery MuchModeratelyFeedback
To what extent does the evidence presented support your experience with flood concerns in the community?57%43%Shared experiences of how in 2011 the same roads were muddy and people had difficulty getting to work.
To what extent do you trust the evidence?86%14%
How useful do you find the evidence to address flood concerns in your community?86%14%Use more scenarios (culverts vs. no culverts, historical events from other places, flash floods, multi-hazard impact)
Need more data (LiDAR) for supporting emergency response planning

