Response Relationship between Microtopographic Variation and Slope Erosion under Sand-Cover
by
Feichao Wang
1, 
Guoce Xu
1,*,
Lin Li
2,
Zhanbin Li
1,3,
Peng Li
1,
Jianwen Zhang
1 and
Yuting Cheng
1 1
State Key Laboratory of Eco-Hydraulics in Northwest Arid Region of China, Xi’an University of Technology, Xi’an 710048, China
2
Shanxi Province Institute of Resources and Electric Power Investigation and Design, Xi’an 710048, China
3
State Key Laboratory of Soil Erosion and Dry-land Farming on the Loess Plateau, Institute of Soil and Water Conservation, Chinese Academy of Sciences and Ministry of Water Resources, Yangling 712100, China
*
Author to whom correspondence should be addressed.
Water 2019, 11(12), 2488; https://doi.org/10.3390/w11122488
Submission received: 22 October 2019
/
Revised: 21 November 2019
/
Accepted: 21 November 2019
/
Published: 26 November 2019
(This article belongs to the Section Hydrology)
Abstract
:Slope microtopography is an important factor that affects the process of slope erosion. We quantified the responses between microtopography and the amount of erosion on overland sand slope and loess slopes through an indoor artificial simulated rainfall experiment. Three continuous rainfall tests under 1.5 mm/min rain intensity were used to analyze the spatial variation of slope microtopography and soil erosion with three-dimensional laser scanning technology. Our results show that under 0.5, 1.0, and 1.5 cm sand-covered slopes, the runoff time of the first rainfall is delayed by 18, 19, and 23 min, respectively, compared with the loess slope. Furthermore, the average sediment concentration on the slope decreased with subsequent rainfall events. The total erosion of the slope under 0.5, 1.0, and 1.5 cm sand was 4.24, 3.57, and 5.40 times that of the loess slope, respectively. The erosion of the sand-covered slopes was much larger than that of the loess slope. The length of the main sand production area was about 2.4 times that of the loess slope and the peaks of the erosion amount of the slope were mostly distributed in the lower part of the slope. As the rainfall progressed, the microtopographic factors of the loess slopes increased significantly (p < 0.05), and the microtopographic factors of the sand slopes increased, but not significantly (p > 0.05). We found that the microtopographic factors with the strongest erosion responses to the loess slope and the sand-covered slope were surface incision and surface roughness. The response relationship between microtopographic variation and erosion of the loess slope was stronger than the sand-covered slope, and suggests that other, unaccounted-for factors may be affecting the erosion of sand-covered slopes. This study provides a reference for erosion mechanisms of the wind–water erosion crisscross region.
1. Introduction
Microtopography is a ground morphological feature formed by raindrops, surface runoff, and human cultivation that has large effects on surface runoff and erosion processes. Soil microtopography affects the occurrence and evolution of soil erosion through changes in elevation that alter water flow direction and hydraulic characteristics [1,2]. Microtopographic properties can promote or hinder soil erosion in two different ways [3,4,5,6,7,8] because of the high dynamic and random changes in microtopography [9,10,11,12,13].
Splash erosion by raindrops, sheet erosion from sheet flow, and shallow gully erosion caused by heavy rain all increase the variation in surface microtopography [14,15,16]. Continuous rainfall has been shown to change both sediment yield and microtopography during the erosion process [17]. Previous research has found a linear relationship between surface roughness and the micro-slope, and the response of surface roughness to erosion exhibits spatial heterogeneity [18,19,20,21,22]. Furthermore, surface roughness variation has been shown to be a good predictor of erosion, at least on horizontal ridge slopes [23,24,25,26]. Using traditional microtopographic measurement methods, Jester et al. (2005) [27] identified defects in establishing the relationship between microtopographic, runoff and sediment yield, and more recently, laser micro-geomorphic methods have been developed to precisely extract and analyze terrain indices [28,29,30,31]. Luo Jian et al. (2015) [32] studied the microtopography of purple soil erosion with indoor simulated rainfall tests, and found that rainfall parameters and the terrain multi-fractal index could accurately predict slope runoff, but not the slope erosion amount. Zheng Liangyong, and Ahmadi A et al. [33,34,35] revealed the distribution of erosion sources by laying trace elements, and found that the area at the bottom of the slope contributed 80% to sediment production.
The wind-erosion and water-erosion interlaced region of the Loess Plateau is one of the main producers of coarse sand and silt for the Yellow River [36,37,38], and there has been recent, interesting characterization of the Loess Plateau soil. For example, Tang (2016) and Xu (2015) [39,40] investigated erosion particles sorting and the relationship between runoff sediment yield and the process of erosion transportation, and Linyi (2017) [41] studied the effects of sand thickness and particle size composition on runoff and sediment yield on the slope. Runoff and sediment yield in wind and water-erosion intersections can also be affected by differences in the physical properties of the two-element and one-element slope structures. For example, differences in particle composition, saturated water permeability, and other physical properties contributed to differences in infiltration, confluence, and erosion between one and two-element structured slopes [42,43,44,45,46,47,48,49]. The study on the erosion and sediment yield process of sand–sand dual-structure slopes is focused on qualitatively characterizing erosion processes under different rainfall and underlying conditions, although quantitative measurements of the distribution of erosion sources and their response to microtopographic changes are also considered.
Little research has been focused on the quantitative evaluation of the soil erosion amount spatially and the response of sediment to the microtopography factor on sand-covered loessal slopes [50,51]. To sum up, the objectives of this study are:
- (1)
- To elevate the response of the soil erosion to the thickness of sand on the loessal–sand;
- (2)
- to quantify the spatial distribution of soil erosion amount: and
- (3)
- to analyze the relationship between the microtopography factor and sediment.
2. Materials and Methods
2.1. Experimental Design
We collected loess soil from Xi’an city and sand from Dongliugou valley in Dalate banner, Inner Mongolia. All loess soil and sand were passed through a 10 mm sieve. The mechanical composition of loess was 1.36% clay (<0.002 mm), 59.99% silt (0.002–0.02 mm), and 38.65% sand (0.02–2 mm). The mechanical composition of sand was 0.02% clay, 4.22% silt, and 95.6% sand. Firstly, 20 cm natural sand was laid on the bottom of the flume to keep the water permeability of the experimental soil close to the natural state and uniformly moisture the soil. Then, the 40 cm depth sieved loess was put into the flume depending on the layered filling method at 10 cm intervals. Layered filling soil can keep the same bulk density on the soil-filled flume. Finally, three thicknesses of sand, 0.5 cm, 1.0 cm, and 1.5 cm, were covered on the soil surface, respectively. The soil moisture content and dry bulk density of the tank were maintained at 20% and 1.3 g/cm3, respectively. After the filling was completed, water was evenly sprinkled on the surface of the soil to bring the surface water content close to saturation. Rainfall tests began 24 h after completion of the test slope.
Tests were carried out in the Rain Erosion Hall of Xi’an University of Technology.
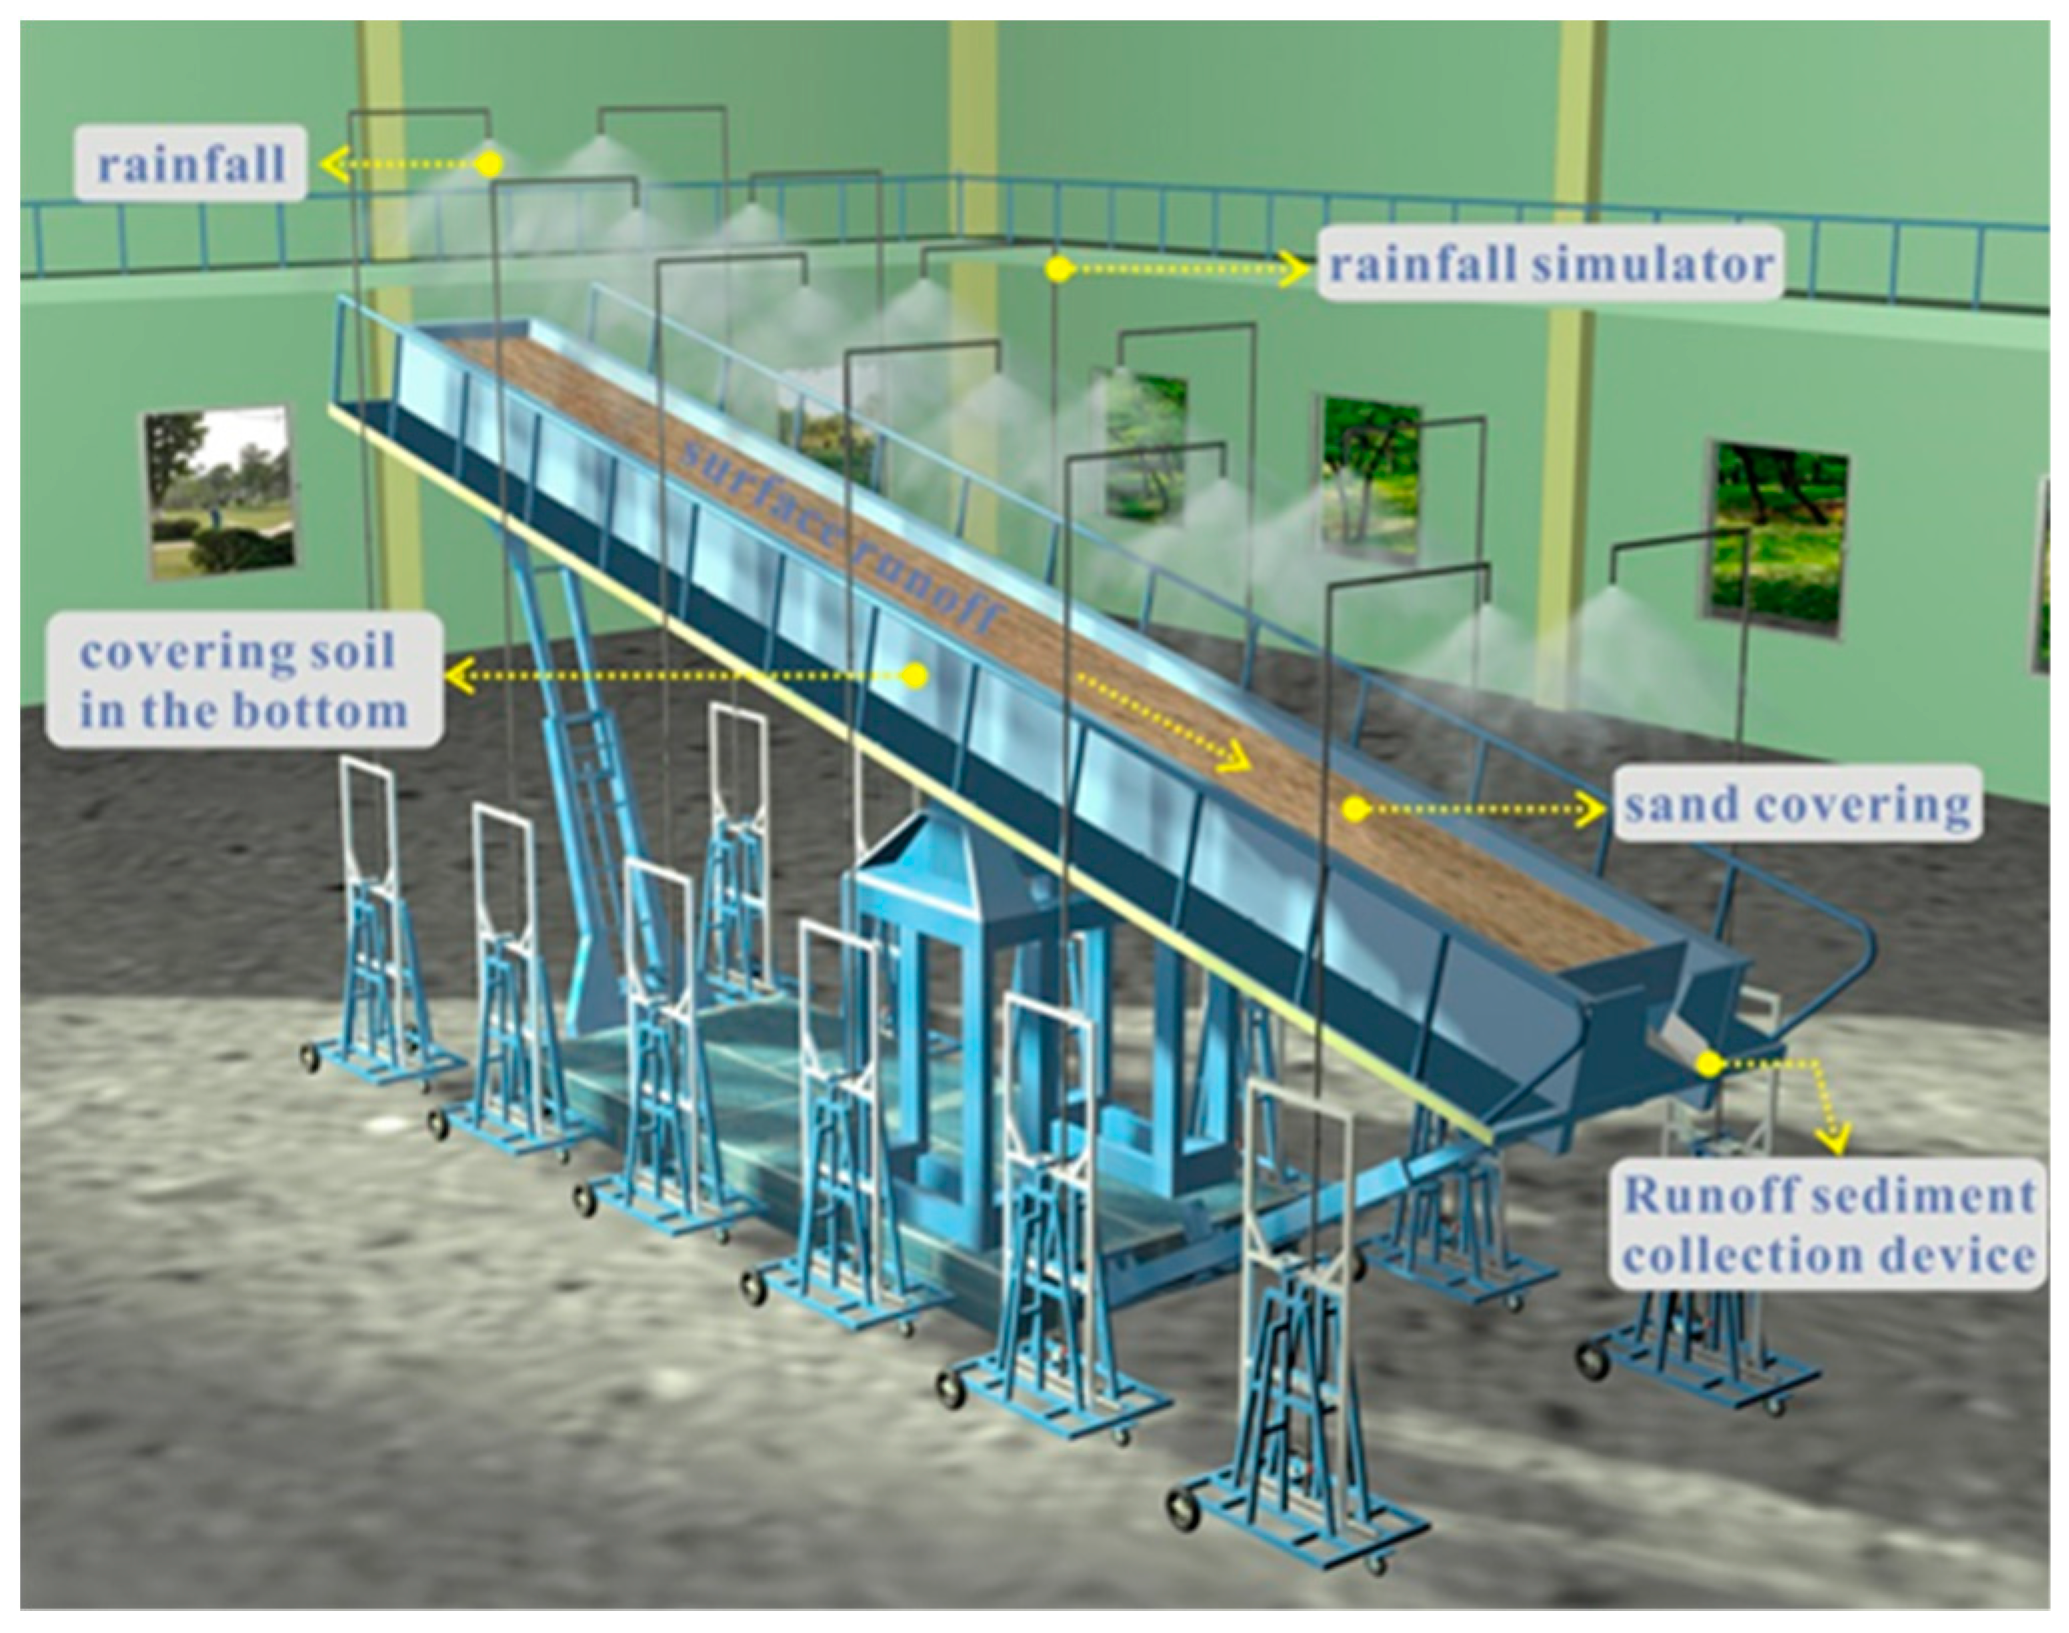
The artificial simulated rainfall device made up of an X-shaped sprinkler, which was proved by raindrop spectrum and the end of velocity [52]. The test rain intensity was 1.5 mm/min, with a minimum rainfall uniformity of 85%, and an effective rainfall height of the side spray type rainer for rainfall of 4 m. Intermittent rainfall events were simulated; three continuous rainfall events were simulated for the same underlayer pattern, with the rainfall event interval of 24 h. All experiments were recorded from runoff generation time, and the runoff duration was defined as 30 min. However, the sand of the 1.5 cm sand slope eroded to the bottom of the test tank after the second rainfall, so no third rain was performed. The soil trough used in the test was 13 m long, 1 m wide, and 0.7 m high, with a slope of 12° (Figure 1).
2.2. Data Collection and Analysis
We collected the sediment runoff through the trough outlet with a sampling bucket and a conical flask at 1 min intervals. After the end of the test, the slope runoff in the bucket was read and the sediment content was calculated by the displacement method [53]. Slope flow velocity and width were monitored every 1 m along the trough. The runoff velocity at each section was determined using the KMnO4 dye tracer method and the runoff surface velocity was modified by multiplying by 0.67. The runoff power was calculated using Equation (1):
where ω stands for runoff power (w/m2); τ stands for the current shear force (Pa); ρ stands for the water density (kg/m3); g stands for the acceleration of gravity (m/s2); s stands for the slope ratio; V stands for the stands for the cross-sectional mean velocity off surface runoff (m/s); and q stands for the unit width discharge (m2/s).
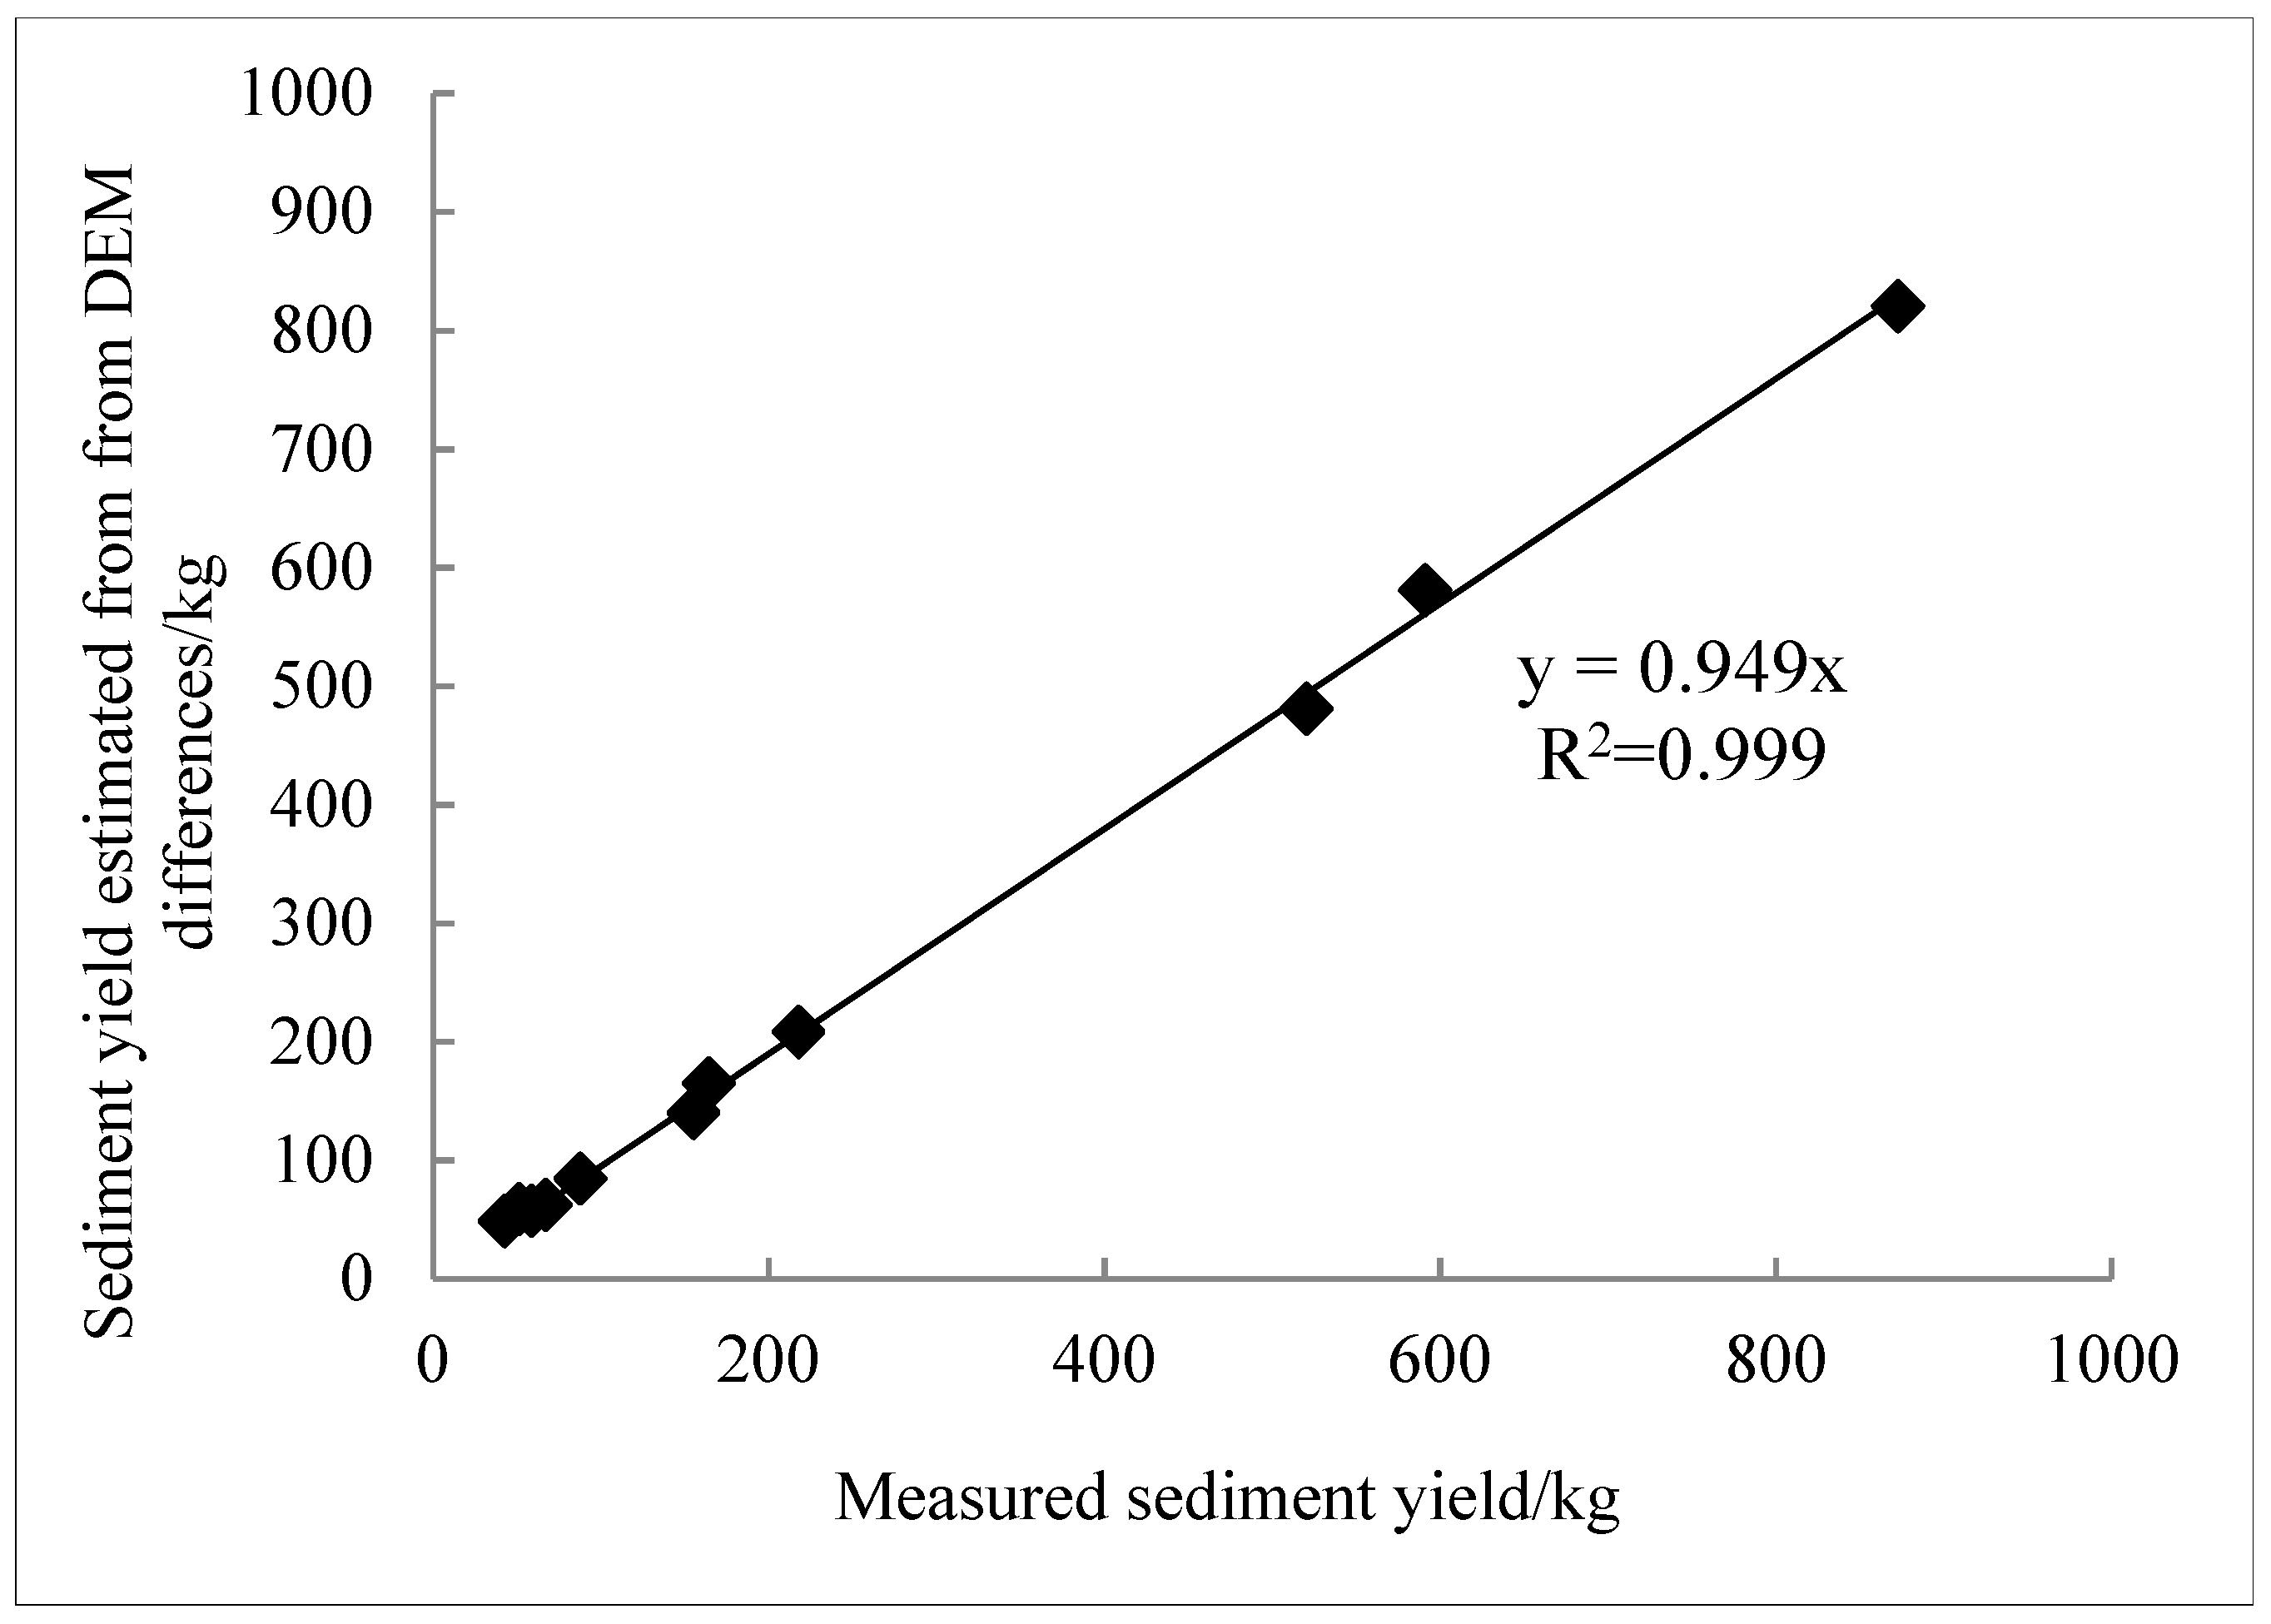
Before and after each rainfall, a 3D laser scanner (Trimble FX, Westminster, CO, USA) was used to scan the point cloud data of the slope. The accuracy of the instrument was 2 mm in the range of 20 m. The point cloud data was de-noised, spliced, calibrated, and processed by Trimble Real Works, and the same digital coordinate system was used to generate a slope digital elevation model (DEM) with a resolution of 5 × 5 mm by ArcGIS 10.1. First, we obtained the elevation difference (the unit is m) between before and after rainfall spatial point erosion on the slope. Then, the erosion volume was calculated via the elevation difference multiplying the grid area. Finally, the amount of erosion was measured by soil bulk density multiplying the erosion volume. The prediction error was obtained via comparing the DEM-estimated erosion and the corresponding measured values; the prediction error range was 0.35–14.84%. Regression verification was carried out on the erosion amount calculated by the DEM and the measured sediment yield (Figure 2, R2 = 0.999). The experimental steel trough was divided into 1 × 1 m slope sections, with a total of 13 sections, from the runoff outlet upward, which were followed by 1–13 m slope sections, and the erosion amount of each section was calculated according to DEM.
Three microtopographic factors including slope, surface roughness, and surface cutting depth were selected to characterize the microtopographic features of the slope, which were obtained from the DEM [54] as follows:
- (1)
- S is the slope of the point, which refers to the angle between the tangent plane passing through the point and the horizontal plane. It is the maximum ratio of height change, indicating the degree of inclination of the ground surface at that point. It is extracted by the slope function in ArcGIS GIS software.
- (2)
- R is the surface roughness, defined as the ratio of the surface area of the surface element to the projected area on the horizontal plane, which is expressed as:R = Ssurface/SlevelAfter simplification, the calculation formula was obtained: R = 1/cos (S × π/180), S is the slope of the analysis window (°).
- (3)
- SI refers to the earth’s surface incision at every point on the ground. Expressed as a formula:SI = Hmean − Hmin
Hmean is the average elevation in the analysis window, mm; Hmin is the minimum elevation value in the analysis window, mm.
To account for the strong correlation between the microtopographic factors in this study, we used ridge regression analysis to fit the relationship between microtopography and erosion. Ridge regression is a biased regression estimation method for analyzing collinear data [55] that improves the stability of each coefficient by weakening the unbiasedness of the equation.
ANOVA analysis of variance was used to compare differences between sets of data, and the Pearson correlation analysis was used to analyze data correlation. Statistical analysis was performed in SPSS 22.0 and the drawing was performed using Origin 2017.
3. Results
3.1. Change Process of Sediment Concentration on Slopes under Different Thickness of Sand
The sediment content of the slope decreased with the increase of rainfall events (Figure 3). After the first rainfall, the average sediment concentration of slopes with thicknesses of 0.5, 1.0, and 1.5 cm was 7.46, 6.97, and 8.63 that of the loess slope, respectively. The average sediment concentration of the second rainfall was 4.04, 3.79, and 5.32 times the loess slope, respectively. The average sediment concentration of the third rainfall was 2.14 times (0.5 cm) and 1.70 times (1.0 cm) of the loess slope, respectively. ANOVA showed that the sediment concentration of the sand slope on the slope of the three consecutive rainfalls was significantly higher than that of the loess slope (p < 0.05). We further found a significant difference in the sediment concentration between the slopes of 0.5 cm and 1.5 cm and between 1 cm and 1.5 cm of sand covering under the same rainfall event (p < 0.05). There was no significant difference in the sediment concentration between the 0.5 cm and 1 cm slopes (p > 0.05). Under the thickness of sand covering of 0.5, 1.0, and 1.5 cm, the runoff time of the first rainfall was delayed by 18, 19, and 23 min, respectively, relative to the loess slope, indicating that the increase of sand thickness prolonged the initial runoff time of the slope. Compared with the loess slope, the sediment concentration on the slope of the sand cover changed drastically, mainly because the flow pattern of the slope on the slope of the sand has changed, from the super-osmotic flow on the slope of the loess to the pseudo-filled runoff [56]. The amount of infiltration in the early stage of the runoff was large, and the binary structure of the sand was fragile. With the action of hydraulic power and self-gravity, the slope was more likely to erode and collapse, and the runoff was lost. Therefore, the changed process of sediment concentration on the slope of the sand during the rainfall process was more severe than that of the loess slope.
3.2. Spatial Distribution Characteristics of Soil Erosion on Slope
The gully of the loess slope developed slowly compared to sand covered slopes (Figure 4). After three rainfalls, the rill developed to 5 m from the bottom of the slope, while the remainder of the slope was covered. On sandy slopes, rills developed over more than 10 m and formed fine grooves that were sinuous and meandering. Their complicated shapes indicated that the rill erosion that occurred on sandy slopes were more severe than those on the loess slope. While erosion on the loess slope developed slowly over multiple rainfall events, sandy slopes saw large amounts of sediment production across the whole slope after the first rainfall. The most severely eroded areas after the second and third rainfalls occurred at the lower part of the slope (2–5 m).
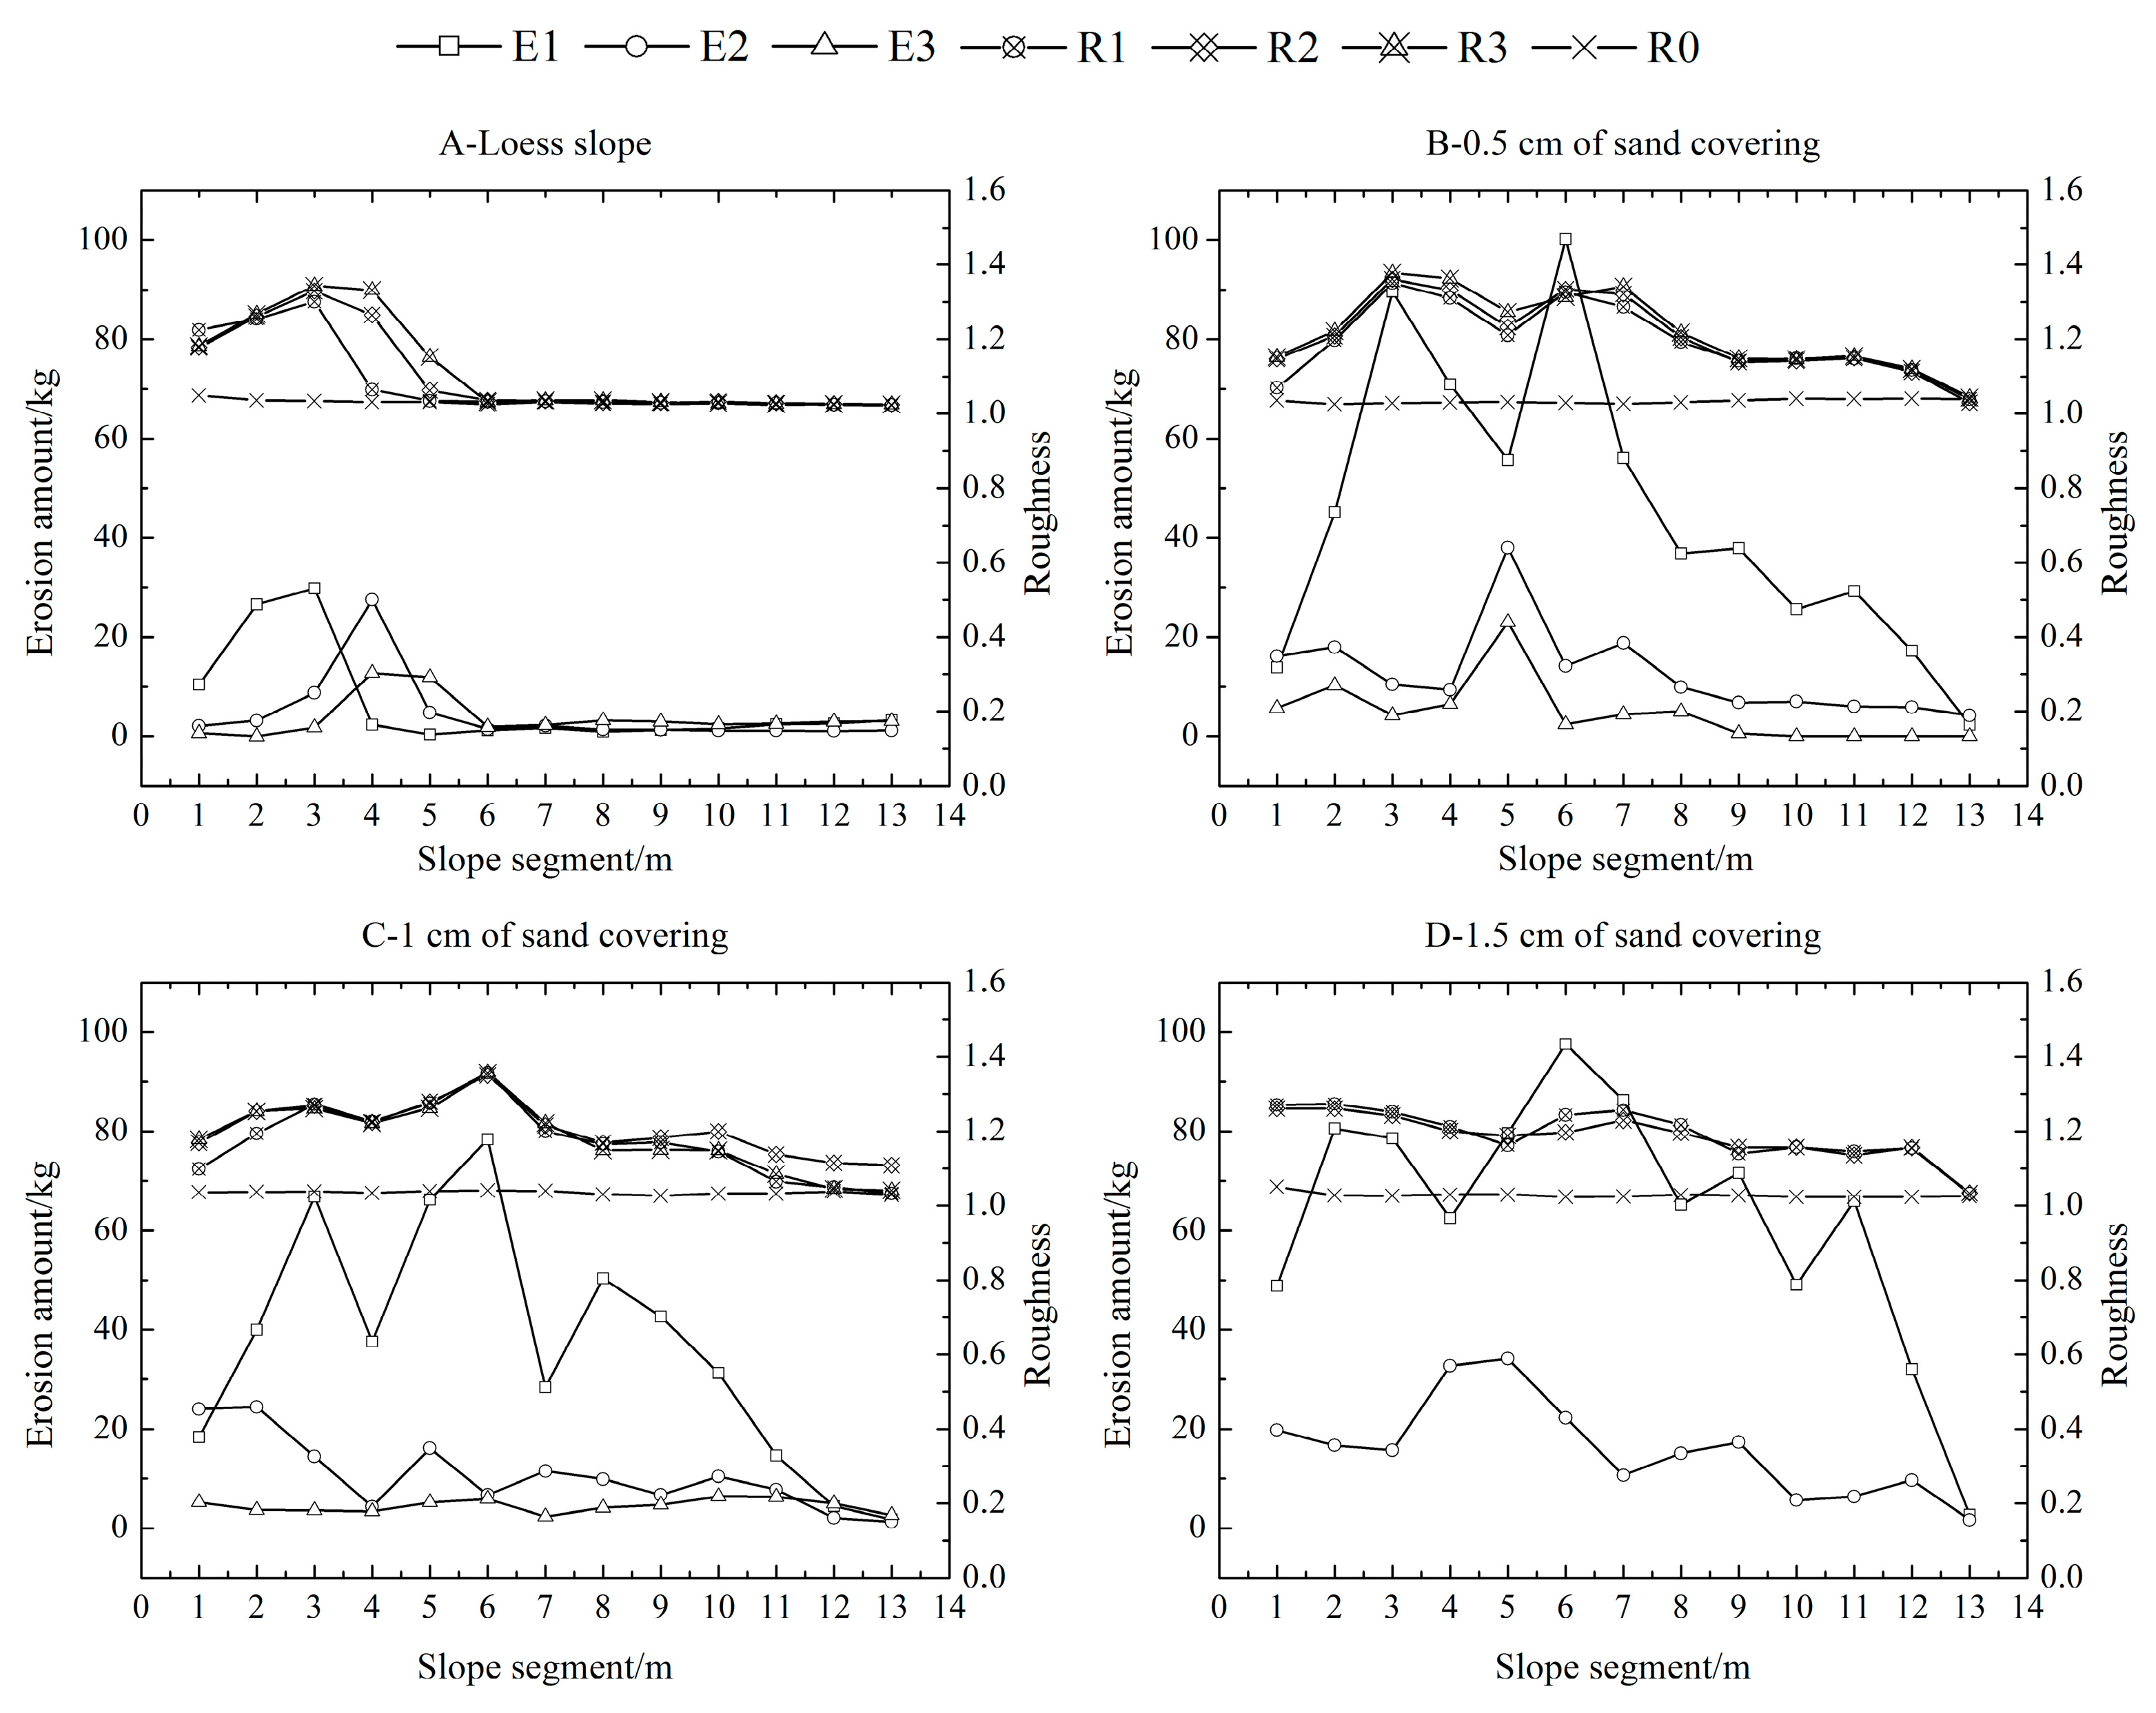
In general, slope erosion decreased with the number of rainfall events (Figure 5). This was predominantly because most of the fine sand and soil particles were lost in the first rainfall and it was difficult to store the runoff in the broken sand layer, which led to the early initial flow of the subsequent rainfall that ultimately reduced the infiltration and wetness of the loess trapped. At the same time, the loss of surface sand caused the loess to become exposed and gradually form crust during the rainfall process, which improved the soil’s corrosion resistance and reduced further erosion. The erosion peaks of the three rainfalls on the loess slope were in the slopes of 2–3 m, 3–4 m, and 4–5 m, respectively (Figure 5A), and the erosion in the 1–6 m area accounted for 83.65%, 83.44%, and 59.84% of the total erosion, respectively. This indicated that the main erosion producing of the loess slope was in the middle and lower sections of the slope. After the slope became covered with sand, the amount of erosion increased significantly. The erosion amount of the three rainfalls on the 0.5 cm slope were 6.96, 2.88, and 1.29 times the loess slope, respectively (Figure 5B), and the erosion amount in the 1–6 m area accounted for 64.65%, 64.41%, and 83.63% of the total erosion, respectively. After covering 1 cm of sand, the erosion of the three rainfalls was 5.68, 2.44, and 1.21 times, respectively, the loess slope (Figure 5C), and the erosion amount in the 1–6 m area accounted for 63.90%, 64.40%, and 46.14% of the total erosion, respectively. The amount of sediment produced by different slopes of the field was similar, and the sediment yield on the slope tended to be stable. After 1.5 cm of sand covering, the total sediment yield of the two rainfalls were 9.69 and 3.63 times the loess slope, respectively (Figure 5D), and the erosion amount in the 1–6 m area accounted for 54.57% and 68.00% of the total erosion, respectively. Overall, the sediment yield in the middle and lower part of the slope (1–6 m) was larger than the upper middle part of the slope (7–13 m), and the peak area of erosion was mostly distributed on the slope of 4–6 m. We found that the middle and lower parts of the slope were the most vulnerable to the erosion of the water flow during continuous rainfall. Therefore, to better prevent and control the erosion of both loess and sand, the middle and lower slopes are more important than the middle and upper slopes.
3.3. Slope Microtopographic Spatial Change
We found that the loess slope roughness increased with rainfall events (Figure 5A). Compared with the initial slope, the roughness of the three rainfall fields increased by 5.34%, 7.04%, and 8.34%, respectively. Compared with the initial slope, the roughness of 0.5 cm cover slope increased by 15.66%, 16.94%, and 18.16%, respectively (Figure 5B). After covering 1 cm of sand, the roughness increases by 13.34%, 16.45%, and 14.25%, respectively (Figure 5C). After 1.5 cm of sand, the increase rate was 16.06% and 15.29%, respectively (Figure 5D). However, there was no significant difference in slope roughness between the three successive rainfalls under the condition of sand cover (p > 0.05).
Compared with the initial slope, the surface cutting depth of three rainfalls on the loess slope increased by 45.65%, 63.76%, and 78.99%, respectively. The growth rates after 0.5 cm sand cover were 132.16%, 121.89%, and 149.83%, respectively. After 1 cm sand cover, the growth rates were 135.81%, 212.17%, and 149.25%, respectively. After 1.5 cm sand cover, the increases were 185.65% and 181.45%, respectively. Thus, the slope surface changed more dramatically after sand recombination, and there was no significant difference in the cutting depth of each sandy slope after three rains (p > 0.05).
3.4. Response between Soil Erosion and Topographic Factors
In order to explore the relationship between slope erosion, sediment yield, and topographic factors, we measured the correlation between erosion of the three topographic factors (Table 1).
In general, shape factors of the loess slopes were significantly and highly correlated with the slope erosion, but the strength of the correlation tended to weaken with additional rainfall events. After the first rainfall, the shape of the surface and the prototype of the confluence path had been formed. The crust produced during the rainfall increased the erosion resistance of the soil and weakened the variation of the microtopography. Therefore, the correlation between the two was weakened with the increase of rainfall events and our ability to predict soil erosion by a single microtopographic factor decreased accordingly. On the sand-covered slope, there was a correlation between the amplitude of the microtopographic factor and the amount of erosion only during the first rainfall on the slope, but it did not show a correlation in subsequent rainfall.
During the first rainfall, the correlation coefficient between the erosion amount and the microtopography factor under different sand thicknesses was 0 cm (loess slope) > 0.5 cm > 1 cm > 1.5 cm, which indicated that the correlation coefficient became weak with the increasing sand cover thickness (Table 1). The correlation coefficient for 1.5 cm sand cover thickness was obviously weaker than that for 0.5 cm and 1 cm sand cover thickness. Combined with the process of sediment concentration change (Figure 3), the possible reasons for this phenomenon are shown as follows. There was no significant difference of sediment concentration between the 0.5 cm and 1 cm sand cover thickness, while the sediment concentration for 1.5 cm sand cover thickness was obviously larger than that for 0.5 cm and 1 cm sand cover thickness. The slope stored more water for 1.5 cm sand cover thickness before the runoff compared to the slopes for 0.5 cm and 1 cm sand cover thickness. It is to be ignored that the above sandy water flow and underlying surface conditions influence the erosion of the slope, which is one of reasons that the correlation coefficient for 1.5 cm sand cover thickness was weaker than that for 0.5 cm and 1 cm sand cover thickness.
Due to the difference in the sediment yield mechanism between the loess slope and sand slope, it was necessary to study the relationship between erosion and sediment yield and microtopography. We used ridge regression to model a linear relationship between the microtopographic variation and the erosion amount of each slope segment, in which the loess slope data was derived from the whole continuous rainfall process, and the sand-covered loess slope data was derived from the entire continuous rainfall process under three different sand-covering thicknesses (Equations (2) and (3)),
where Y represents the amount of erosion per 1 × 1 m slope (kg); ΔS represents the slope amplitude of the slope (°); ΔR represents the surface roughness variation of the slope; and ΔSI represents the surface depth of the slope (mm).
Loess slope: Y = 0.225ΔS + 0.286ΔR + 0.425ΔSI (R2 = 0.903, p < 0.01, N = 39)
Sand slope: Y = 0.259ΔS + 0.616ΔR (R2 = 0.788, p < 0.01, N = 104)
Equation (2) shows that, on the loess slope, the surface deformation depth (ΔSI) had the strongest response to erosion and sediment yield, followed by surface roughness (ΔR) and slope (ΔS). On the sand slopes, surface roughness had the strongest response to erosion and sediment yield, followed by gradient (Equation (3)). The coefficients of determination of the regression equations of the loess and sand slopes were 0.903 and 0.788, respectively (p < 0.05), suggesting that the interaction between microtopographic changes and erosion and sediment yield on the sand slope is complicated, and other more sensitive factors and indicators need to be added for a comprehensive analysis.
4. Discussion
4.1. Response of Soil Erosion and Microtopographic on Overlying Slope
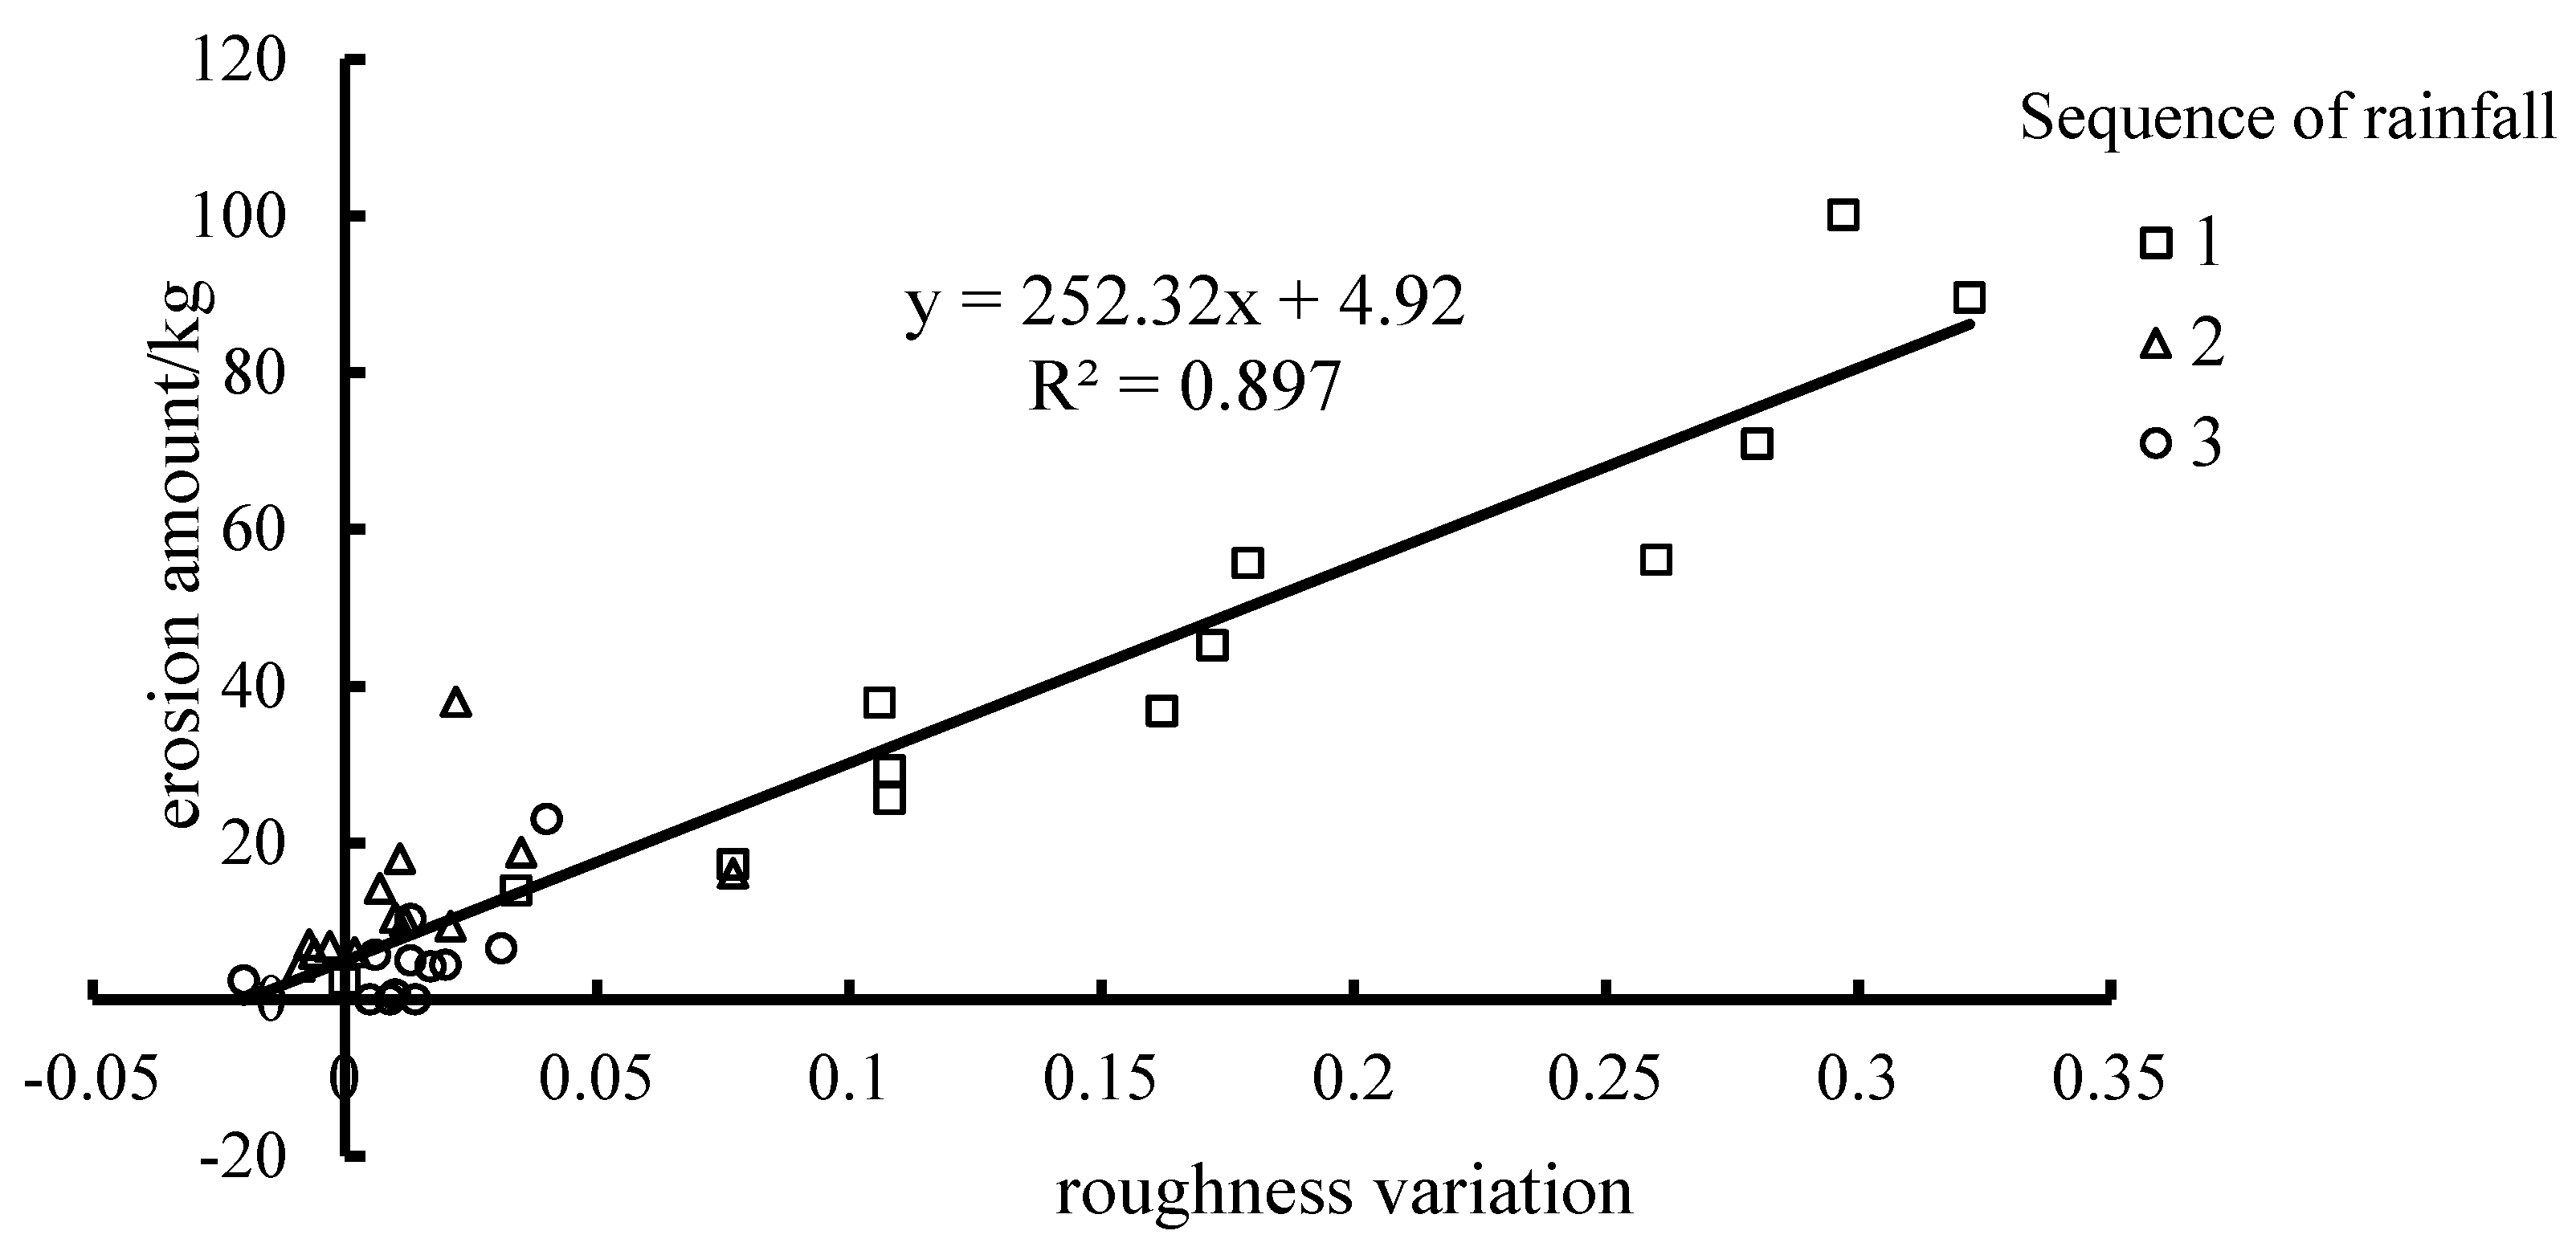
Loess soil has a good structure and viscosity. Slope erosion in the process of rainfall follows the rules of erosion–sheet erosion–fine groove erosion in which the raindrops splash the soil particles from the soil and the runoff formed on the slope transports the separated sediment particles. At the beginning of the rainfall, the dry soil is easily detached and transported. Deposition occurred on the top of slope. On the one hand, sediment was easy to deposit during transport processes because of the lower runoff energy on the top of slope. One the other hand, the soil become tampered as rainfall continues and soil erodibility is weakened. It is not enough runoff energy to detach the soil particle on the top of slope. The surface particles of the coated loess are poorly viscous and the pores are large, and the rainwater forms a sand interface flow in the sand layer [41]. The slope of the sand-covered slope generally follows the rules of vertical infiltration–subsurface, flow–seepage, and erosion–collapse. For this reason, the shape of the sand-covered slope is variable, and collapses and mud can occur at any time. However, the initial correlation between the amplitude and erosion of the sand slope microtopography attenuates with subsequent rainfall events. Taking the whole rainfall series covering the 0.5 cm slope (Figure 6) as an example, it can be seen that there was a linear relationship between the amount of erosion and the amplitude of microtopography. This difference is mainly due to the maximum amplitude and erosion of the microtopography during the first rainfall, which controls the distribution pattern of the overall data.
4.2. The influence of Hydrodynamic Factors on Erosion
In addition to studying the response relationship between the change of microtopographic factors and the amount of erosion, we also considered the influence of hydrodynamic factors of the upper water on erosion by measuring the flow velocity of each section of the slope. We found that the runoff power was a powerful predictor of runoff erosion and sediment yield [57,58]. According to the correlation analysis between runoff power and erosion (Table 1), the runoff power was added as an independent variable to the ridge regression equation. The addition of runoff power increased the predictive power on sandy slopes (Equation (4)), but not on loess slopes:
where represents the runoff power of the slope (N·m−1·s−1).
It can be seen that after including runoff power as a predictor, the determination coefficient of the regression equation of the sand-covered slope increased from 0.788 to 0.831, and the model and both normalization coefficients were significant (p < 0.05), which shows that the amount of erosion on the slope of the sand was significantly affected by the runoff power.
Previous studies on the response relationship between microtopography and erosion and sediment yield during the process of erosion mainly focused on the correlation between the two characteristics of slope change and a single factor [52,59,60]. Here, using more detailed 1 m slope sections to analyze the spatial distribution of slope surface erosion, we found that including the water flow factor increased the accuracy of soil erosion predictions based solely on microtopographic features. Due to the limited conditions of our tests, the factors inside or outside the other sand layers could not be incorporated, and comprehensive effects of many other factors should be considered in subsequent studies.
5. Conclusions
Here, we studied the spatial source of slope erosion, characteristics of slope microtopography, and the relationship between the two under experiment rainfalls. We found:
- Under continuous rainfall, the average sediment concentration on the slope decreased significantly with subsequent rainfall events. In the same rainfall regime, there was a significant difference in the sediment concentration between slopes with 0.5 cm and 1.5 cm sand cover, and between 1 cm and 1.5 cm sand cover (p < 0.05). In addition, during the first rainfall, the increase of sand thickness extends the initial runoff time of the slope.
- In the continuous rainfall process, the middle and lower parts of the slope were the most vulnerable to water erosion. As the rainfall progressed, the peak area of erosion moved in the direction of the slope. The main sand production area was 1–6 m slope section, and there was little sand production on the slope. While on the slope surface, a large amount of sediment production occurred under the condition of sand covering. The sediment yield in the middle and lower part of the slope (1–6 m) was larger than the upper middle part of the slope (7–13 m) and the peak area of erosion was also distributed on the slope 4–6 m. The slope section indicated that for the prevention and control of slope erosion, the treatment of the middle and lower slope section is more important than the middle and upper slope sections.
- The microtopographic index on the loess slope gradually increased with the progress of rainfall. The microtopographic index of the overlying slope was generally larger than that of the loess slope. There was no significant difference in the microtopographic factors between the three rainfalls under each sediment thickness (p > 0.05).
- The correlation between the microtopographic variation and the erosion amount of the loess slope under different fields was very strong, but the sand-covered slope had only a significant correlation during the first rainfall event. The microtopographic factors with the strongest erosion responses were surface cutting depth and surface roughness for the loess and sand slopes, respectively. The coefficient of determination of the regression equation of the loess slope (R2 = 0.903) was larger than that of the slope of the sand (R2 = 0.788). Therefore, for the study of the erosion response mechanism of the slope, it is necessary to add other sensitive indicators for a comprehensive analysis.
Author Contributions
F.W. and G.X. conceived the main idea of the paper. L.L., Z.L., P.L., J.Z., Y.C. designed and performed the experiment. F.W. wrote the manuscript and all authors contributed in improving the paper.
Funding
This research was supported by the National Natural Science Foundations of China (No. 51779204), the Shaanxi Province Innovation Talent Promotion Plan Project Technology Innovation Team (No. 2018TD-037), Basal Scientific Research Funds in Central Public Welfare Scientific Research Units: Evaluation of Implementation Effects of Water-saving Reform Projects in Typical Irrigation District of Yellow River Basin Based on WHAT-IF Model (No. HKY-JBYW-2017-23).
Acknowledgments
We thank the reviewers for their useful comments and suggestions.
Conflicts of Interest
The authors declare no conflict of interest.
References
- Penuela, A.; Javaux, M.; Bielders, C.L. How do slope and surface roughness affect plot-scale overland flow connectivity. J. Hydrol. 2015, 528, 192–205. [Google Scholar] [CrossRef]
- Rai, R.K.; Upadhyay, A.; Singh, V.P. Effect of variable roughness on runoff. J. Hydrol. 2010, 382, 115–127. [Google Scholar] [CrossRef]
- Gómez, J.A.; Nearing, M.A. Runoff and sediment losses from rough and smooth soil surfaces in a laboratory experiment. Catena 2005, 59, 253–266. [Google Scholar] [CrossRef]
- Zhao, L.S.; Liang, X.L.; Wu, F.Q. Soil surface roughness change and its effect on runoff and erosion on the Loess Plateau of China. J. Arid Land 2014, 6, 400–409. [Google Scholar] [CrossRef]
- Wang, T.; Li, P.; Liu, Y.; Hou, J.; Li, Z.; Ren, Z.; Cheng, S.; Zhao, J.; Hinkelmann, R. Experimental investigation of freeze-thaw meltwater compound erosion and runoff energy consumption on loessal slopes. Catena 2020, 185, 104310. [Google Scholar] [CrossRef]
- Darboux, F.; Huang, C.H. Does soil surface roughness increase or decrease water and particle transfers. Soil Sci. Soc. Am. J. 2005, 69, 748–756. [Google Scholar] [CrossRef]
- Huang, C.H.; Bradford, J.M. Depressional storage for Markov-Gaussian surfaces. Water Resour. Res. 1990, 26, 22–35. [Google Scholar] [CrossRef]
- Jester, W.; Klik, A.; Hauer, G.; Hebel, B.; Truman, C.C. Rainfall and surface roughness effects on soil loss and surface runoff. In Proceedings of the Soil Erosion Research for the 21st Century: Proceedings of the International Symposium, Honolulu, HI, USA, 3–5 January 2001; pp. 463–466. [Google Scholar]
- Johnson, C.B.; Mannering, J.V.; Moldenhauer, W.C. Influence of surface roughness and clod size and stability on soil and water losses1. Soil Sci. Soc. Am. J. 1979, 43, 772–777. [Google Scholar] [CrossRef]
- Onstad, C.A. Depressional storage on tilled soil surfaces. Trans. ASAE 1984, 27, 729–732. [Google Scholar] [CrossRef]
- Zheng, Z.; Qin, F.; Li, T. Changes in soil surface microrelief of purple soil under different slope gradients and its effects on soil erosion. Trans. Chin. Soc. Agric. Eng. 2015, 31, 168–175, (In Chinese with English Abstract). [Google Scholar]
- Rice, C.; Wilson, B.N.; Appleman, M. Soil topography measurements using image processing techniques. Comput. Electron. Agric. 1988, 3, 97–107. [Google Scholar] [CrossRef]
- Thomsen, L.M.; Baartman, J.E.M.; Barneveld, R.J.; Starkloff, T.; Stolte, J. Soil surface roughness: Comparing old and new measuring methods and application in a soil erosion model. Soil Discuss. 2015, 1, 399–410. [Google Scholar] [CrossRef]
- Wang, T.; Li, P.; Hou, J.; Li, Z.; Ren, Z.; Cheng, S.; Xu, G.; Su, Y.; Wang, F. Response of the Meltwater Erosion to Runoff Energy Consumption on Loessal Slopes. Water 2018, 10, 1522. [Google Scholar] [CrossRef]
- Liu, J.; Wang, Z.; Gao, S.; Zhang, K. Experimental study on hydro-dynamic mechanism of sheet erosion processes on loess hillslope. Trans. Chin. Soc. Agric. Eng. 2012, 28, 144–149, (In Chinese with English Abstract). [Google Scholar]
- Shi, P.; Zhang, Y.; Ren, Z.; Yu, Y.; Li, P.; Gong, J. Land-use changes and check dams reducing runoff and sediment yield on the Loess Plateau of China. Sci. Total Environ. 2019, 664, 984–994. [Google Scholar] [CrossRef]
- Tang, H.; Li, Z.B.; Li, P.; Wang, T. Runoff, Sediment yield and microtopography of loess slope under artificial rain. J. Desert Res. 2016, 36, 1708–1712, (In Chinese with English Abstract). [Google Scholar]
- Zhao, L.S.; Zhang, Q.F.; Wang, J.; Wu, F.Q. Effect of soil surface roughness on rainfall erosion as affected by slope position on loess slope. Acta Pedol. Sin. 2013, 50, 637–642, (In Chinese with English Abstract). [Google Scholar]
- Guzha, A.C. Effects of tillage on soil microrelief, surface depression storage and soil water storage. Soil Tillage Res. 2004, 76, 105–114. [Google Scholar] [CrossRef]
- Lampurlanés, J.; Cantero-Martínez, C. Hydraulic conductivity, residue cover and soil surface roughness under different tillage systems in semiarid conditions. Soil Tillage Res. 2006, 85, 13–26. [Google Scholar] [CrossRef]
- García Moreno, R.; Díaz álvarez, M.C.; Tarquis, A.M.; Barrington, S.; Requejo, A.S. Tillage and soil type effects on soil surface roughness at semiarid climatic conditions. Soil Tillage Res. 2008, 98, 35–44. [Google Scholar] [CrossRef]
- Oguntunde, P.G.; Ajayi, A.E.; Giesen, N.V.D. Tillage and surface moisture effects on bare-soil albedo of a tropical loamy sand. Soil Tillage Res. 2006, 85, 107–114. [Google Scholar] [CrossRef]
- Wang, Y.; Zheng, Z.C.; Li, T.X.; He, S.Q. Change of soil surface roughness during maize growing season and its relationship with soil erosion amount on slope of contour tillage during water erosion process. Sci. Soil Water Conserv. 2018, 16, 31–37, (In Chinese with English Abstract). [Google Scholar]
- Borselli, L. Segmentation of soil roughness profiles. Earth Surf. Process. Landf. 1999, 24, 71–90. [Google Scholar] [CrossRef]
- Helming, K.; Römkens, M.J.M.; Prasad, S.N. Surface roughness related processes of runoff and soil loss: A flume study. Soil Sci. Soc. Am. J. 1998, 62, 243–250. [Google Scholar] [CrossRef]
- Helming, K.; Roth, C.H.; Wolf, R.; Diestel, H. Characterization of rainfall—Microrelief interactions with runoff using parameters derived from digital elevation models (DEMs). Soil Technol. 1993, 6, 273–286. [Google Scholar] [CrossRef]
- Jester, W.; Klik, A. Soil surface roughness measurement-methods, applicability and surface representation. Catena 2005, 64, 174–192. [Google Scholar] [CrossRef]
- Frédéric, D.; Huang, C. An instantaneous-profile laser scanner to measure soil surface microtopography. Soil Sci. Soc. Am. J. 2003, 67, 92–99. [Google Scholar]
- Huang, C.H.; White, I.; Thwaite, E.G.; Bendeli, A. A noncontact laser system for measuring soil surface topography. 1988, 52, 350–355. [Google Scholar] [CrossRef]
- Huang, C.H.; Bradford, J.M. Applications of a laser scanner to quantify soil microtopography. Soil Sci. Soc. Am. J. 1992, 56, 14–21. [Google Scholar] [CrossRef]
- Gabriels, D. Characterisation of Soil Microtopography Effects on Runoff and Soil Erosion Rates under Simulated Rainfall. Soil Sci. Soc. Am. J. 2011. [Google Scholar] [CrossRef]
- Luo, J.; Zhen, Z.C.; Li, T.X.; He, S.Q. Multifractal characteristics of surface microtopography and its influence on sediment yield on slope of cross ridge. J. Soil Water Conserv. 2015, 29, 66–72, (In Chinese with English Abstract). [Google Scholar]
- Zheng, L.Y.; Li, Z.B.; Li, P.; Song, W.; Liu, P.L. Study on spatial distribution of sediment source of slope erosion. J. Soil Water Conserv. 2012, 26, 58–61, (In Chinese with English Abstract). [Google Scholar]
- Ahmadi, A.; Neyshabouri, M.R.; Rouhipour, H.; Asadi, H. Fractal dimension of soil aggregates as an index of soil erodibility. J. Hydrol. 2011, 400, 305–311. [Google Scholar] [CrossRef]
- Mandelbrot, B. How long is the coast of britain? Statistical self-similarity and fractional dimension. Science 1967, 156, 636–638. [Google Scholar] [CrossRef]
- Ren, M.E. Sediment discharge of the Yellow River, China: Past, present and future-A synthesis. Acta Oceanol. Sin. 2015, 34, 1–8. [Google Scholar] [CrossRef]
- Xu, J.X. Reconstructing the suspended sediment load of the Yellow River since 1470 CE using the Drought and Flood Index. Geomorphology 2017, 299, 131–141. [Google Scholar] [CrossRef]
- Shi, P.; Zhang, Y.; Zhang, Y.; Yu, Y.; Li, P.; Li, Z.; Xiao, L.; Xu, G.; Zhu, T. Land-use types and slope topography affect the soil labile carbon fractions in the Loess hilly-gully area of Shaanxi, China. Arch. Agron. Soil Sci. 2019. [Google Scholar] [CrossRef]
- Tang, S.S.; Li, P.; Ren, Z.P.; Tang, H.; Wang, T. Particle size composition of sediment from sand-covered slope under simulated rainfall. Acta Pedol. Sin. 2016, 53, 39–47, (In Chinese with English Abstract). [Google Scholar]
- Xu, G.C.; Tang, S.S.; Lu, K.X.; Li, P.; Li, Z.B.; Gao, H.; Zhao, B. Runoff and sediment yield under simulated rainfall on sand-covered slopes in a region subject to wind-water erosion. Environ. Earth Sci. 2015, 74, 2523–2530. [Google Scholar] [CrossRef]
- Xie, L.Y.; Bai, Y.J.; Zhang, F.B. Effects of thickness and particle size composition of overlying sand layer on runoff and sediment yield on sand-covered loess slopes. Acta Pedol. Sin. 2017, 54, 60–72, (In Chinese with English Abstract). [Google Scholar]
- Wu, X.R.; Zhang, F.B.; Wang, Z.L. Variation of sand and loess properties of binary structure profile in hilly region covered by sand of the loess plateau. J. Soil Water Conserv. 2014, 28, 190–193, (In Chinese with English Abstract). [Google Scholar]
- Wang, Z.H.; Zhang, F.B.; Yang, M.Y.; Ren, R.X.; Deng, X.X.; Cao, X.J.; Li, Z.B. Effect of vegetation utilization on runoff and sediment production on grain-for-green slopes in the wind-water erosion crisscross region. Chin. J. Appl. Ecol. 2018, 29, 3907–3916, (In Chinese with English Abstract). [Google Scholar]
- Abrahams, A.D.; Parsons, A.J. Determining the mean depth of overland flow in field studies of flow hydraulics. Water Resour. Res. 1990, 26, 501–503. [Google Scholar] [CrossRef]
- Shi, P.; Qin, Y.; Liu, Y.; Zhu, T.; Li, Z.; Li, P.; Ren, Z.; Liu, Y.; Wang, F. Soil respiration and response of carbon source changes to vegetation restoration in the Loess Plateau, China. Sci. Total Environ. 2019. [Google Scholar] [CrossRef]
- Lyles, L.; Woodruff, N. How moisture and tillage affect soil cloddiness for wind erosion control. Agric. Eng. 1962, 43, 150–153. [Google Scholar]
- Römkens, M.; Helming, K.; Prasad, S. Soil erosion under different rainfall intensities, surface roughness, and soil water regimes. Catena 2002, 46, 103–123. [Google Scholar] [CrossRef]
- Vannier, E.; Taconet, O.; Dusséaux, R.; Chiadjeu, O.C. Statistical characterization of bare soil surface microrelief. Adv. Geosci. Remote Sens. 2014, 207–228. [Google Scholar] [CrossRef] [Green Version]
- Zobeck, T.M.; Onstad, C. Tillage and rainfall effects on random roughness: A review. Soil Tillage Res. 1987, 9, 1–20. [Google Scholar] [CrossRef]
- Burwell, R.E.; Larson, W.E. Infiltration as influenced by tillage-induced random roughness and pore space1. Soil Sci. Soc. Am. J. 1969, 33, 449–452. [Google Scholar] [CrossRef]
- Tang, H.; Li, Z.B.; Li, P.; Tang, S.; Ren, Z.; Zhang, J. Surface micro topography quantification and its relationship with runoff and sediment under simulated rainfall. Trans. Chin. Soc. Agric. Eng. 2015, 31, 127–133, (In Chinese with English Abstract). [Google Scholar]
- Fan, R.S.; Li, Z.B. Artificial rainfall device for soil erosion study. J. Soil Water Conserv. 1991, 2, 38–45, (In Chinese with English Abstract). [Google Scholar]
- Hao, H.X.; Guo, Z.L.; Wang, X.Z.; Zhan, H.; Ma, R.; Li, Z.; Jiang, J. Rill erosion process on red soil slope under interaction of rainfall and scouring flow. Trans. Chin. Soc. Agric. Eng. 2017, 33, 134–140, (In Chinese with English Abstract). [Google Scholar]
- Li, R.; Zhao, M.D.; Yang, Q.K. Atlas of Soil Erosion in China; Cartographic Publishing House: Beijing, China, 2014; pp. 83–84, (In Chinese with English Abstract). [Google Scholar]
- Zhang, Z.T.; Wang, H.F.; Arnon, K.; Chen, J.; Han, W. Inversion of soil moisture content from hyperspectra based on ridge regression. Trans. Chin. Soc. Agric. Mach. 2018, 49, 240–248, (In Chinese with English abstract). [Google Scholar]
- Tang, S.S.; Li, Z.B.; Ren, Z.P.; Yao, J.W.; Tang, H. Experimental study on the process of runoff and sediment yield on sand-covered slope. J. Soil Water Conserv. 2015, 29, 25–28, (In Chinese with English abstract). [Google Scholar]
- Li, P.; Li, Z.B.; Zheng, L.Y.; Lu, K. Comparisons of dynamic meachanics of soil erosion and sediment yield by runoff on loess slope. J. Soil Water Conserv. 2005, 19, 66–69, (In Chinese with English Abstract). [Google Scholar]
- Cui, W.B.; Li, P.; Li, Z.B.; Ru, H.N. Application of unit runoff power theory for sediment yield calculation on loess slope. J. Northwest A&F Univ. (Nat. Sci. Ed.) 2005, 9, 103–107. [Google Scholar]
- Wu, F.Q.; Zhen, Z.C. Measure and calculation of surface roughness on slope farmland. Bull. Soil Water Conserv. 2005, 25, 71–74, (In Chinese with English Abstract). [Google Scholar]
- Gao, S.J.; Zhao, L.S.; Liang, X.L. Surface roughness spatiotemporal distribution of the slope land under simulated rainfall. Res. Soil Water Conserv. 2010, 17, 12–16, (In Chinese with English Abstract). [Google Scholar]
Figure 1.
Experimental rainfall system.

Figure 2.
Comparison between measured sediment yield and the amount of erosion estimated by digital elevation model (DEM).
Figure 2.
Comparison between measured sediment yield and the amount of erosion estimated by digital elevation model (DEM).

Figure 3.
Variation process of sediment concentration.

Figure 4.
Soil erosion distribution map.

Figure 5.
Distribution characteristics of soil erosion and roughness on different slope segments.

Figure 6.
Relationship between roughness variation and erosion amount under the sand cover of 0.5 cm.
Figure 6.
Relationship between roughness variation and erosion amount under the sand cover of 0.5 cm.


Table 1.
Correlation between microtopographic amplitude and erosion.
| Sand Bed Thickness /cm | Sequence | Slope /(°) | Roughness | Incision Depth /mm | Runoff Power /(N·m−1·s−1) |
|---|---|---|---|---|---|
| 1 | 0.96 ** | 0.96 ** | 0.97 ** | 0.64 * | |
| loess slope | 2 | 0.95 ** | 0.96 ** | 0.96 ** | 0.60 * |
| 3 | 0.84 ** | 0.92 ** | 0.88 ** | 0.60 * | |
| 1 | 0.95 ** | 0.96 ** | 0.96 ** | 0.58 * | |
| 0.5 | 2 | 0.54 | 0.46 | 0.55 | 0.63 * |
| 3 | −0.24 | 0.64 * | −0.21 | 0.53 | |
| 1 | 0.83 ** | 0.95 ** | 0.96 ** | 0.83 ** | |
| 1 | 2 | −0.39 | 0.08 | −0.47 | 0.80 * |
| 3 | −0.12 | −0.21 | −0.17 | 0.05 | |
| 1 | 0.77 ** | 0.74 ** | 0.78 ** | 0.81 ** | |
| 1.5 | 2 | −0.14 | 0.09 | 0.01 | 0.57 * |
| 3 | - | - | - | - |
Note: * means significant correlation at the level of 0.05, ** means significant correlation at the level of 0.01.
© 2019 by the authors. Licensee MDPI, Basel, Switzerland. This article is an open access article distributed under the terms and conditions of the Creative Commons Attribution (CC BY) license (http://creativecommons.org/licenses/by/4.0/).
Share and Cite
MDPI and ACS Style
Wang, F.; Xu, G.; Li, L.; Li, Z.; Li, P.; Zhang, J.; Cheng, Y. Response Relationship between Microtopographic Variation and Slope Erosion under Sand-Cover. Water 2019, 11, 2488. https://doi.org/10.3390/w11122488
AMA Style
Wang F, Xu G, Li L, Li Z, Li P, Zhang J, Cheng Y. Response Relationship between Microtopographic Variation and Slope Erosion under Sand-Cover. Water. 2019; 11(12):2488. https://doi.org/10.3390/w11122488
Chicago/Turabian StyleWang, Feichao, Guoce Xu, Lin Li, Zhanbin Li, Peng Li, Jianwen Zhang, and Yuting Cheng. 2019. "Response Relationship between Microtopographic Variation and Slope Erosion under Sand-Cover" Water 11, no. 12: 2488. https://doi.org/10.3390/w11122488
Note that from the first issue of 2016, this journal uses article numbers instead of page numbers. See further details here.