Experimental Study on the Permeability Characteristic of Fused Quartz Sand and Mixed Oil as a Transparent Soil


1
MOE Key Laboratory of Soft Soils and Geoenvironmental Engineering, Department of Civil Engineering, Zhejiang University, Hangzhou 310058, China
2
Center for Hypergravity Experimental and Interdisciplinary Research, Zhejiang University, Hangzhou 310058, China
*
Author to whom correspondence should be addressed.
Water 2019, 11(12), 2514; https://doi.org/10.3390/w11122514
Submission received: 12 November 2019
/
Accepted: 26 November 2019
/
Published: 28 November 2019
(This article belongs to the Special Issue Modeling of Flow and Transport in Saturated and Unsaturated Porous Media)
Abstract
:An accurate estimation of soil permeability is essential in geotechnical engineering. Transparent soil provides a promising experimental material to visualize pore-scale fluid flow, although the permeability characteristic of transparent soil remains unclear. As a result of the replacement of the fluid and solid phase, the permeability coefficient of transparent soil is usually several times or even more than ten times smaller than that of natural soil with the same particle size distribution and porosity. Fused quartz sand is used as the solid phase in this proposed transparent soil, which exhibits a similar mechanical behavior but different permeability to those of natural sand. Due to its low cost and eco-friendly characteristic, a mixture of mineral oil and aliphatic hydrocarbon is proposed as the liquid phase, which can achieve the same refractive index as the fused quartz sand after calculating the material proportion. Through a series of laboratory tests, the permeability of the transparent soil is obtained; the permeability is affected by the fluid dynamic viscosity, fluid density, particle size, particle size distribution, void ratio, and pore morphology. A hierarchical approach is introduced to quantitatively evaluate the effect of the particle shape on the permeability. Based on the experimental results, a modified Kozeny–Carman model is proposed for the prediction of transparent soil permeability, which can guide the preparation of transparent soil samples in further experimental studies.
1. Introduction
Permeability is an essential engineering property of soil, dominating the pore water flow and affecting the soil mechanical behavior [1]. Accurate measurement of soil permeability is necessary for the design of foundation engineering, whereas the variation in soil permeability may significantly affect the behavior of a soil structure, such as the failure of an embankment [2]. Soil permeability is used to depict the pore water flow at a macro scale, while the seepage flow occurs at a micro scale. The emergence of transparent soil provides a feasible technique with which to explore and visualize seepage and osmotic particle motion within soils. Transparent soil is a synthetic material used to simulate the original soil behavior. In transparent soil, the solid material is an artificial transparent particle, and the pore fluid is a synthetic liquid with the same refractive index as the particle [3,4]. Without light reflection and refraction, the entire material presents a transparent state. Some particles or fluid in a certain plane of a transparent soil can be distinguished and photographed by the tracer particle method and laser scattering method [5,6]. Combined with a powerful digital image correlation (DIC) technique, the mechanical behavior of the distinguished parts can be quantitatively analyzed. It is of great significance to use a transparent soil hydraulic model to explore the internal causes of changes from the microscopic view and to verify discrete element simulations [7,8,9,10,11].
In recent years, scholars have studied the application of transparent soil for the visualization of hydraulic conductivity within the soil. Liu et al. [12] added a red dye to the pore fluid within a transparent soil, and the concentration field of the dissolved matter in the pore fluid can be obtained from images based on the calibration curve for the dye. By adding fluorescent dye and fine solid particles into the pore fluid, the behavior of the solid and fluid phase can be illuminated or traced separately under the illumination of the planar laser [13,14], and the flow field can be quantitatively investigated using the particle tracking velocimetry (PTV) technique. As an artificial material, transparent soil exhibits a hydraulic behavior different than that of a natural material, which is due to the replacement of the soil and fluid phase in the application of transparent soil [15].
Although transparent soil provides an effective way to investigate seepage from the pore scale, this hydraulic test cannot guarantee similarity. Due to the replacement of original soils, the permeability coefficient of the transparent soil test determined by some scholars is several times or even more than ten times smaller than that of natural soil under the same conditions [16,17]. This difference can be attributed to three factors. First, the fluid phase in transparent soils is typically a mixture of oil or a high-concentration solution to achieve a high refractive index; in these fluids, the kinematic viscosity is much higher (approximately 5–20 times) than that of water [15,18,19]. The kinematic viscosity of the fluid phase can significantly affect the permeability of the transparent soil. Additionally, artificial transparent particles (such as glass beads, silica gel, or fused quartz) are used as the solid phase in transparent soils. The different particle shapes and textures of these materials would cause a change in the microstructure of the seepage capillaries, resulting in different permeability characteristics [13,20]. Previous studies have not yet identified the universal effect of particle shape on permeability [21,22]. Finally, besides the particle shape, the void ratio and particle size distribution also affect the permeability of transparent soil. In the literature, the parameter values of these factors have not been unified [23,24], and the existing models used to predict permeability were established based on natural soils. Based on the Kozeny–Carman model [22,25], Sanvitale and Bowman [26] adjusted the particle size of transparent soil to reach a similar seepage pattern, although the predictions still showed an obvious deviation from the measurements. The cause of this deviation is likely to be the comprehensive effect of particle shape, particle size, and pore ratio. Therefore, it is necessary to investigate the permeability characteristics and propose a quantitative approach to estimate the permeability of transparent soil.
In this paper, the properties of a transparent soil with fused quartz sand and a mixture of mineral oil and EI solvent (produced by TEACSOL) are tested. A series of constant water head tests with various effective particle sizes and soil porosities are conducted to obtain the permeability of transparent soil. The effect of the replaced solid and fluid phases on the permeability are analyzed, and a hierarchical approach was applied to analyze the impact of particle shape on permeability. A modified Kozeny–Carman model is proposed to estimate the permeability of transparent soil.
2. Materials and Methods
2.1. Transparent Soil
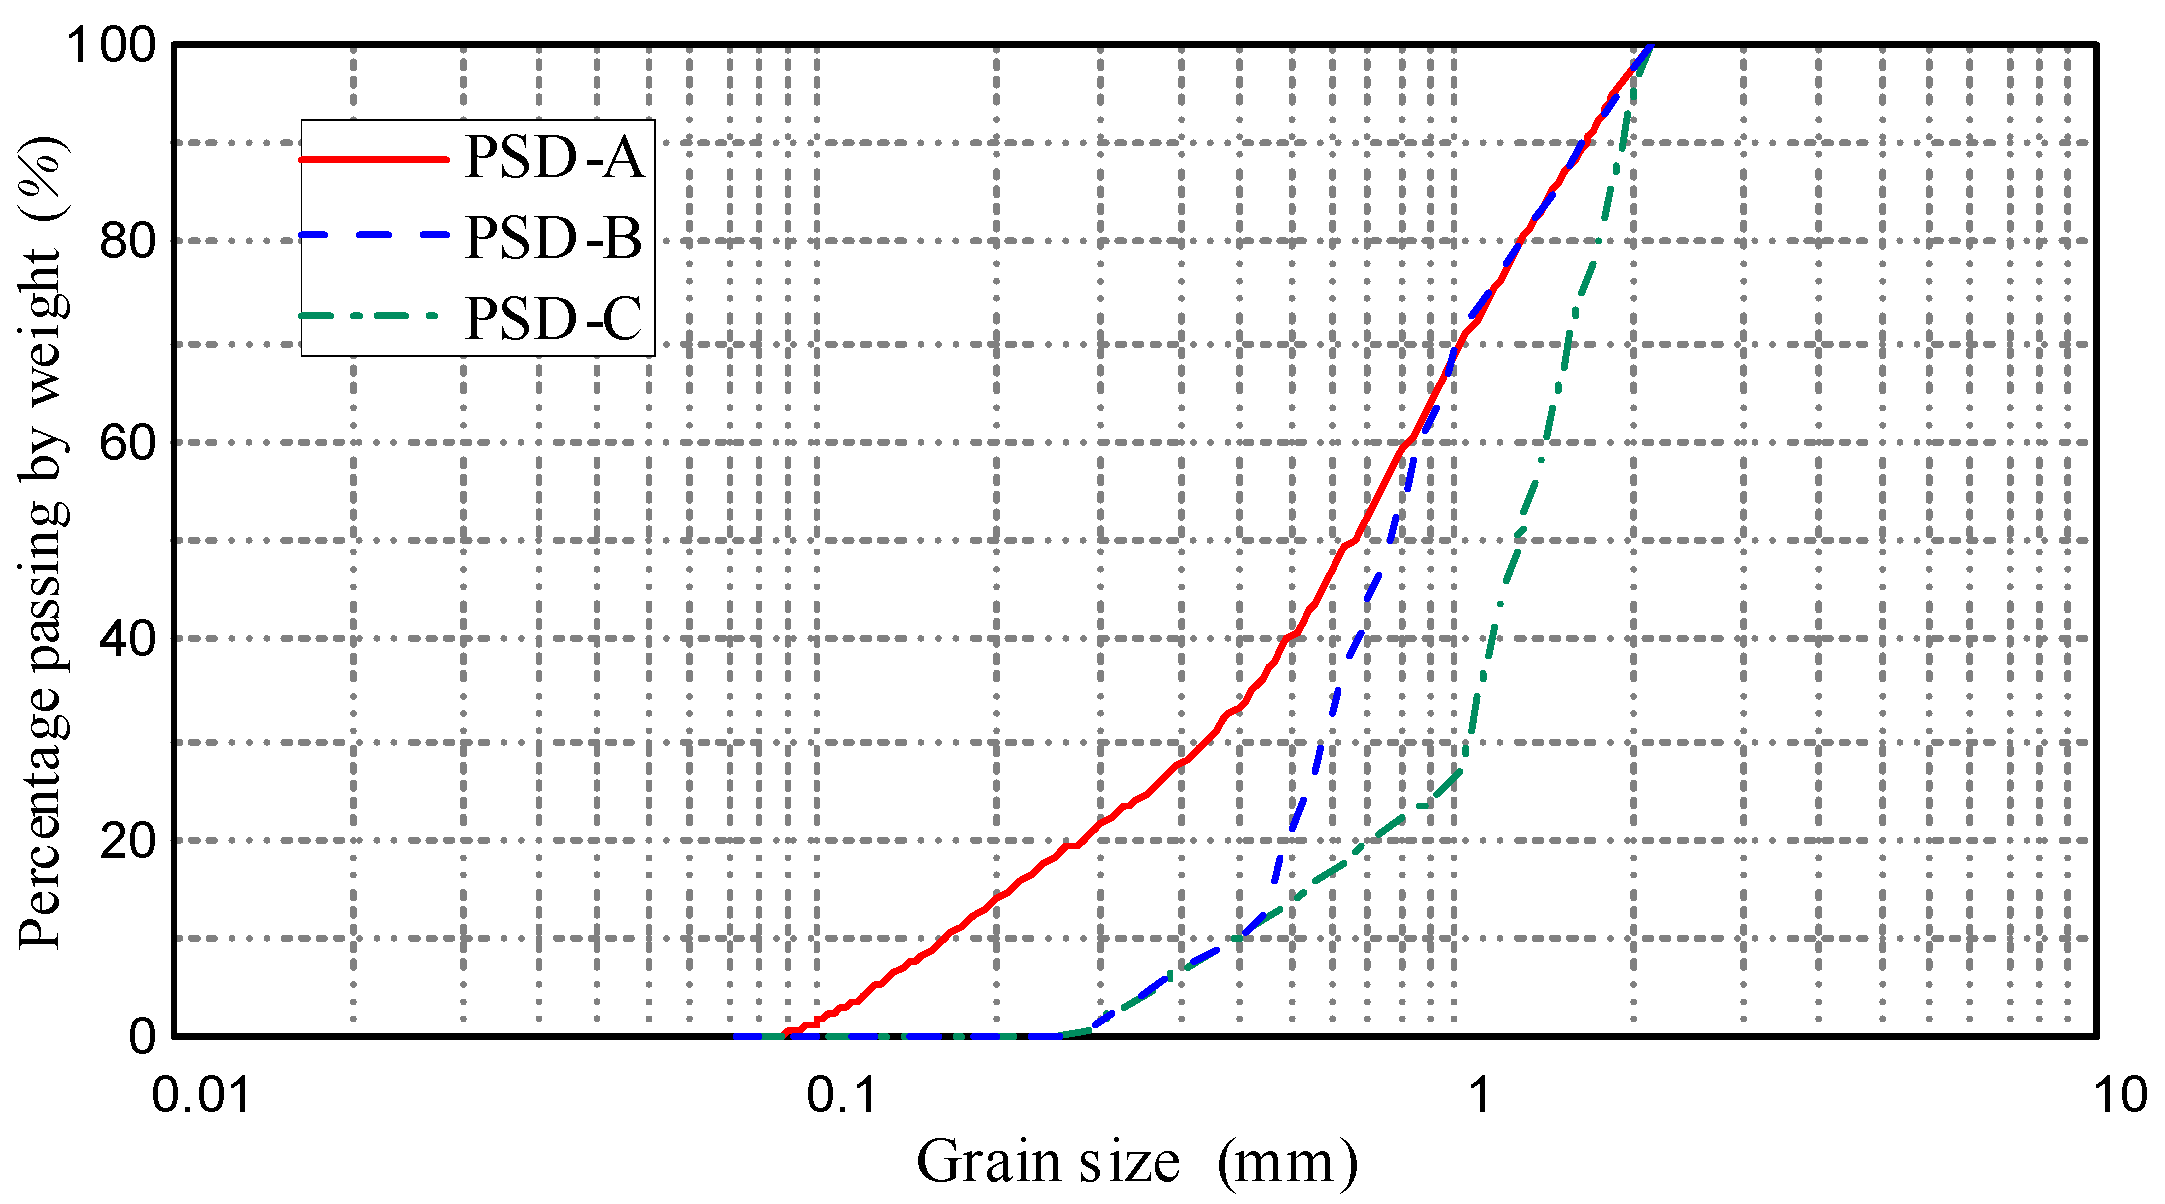
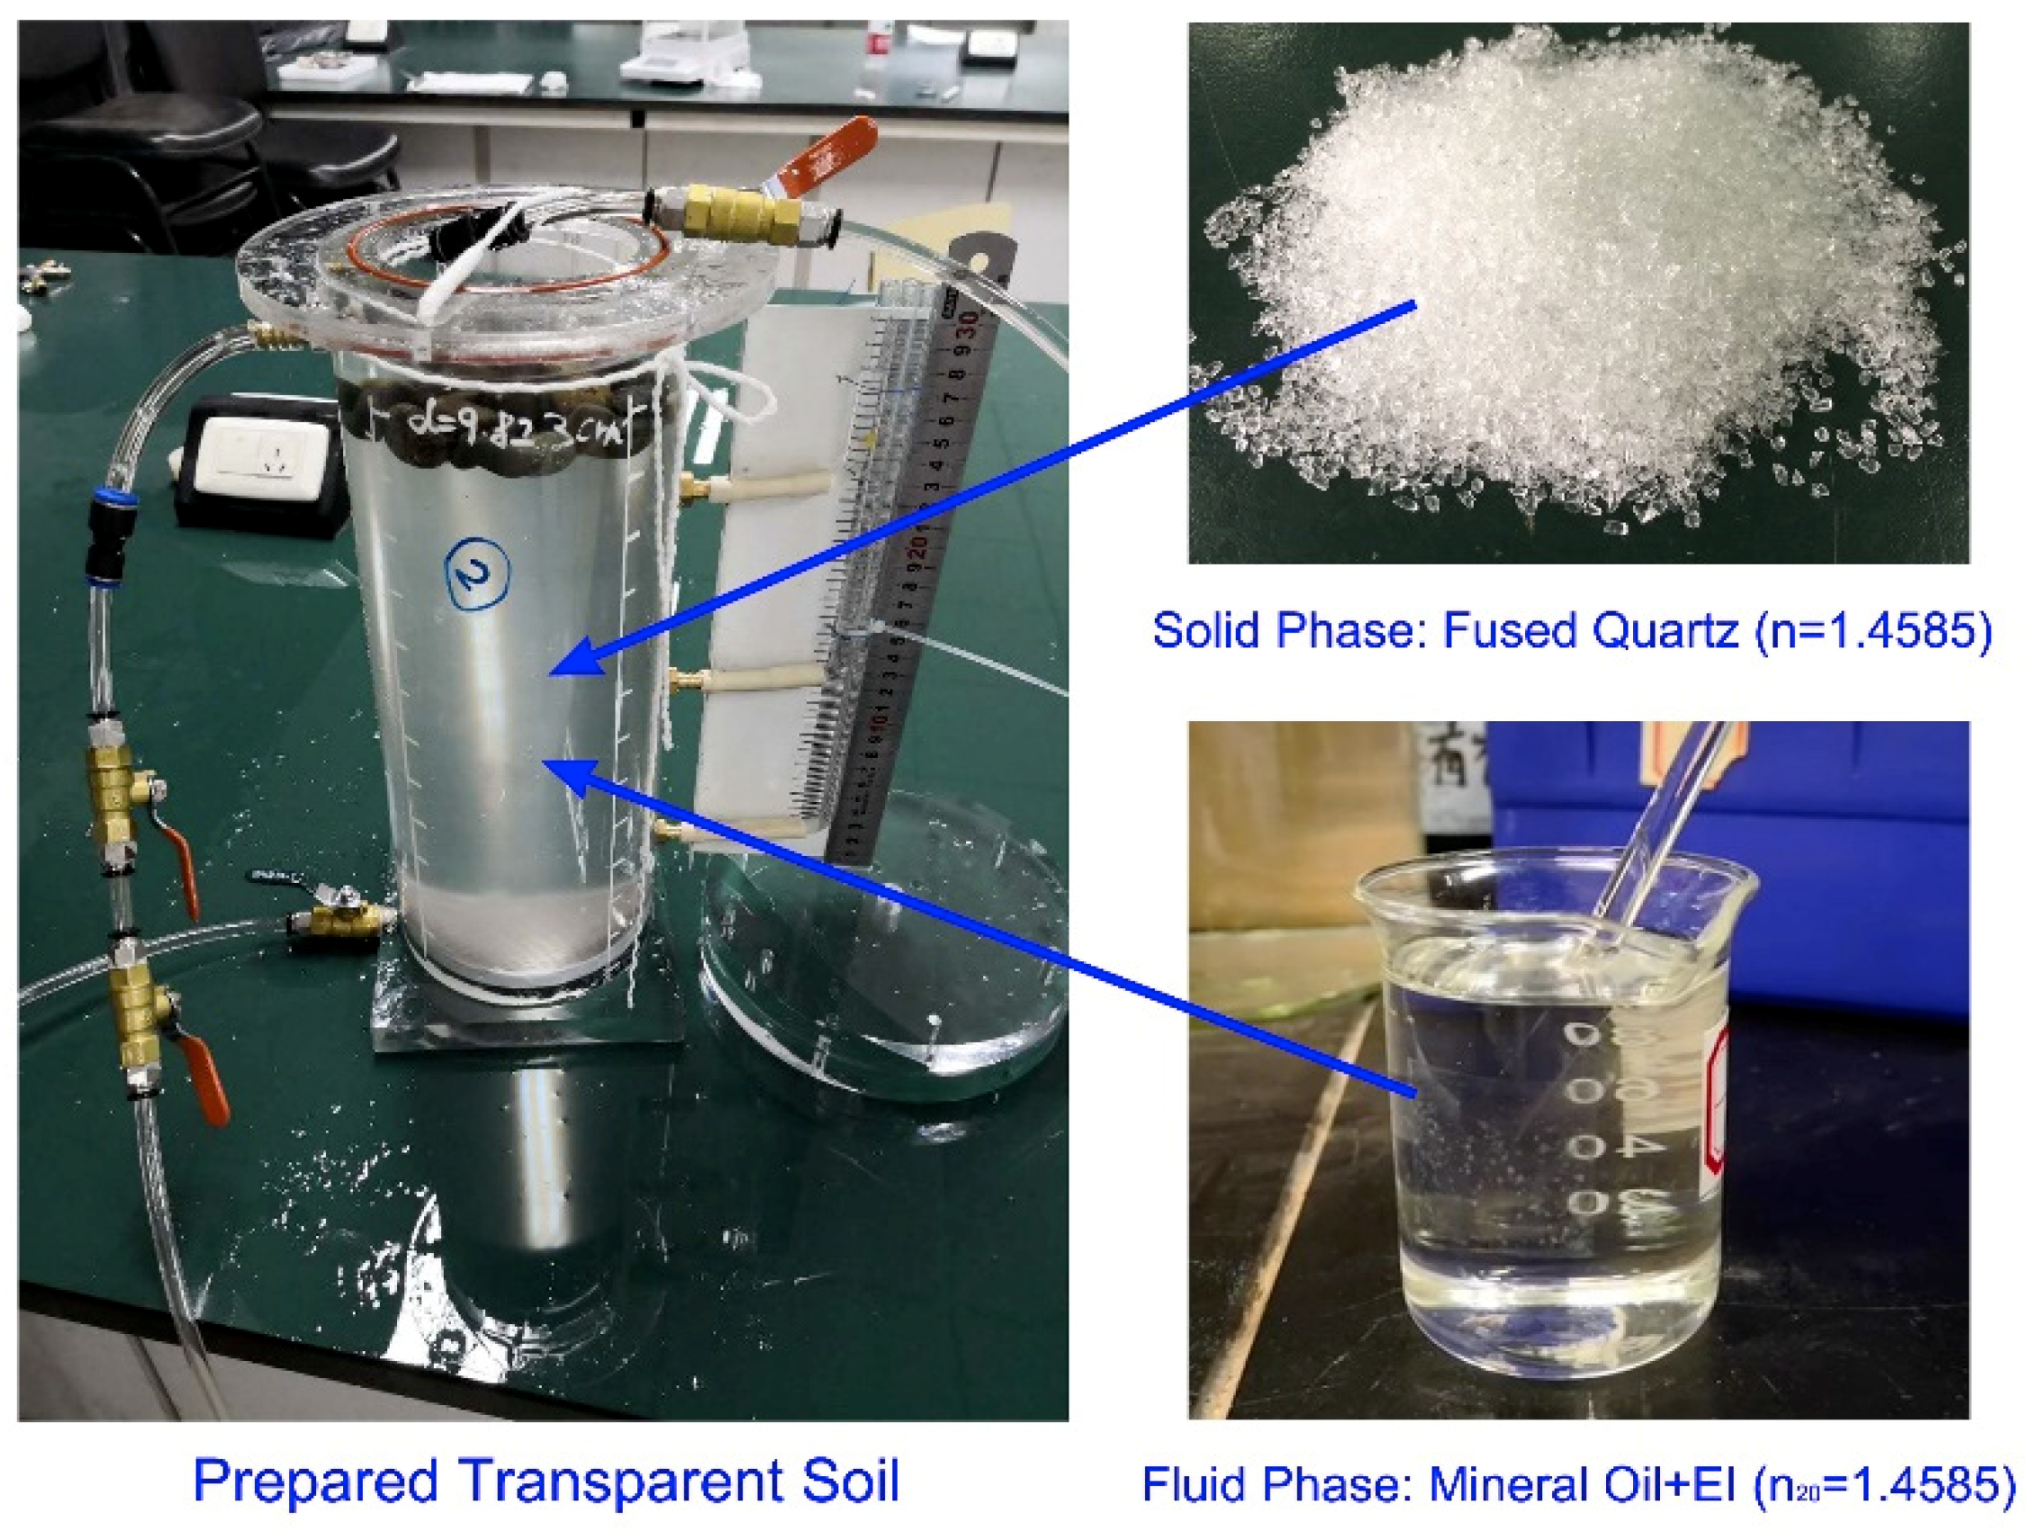
Standard Fujian sand (ISO 679: 2009) [27] is used as a natural soil in this experiment; this sand shows a well-graded particle size distribution (PSD-A) in Figure 1 with a uniformity coefficient greater than 5 and coefficient of gradation between 1–3 [28]. Fused quartz sand is selected as the solid phase of the transparent soil in this study; fused quartz sand is an excellent thermal- and chemical-stable medium with high purity of non-crystalline silicon dioxide (more than 99.97%). The fused quartz sand used in this study is manufactured by Xinyi Vanward Mining Co. (Xuzhou, China), with a refractive index of 1.4585. Although the fused quartz sand shows a different particle shape than that of Fujian sand, the mechanical properties, such as strength, dynamic elastic modulus, and damping ratio, are similar [17,29]. Therefore, fused quartz sand is a suitable replacement for the solid phase in transparent soil, compared with natural soils.
The seepage velocity of mixed oil in transparent soil is less than that of water in natural soil due to the increase in fluid kinematic viscosity. It is possible to compensate for the variation in seepage velocity by adjusting the particle size. In this experiment, two types of particle size distributions of fused quartz sands are used, illustrated as PSD-B and PSD-C in Figure 1. In this paper, dx denotes the soil particle size at which x percent is finer. For PSD-B, d10 in PSD-B is times that in PSD-A (11.4 refers to the ratio of the kinematic viscosity between the mixed oil and water), while the other part of particle size distribution in PSD-B remains consistent with that in PSD-A. d10 and d20 are both times than those in PSD-C. The detailed properties of these tested materials are listed in Table 1.
For the fluid phase of the transparent soil, fluid with the same refractive index can be created by mixing two oils, one with a high refractive index and one with a low refractive index [30]. A mixture of 15# mineral oil and EI solvent oil (a kind of aliphatic hydrocarbon mixture) [31] was used in this experiment. In particular, Shell 15# mineral oil and TEACSOL EI solvent were used. As an environmentally friendly and low-cost material with good transparency, this mixture is suitable for transparent soil hydraulic testing. The refractive index of this mixed fluid can be estimated using the Arago–Biot equation [32]:
The targeting refractive index of the mixed oil for the transparent soil in this experiment is 1.4585 at 20 °C, while the refractive index of mineral oil and EI are 1.4673 and 1.4400 at 20 °C, respectively. From Equation (1), the volume fraction of mineral oil can be calculated as 0.68. In this experiment, the refractive index is tested using an Abbe refractometer and a circulating water bath.
2.2. Experimental Setup
An experimental setup was designed and constructed based on ASTM D2434-68 (2006) [33], as shown in Figure 2, which can be used to conduct the constant water head test for transparent and natural soils. A Plexiglas cylinder with a height of 320 mm and a diameter of 100 mm was used to fill the sample. A sealing rubber ring with reinforcement screws was placed at the top of this setup, which can be used to ensure the saturation of the tested sample by a vacuum tube. A porous aluminum disk covering a metal mesh with an aperture of 0.074 mm was placed at the bottom of the cylinder to prevent the loss of soil particles. The inflow tube of this setup was connected with an upstream liquid tank to maintain a continuous water supply, while a beaker was used to measure the outflow volume.
2.3. Preparation of the Tested Samples
The samples were prepared layer by layer (25 mm for each layer) to control the void ratio. The weight of the dry sand required for each layer was calculated based on the specific gravity of the sand and the desired porosity. The dry sand of each layer was placed in a bowl filled with enough fluid and stirred to remove air bubbles. The permeameter was initially filled with a layer of fluid approximately 2.5 cm high. Then, the sand from each bowl was added into the fluid by a teaspoon with the head bent at 90° as slowly as possible to avoid air bubbles [34]. A wooden hammer was used to slightly compact the sand sample to the desired 25 mm height. In this experiment, each sample was prepared with 11 layers. After that, each sample was vacuumed at −0.1 MPa for over 2 h while the cylinder was sealed by blocking the manometer tubes and sealing the top plate. Finally, a 20 mm-thick gravel layer was placed at the sample top as a protective layer. The prepared sample of transparent soil following the procedure is shown in Figure 3.
2.4. Experimental Procedure and Program
The experimental program is listed in Table 2 and designed to investigate the effect of the sand particle size, particle size distribution, pore morphology, and void ratio on the permeability of the natural soil and into the fluid proposed transparent soil.
For each test, the constant water head was controlled by an upstream tank with overflow, and the total water head was adjusted by the distance between the inflow tube and the outlet. After placing the saturated sample into the permeameter, a stable water head was controlled and maintained. The outflow rate was determined using a beaker and a stopwatch. During each test, the inflow and outflow fluid temperatures were measured to ensure a consistent temperature condition. Each sample was tested under four different hydraulic gradients ranging from 0.1 to 1.1.
3. Results and Discussions
3.1. Permeability of the Proposed Transparent Soil
Considering Darcy’s law, the water flow through soils is proportional to the hydraulic gradient, and the proportional coefficient is defined as the soil permeability. Specifically, permeability is a combined parameter controlled by the intrinsic permeability of the solid phase and properties of the fluid phase, whereas the fluid velocity is inversely proportional to the fluid kinematic viscosity. Therefore, Darcy’s law can be expressed as
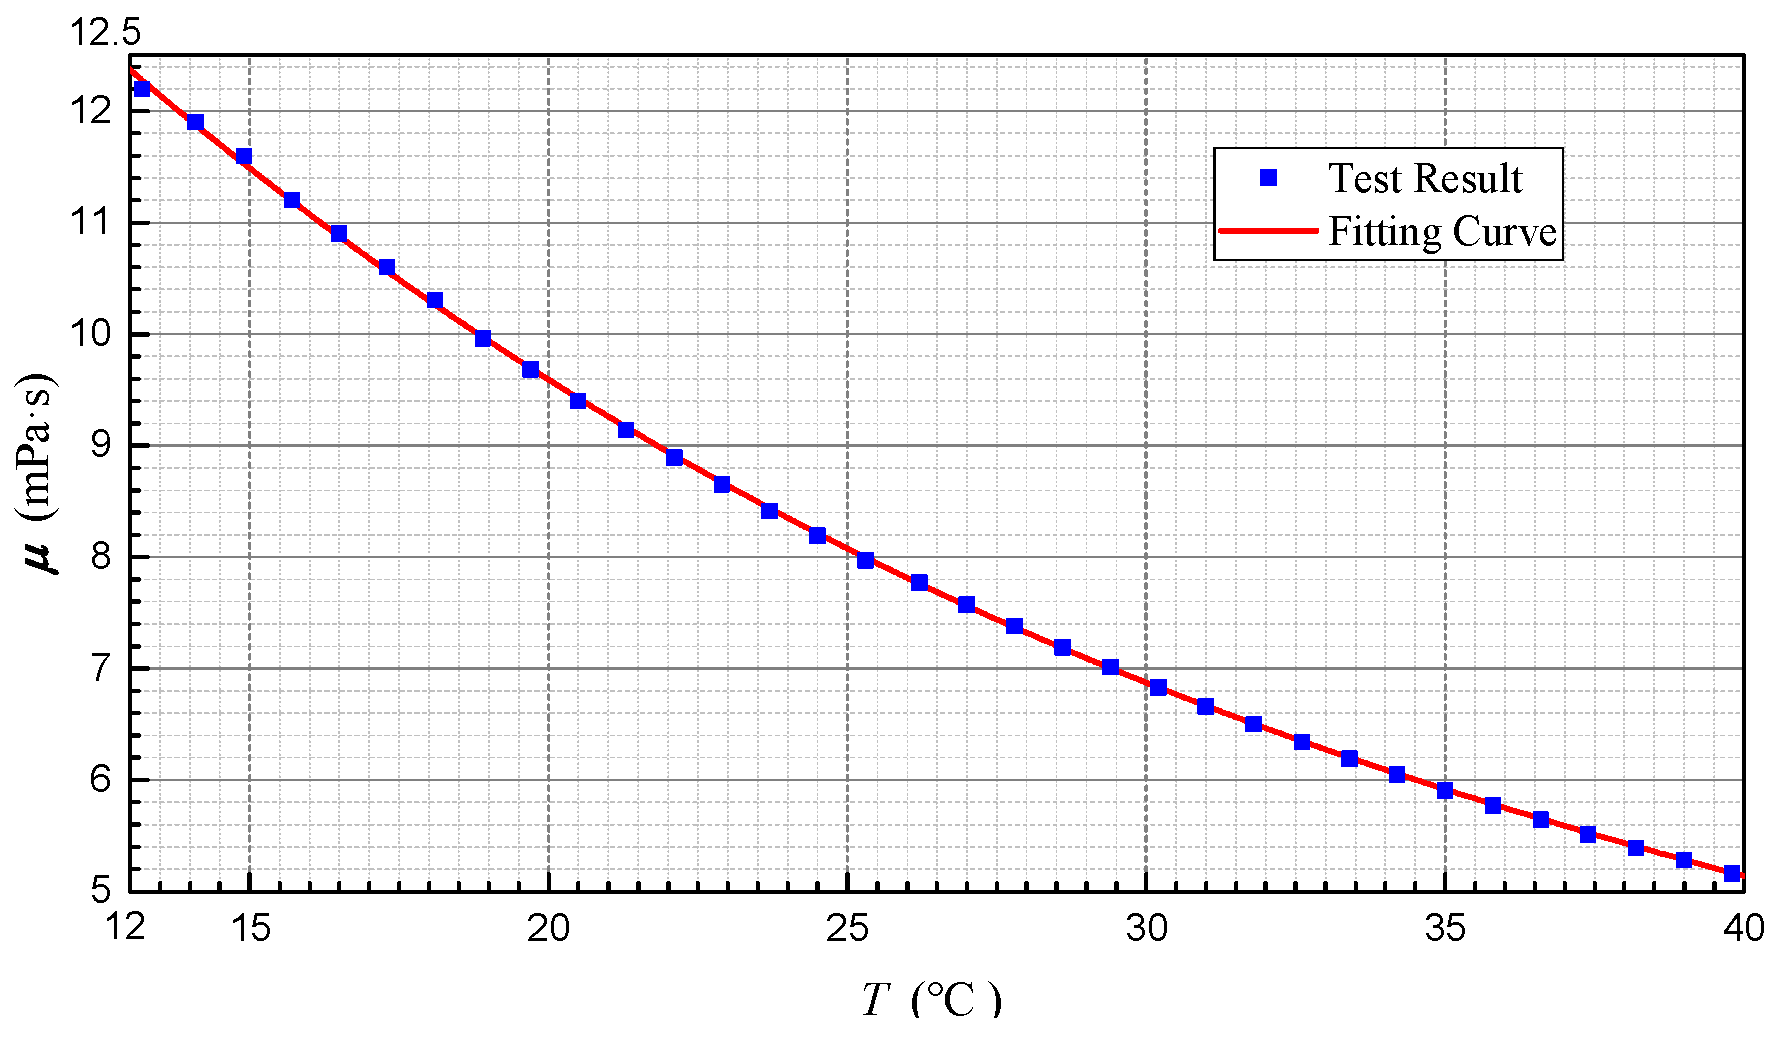
Due to the effect of temperature on the fluid kinematic viscosity, the pore fluid velocity is different at different temperatures. Based on Equation (2), the permeability is inversely proportional to the fluid kinematic viscosity. From the results of previous studies, water kinematic viscosity is known, and its variation with temperature is not significant. For transparent soil, the relationship between the kinematic viscosity and temperature of mixed oil is not clear. The MCR302 rotational rheometer (Anton Paar, Graz, Austria) was used to measure the fluid dynamic viscosity at different temperatures, as shown in Figure 4. Therefore, the fluid dynamic viscosity at different temperatures can be estimated using the polynomial fitting of Equation (3).
μ = −0.8966T3 + 129.9T2 − 7509T + 201300 (×10−6 g/(cm·s))
From Equation (3), the mixed oil dynamic viscosity at 20 °C (μ20) is determined to be 9.5846 × 10⁻² g/(cm·s).
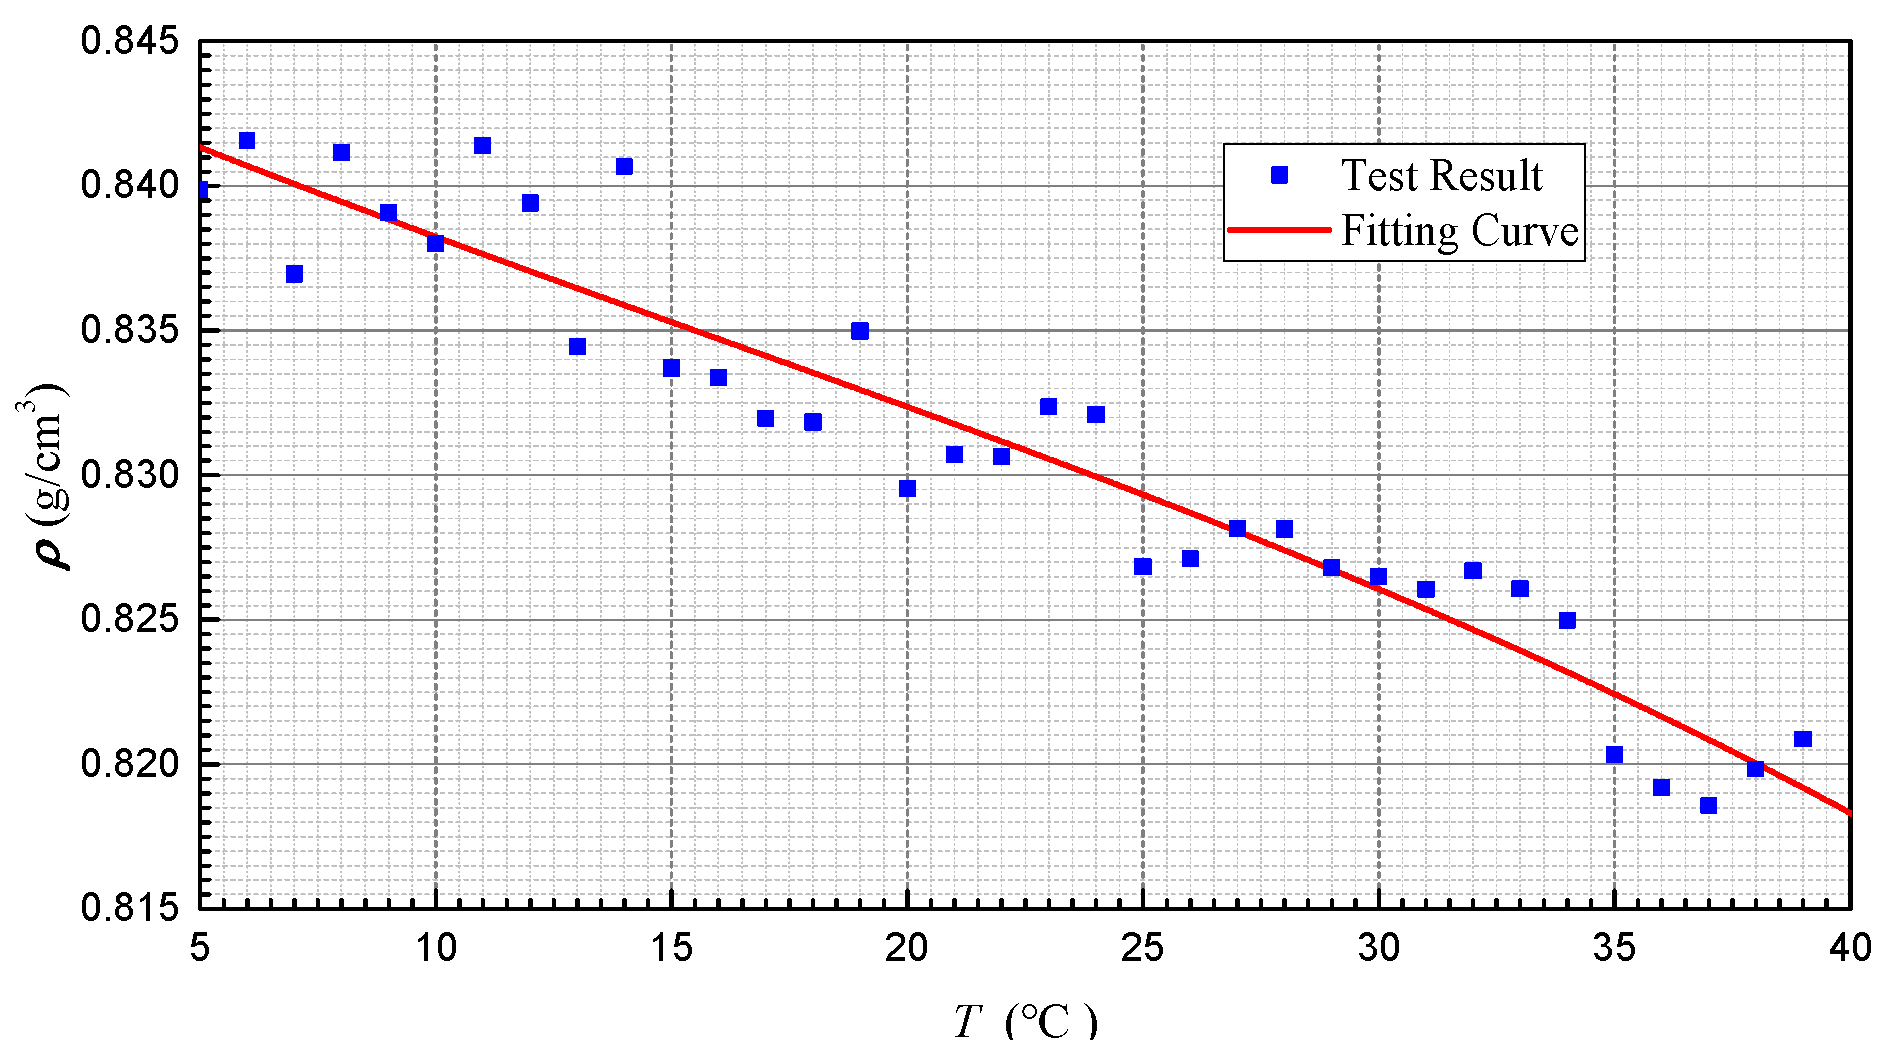
In addition, the density of mixed oil can be measured using the pycnometer method, as shown in Figure 5. The fitting equation of fluid density at various temperatures can be expressed as
μ = −0.8966T3 + 129.9T2 − 7509T + 201300 (×10−6 g/cm3)
From Equation (4), the fluid density at 20 °C (ρ20) is determined to be 0.8323 g/cm3. The kinematic viscosity of a fluid is defined as the ratio between the dynamic viscosity and density, which is 11.6 × 10⁻² cm2/s at 20 °C (η20) for this proposed mixed oil, which is 11.4 times that of water.
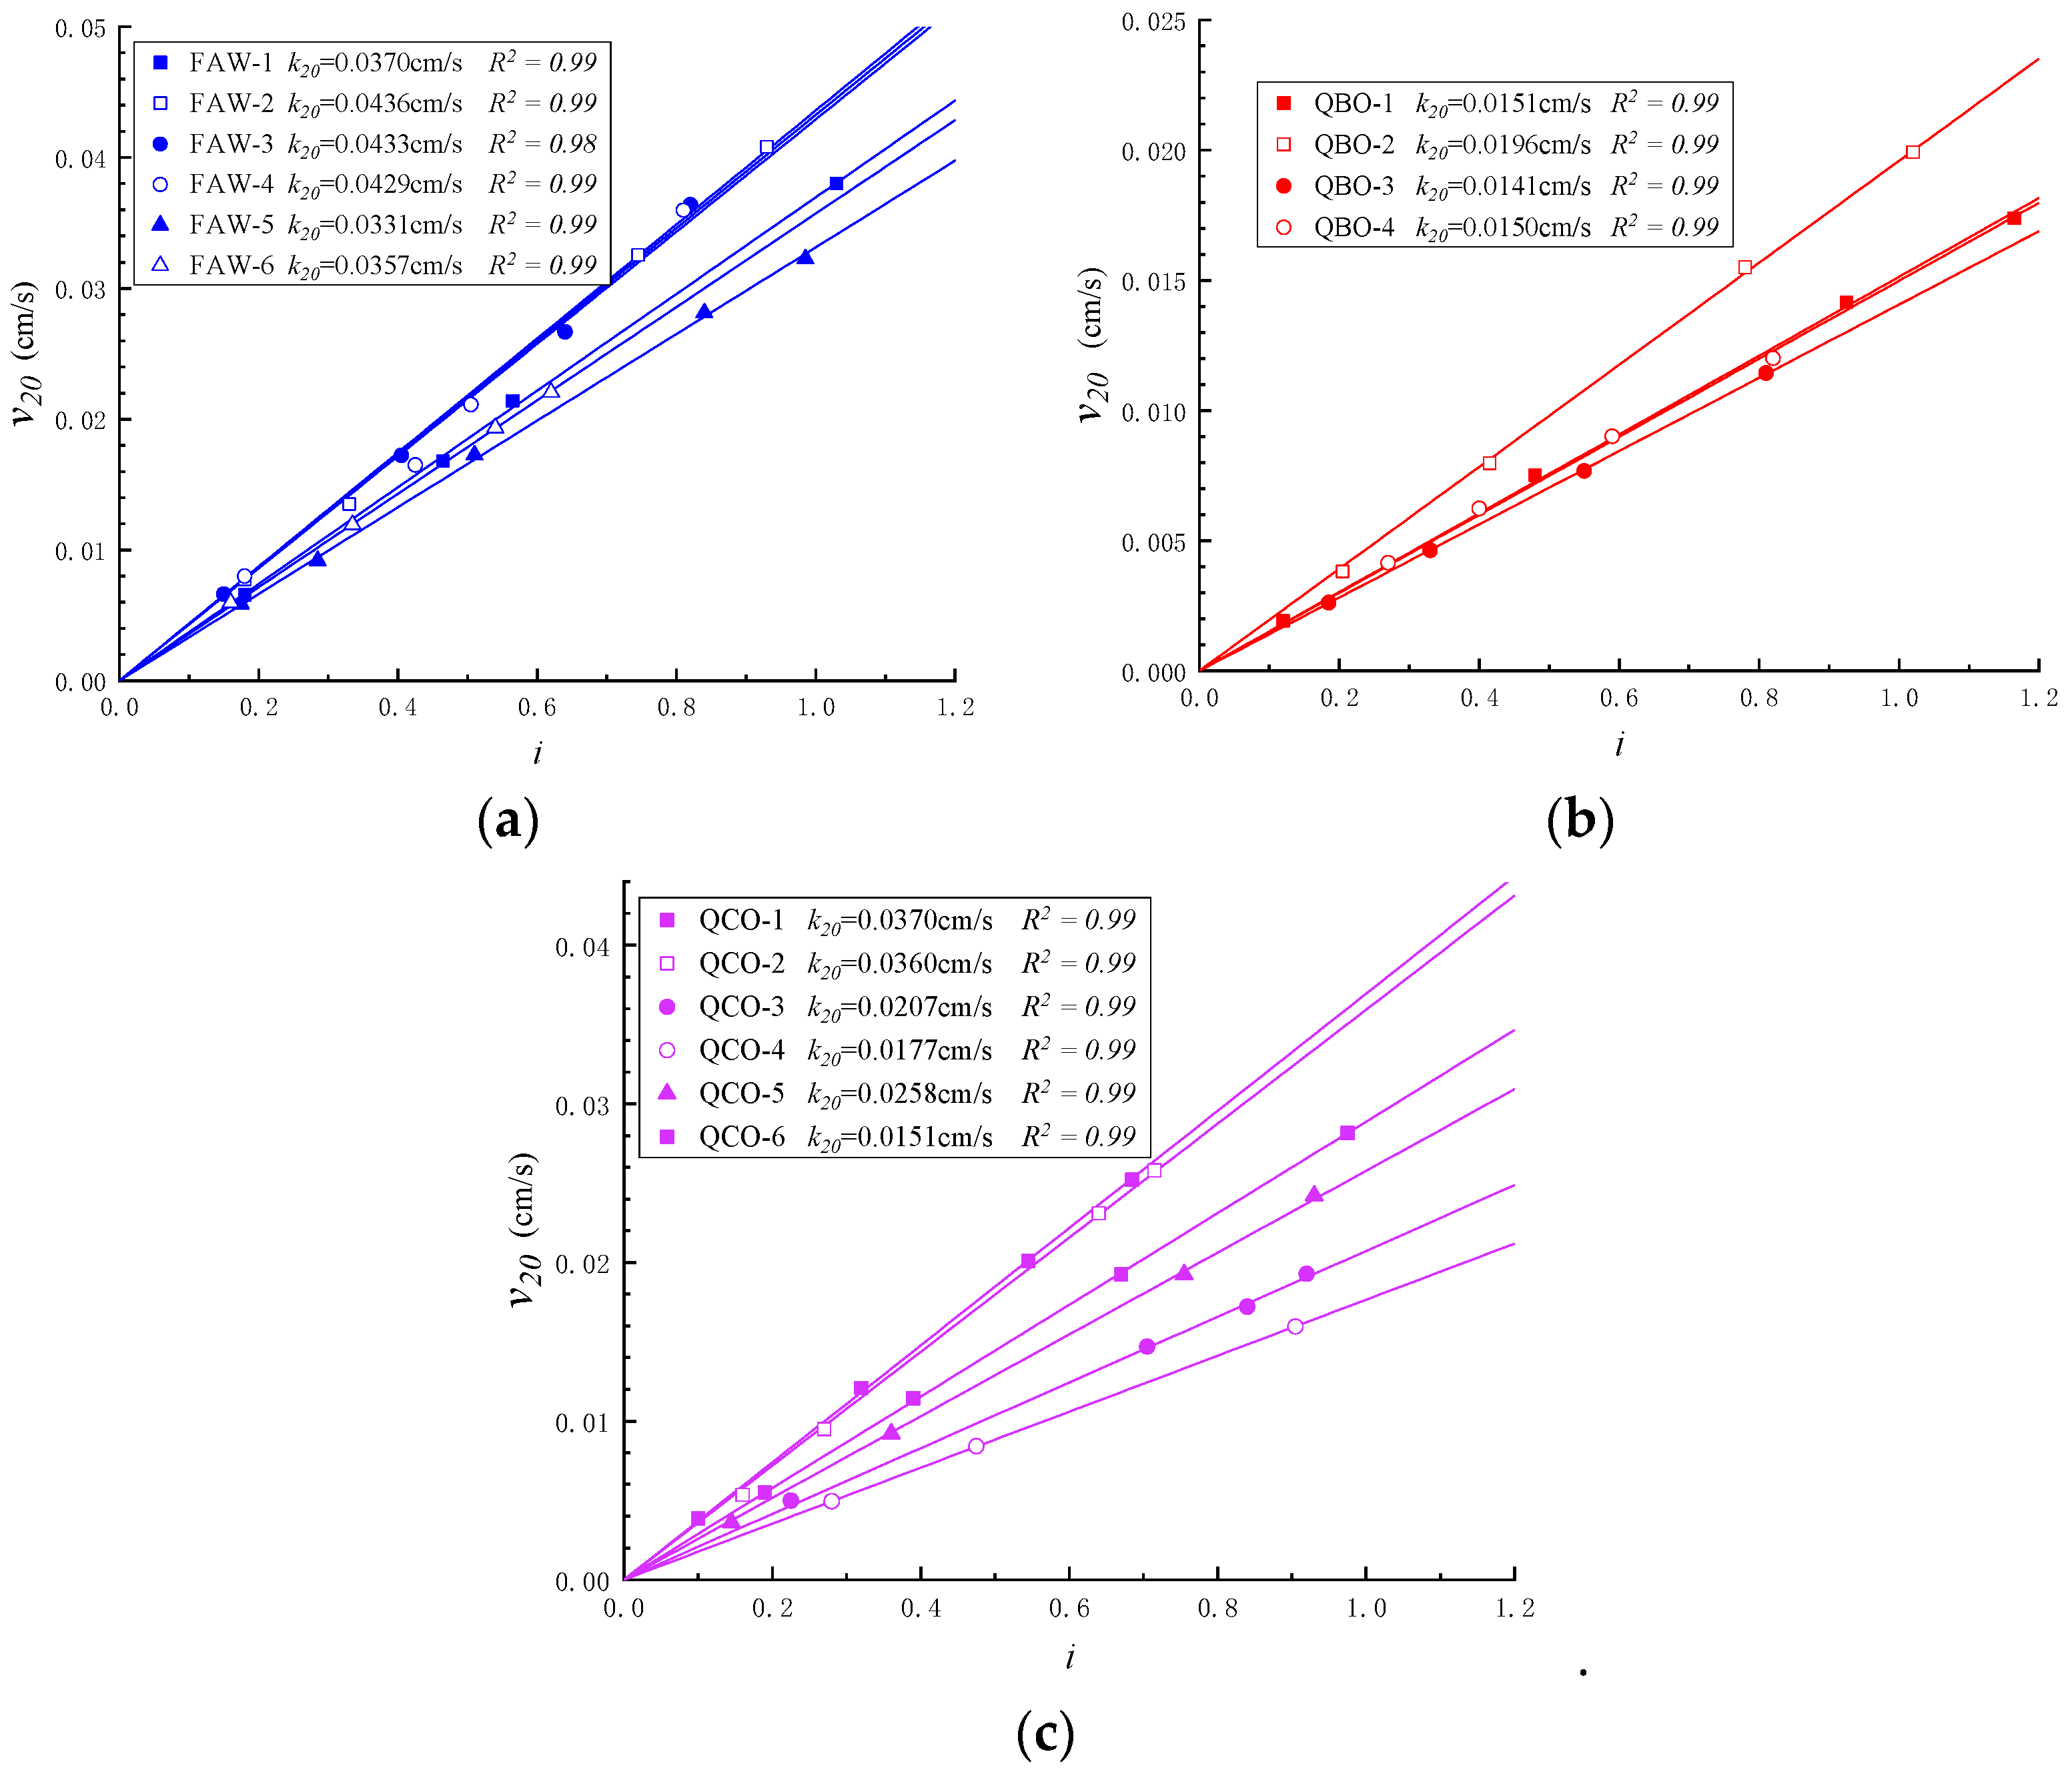
From this experiment, the measured fluid velocity at 20 °C (v20) for various hydraulic gradients can be plotted in Figure 6. The particle Reynolds number in this study ranges from 9.6 × 10⁻¹⁰ to 3.1 × 10⁻⁷, which indicates the validity of Darcy’s law [35]. Therefore, the permeability of different materials can be determined from the slopes of these linear fittings, as shown in Figure 6.
3.2. Effect of the Void Ratio on the Transparent Soil Permeability
Previous studies suggest that the soil permeability is affected by the soil void ratio, particle size, particle size distribution, and pore morphology. Therefore, Darcy’s law can be expressed as
The quantitative effects of these factors on soil permeability will be evaluated based on experiments, and the particular effects introduced by the transparent soil will also be investigated.
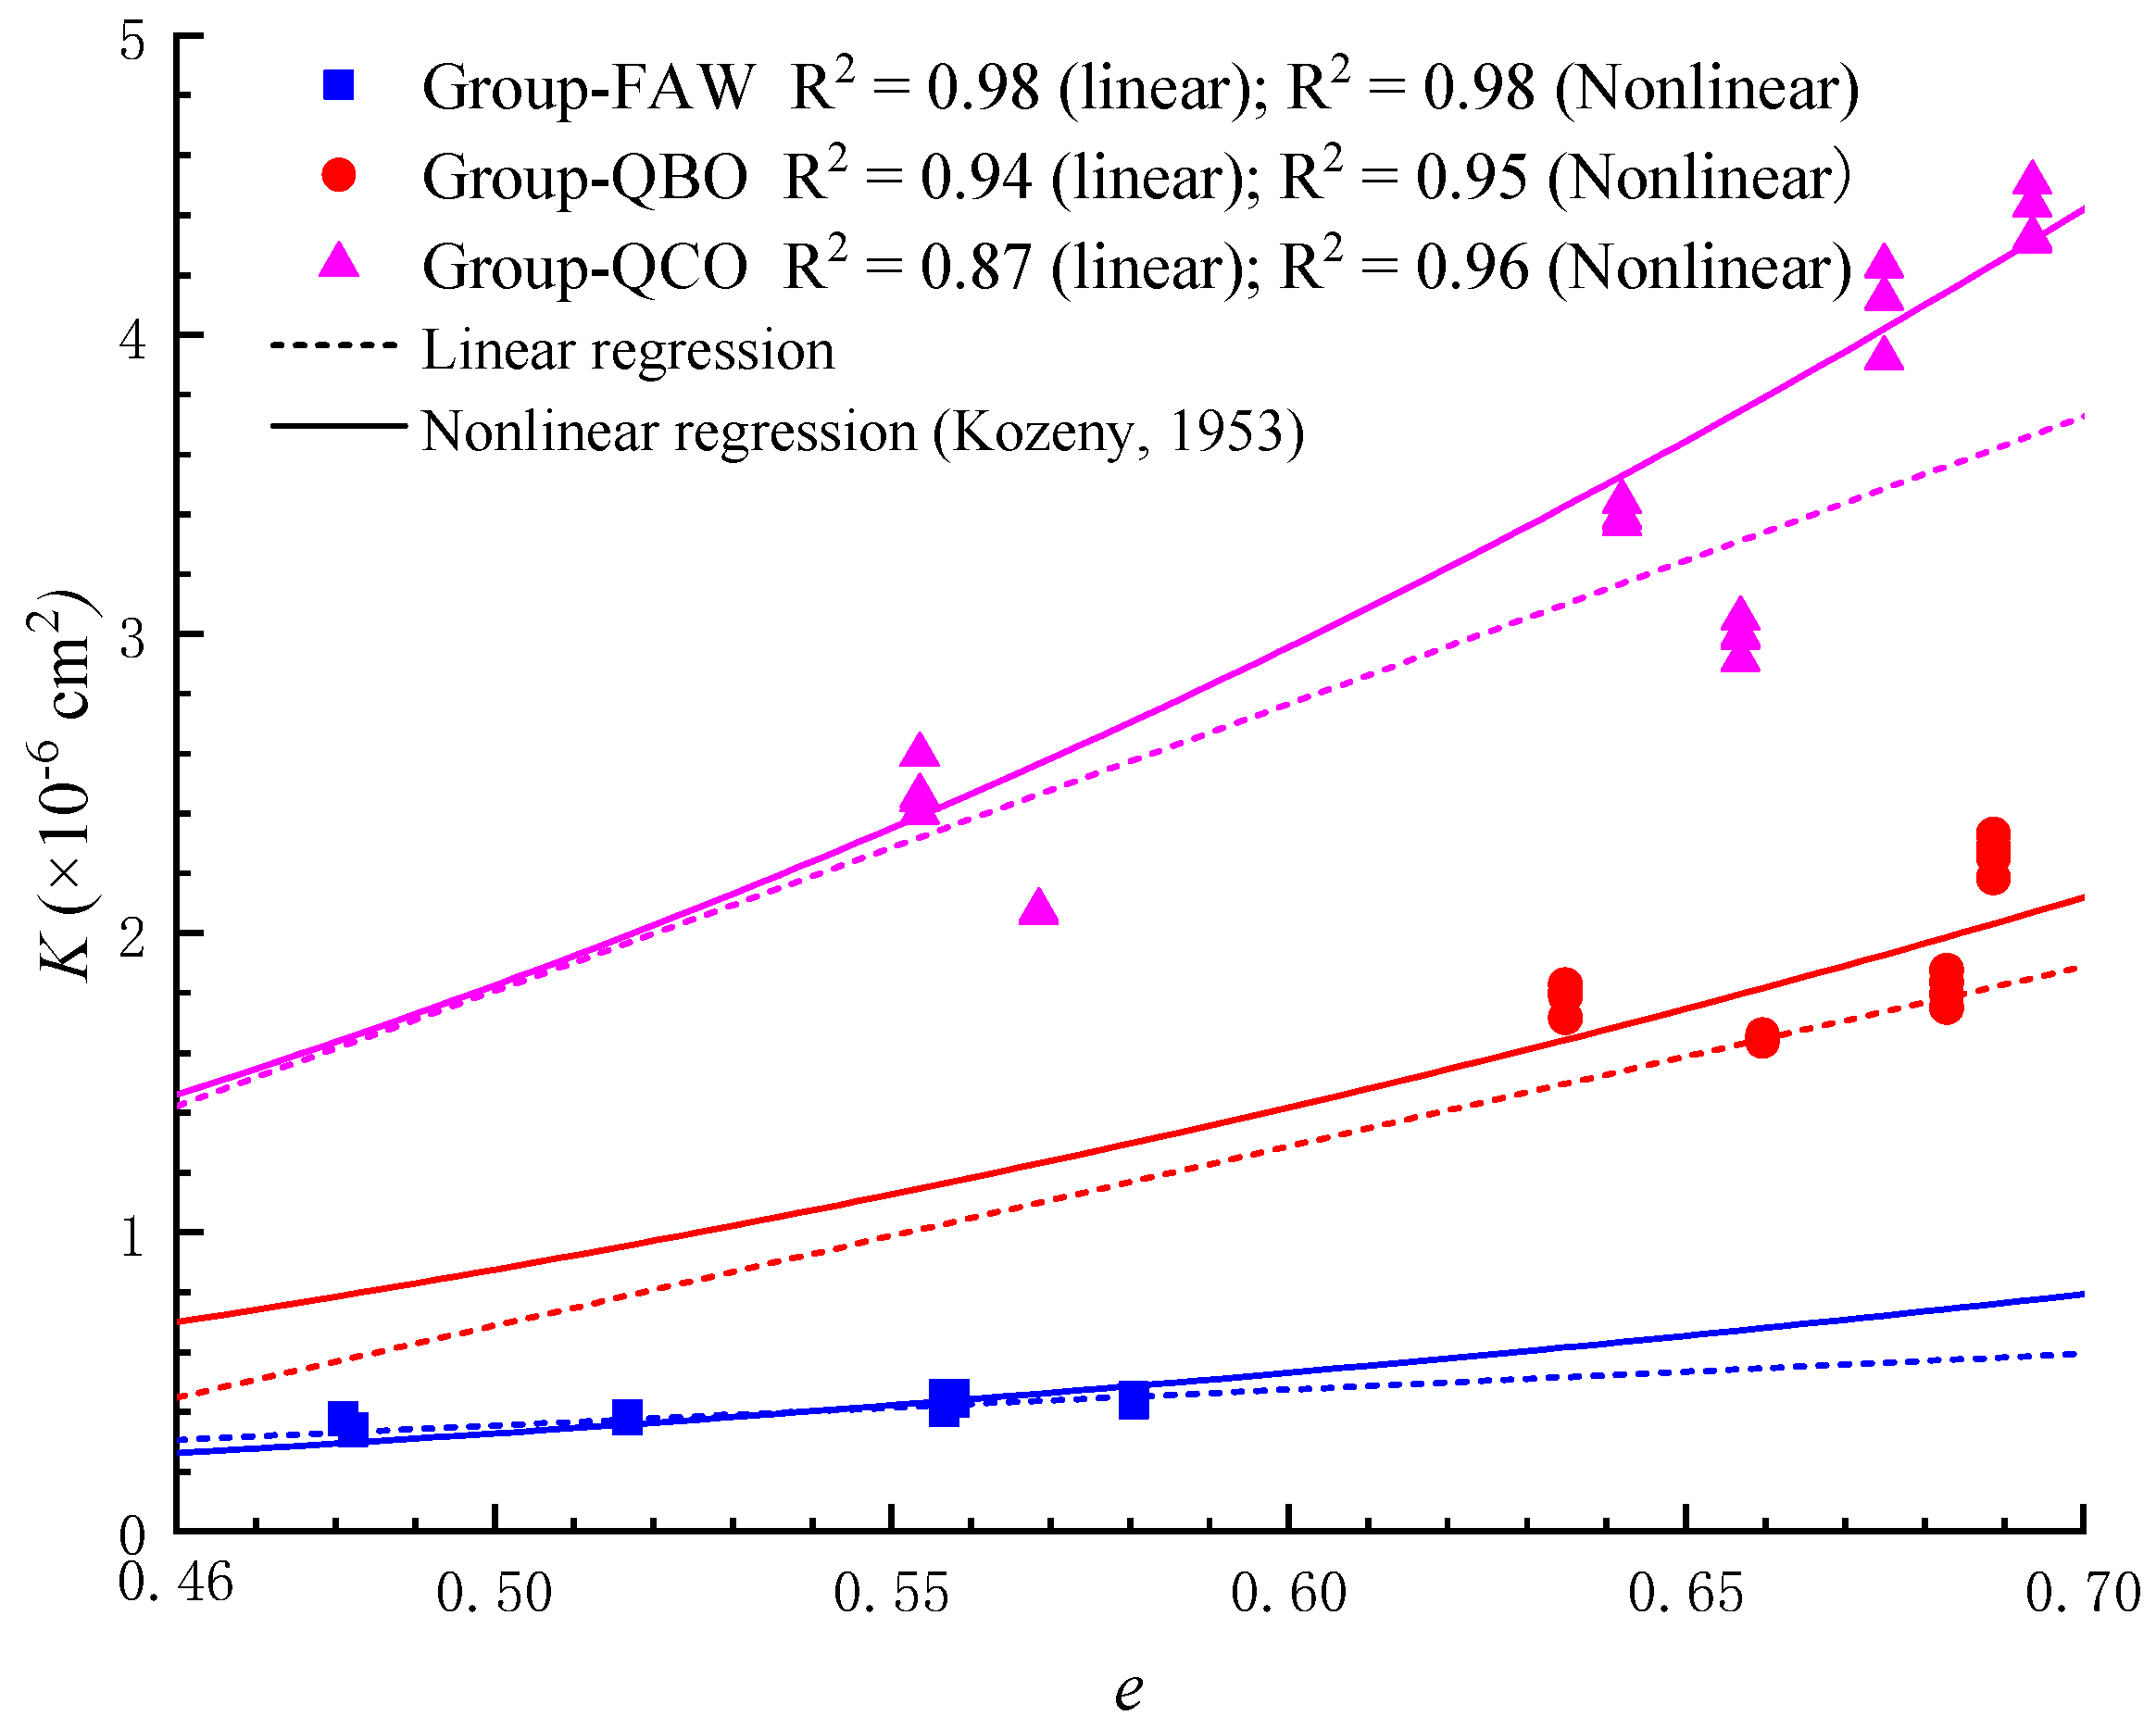
The variation in soil permeability with different void ratios is shown in Figure 7. As the soil void ratio increases, the permeability increases due to the expansion of the flow channel. Additionally, the relationship between soil permeability and void ratio shows nonlinear characteristics, which is consistent with previous studies [25,36,37,38,39]. Based on the assumption made by the Kozeny–Carman model [22,25], the seepage paths through the soil can be simplified as many tortuous Poiseuille capillaries with a specific cross-sectional shape. The diameter of the capillaries can be determined by the characteristic geometrical parameters of the soil particles using the hydraulic radius, which is equal to the ratio of the pore volume to the total area of the soil. After that, the soil permeability can be expressed as
where D is the specific surface area of the particles; for a spherical particle, D equals 6/d. If the particles are assumed to be uniformly sized spheres, Equation (6) can be rewritten as
From Equation (7), fe is , and the solid fitting line in Figure 7 agrees well with the experimental results.
3.3. Effect of the Particle Size on the Transparent Soil Permeability
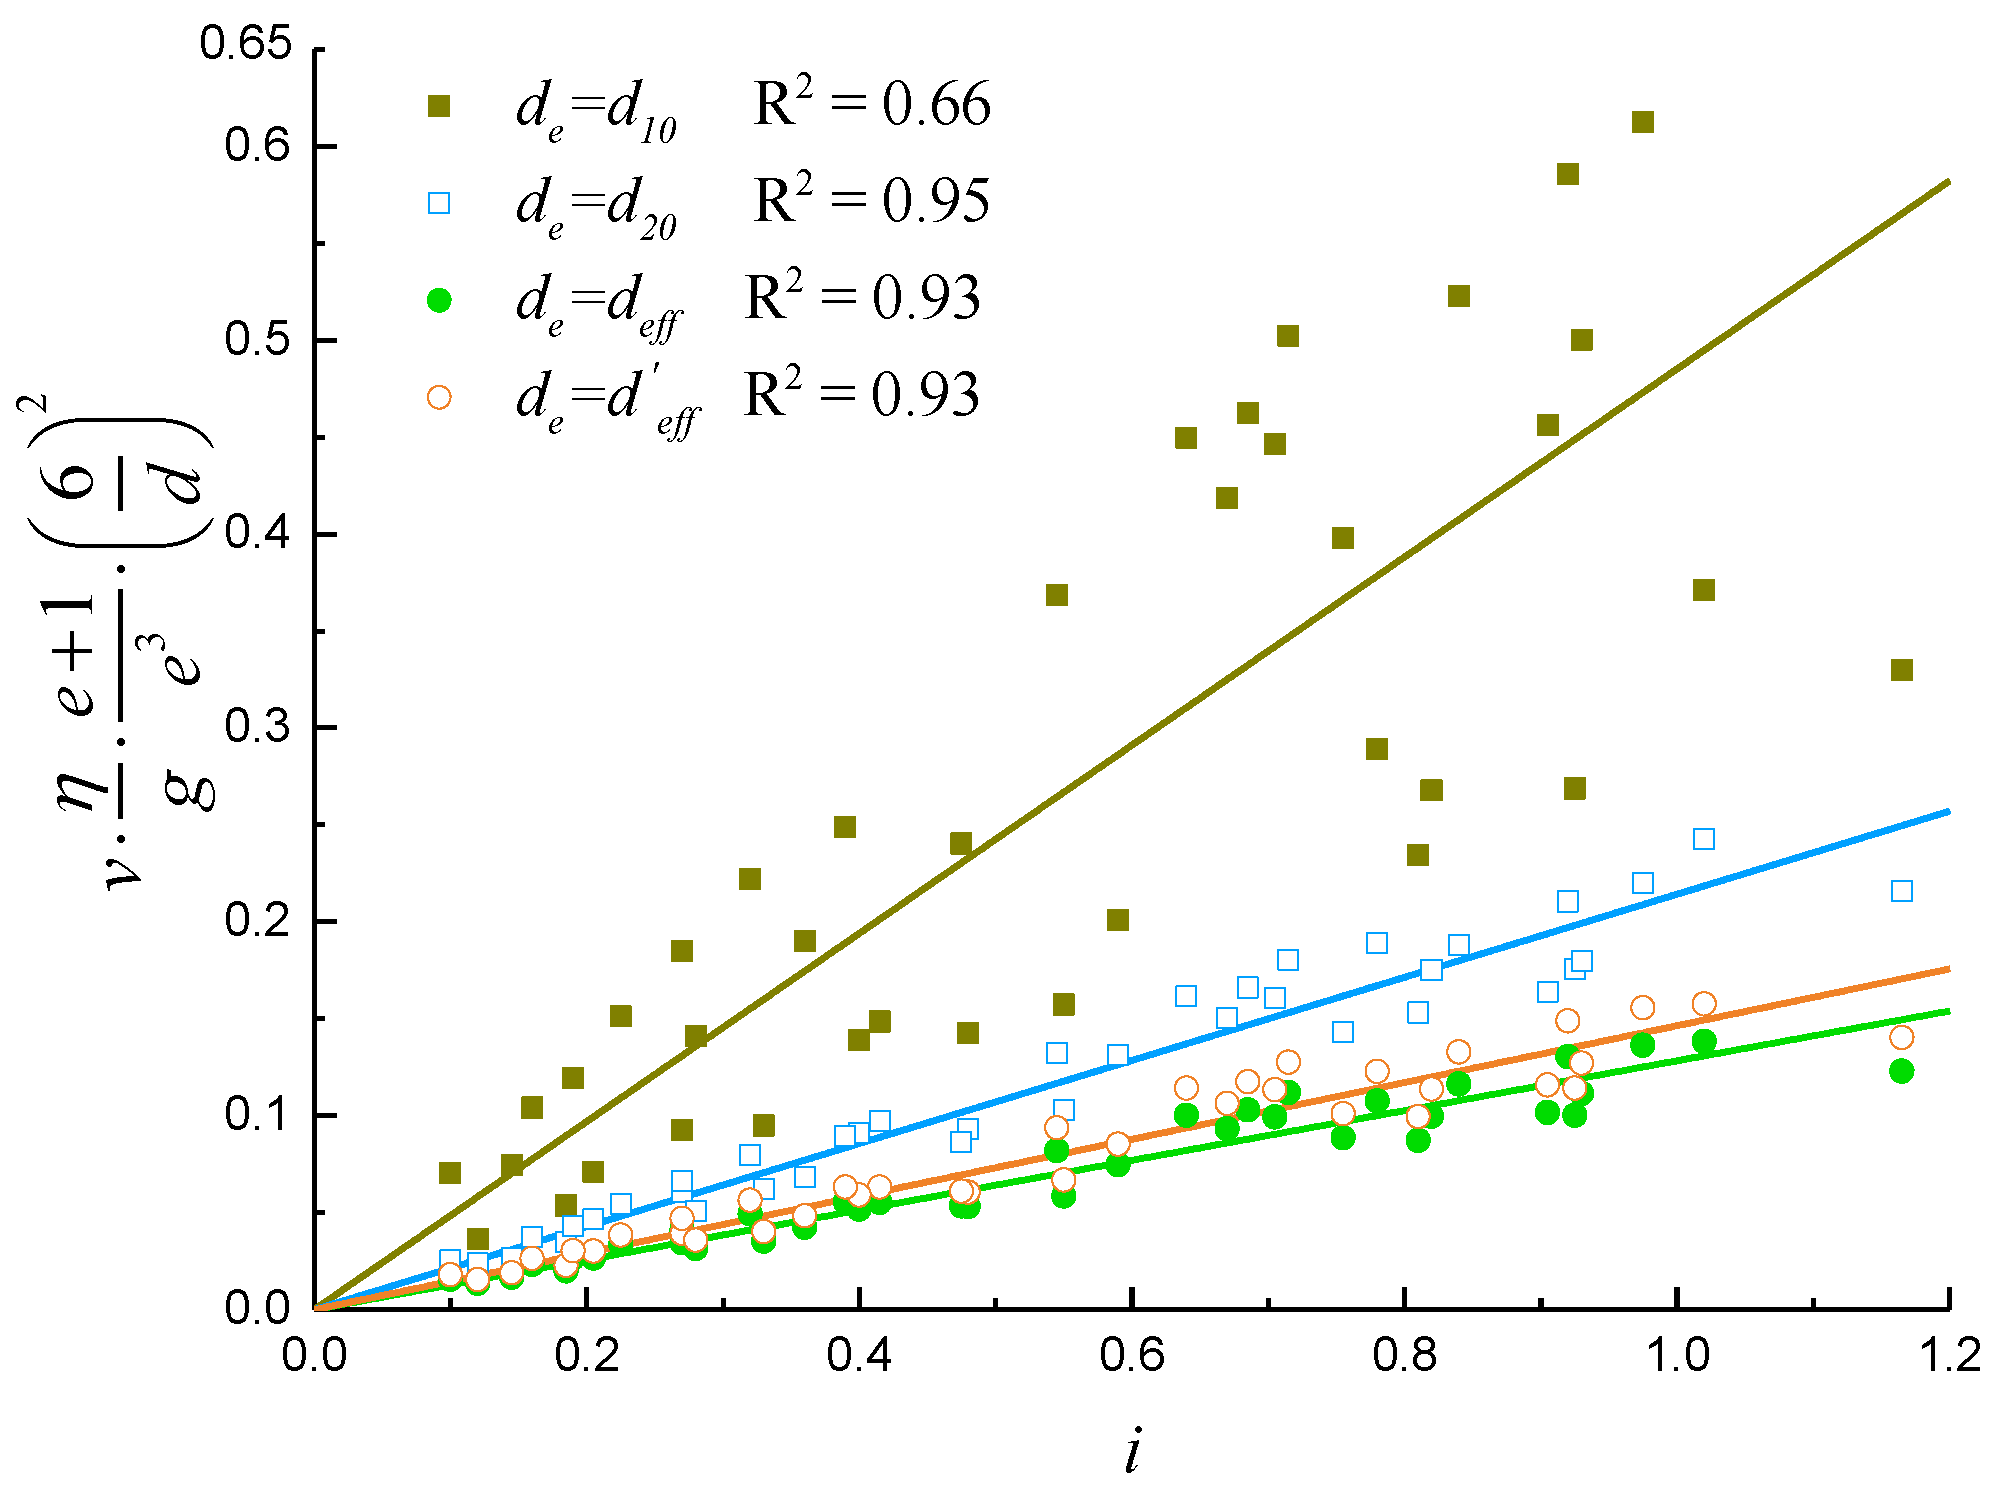
For the uniformly sized spherical particles, fd can be taken as 1/D2 = (d/6)2. For the soil with a particle size distribution, d can be replaced by the effective particle size de. In previous studies, various models have been proposed to determine the effective particle size. Hazen [36] stated that the soil permeability is controlled by the small particles and proposed d10 as an effective particle size. The USBR (United States Bureau of Reclamation) and IWHR (Chinese Institute of Water Resources and Hydropower Research) suggested that d20 equals de. Sperry [23] proposed a statistical method from the measurements of sieve sorting and suggested deff = 1/{∑[fi/(dli0.5 × dsi0.5)]}. A modified formula for the determination of effective particle size was proposed by Carrier [24]: deff’ = 1/{∑[fi/(dli0.405 × dsi0.595)]}.
Figure 8 shows the relationship between the normalized fluid velocity (normalized by the known fluid, void ratio, and particle size factors) and the hydraulic gradient. From the correlation coefficient in Figure 8, the linear fitting with an effective particle size of d10 shows a significant deviation with the experimental measurement. On the other hand, the linear regressions using the effective particle sizes by Sperry [23] and Carrier [24] agree well with experimental measurements, and the correlation coefficient is greater than 0.9. For the tested material in this experiment, the linear fitting can lead to a minimum deviation with an R2 of 0.95 if d20 is used as the effective particle size. Therefore, the effective particle size capturing the soil permeability is not the mean particle size, and the small particles play an essential role in the pore fluid flow.
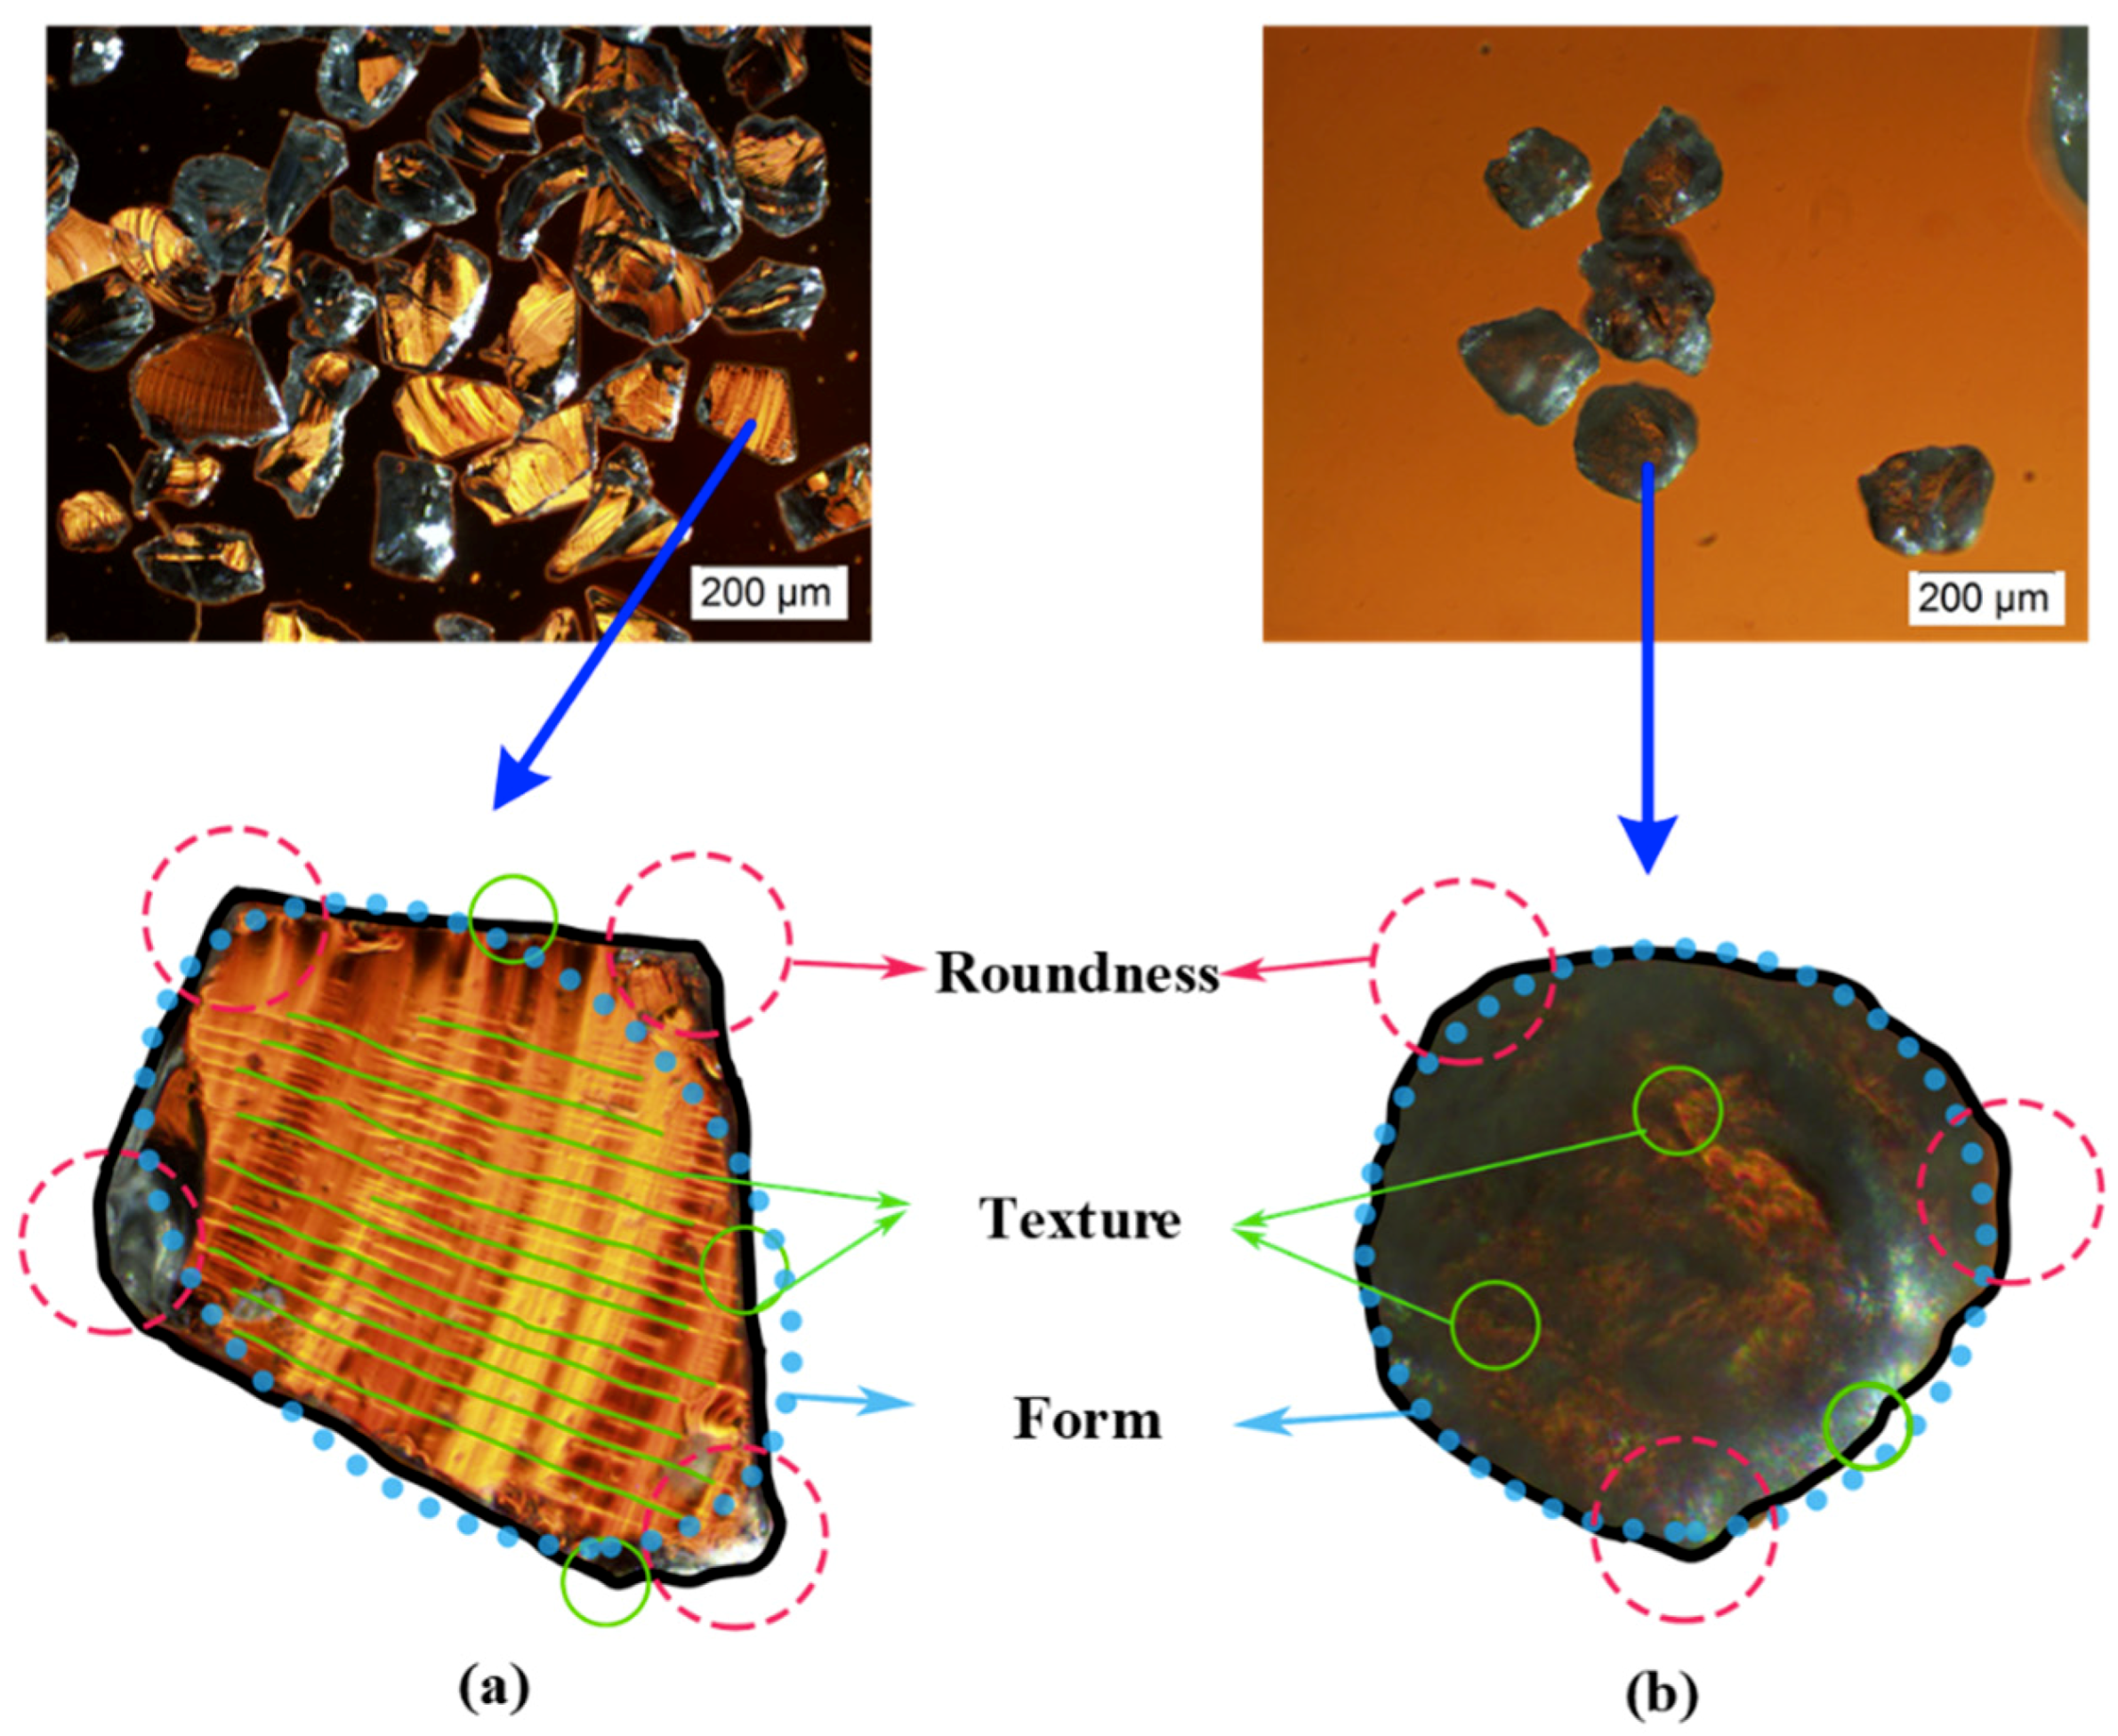
The effect of particle size can be considered by introducing the effective particle size, while different soil particles show various particle shapes and textures from the electron microscope images in Figure 9.
To effectively describe and quantify this difference, particle shape can be evaluated using three independent and hierarchical morphology properties: form, roundness, and texture [40,41,42]. Form is a measure of the overall shape of a particle, which has the greatest influence on the properties of the soil (thickest blue dotted line in Figure 9). Form is usually expressed by projection sphericity, true sphericity, etc. Among them, projection sphericity is defined as the ratio of the longest and shortest dimensions of the particle projection surface, and the projection sphericity of fused quartz sand is usually between 1.5 and 2, while that of Fujian sand is approximately 1. Roundness can be used to evaluate the corner and edges of a particle (thick red dashed line) and is expressed by roundness, angularity, etc. Roundness is estimated by measuring the convexity of the particle outline. Fused quartz sand has sharp edges and corners, which are significantly different from Fujian sand, showing an obvious discrepancy in roundness. Texture is a measure of the surface texture (thinnest green solid line), expressed by roughness and other metrics. Under the illumination of the laser, the particles show obvious specular reflection, with a neat vertical and horizontal orthogonal texture, and there is almost no diffuse reflection phenomenon exhibited by the natural soil, indicating that the surface of the fused quartz is quite smooth.
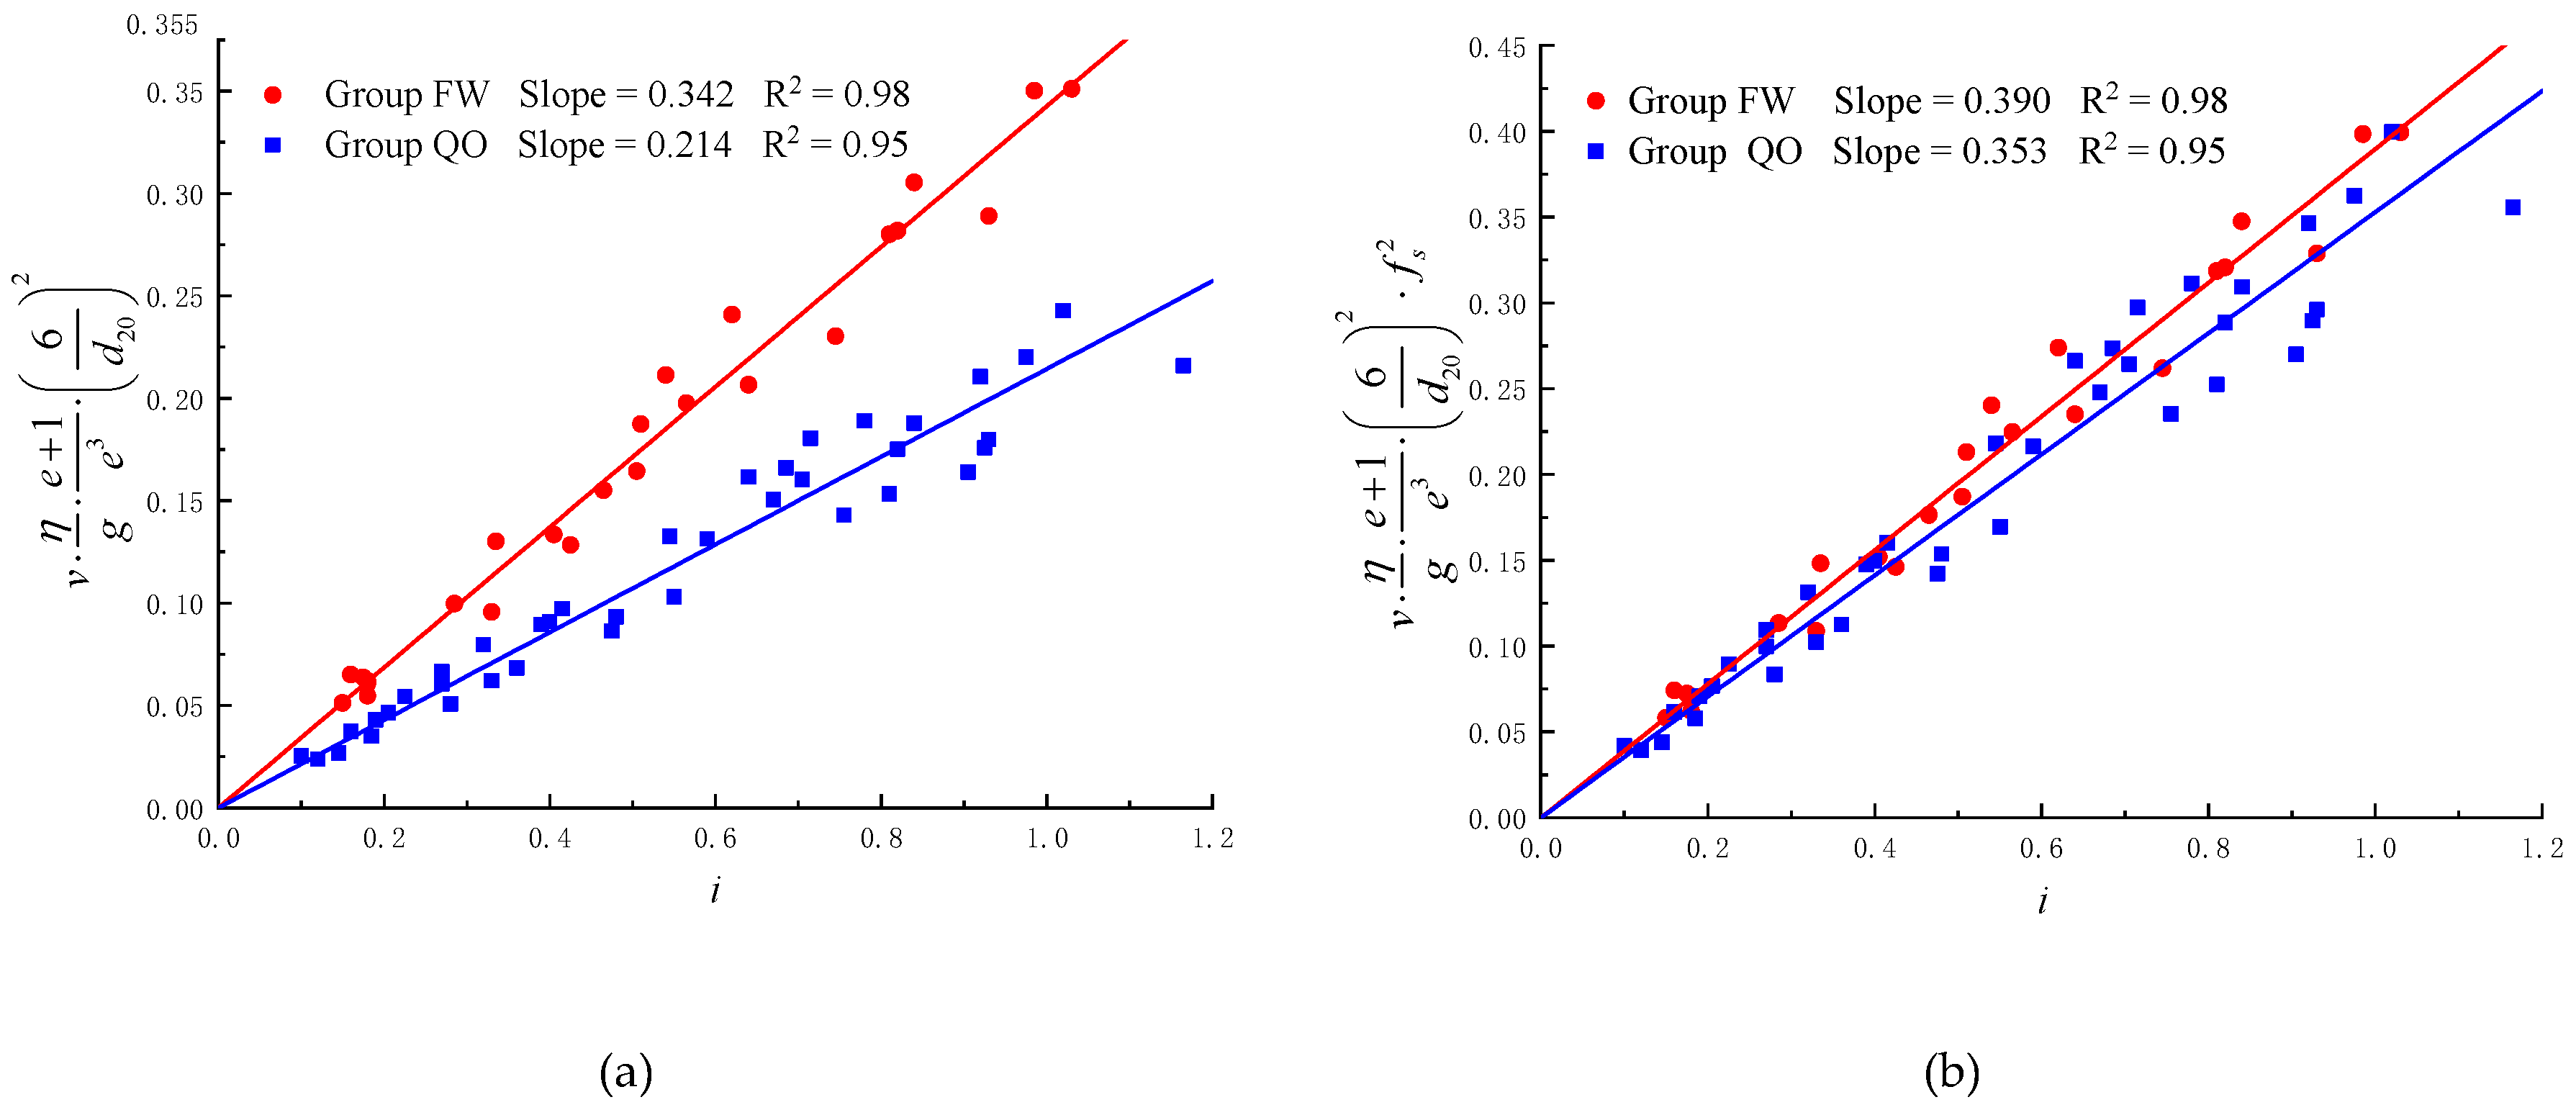
Only the effect of particle shape on the soil permeability is considered in previous studies, although the effects of particle form and roundness cannot be neglected in the theory of seepage. In this study, the factor fM in the Kozeny–Carman model is modified based on the hierarchical morphology theory of particle shape:
The parameter fs in Equation (8), called the ratio-to-spherical factor by Fair [21], is used to describe the effect of particle sphericity on permeability, which can be determined from Fair’s chart. By introducing the parameter fs, the particle specific surface area, D, can be corrected as 6fs/d, accounting for the effect of particle form. In this study, fs is 1.04 for Fujian sand and 1.29 for fused quartz sand based on the microscopic images and Fair’s chart. Figure 10 shows the effect of particle shape form after introducing the parameter fs. It can be found that the measurements can almost be regressed using a single line in Figure 10b, which indicates the necessity of accounting for the effect of particle shape form.
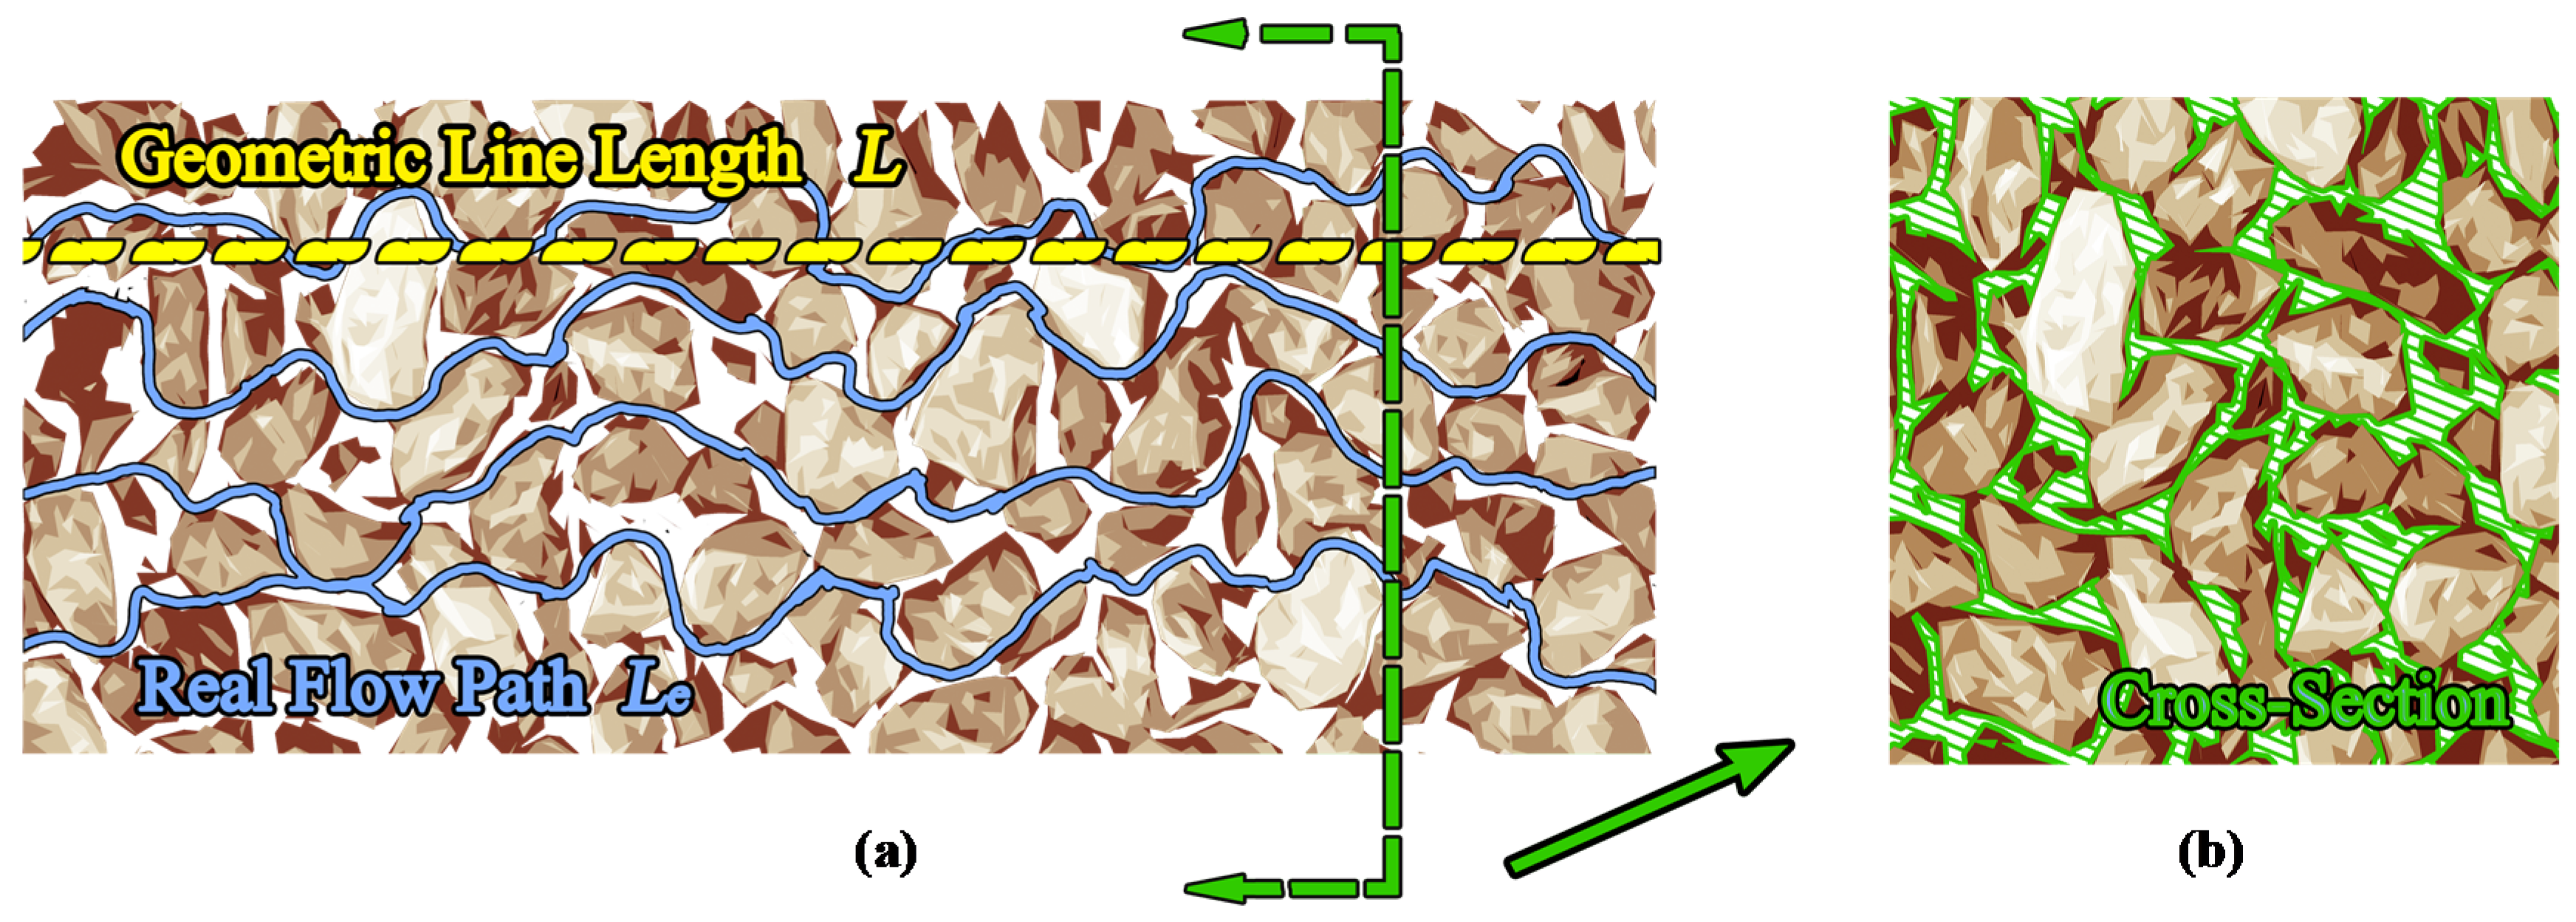
Figure 11 shows a sketch of pore capillary flow through a soil. Based on this tortuous Poiseuille capillaries model, as shown in Figure 11, Carman [22] gave a parameter fk-c, the Kozeny–Carman coefficient, which is divided into two parts: the factor of cross-sectional shape fc and the flow tortuosity Le/L (the ratio of the real flow path Le to the geometric line length L), which shows the effect of particle shape roundness. In Figure 11, the cross-section (Figure 11a) is parallel to the Darcy flow direction, and the blue line indicates the real flow path with a length of Le, with the yellow line indicating the geometric line length L. The cross-section (Figure 11b) is perpendicular to the Darcy flow direction, and the green hashed area depicts the pore throats in this cross-section. Carman [22] could not give a reasonable theoretical value of the Kozeny–Carman coefficient. However, he calculated the factors corresponding to various cross-sectional shapes based on Poiseuille’s theory and gave the empirical value of the Kozeny–Carman coefficient, 5, based on his test results. Figure 10b shows that the empirical values of the Kozeny–Carman coefficient determined in this study are 2.56 for Fujian sand and 2.83 for fused quartz sand.
From the perspective of the analytical theory of particle shape, Carman’s correction cannot calculate the result of the Kozeny–Carman coefficient, but it can account for the slight difference in the coefficients between two kinds of sand. Suppose there is a pair of soil samples made of fused quartz sand and Fujian sand, with the same gradation and the same pore ratio but different particle shapes. According to the list of the factors of cross-sectional shape by Carman [22], the values are determined by the ratio of the longest and shortest dimensions of the cross-section, normalized by the ratio-to-spherical factor, which correlates to the form, not roundness. Therefore, the difference in permeability between the fused quartz sand sample and the Fujian sand sample caused by the roundness of the cross-section is almost negligible. Regarding tortuosity, this capillary flow can be thought of as a process of continuous flow along the surface of the particles. In the case of the same volume, the particles with fewer corners have a smaller surface area. The real flow path of the fused quartz sand sample is larger than that of the Fujian sand. Therefore, the ratio of tortuosity of these two samples should be greater than 1. In this study, the tested ratio of tortuosity is , which is reasonable.
From this experimental study and theoretical analysis, the permeability of this proposed transparent soil can be estimated by
ρ(T) and μ(T) of the mixed oil can be calculated by Equations (3) and (4). fs is 1.04 for Fujian sand, while it is 1.29 for fused quartz sand. fK-C of the Fujian sand and fused quartz sand are 2.56 and 2.83, respectively.
4. Conclusions
The experimental study investigates the permeability of a proposed transparent soil, which consists of fused quartz sand and a mixed oil. The following conclusions can be obtained:
- (1)
- The transparent soil permeability changes with the replacement of the solid and fluid phases. By replacing the pore water, a liquid phase using the mixed oil is proposed to reach the same refractive index as the solid phase. Fused quartz sand is used as the solid phase in this proposed transparent soil, which exhibits a significantly different particle shape from the natural soil due to the lack of weathering.
- (2)
- The soil permeability is affected by particle size, particle size distribution, and void ratio. The soil permeability increases as the particle size or void ratio increases. For the non-uniform size soil, the effective particle size can be used to describe soil permeability, which can be calculated based on the particle size distribution. For the fused quartz sand in this study, d20 can be used as the effective particle size.
- (3)
- From a hierarchical approach, the effect of pore morphology on soil permeability can be considered through the evaluation of particle form, roundness, and texture. Based on the electron microscopic images, the effect of particle texture may be negligible compared with the other two factors. By introducing the parameters related to particle form and roundness, the Kozeny–Carman model is modified to effectively predict the permeability of transparent soil, which can account for the difference in permeability characteristics due to the different pore morphology of this proposed transparent soil. In particular, the developed model can provide an effective approach with which to estimate the soil permeability quantitively.
Author Contributions
Conceptualization, B.H.; methodology, Y.T. and C.G.; investigation, C.G., J.G., and L.C.; data curation, C.G.; writing—original draft preparation, C.G.; writing—review and editing, B.H. and Y.T.; funding acquisition, B.H. and Y.T.
Funding
This research was funded by the Natural Science Foundation of Zhejiang Province (grant number LCZ19E080002), the Fundamental Research Funds for the Central Universities (grant number 2019FZA4016 and 2019QNA4035), the National Natural Science Foundation of China (grant number 51988101), and a project supported by the Scientific Research Fund of Zhejiang Provincial Education Department (grant number Y201840555).
Conflicts of Interest
The authors declare no conflicts of interest.
Notation
| CC = coefficient of gradation | Cu = uniformity coefficient |
| D = specific surface area | d = particle diameter |
| de = effective particle size | deff = effective particle size by Sperry (1995) [23] |
| deff’ = effective particle size by Carrier (2003) [24] | dli = larger sieve size |
| dsi = smaller sieve size | dx = particle size for which x% of the soil is finer |
| e = void ratio | Ff = factor of fluid |
| fc = factor of cross-sectional shape | fd = factor of particle size |
| fe = factor of void ratio | fi = fraction of particles between two sieve sizes |
| fk-c = Kozeny–Carman coefficient | fM = factor of pore morphology |
| fs = ratio-to-spherical factor | g = gravity |
| Gs = specific weight | i = hydraulic gradient |
| k = Darcy permeability coefficient | k20 = standard permeability coefficient at 20°C |
| K = intrinsic permeability | Le = average real flow path length |
| L = geometric line length | Le/L = tortuosity |
| nEI = refractive index of EI | nmix = refractive index of mixed oil |
| n15 = refractive index of 15# mineral oil | p = volume fraction of 15# mineral oil |
| R2 = fitting variance | v = mean velocity of seepage |
| v20 = standard mean velocity at 20 °C | η = fluid kinematic viscosity |
| η20 = fluid kinematic viscosity at 20 °C | μ = fluid dynamic viscosity |
| μ20 = fluid dynamic viscosity at 20 °C | ρ = fluid density |
| ρ20 = fluid density at 20 °C | T = temperature |
References
- Terzaghi, K. Soil mechanics. Eng. News-Rec. 1996, 85, 632–637. [Google Scholar]
- Yang, Y.-S.; Yang, T.-T.; Qiu, L.-C.; Han, Y.J.W. Simulating the Overtopping Failure of Homogeneous Embankment by a Double-Point Two-Phase MPM. Water 2019, 11, 1636. [Google Scholar] [CrossRef]
- Mannheimer, R. Slurries you can see through. Technol. Today 1990, 3, 22. [Google Scholar]
- Iskander, M.; Bathurst, R.J.; Omidvar, M. Past, Present, and Future of Transparent Soils. Geotech. Test. J. 2015, 38, 557–573. [Google Scholar] [CrossRef]
- Kong, G.Q.; Cao, Z.H.; Zhou, H.; Sun, X.J. Analysis of Piles Under Oblique Pullout Load Using Transparent-Soil Models. Geotech. Test. J. 2015, 38, 725–738. [Google Scholar] [CrossRef]
- Omidvar, M.; Malioche, J.D.; Chen, Z.; Iskander, M.; Bless, S. Visualizing Kinematics of Dynamic Penetration in Granular Media Using Transparent Soils. Geotech. Test. J. 2015, 38, 656–672. [Google Scholar] [CrossRef]
- Xiang, Y.Z.; Liu, H.L.; Zhang, W.G.; Chu, J.; Zhou, D.; Xiao, Y. Application of transparent soil model test and DEM simulation in study of tunnel failure mechanism. Tunn. Undergr. Space Technol. 2018, 74, 178–184. [Google Scholar] [CrossRef]
- Yin, F.; Xiao, Y.; Liu, H.; Zhou, H.; Chu, J. Experimental Investigation on the Movement of Soil and Piles in Transparent Granular Soils. Geotech. Geol. Eng. 2018, 36, 783–791. [Google Scholar] [CrossRef]
- Fatahi, H.; Hossain, M.M. Fluid flow through porous media using distinct element based numerical method. J. Pet. Explor. Prod. Technol. 2016, 6, 217–242. [Google Scholar] [CrossRef]
- Wang, Y.; Ni, X. Hydro-mechanical analysis of piping erosion based on similarity criterion at micro-level by PFC3D. Eur. J. Environ. Civ. Eng. 2013, 17, 187–204. [Google Scholar] [CrossRef]
- Wu, J.-H.; Lin, W.-K.; Hu, H.-T. Post-failure simulations of a large slope failure using 3DEC: The Hsien-du-shan slope. Eng. Geol. 2018, 242, 92–107. [Google Scholar] [CrossRef]
- Liu, J.; Iskander, M.; Tabe, K.; Kosterelos, K. Flow visualization using transparent synthetic soils. In Proceedings of the 16th International Conference on Soil Mechanics and Geotechnical Engineering, Osaka, Japan, 12–16 September 2005; pp. 2411–2414. [Google Scholar]
- Hassan, Y.A.; Dominguez-Ontiveros, E.E. Flow visualization in a pebble bed reactor experiment using PIV and refractive index matching techniques. Nucl. Eng. Des. 2008, 238, 3080–3085. [Google Scholar] [CrossRef]
- Hunter, R.P.; Bowman, E.T. Visualisation of seepage-induced suffusion and suffosion within internally erodible granular media. Geotechnique 2018, 68, 918–930. [Google Scholar] [CrossRef]
- Ezzein, F.M.; Bathurst, R.J. A Transparent Sand for Geotechnical Laboratory Modeling. Geotech. Test. J. 2011, 34, 590–601. [Google Scholar]
- Liu, J.Y.; Iskander, M.G.; Sadek, S. Consolidation and permeability of transparent amorphous silica. Geotech. Test. J. 2003, 26, 390–401. [Google Scholar]
- Guzman, I.; Iskander, M. Geotechnical Properties of Sucrose-Saturated Fused Quartz for Use in Physical Modeling. Geotech. Test. J. 2013, 36, 448–454. [Google Scholar] [CrossRef]
- Carvalho, T.; Suescun-Florez, E.; Omidvar, M.; Iskander, M. A Nonviscous Water-Based Pore Fluid for Modeling With Transparent Soils. Geotech. Test. J. 2015, 38, 805–811. [Google Scholar] [CrossRef]
- Siemens, G.A.; Mumford, K.G.; Kucharczuk, D. Characterization of Transparent Soil for Use in Heat Transport Experiments. Geotech. Test. J. 2015, 38, 620–630. [Google Scholar] [CrossRef]
- Guzman, I.L.; Iskander, M.; Suescun-Florez, E.; Omidvar, M. A transparent aqueous-saturated sand surrogate for use in physical modeling. Acta Geotech. 2014, 9, 187–206. [Google Scholar] [CrossRef]
- Fair, G.M.; Hatch, L.P.; Hudson, H.E., Jr. Fundamental factors governing the streamline flow of water through sand [with discussion]. Am. Water Work. Assoc. 1933, 25, 1551–15653. [Google Scholar] [CrossRef]
- Carman, P.C. Flow of Gases through Porous Media; Butterworths Scientific Publications: London, UK, 1956; p. 182. [Google Scholar]
- Sperry, J.M.; Peirce, J.J. A Model for Estimating the Hydraulic Conductivity of Granular Material Based on Grain Shape, Grain-Size, and Porosity. Ground Water 1995, 33, 892–898. [Google Scholar] [CrossRef]
- Carrier, W.D. Goodbye, Hazen; Hello, Kozeny-Carman. J. Geotech. Geoenviron. 2003, 129, 1054–1056. [Google Scholar] [CrossRef]
- Kozeny, J. Das Wasser im Boden. Grundwasserbewegung. In Hydraulik; Springer: Berlin/Heidelberg, Germany, 1953; pp. 380–445. [Google Scholar]
- Sanvitale, N.; Bowman, E.T. Internal imaging of saturated granular free-surface flows. Int. J. Phys. Model. Geo. 2012, 12, 129–142. [Google Scholar] [CrossRef]
- ISO. ISO 679: 2009: Cement-Test Methods-Determination of Strength; ISO: Geneva, Switzerland, 2009; Available online: https://www.iso.org/standard/45568.html (accessed on 15 October 2019).
- Das, B.M. Advanced Soil Mechanics, 3rd ed.; Taylor & Francis: London, UK; New York, NY, USA, 2008. [Google Scholar]
- Cao, Z.; Liu, J.; Liu, H. Transparent fused silica to model natural sand. In Proceedings of the 2011 Pam-Am CGS Geotechnical Conference, Toronto, ON, Canada, 2–6 October 2011. [Google Scholar]
- Budwig, R. Refractive index matching methods for liquid flow investigations. Exp. Fluids 1994, 17, 350–355. [Google Scholar] [CrossRef]
- Yi, L.D.; Lv, H.B.; Ye, T.; Zhang, Y.P. Quantification of the Transparency of the Transparent Soil in Geotechnical Modeling. Adv. Civ. Eng. 2018, 2018. [Google Scholar] [CrossRef]
- Reis, J.C.R.; Lampreia, I.M.S.; Santos, Â.F.S.; Moita, M.L.C.J.; Douhéret, G. Refractive Index of Liquid Mixtures: Theory and Experiment. CHEMPHYSCHEM 2010, 11, 3722–3733. [Google Scholar] [CrossRef]
- ASTM Standard. Standard Test Method for Permeability of Granular Soils (Constant Head); ASTM International: West Conshohocken, PA, USA, 2006; D2434-68. [Google Scholar]
- Hunter, R.P. Development of Transparent Soil Testing Using Planar Laser Induced Fluorescence in the Study of Internal Erosion of Filters In Embankment Dams. Master’s Thesis, University of Canterbury, Christchurch, Canterbury, New Zealand, 2012. [Google Scholar]
- Bear, J. Dynamics of Fluids in Porous Media; American Elsevier Pub. Co.: New York, NY, USA, 1972. [Google Scholar]
- Hazen, A. Some physical properties of sands and gravels, with special reference to their use in filtration. In Proceedings of the 24th Annual Report; Massachusetts State Board of Health: Springfield, MA, USA, 1892; Volume 34, pp. 539–556. [Google Scholar]
- Krüger, E. Die Grundwasserbewegung. Internationale Mitteilungen für Bodenkunde 1918, 8, 105–122. [Google Scholar]
- Chapuis, R.P. Predicting the saturated hydraulic conductivity of sand and gravel using effective diameter and void ratio. Can. Geotech. J. 2004, 41, 787–795. [Google Scholar] [CrossRef]
- Wang, J.-P.; Zhuang, P.-Z.; Luan, J.-Y.; Liu, T.-H.; Tan, Y.-R.; Zhang, J.J.W. Estimation of Unsaturated Hydraulic Conductivity of Granular Soils from Particle Size Parameters. Water 2019, 11, 1826. [Google Scholar] [CrossRef]
- Barrett, P.J. The Shape of Rock Particles, a Critical-Review. Sedimentology 1980, 27, 291–303. [Google Scholar] [CrossRef]
- Bowman, E.T.; Soga, K.; Drummond, W. Particle shape characterisation using Fourier descriptor analysis. Geotechnique 2001, 51, 545–554. [Google Scholar] [CrossRef]
- Clayton, C.R.I.; Abbireddy, C.O.R.; Schiebel, R. A method of estimating the form of coarse particulates. Geotechnique 2009, 59, 493–501. [Google Scholar] [CrossRef] [Green Version]
Figure 1.
Particle size distributions of the tested sands. PSD: particle size distribution.

Figure 2.
Schematic of the permeameter for constant water head tests.

Figure 3.
Prepared sample of transparent soil.

Figure 4.
Test result and fitting curve for the dynamic viscosity–temperature relationship of the mixed oil (R2 = 0.99).
Figure 4.
Test result and fitting curve for the dynamic viscosity–temperature relationship of the mixed oil (R2 = 0.99).

Figure 5.
Test result and fitting curve for the density–temperature of the mixed oil (R2 = 0.90).

Figure 6.
Measured seepage velocity with various hydraulic gradients: (a) group FAW (Fujian sand, PSD-A, water); (b) group QBO (fused quartz sand, PSD-B, oil); and (c) group QCO (fused quartz sand, PSD-C, oil).
Figure 6.
Measured seepage velocity with various hydraulic gradients: (a) group FAW (Fujian sand, PSD-A, water); (b) group QBO (fused quartz sand, PSD-B, oil); and (c) group QCO (fused quartz sand, PSD-C, oil).

Figure 7.
Relationship between intrinsic permeability K and void ratio e.

Figure 8.
Effect of characteristic particle sizes on the normalized seepage velocity with various hydraulic gradients (group QO).
Figure 8.
Effect of characteristic particle sizes on the normalized seepage velocity with various hydraulic gradients (group QO).

Figure 9.
Microscopic images of sand: (a) fused quartz sand and (b) Fujian sand.

Figure 10.
Effect of particle shape form on the normalized seepage velocity with various hydraulic gradients (group FW and QO): (a) without introducing the ratio-to-spherical factor and (b) with introducing the ratio-to-spherical factor.
Figure 10.
Effect of particle shape form on the normalized seepage velocity with various hydraulic gradients (group FW and QO): (a) without introducing the ratio-to-spherical factor and (b) with introducing the ratio-to-spherical factor.

Figure 11.
Sketch of pore capillary flow through soil: the cross-sections: (a) parallel and (b) perpendicular to the Darcy flow direction.
Figure 11.
Sketch of pore capillary flow through soil: the cross-sections: (a) parallel and (b) perpendicular to the Darcy flow direction.


Table 1.
Properties of the tested sands.
| Particle Size Distribution | PSD-A | PSD-B | PSD-C |
|---|---|---|---|
| Solid Material | Fujian Sand | Fused Quartz | Fused Quartz |
| Specific Weight, Gs | 2.67 | 2.21 | 2.21 |
| d10 (mm) | 0.16 | 0.45 | 0.45 |
| d20 (mm) | 0.25 | 0.55 | 0.74 |
| d30 (mm) | 0.41 | 0.62 | 1.04 |
| d60 (mm) | 0.84 | 0.89 | 1.38 |
| Effective Particle Size by Sperry [23], deff (mm) | 0.43 | 0.73 | 0.94 |
| Effective Particle Size by Carrier [24], deff’ (mm) | 0.39 | 0.68 | 0.88 |
| Uniformity Coefficient, Cu | 5.25 | 2.00 | 3.09 |
| The Coefficient of Gradation, CC | 1.49 | 0.97 | 1.76 |
Table 2.
Experimental program.
| Group | Run #* | Solid Phase | Particle Size Distribution | Fluid Phase | Void Ratio |
|---|---|---|---|---|---|
| FW | FAW-1 | Fujian Sand | PSD-A | Water | 0.58 |
| FAW-2 | Fujian Sand | PSD-A | Water | 0.64 | |
| FAW-3 | Fujian Sand | PSD-A | Water | 0.62 | |
| FAW-4 | Fujian Sand | PSD-A | Water | 0.62 | |
| FAW-5 | Fujian Sand | PSD-A | Water | 0.54 | |
| FAW-6 | Fujian Sand | PSD-A | Water | 0.54 | |
| QO | QBO-1 | Fused Quartz Sand | PSD-B | Mixed Oil | 0.68 |
| QBO-2 | Fused Quartz Sand | PSD-B | Mixed Oil | 0.69 | |
| QBO-3 | Fused Quartz Sand | PSD-B | Mixed Oil | 0.66 | |
| QBO-4 | Fused Quartz Sand | PSD-B | Mixed Oil | 0.63 | |
| QCO-1 | Fused Quartz Sand | PSD-C | Mixed Oil | 0.69 | |
| QCO-2 | Fused Quartz Sand | PSD-C | Mixed Oil | 0.67 | |
| QCO-3 | Fused Quartz Sand | PSD-C | Mixed Oil | 0.55 | |
| QCO-4 | Fused Quartz Sand | PSD-C | Mixed Oil | 0.57 | |
| QCO-5 | Fused Quartz Sand | PSD-C | Mixed Oil | 0.66 | |
| QCO-6 | Fused Quartz Sand | PSD-C | Mixed Oil | 0.64 |
* F = Fujian sand, Q = fused quartz sand; A = PSD-A, B = PSD-B, C = PSD-C; W = water, O = mixed oil.
© 2019 by the authors. Licensee MDPI, Basel, Switzerland. This article is an open access article distributed under the terms and conditions of the Creative Commons Attribution (CC BY) license (http://creativecommons.org/licenses/by/4.0/).
Share and Cite
MDPI and ACS Style
Huang, B.; Guo, C.; Tang, Y.; Guo, J.; Cao, L. Experimental Study on the Permeability Characteristic of Fused Quartz Sand and Mixed Oil as a Transparent Soil. Water 2019, 11, 2514. https://doi.org/10.3390/w11122514
AMA Style
Huang B, Guo C, Tang Y, Guo J, Cao L. Experimental Study on the Permeability Characteristic of Fused Quartz Sand and Mixed Oil as a Transparent Soil. Water. 2019; 11(12):2514. https://doi.org/10.3390/w11122514
Chicago/Turabian StyleHuang, Bo, Chang Guo, Yao Tang, Jiachen Guo, and Linfeng Cao. 2019. "Experimental Study on the Permeability Characteristic of Fused Quartz Sand and Mixed Oil as a Transparent Soil" Water 11, no. 12: 2514. https://doi.org/10.3390/w11122514
Note that from the first issue of 2016, this journal uses article numbers instead of page numbers. See further details here.