An Experimental Study of Focusing Wave Generation with Improved Wave Amplitude Spectra

1
Faculty of Maritime and Transportation, Ningbo University, Ningbo 315211, China
2
College of Shipbuilding Engineering, Harbin Engineering University, Harbin 150001, China
*
Author to whom correspondence should be addressed.
Water 2019, 11(12), 2521; https://doi.org/10.3390/w11122521
Submission received: 15 October 2019
/
Revised: 25 November 2019
/
Accepted: 26 November 2019
/
Published: 28 November 2019
(This article belongs to the Special Issue Advances in Modelling and Prediction on the Impact of Human Activities and Extreme Events on Environments)
Abstract
:We experimentally investigate the generating results of space-time focusing waves based on two new wave spectra, i.e., the quasi constant wave amplitude spectrum (QCWA) and the quasi constant wave steepness spectrum (QCWS), in which amplitude and steepness for each wave component can be adjusted with fixed wave energy. The wavemaker signal consists of a theoretical wavemaker motion signal and two different auxiliary functions at two ends of the signal. By testing a series of focusing waves in a physical wave tank, we found that with given wave energy, the QCWA spectrum can produce a focusing wave with larger crest elevation and farther focusing location from the wavemaker flap, as compared with the QCWS spectrum. However, both spectra lead to larger focusing wave crests when the wave frequency bandwidth was narrowed down and a positive correlation between the generated relative wave crest elevation and the input wave elevation parameter. The two spectra produce different focusing wave positions for the same wave frequency range. We also found that the focusing time strongly relates to the energy of the highest-frequency wave component of the wave spectrum.
1. Introduction
Focusing wave is a special water wave, different from regular wave or stochastic wave, with a single large wave crest when it happens [1,2]. On the basis of investigations of the triggering mechanisms of focusing waves [3,4,5,6], many causes have been identified, such as the space-time focusing of transient waves, wave–current interaction, geometrical focusing due to the seabed topography, atmospheric forcing, nonlinear self-focusing, etc. If the wave heights of focusing waves exceed two to 2.2 times their significant wave heights, they are generally defined as freak waves or rogue waves [7,8]. Hence, focusing waves in laboratory are often employed to model freak wave events observed in extreme sea state [9,10], in order to better understand the generation process, the mechanisms of those extreme waves, and the hydrodynamic loads on floating or fixed ocean structures in extreme sea environments [11,12,13].
Over the past few decades, various theoretical models, such as wave energy focusing, wave–wave interaction, wave-air coupling, etc. [14,15,16], have been established to express the generation mechanisms of focusing waves. Among them, the space-time focusing theory of wave energy and wave modulation instability (also named nonlinear self-focusing) theory are the most widely used and are often applied to numerical simulations of focusing or extreme waves. The former assumes that the focusing wave consists of a number of small harmonic wave components which can be superposed to form the focusing wave. Research based on the space-time focusing theory was initially carried out by the linear wave superposition [17,18] and, then, it was followed by low-order wave–wave interactions [19], and wave directional spread [20]. Recently, based on spatio-temporal focusing of wave energy, focusing waves have been produced in fully nonlinear potential or viscous numerical wave tanks [21,22,23,24]. As for the latter, i.e., wave modulation instability, a wave group is designed to be composed of carrier waves and their sideband waves. When the sideband disturbance occurs in a wave travelling process, the wave energy of carrier waves is transferred to their sideband waves, leading to wave energy focusing. Waves generated this way are are also called rogue waves or freak waves. Theoretical study on wave modulation instability dates back to the last sixties with investigations on a Stokes wave train with small perturbation [25]. Then, studies were extended to nonlinear four-wave interactions and random wave group [26,27]. In the meantime, several mathematical equations were derived under different physical assumptions, such as the nonlinear Schrödinger equation, the Davey–Stewartson system, the Korteweg–de Vries equation, and the Kadomtsev–Petviashvili equation. Detailed reviews of these mathematical models can be found in [3,28].
On the basis of the abovementioned generating mechanisms and theoretical models, the focusing waves have been mainly produced by two methods in physical wave flumes. One is to produce focusing waves through space-time focusing of wave energy. To achieve wave energy focusing at a specified position and time, the phases of wave components are modulated as zero or π/2. This phase modulation method has been adopted in the single wave model [19], the double wave model [29], the triple wave model [30], and the NewWave model [31]. The main difference among those models is the ways to specify the amplitudes of wave components. In the first three models, their amplitudes are assigned by some predefined wave spectrum, such as the constant wave amplitude spectrum (CWA), the constant wave steepness spectrum (CWS), and the random sea wave spectrum or their combined spectra, whereas the wave component amplitudes in the NewWave model are determined by the autocorrelation function of the wave energy density spectrum. In addition to the above phase modulation method, focusing waves can also be spatio-temporally produced by means of the wave dispersion method, i.e., focusing wave components are individually generated and their frequencies linearly vary with the largest one at the start [32]. By contrast, the phase modulation method can produce focusing waves with higher frequency wave components. When the wave dispersion method is adopted to generate focusing waves, the higher frequency waves are severely constrained by the stroke limitation of wavemaker.
The other way to generate focusing waves, in a laboratory, is to employ wave modulation instability. On the basis of this mechanism, Li et al. [33] experimentally observed focusing wave occurrence in a random wave group by adjusting the wave steepness parameter and the Benjamin–Feir Index (BFI). By assigning carrier wave amplitude and steepness, Chabchoub et al. [34] generated super focusing waves in their physical wave flume. Moreover, several breather solutions of the nonlinear Schrödinger equation, such as Kuznetsov–Ma solution, Akhmediev breather, and the Peregrine breather solution, are sometimes adopted to experimentally simulate extreme waves in a physical wave tank [35,36]. Apart from above methods, recently a phase-amplitude iteration scheme based on space-time focusing of wave energy has been developed to generate tailored focusing wave [37,38]. Nevertheless, the investigation from Deng et al. [39] indicated that the above phase-amplitude iteration scheme may be less effective for focusing waves with severe phase coupling. The phase-amplitude iteration method probably can be improved by directly adjusting wave component amplitude or steepness.
In order to better understand focusing waves generated under various experimental conditions, several experimental investigations have also been carried out. The testing results from Liu et al. [40] showed that some additional high-order wave components are produced, and the amplitudes of these extra components increase when focusing wave elevation becomes large. The frequency parameter of focusing wave was experimentally examined by Ma et al. [41] who demonstrated that focusing waves with a wider frequency range transfer more wave energy to their high-frequency components. The local wave steepness of focusing waves with three wave amplitude spectra types, (i.e., the linear wave steepness spectrum, the CWA spectrum, and the CWS spectrum) were examined by Wu and Yao [42] in a physical wave-current flume. Their results demonstrate that focusing waves generated by the linear steepness wave spectrum have larger local wave steepness. In addition, focusing waves with the CWA spectrum were investigated by Baldock et al. [19] who observed that the focusing position, time, and wave crest elevation increase along with a larger amplitude parameter. However, despite all the wave amplitude spectra used to generate focusing waves in published researches, their wave component amplitudes or steepness are not adjustable under assigned wave energy. Indeed, in the recently developed phase-amplitude iteration scheme [37] used for focusing wave generation, the steepness of wave components are fixed once the wave component amplitudes are determined. This means that the wave nonlinearity effect arising from phase coupling among wave components cannot be better controlled in focusing wave generation. Thus, more flexible spectra with adjustable amplitude and steepness of the components should be explored in the laboratory, in order to better represent real focusing waves or freak waves with strong nonlinearity [43].
In this study, two new wave spectra, i.e., quasi constant wave amplitude spectrum (QCWA) and quasi constant wave steepness spectrum (QCWS), are developed by modifying the conventional CWA and CWS spectra [44] used to produce focusing waves. In comparison to previous wave spectra, the advantage of the new wave spectra is that the amplitudes and steepness of wave components can be adjusted by adjusting the water depth of wave tank. On the basis of the two new wave spectra, two-dimensional nonbreaking focusing waves are spatio-temporally generated in a physical wave tank and the parameters of the generated waves are investigated under different component groups.
2. Generating Principle of Focusing Waves in a Physical Wave Tank
2.1. Experimental Setup
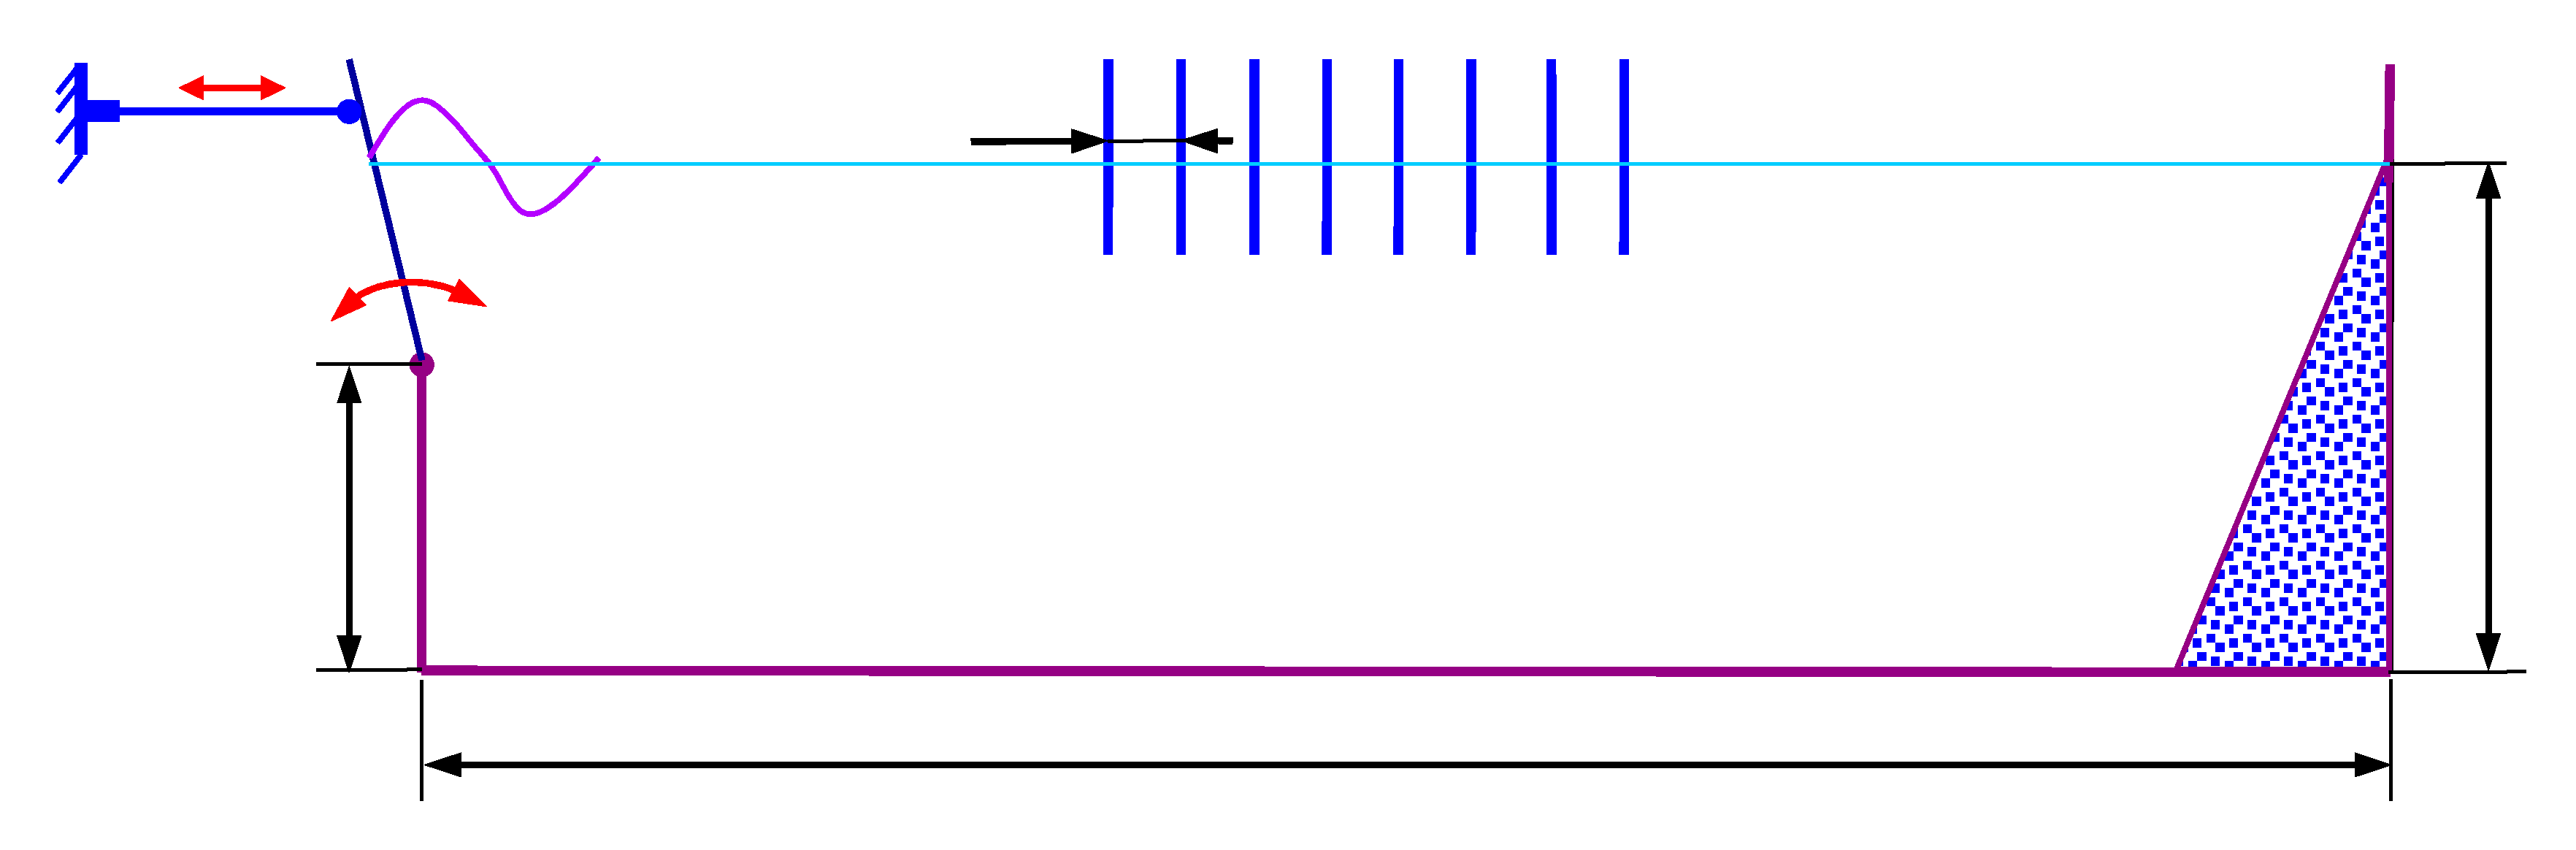
The experiment on focusing wave generation was carried out in the towing wave tank at Harbin Engineering University. The experimental sketch is shown in Figure 1. The wave tank has a length of 108 m, a width of 7 m, and a depth of 3.5 m. The hydraulic flap-type wavemaker is installed at one side of the wave tank and generates regular waves and random waves, with the maximum wave height of 0.4 m and the wave period ranging from 0.4 s to 4.0 s. At the other side, an absorbing shore is arranged to reduce the reflective waves from the end wall of the wave tank.
To record the free surface elevations, 24 wave gauges were installed with an interval of 0.4 m along the length of the wave tank. When the space parameter of focusing waves was set as 30 m, 40 m, and 50 m, the gauge array could be shifted with the first wave gauge (the far left one in Figure 1) installed at 21.905 m, 31.495 m, and 38.905 m from the flap, respectively. The hydraulic piston movement was also monitored by optic equipment (including markers and the matching cameras) to validate the accuracy of output signals.
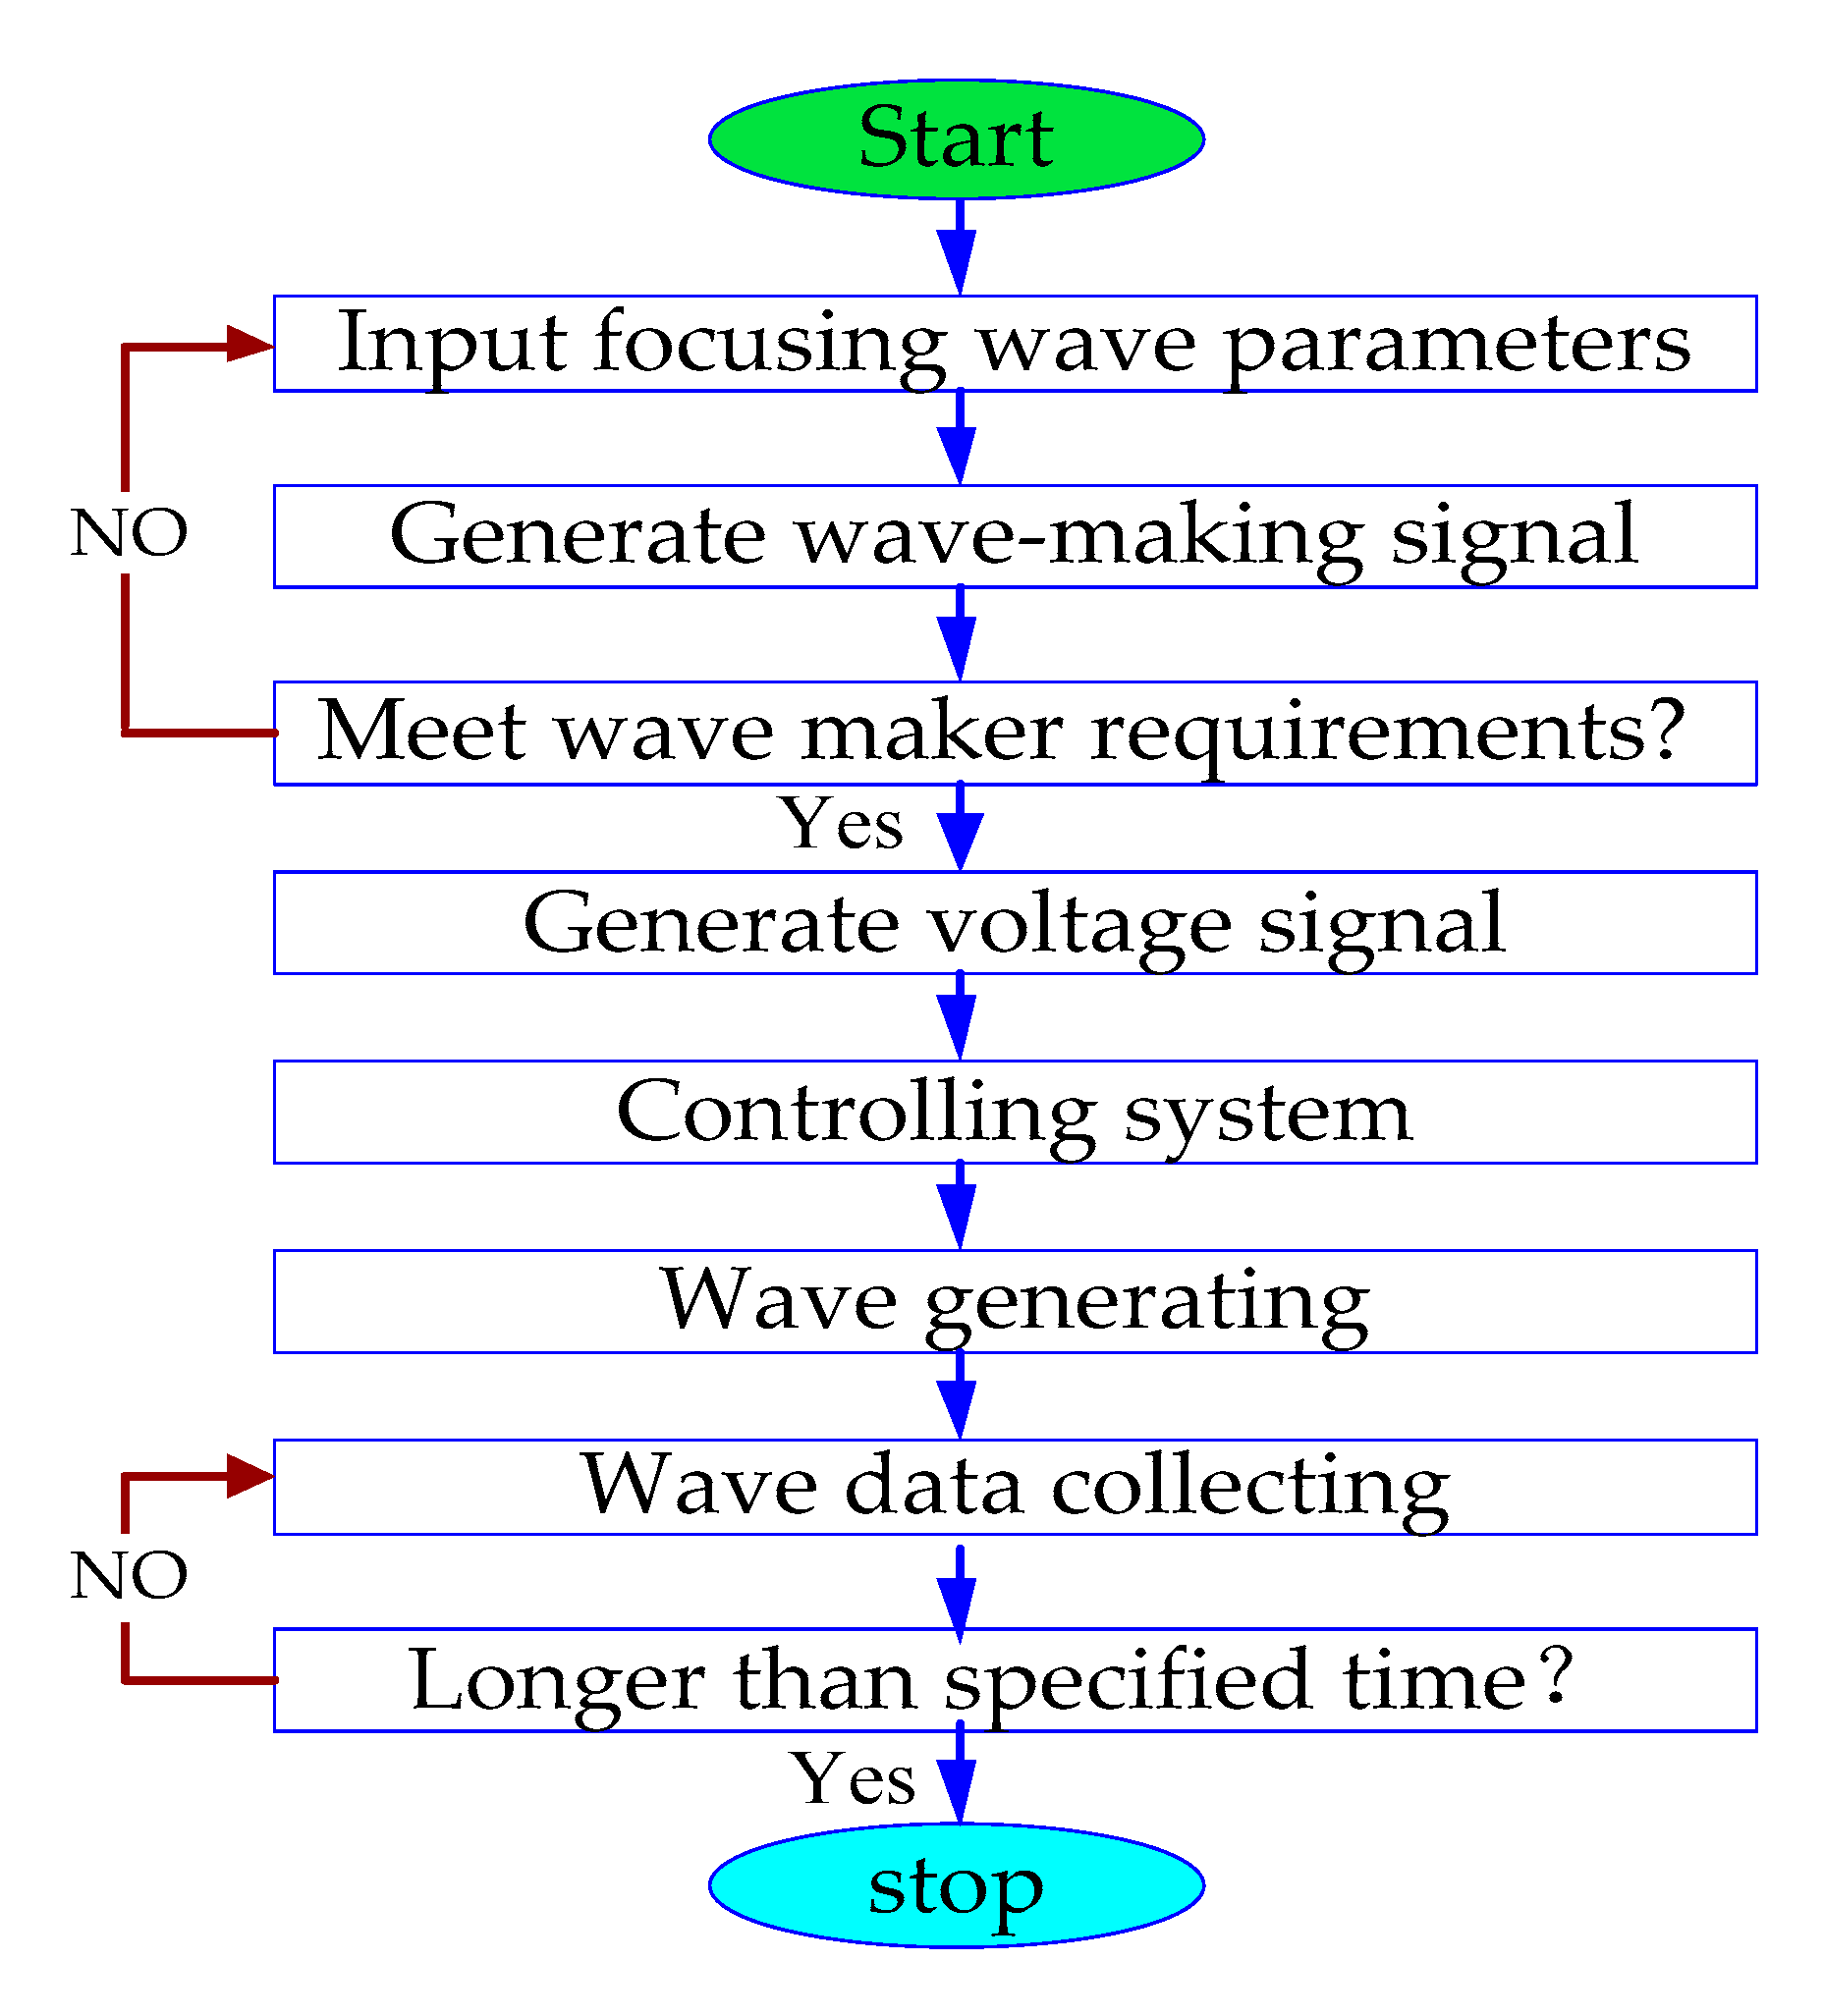
The experimental procedure is summarized in Figure 2. To generate the desired focusing waves in the physical wave tank, it is essential to have appropriate and practical wave-making signals. The theory and method used in this research for signal generation are described in the following Section 2.2 and Section 2.3.
2.2. Theoretical Wave-Making Signal
Focusing waves are generated by the spatio-temporal focusing principle of wave energy. The origin of the coordinate system is defined at the intersection point of the flap and the still water surface. The z-axis is vertically upward, and the x-axis is horizontally towards the wave travelling direction. The free surface of the focusing wave in the defined coordinate system can be expressed by:
where xf and tf are focusing location and time and ωn is the frequency of each wave component, which linearly increases from ω1 to ωN, as expressed by Equation (2). In this work, an is newly developed to be a variable which is determined by wave spectra, i.e., the quasi constant wave amplitude spectrum and the quasi constant wave steepness spectrum. They can be expressed by Equations (3) and (4), respectively.
From Equations (3) and (4), it can be seen that cosh(knh)/sinh(knh) approaches one when the water depth tends to be infinite. Thus, the previous CWA and CWS spectra used to generate focusing waves are two special expressions of the QCWA and QCWS spectra at infinite water depth.
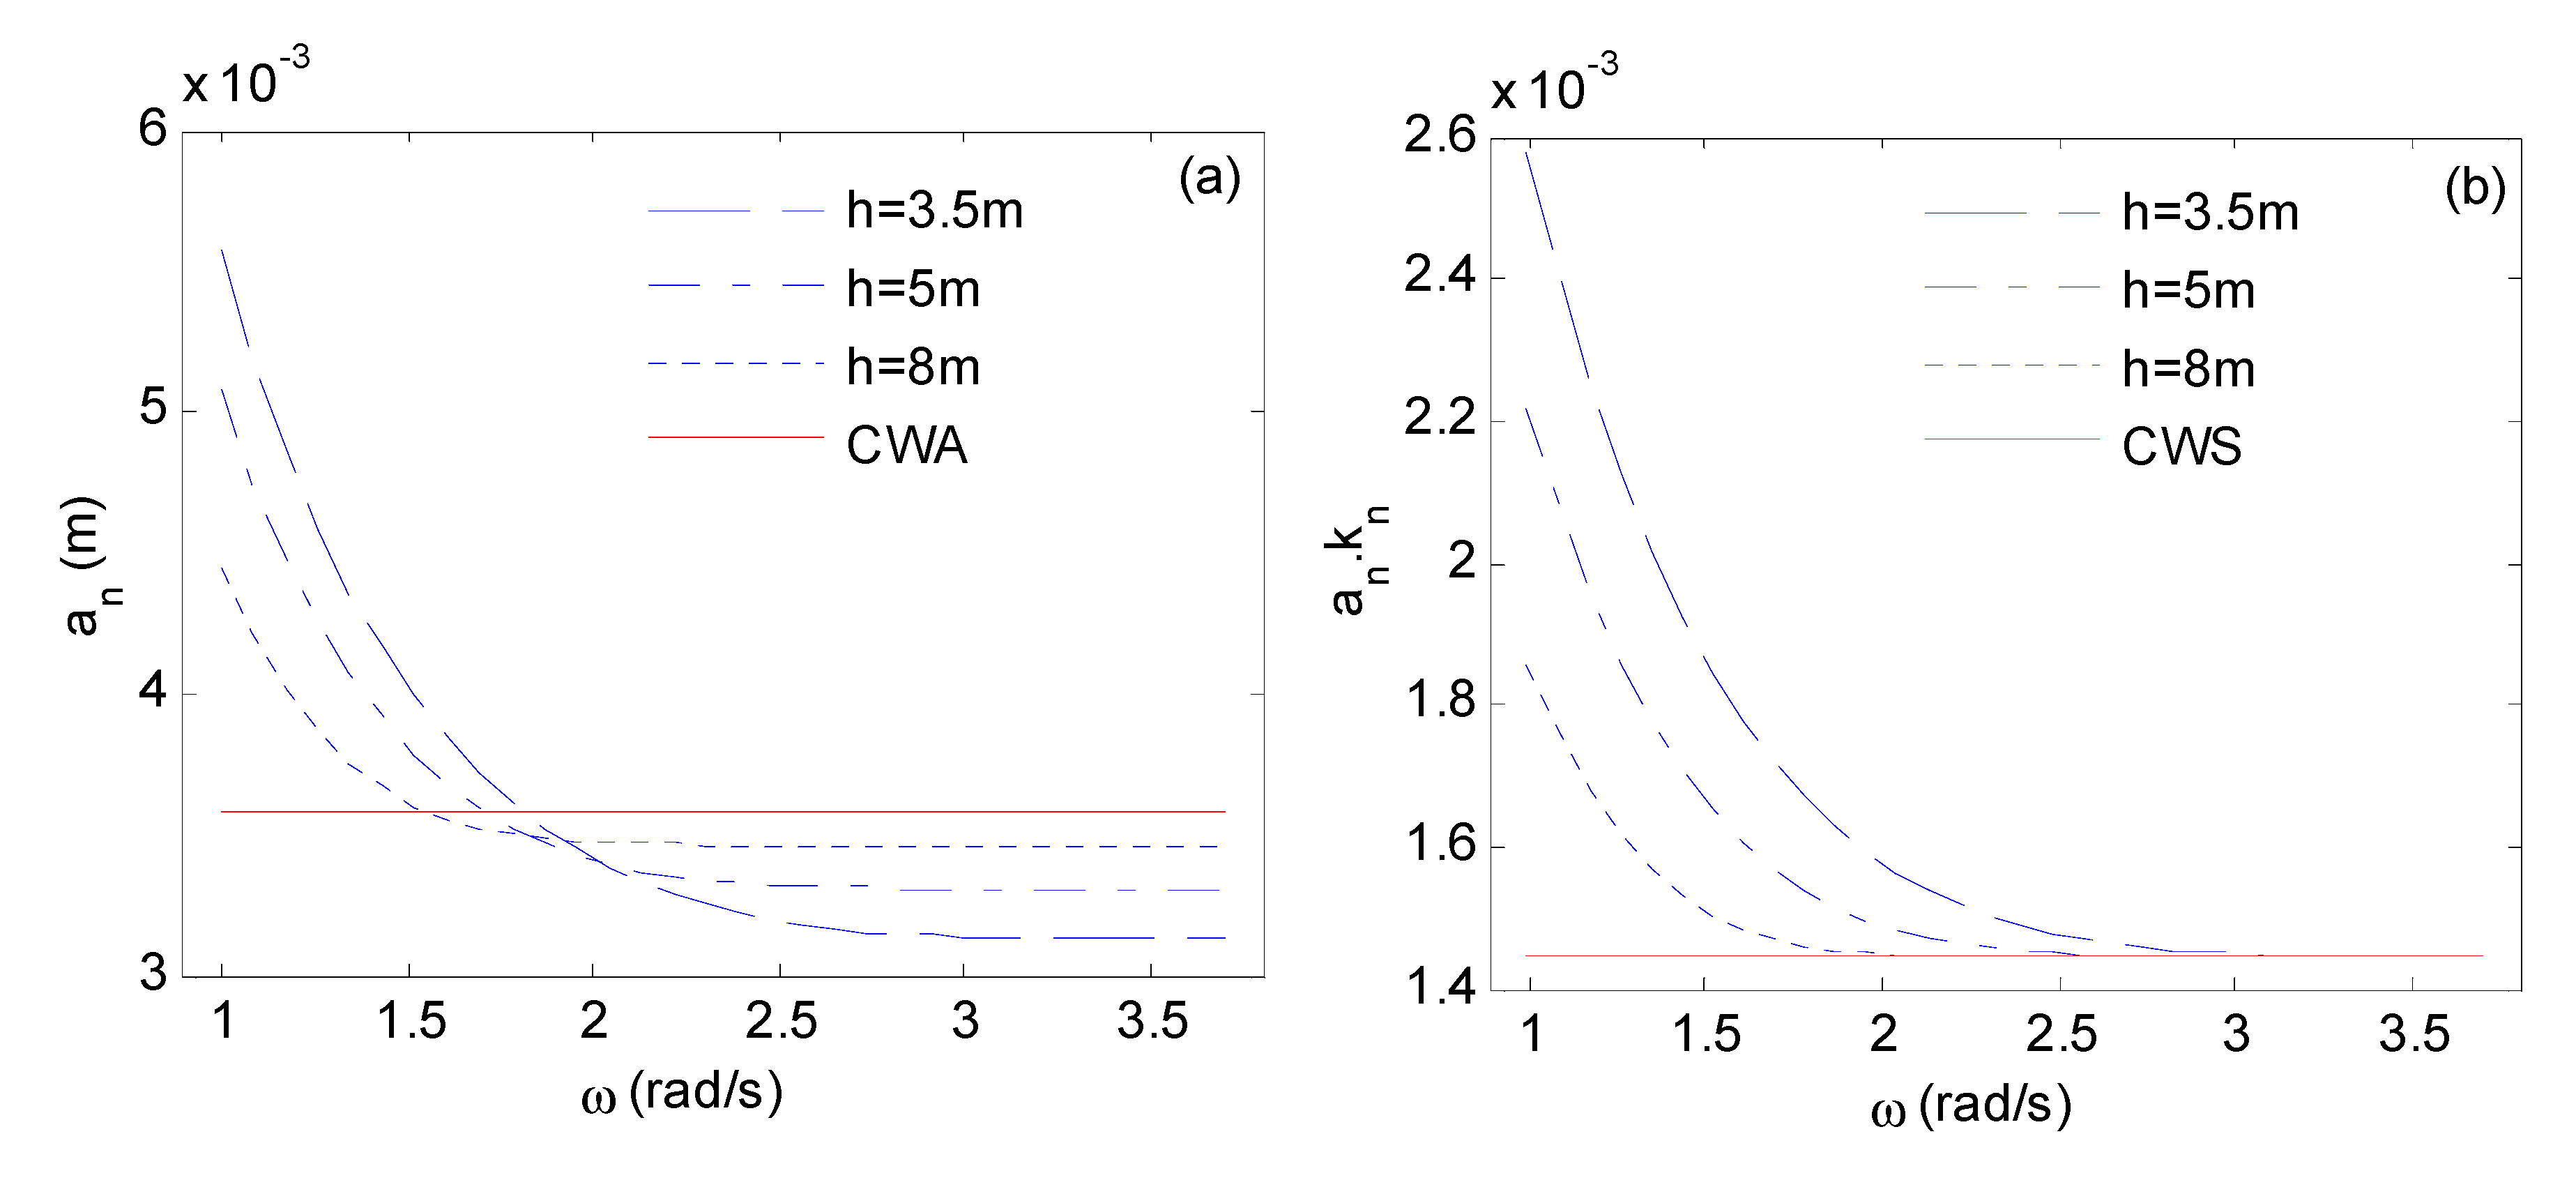
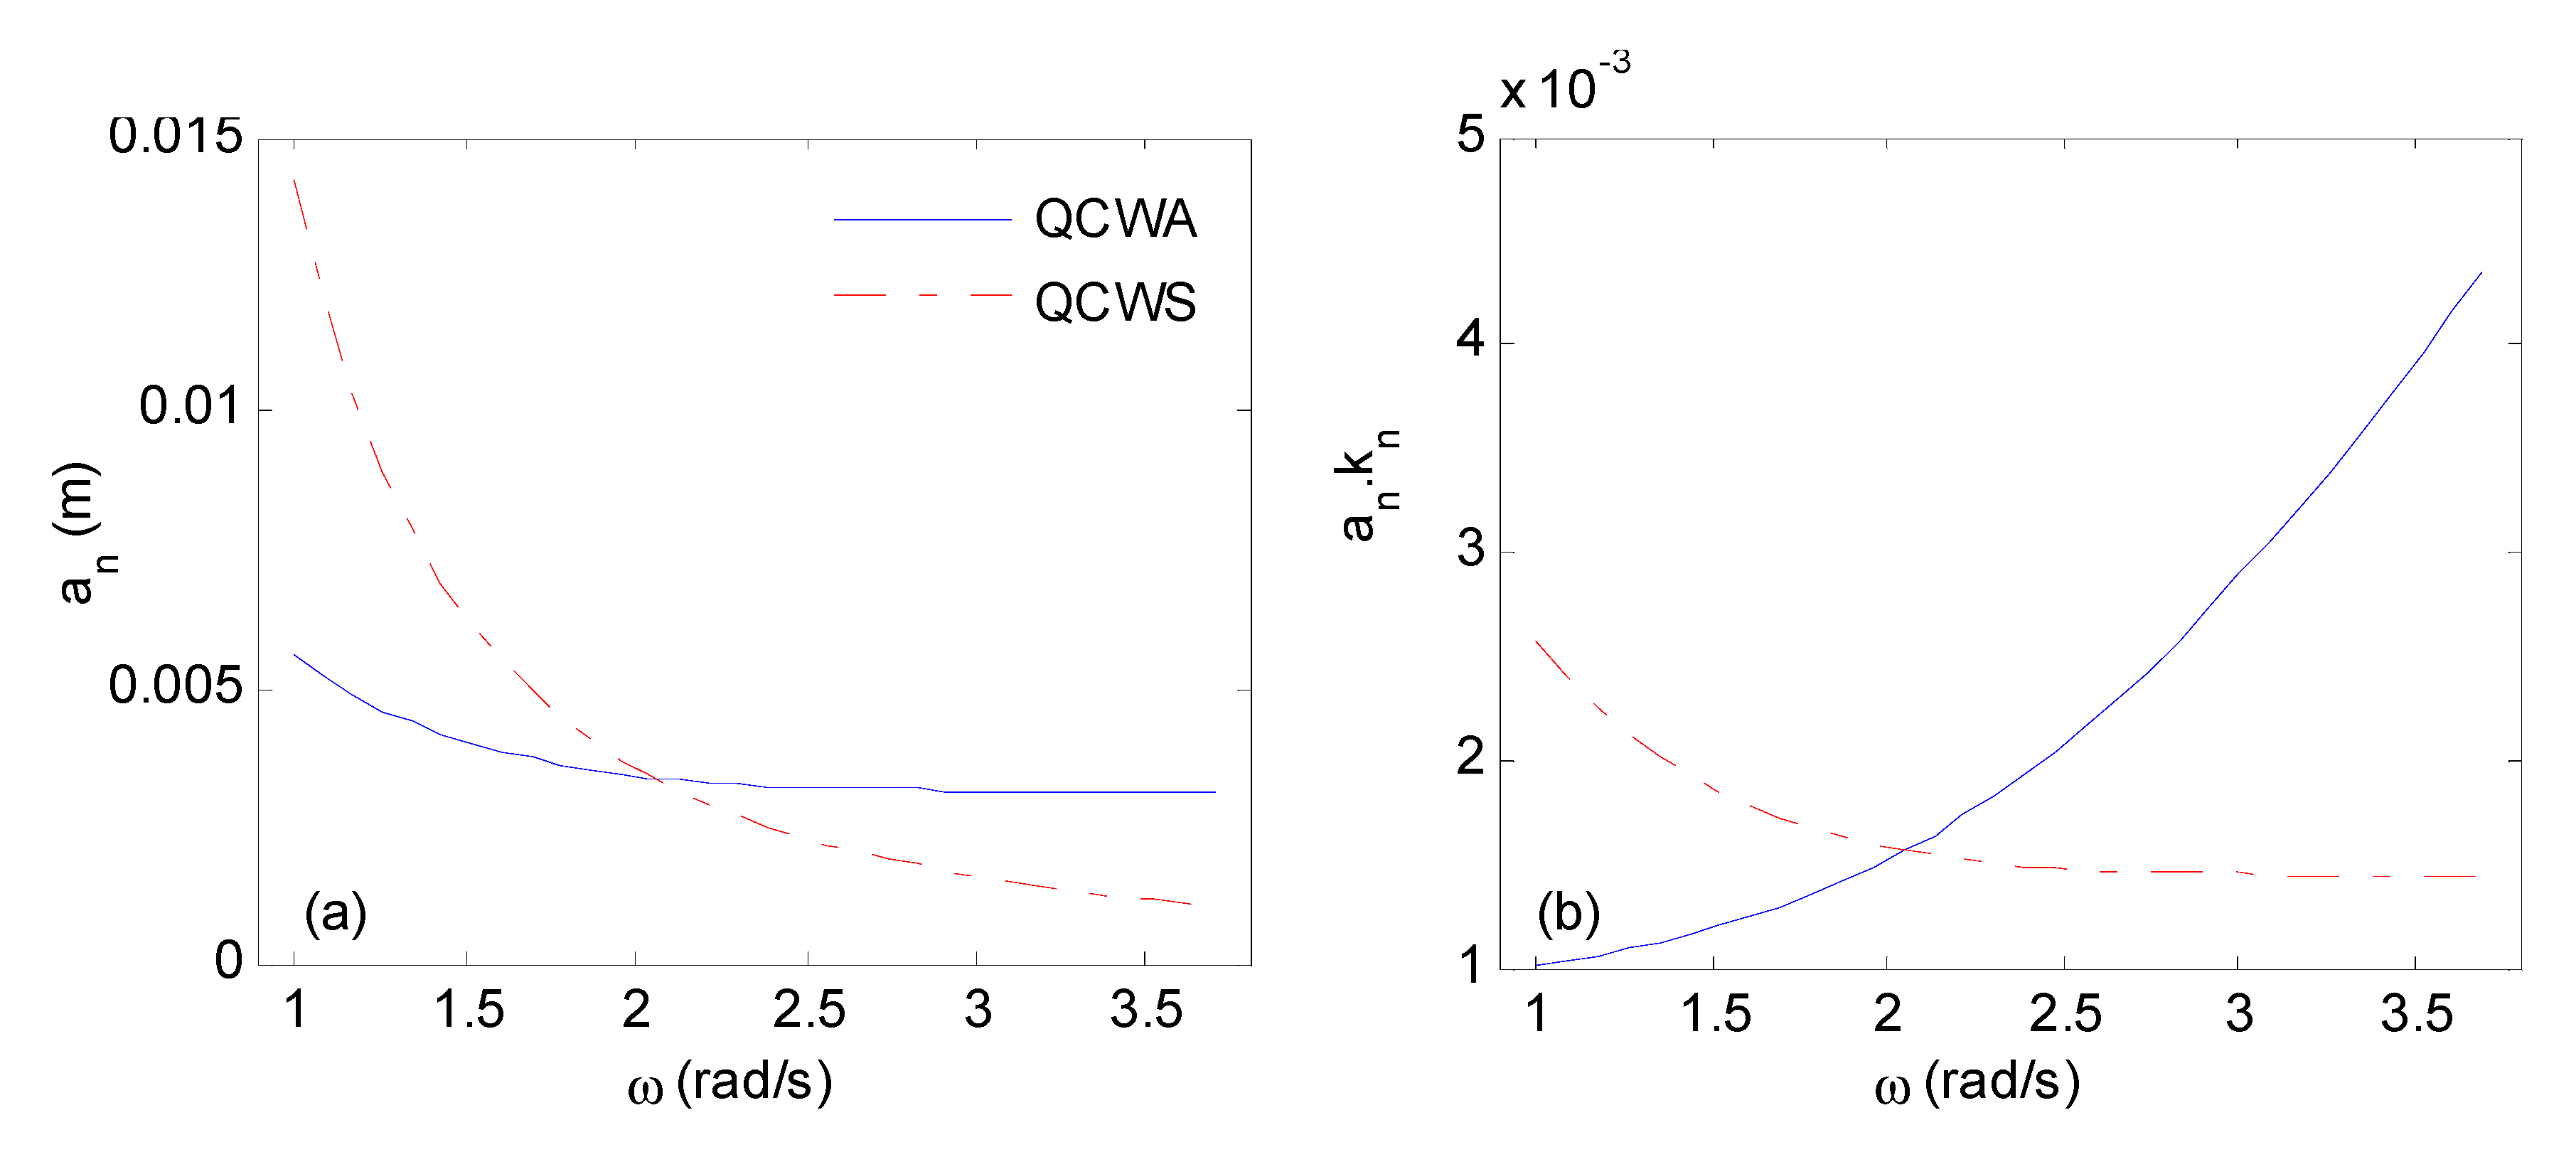
The wave component amplitudes of the QCWA spectrum and wave steepness of the QCWS spectrum at different water depths are demonstrated in Figure 3a,b, respectively. Figure 3a also shows that the wave component amplitude of the QCWA spectrum approaches that of the CWA spectrum when water depth increases. For a certain water depth, the wave component amplitude gradually becomes a constant as the wave frequency becomes higher. This is because these high-frequency wave components have short wave lengths and can be considered as deep-water waves. Therefore, Equation (3) expresses the CWA spectrum for high frequency range, i.e., an = Af/N. The similar correlation could also be seen between the QCWS spectrum and the CWS spectrum in Figure 3b. According to QCWA (or QCWS) spectrum, for the finite water depth, the crest elevation of the generated focusing wave (defined as Af0) is equal to ∑an (calculated by the linear wave theory), which is larger than Af resulting from the CWA (or CWS) spectrum. According to the focusing wave-free surface elevation expressed by Equation (1), the hydraulic piston movement to drive wavemaker flap yields
where,
and H1 = 2.3 m for the wavemaker of this experiment. The displacement signal calculated by Equation (5) is the theoretical wave-making signal to generate focusing waves.
2.3. Implementing Wave-Making Signal
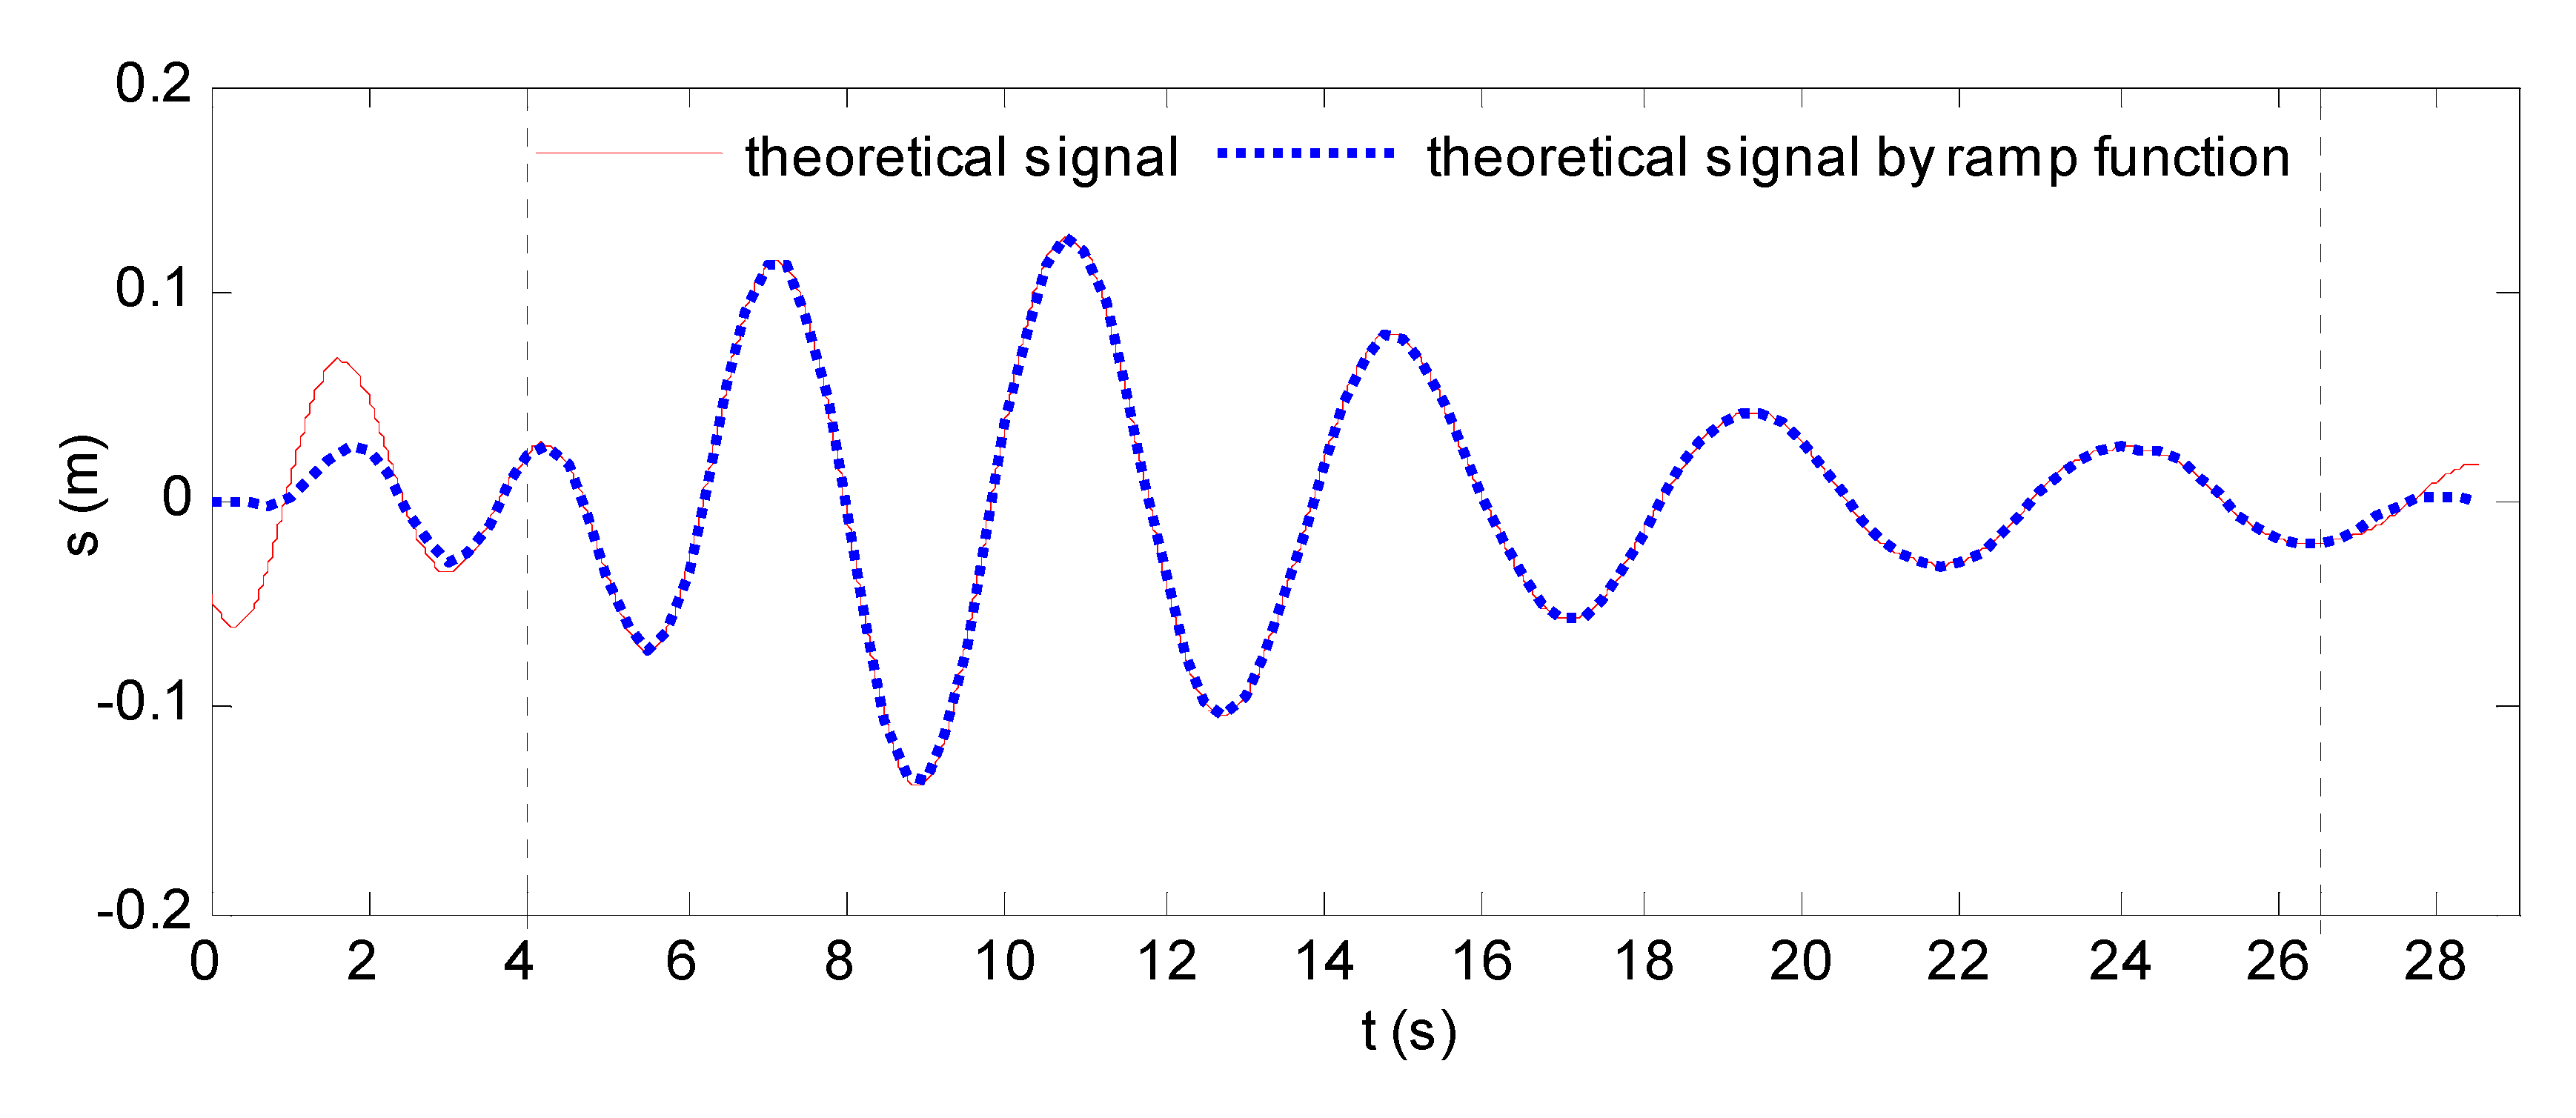
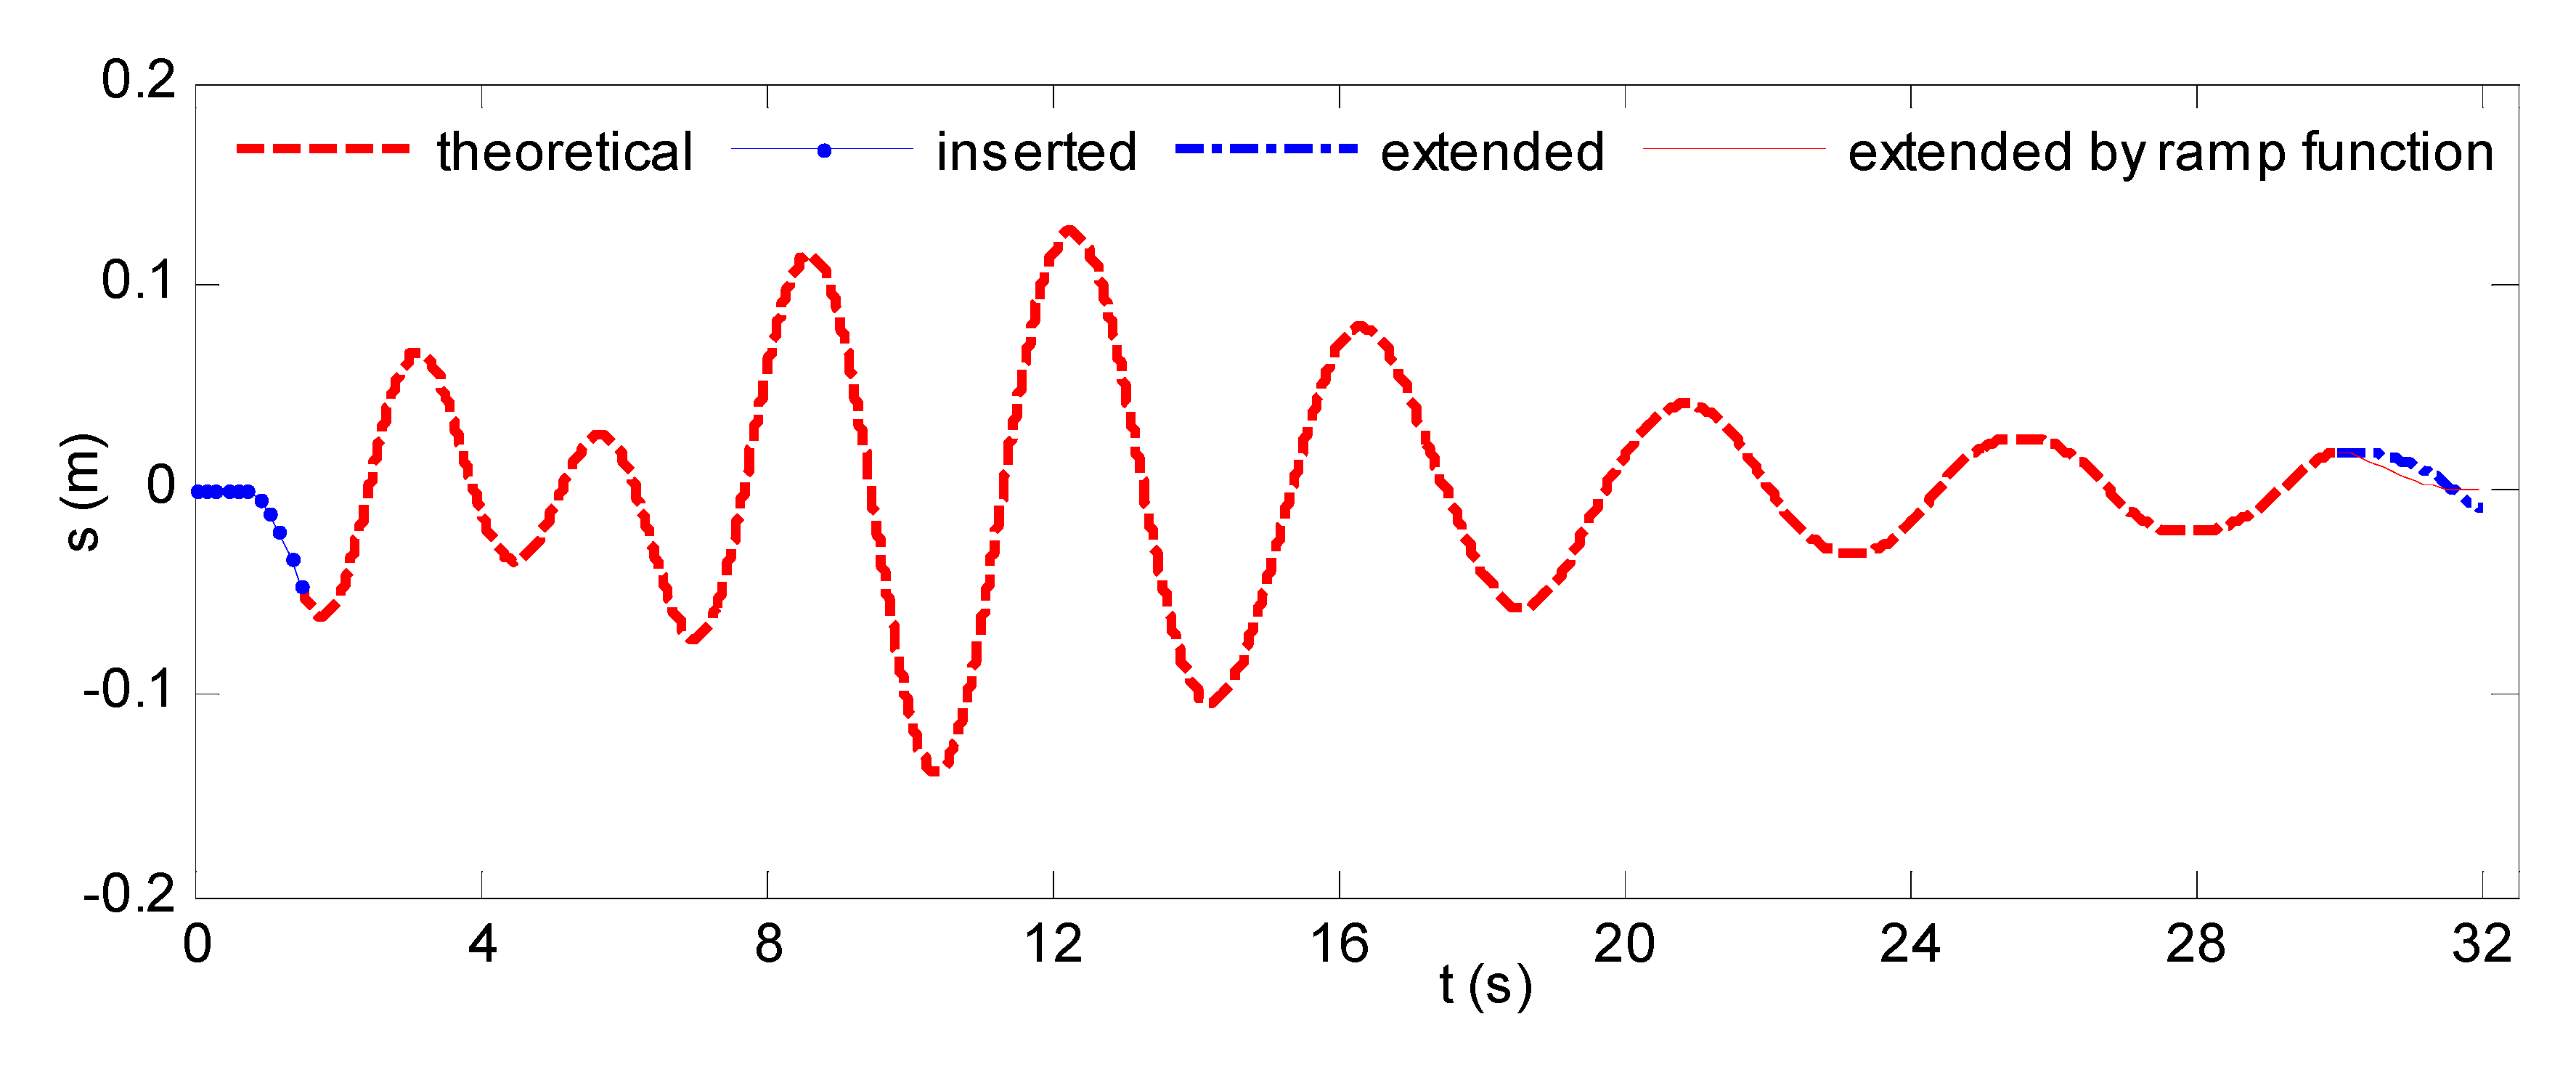
The theoretical wave-making signal cannot be directly employed to generate focusing waves, because of nonzero displacement at initial and terminating instants. Practically, the wavemaker flap needs to slowly start from its static status, and it has to gradually terminate at static status after the wave generation is completed. Thus, the theoretical wave-making signal needs to be processed to match the actual motion of the flap. An example of the theoretical signal of a QCWA focusing wave is illustrated by the red line in Figure 4 with Af = 0.1 m, xf = 50 m, tf = 25 s, N = 32, and ωn = 1.336 rad/s~2.695 rad/s, and the wave component amplitude is computed by Equation (3).
From the theoretical wave-making signal, it is seen that the initial displacement is smaller than zero and the terminating value is larger than zero. This is generally remedied by multiplying the theoretical signal by a ramp function, as shown in Figure 4. It is observed that the flap gradually starts from the static position and stops at the initial static position, matching with the actual motion requirements of wavemaker.
However, by comparing the rump function modified and the original wave-making signals in Figure 4, we observe that the theoretical movement signal has been distorted by the ramp function at the beginning and terminating stages. Considering the strong transient characteristics of focusing waves, the ramp function method may not be suitable for processing the theoretical wave-making signal. In this study, a new scheme is proposed to generate the practicable wave-making signal of focusing waves through inserting a small section auxiliary signal expressed as
where, the base function μj is written as [1, t, t2] for m = 3 and the coefficient matrix χ could be solved from Equation (8). For matching with the initially static state of the flap, the parameter γ should be larger than one. In this study, γ = 2, t0 = 1.5 s.
To make the wavemaker flap return to its initial position at the terminating stage, the theoretical stroke signal is extended, and the extension is processed by a ramp down function. The newly proposed scheme is applied to the above focusing wave example in Figure 4, and the modified wave-making signal result is illustrated in Figure 5.
It is observed that the wave-making signal processed by this research meets the actually wave-making requirements by extensions at two ends of the theoretical signal. This method will be adopted in the following focusing wave generation.
3. Experimental Results and Discussions
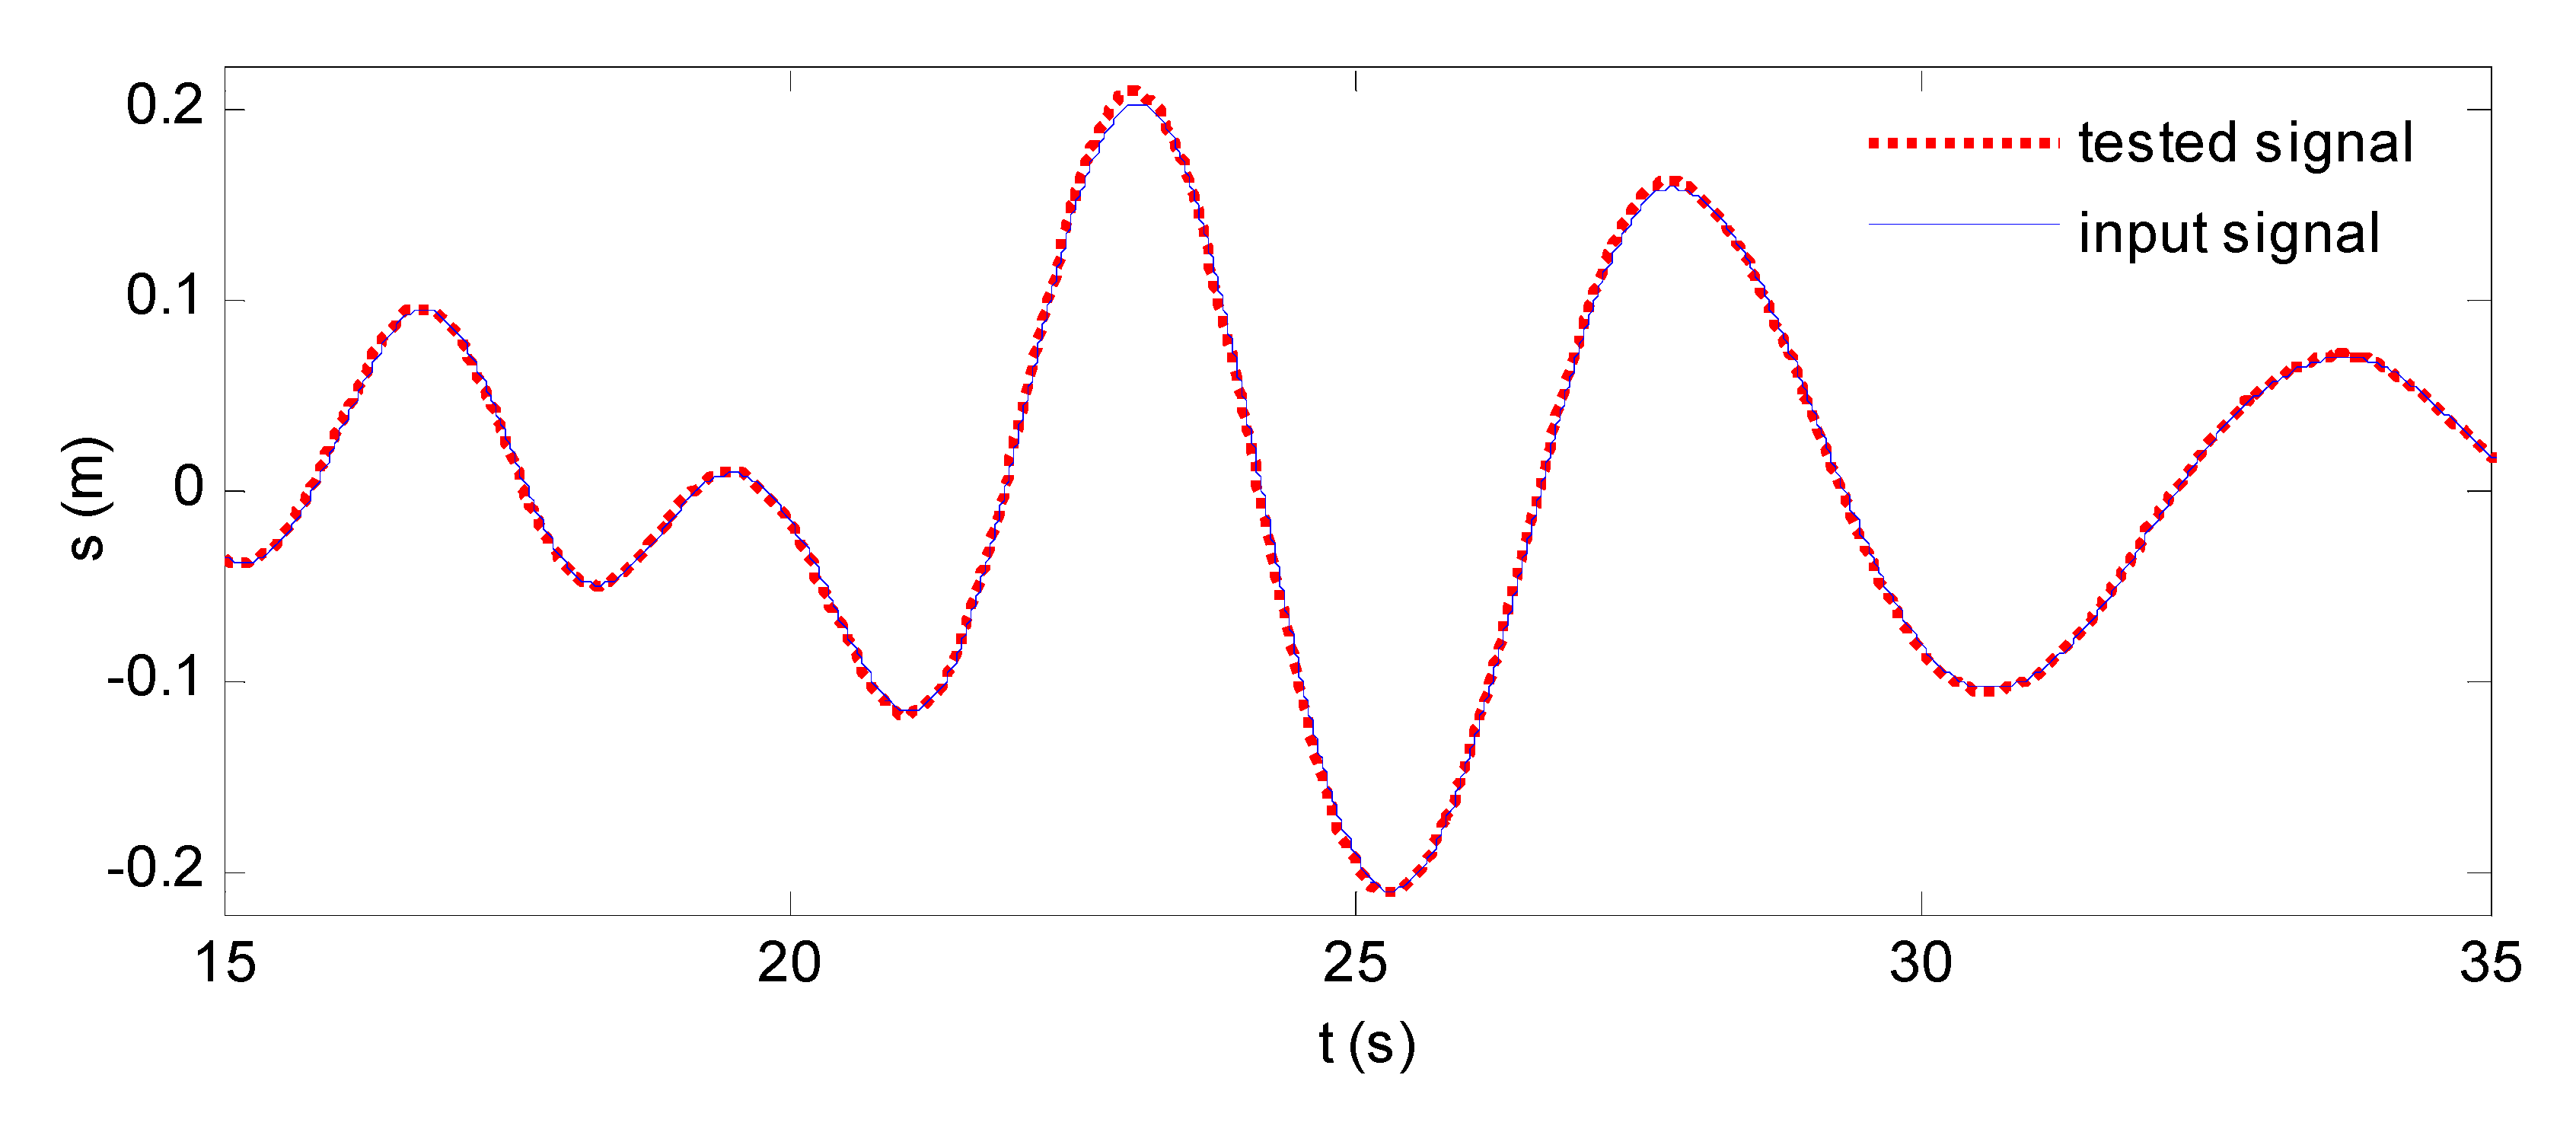
All the tested focusing wave cases in this research are listed in the Appendix A. In order to examine the accuracy of the wavemaker movement controlling system, the hydraulic piston motion of wavemaker is captured and is compared with the input stroke signal. The motion signal comparison of one focusing wave case (i.e., A101f61X50t36 in Appendix A) is plotted in Figure 6, showing that the tested signal has good agreement with the input signal. The maximum relative error is less than 2%.
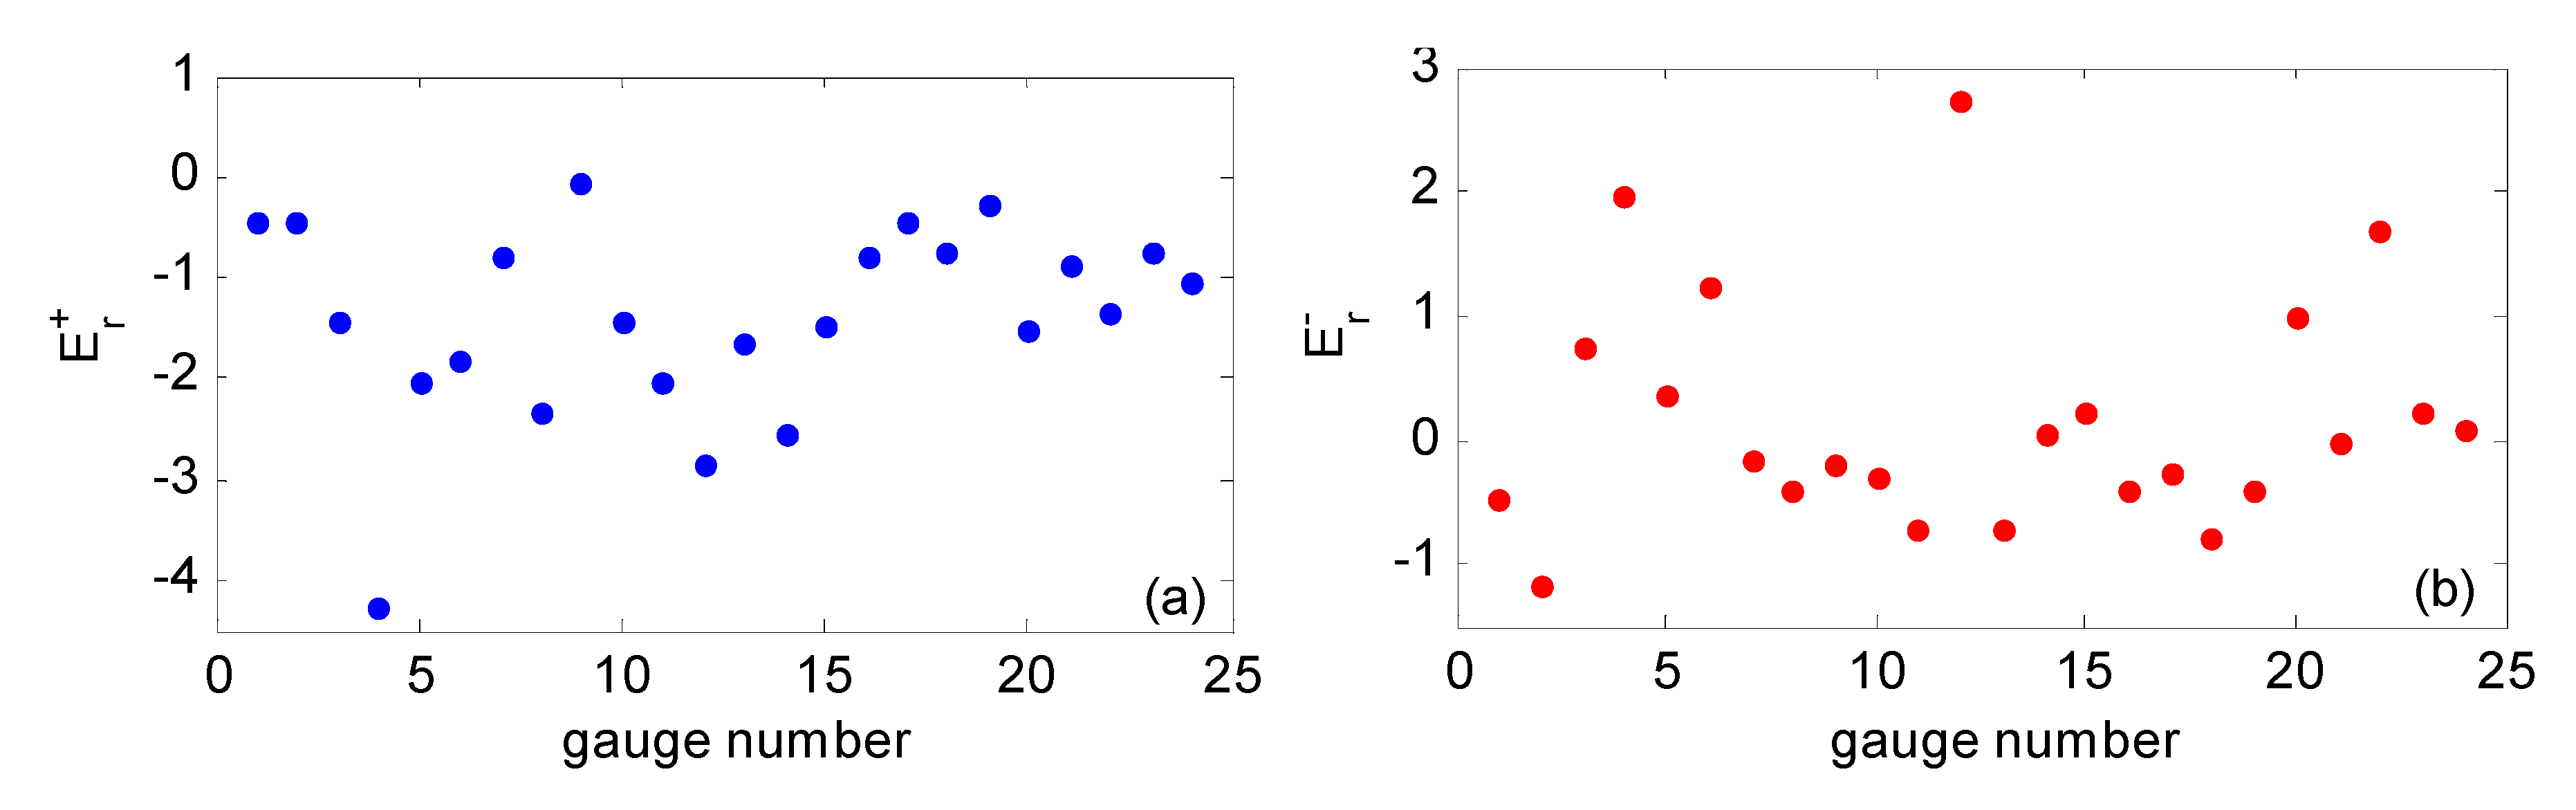
The repeatability of the whole experiment system also has been examined by each wave gauge recording result in the wave tank. All focusing wave cases are repeatedly tested twice and the percentage error of the maximum wave crest elevation (or the minimum wave trough) at each tested position is estimated by
The relative percentage errors of one focusing wave case (i.e., A101f61X50t36 in Appendix A) are illustrated in Figure 7a,b, showing the maximum errors of the tested wave crests and wave troughs are about 4% and 3%, respectively. The rest of the experimental focusing wave cases are also validated by repeating tests and their maximums of Er+ and Er− are both less than 5% [45].
Moreover, the wave modulation instability of the experimental focusing wave cases in this research has also been examined depending on the Benjamin–Feir Index (BFI). The BFI is evaluated by half-frequency width at half maximum of the wave spectrum [46,47]. The corresponding results of all experimental focusing wave cases are summarized in Table A1. We found that the BFIs of the focusing waves are all less than one, which indicates the wave focusing in this research is dominated by the space-time focusing of wave energy, rather than the modulation instability. In the following sections, the effects of the spectrum types and focusing wave parameters will be investigated according to the tested focusing waves. It should be noted that the focusing wave in this study is defined as the wave with the maximum wave crest elevation.
3.1. Wavefree Surface Evolution for QCWA and QCWS Focusing Waves
To compare the evolving processes of the focusing waves generated by QCWA and QCWS spectra, a focusing wave case with parameters of Af = 0.1 m, tf = 36 s, xf = 50 m, ωn = 0.997 rad/s~3.696 rad/s, and N = 32 was tested. The wave amplitude spectra and wave steepness spectra are compared in Figure 8a,b, respectively. It is seen that, the QCWA spectrum provides larger wave amplitudes and steepness for the high-frequency wave components than the QCWS spectrum. This implies the focusing wave generated by the QCWA spectrum will have stronger nonlinearity.
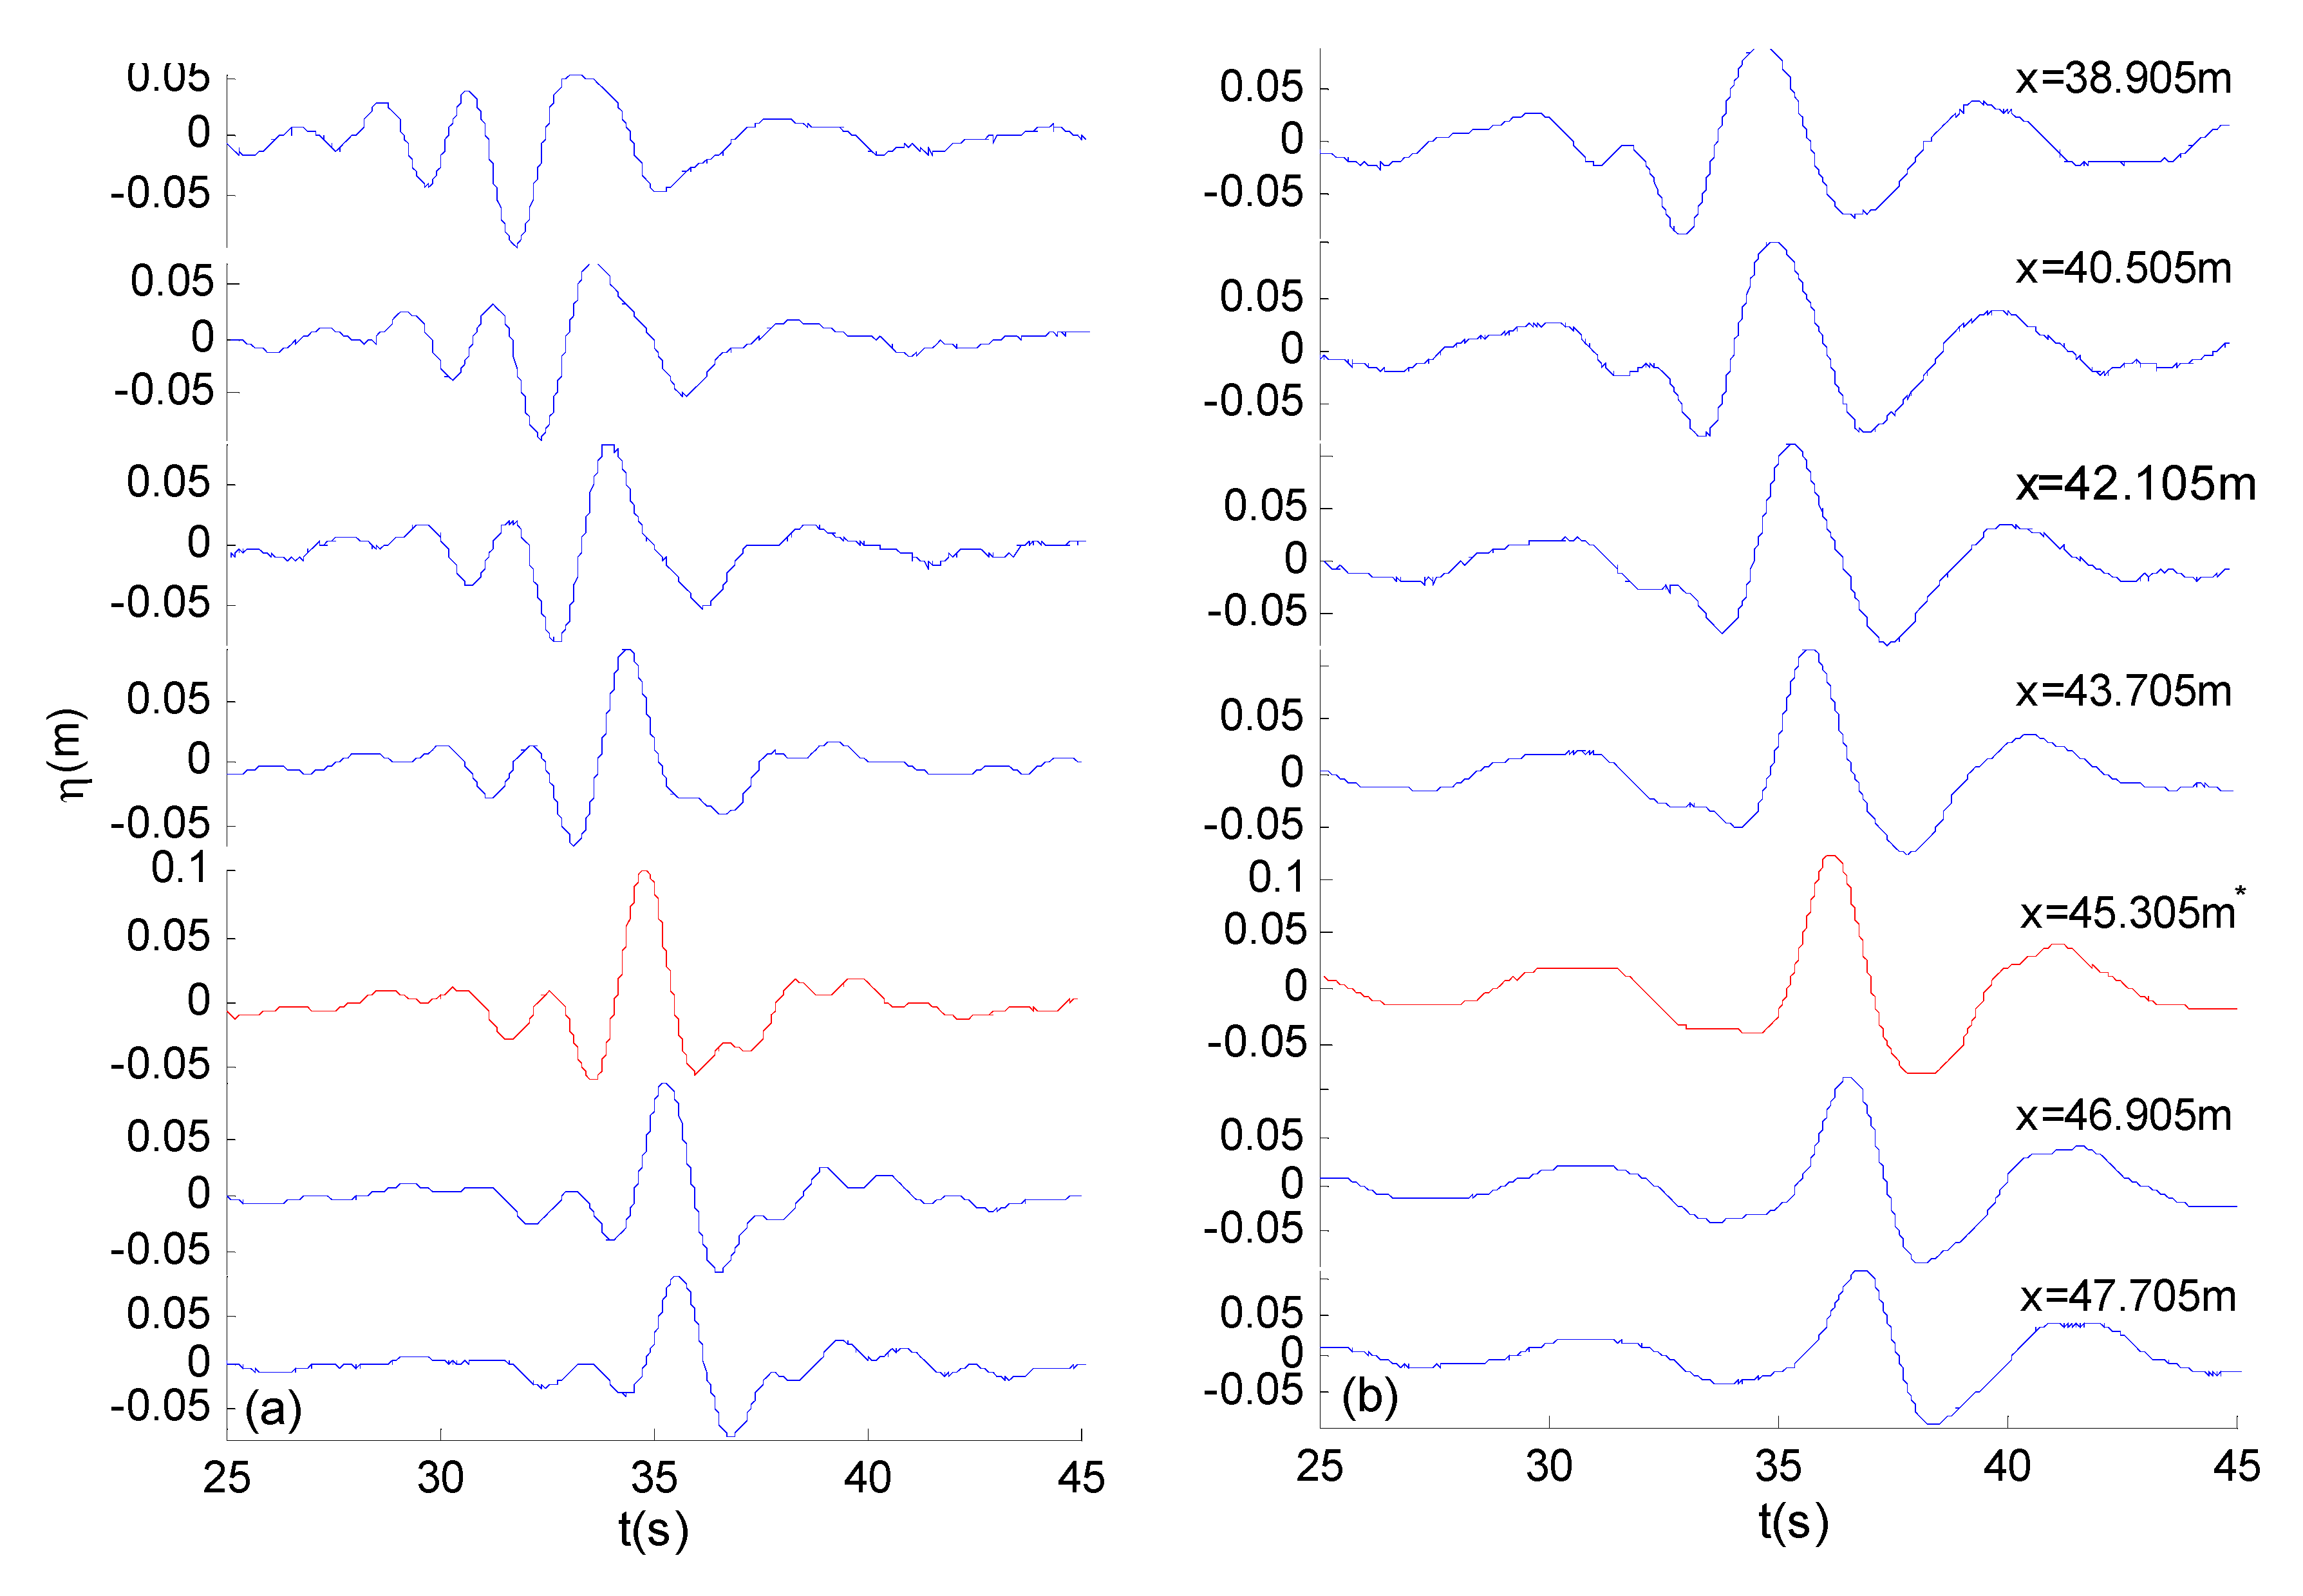
The wave-free surface time histories of focusing waves based on the above two spectra at different positions are plotted in Figure 9a,b showing that the two focusing waves both start from a deep wave trough, followed by the largest wave crest to form the focusing wave. The deep trough then arises and disappears again to complete the wave energy focusing and diffusing [48]. The focusing waves based on the two wave spectra both appear at 45.305 m from the flap, being smaller than the assigned position of 50 m. The shift of the focusing point towards upstream was also observed in the study of the CWA focusing waves [49], while the opposite phenomenon was found in investigations on the CWA and CWS focusing waves by Li and Liu [50]. Hennig and Schmittner [51] pointed out that the shift of focusing point is due to the wave group celerity alteration in focusing wave generation.
Relative to the focusing wave generating instant in their time history curves (the wave-free surface curves of the wave-free plotted by red line), the two focusing wave-free surfaces are both asymmetry, which implies the focusing wave generation shown in Figure 9 is not only a linear superposition process. Comparing time history curves at each testing position in Figure 9, we observe that the QCWA focusing wave-free surface is steeper and deeper, whereas the QCWS focusing wave-free surface shape is flatter and shallower. This is mainly introduced by their wave amplitude spectra differences, as shown in Figure 8. The QCWS focusing wave has more wave energy in low frequency range which determines the overall shape of focusing waves, while the QCWA focusing wave distributes more wave energy in high frequencies which affects the local wave-free surface.
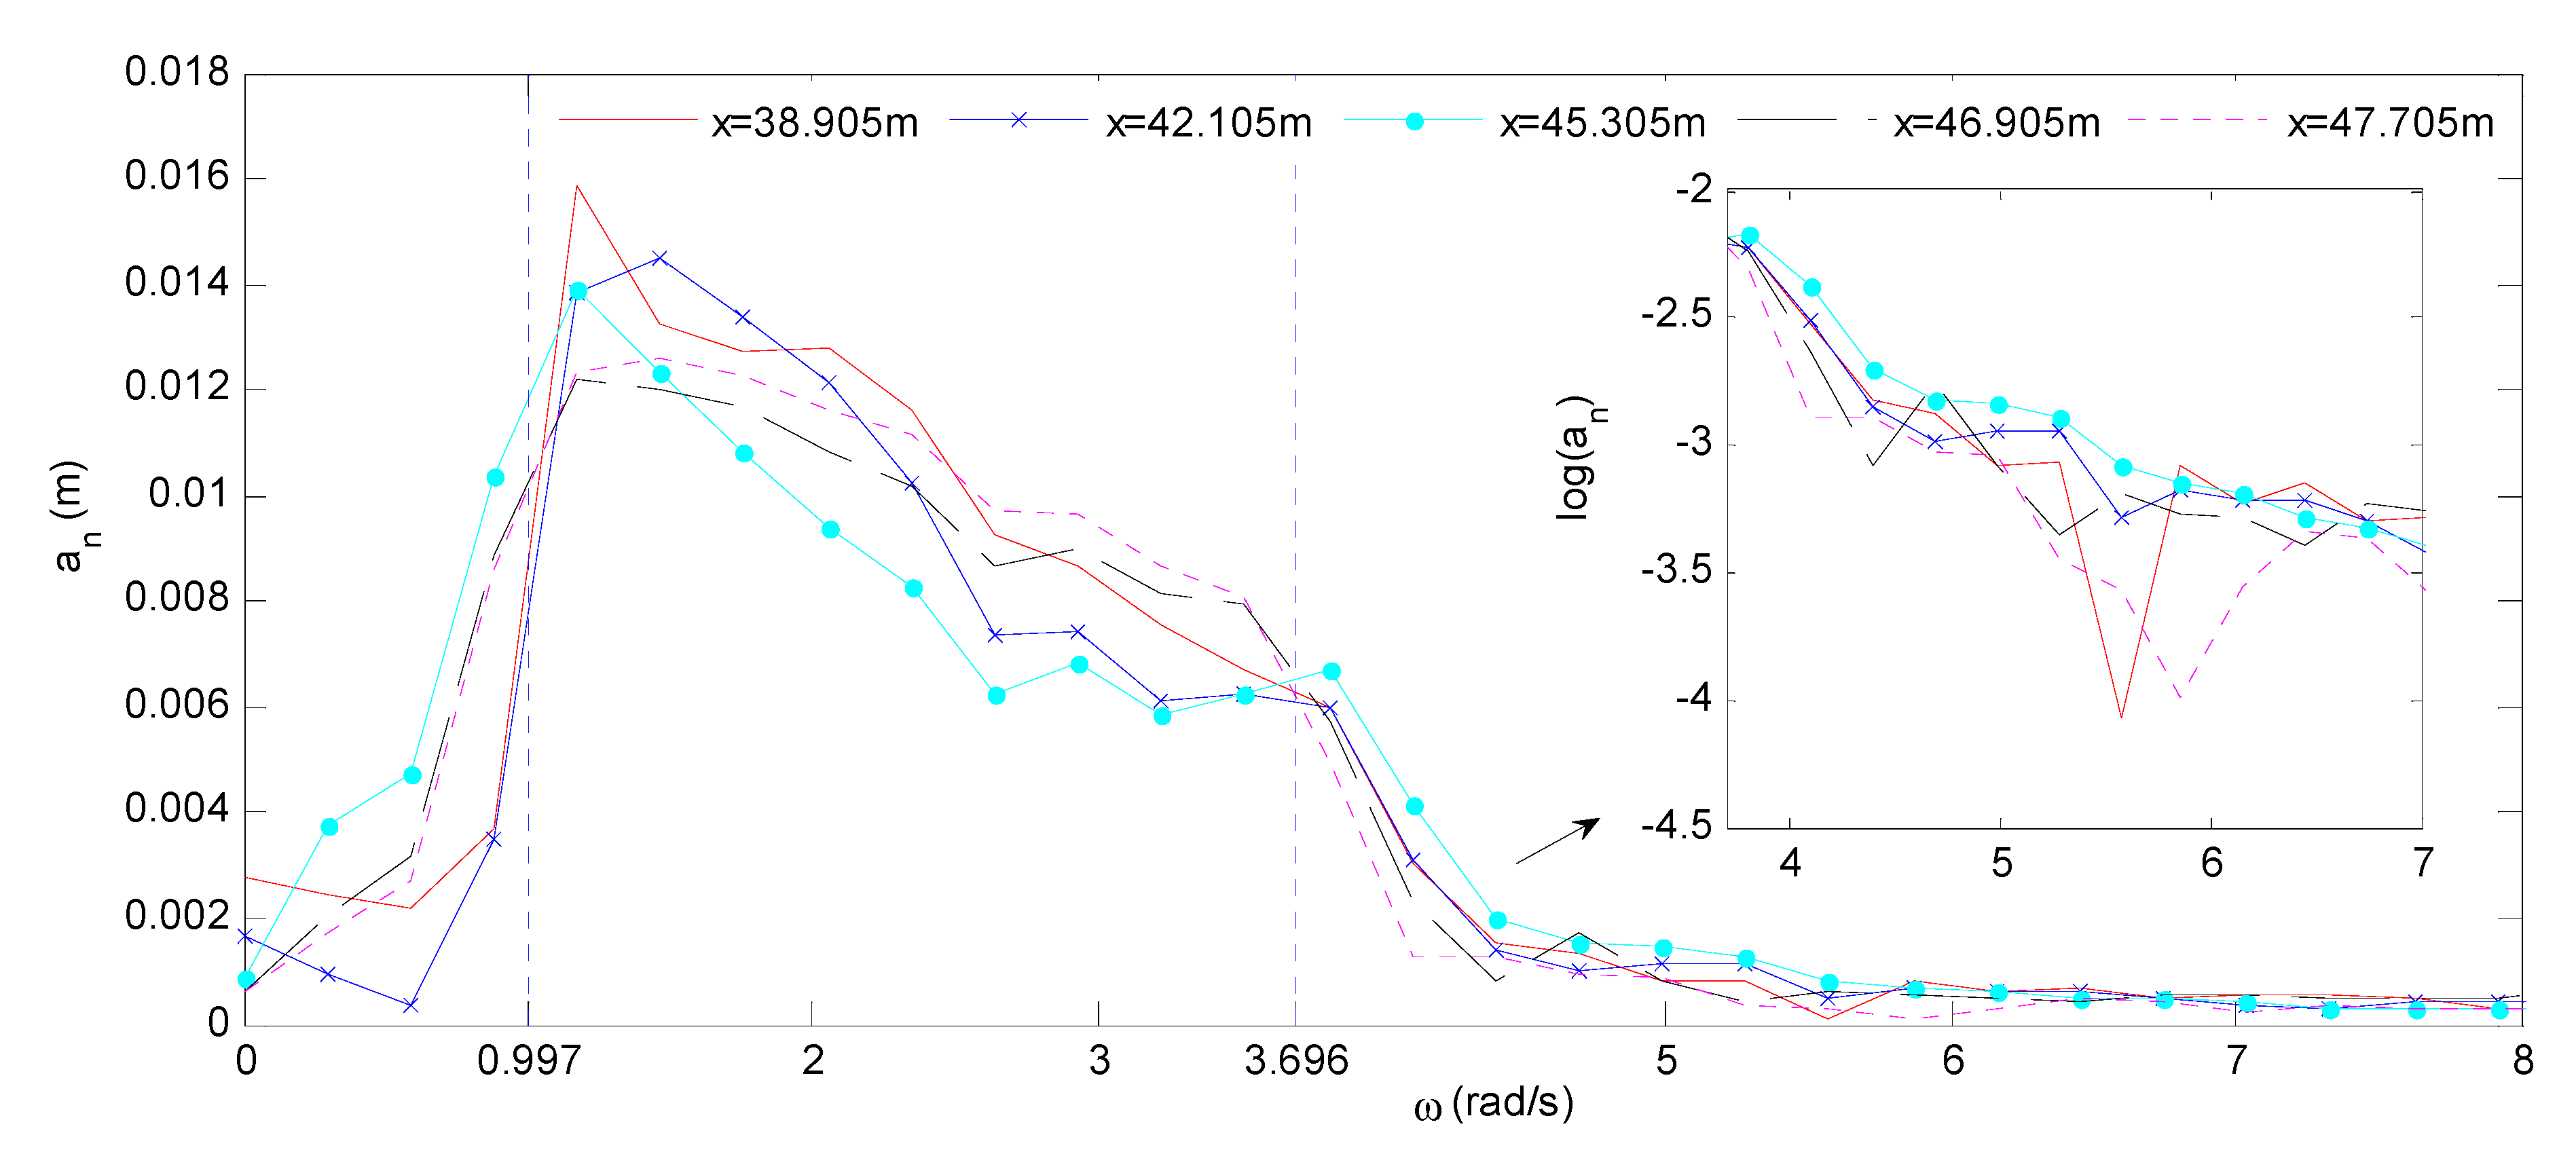
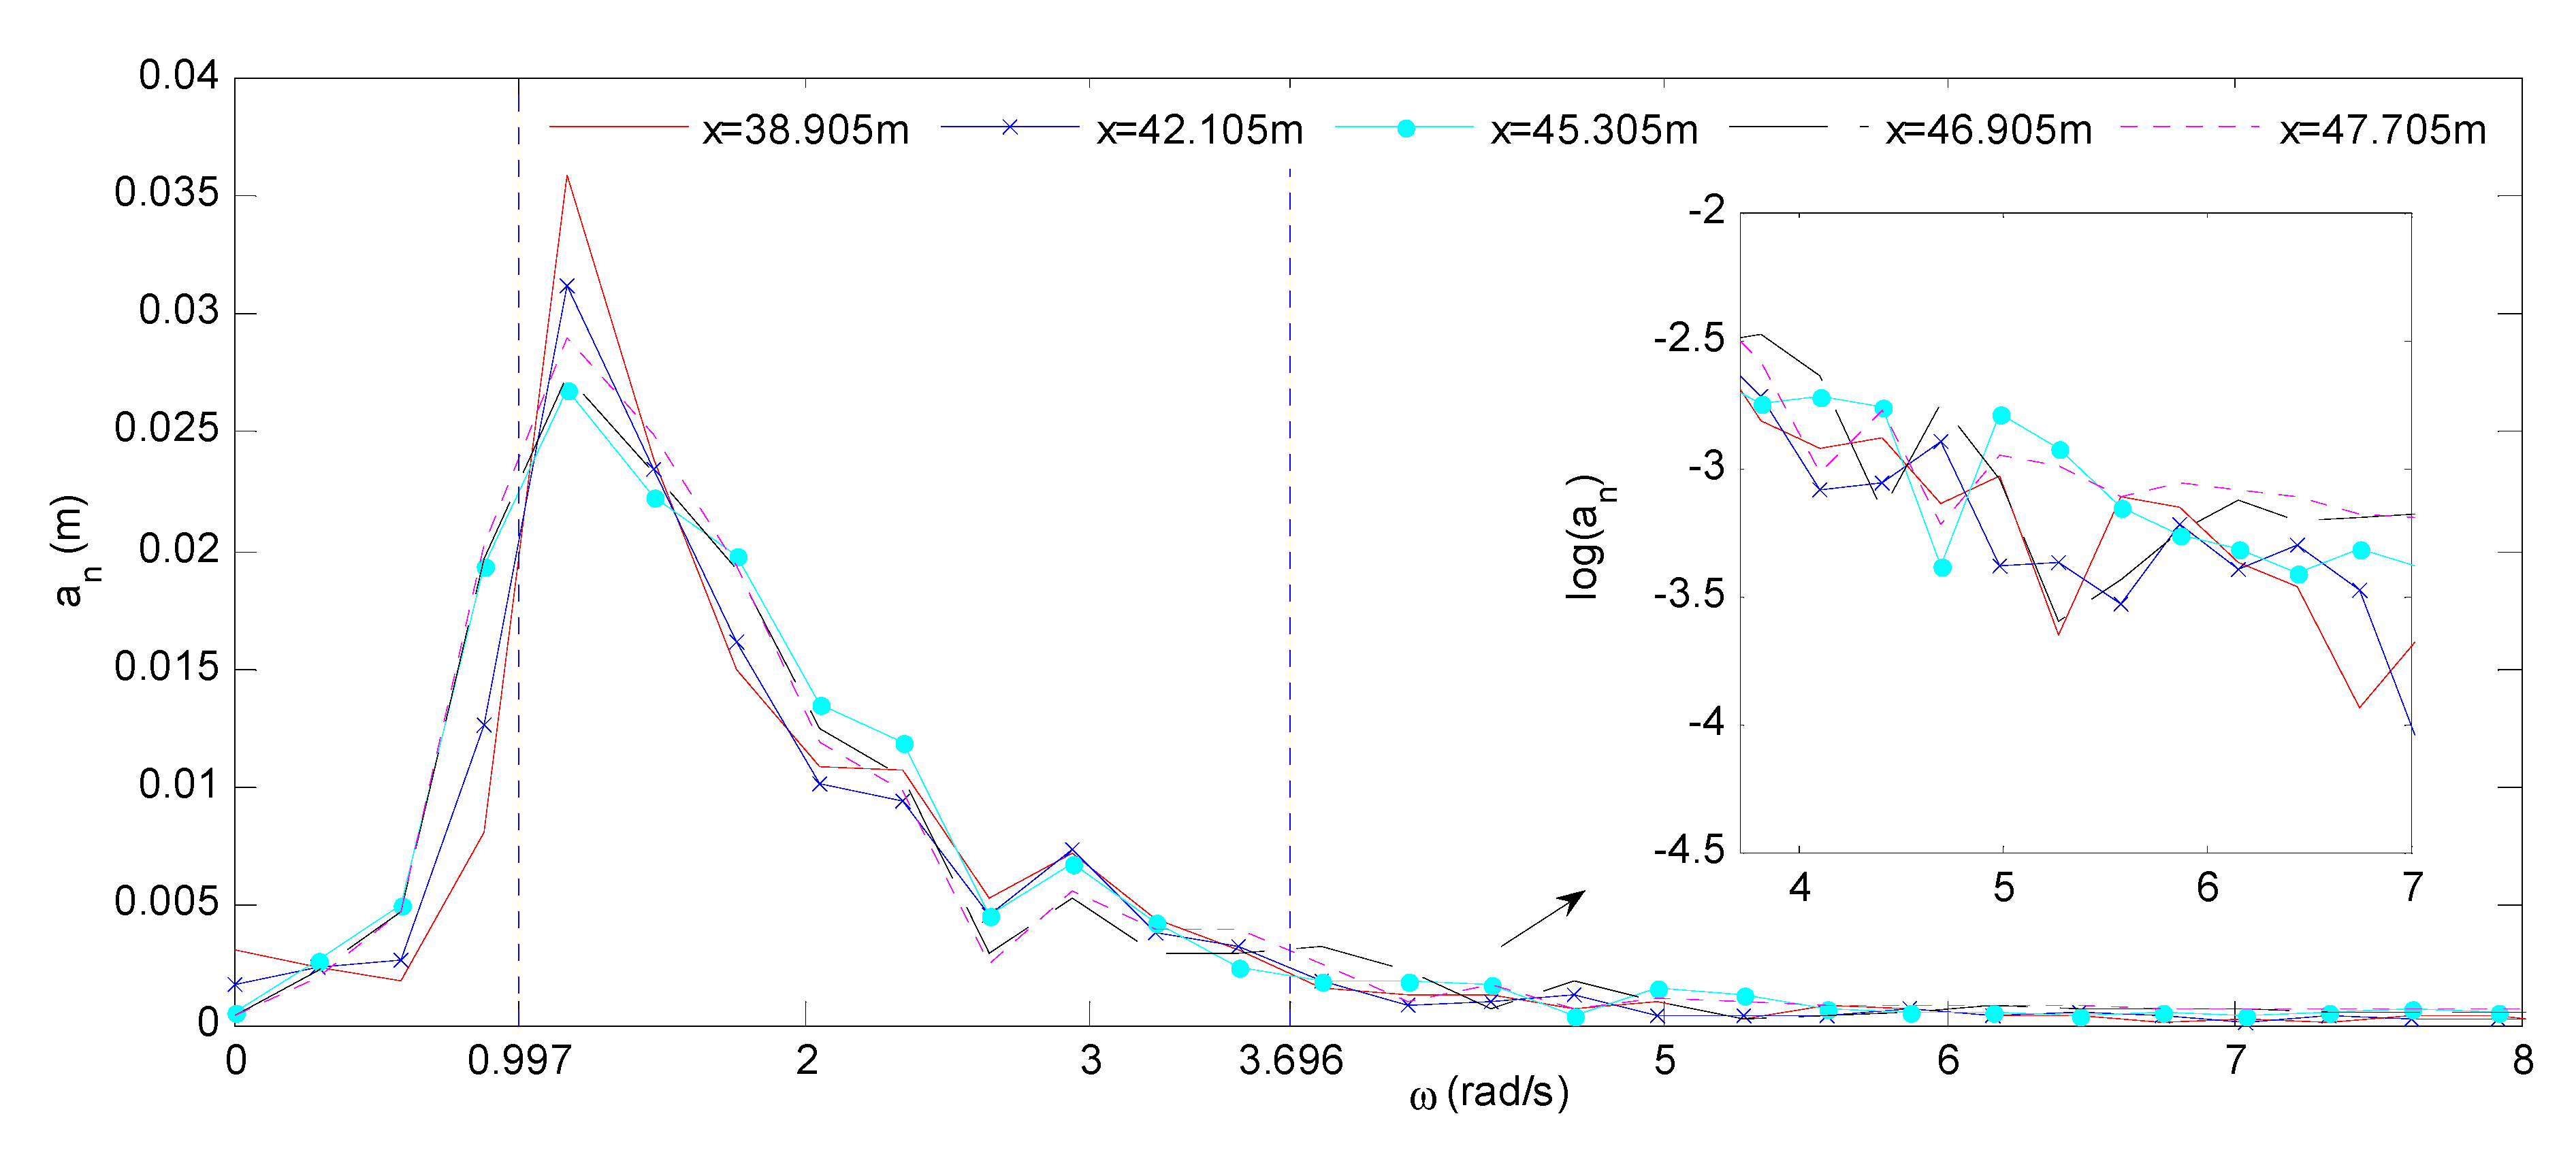
To further analyze focusing wave results from the aspect of the spectrum, the wave component amplitude spectra are calculated via a fast Fourier transform (FFT) analysis based on recording results of wave gauges at different positions. Because of the disturbance of reflective waves, only a limited time length of wave surface recording is available in FFT. It should be noted that the resolution of wave spectra calculated by FFT is lower than the input wave spectra. From the FFT results shown in Figure 10 and Figure 11, it is clearly seen that the extra lower-frequency (<0.997 rad/s) and higher-frequency harmonics (>3.696 rad/s) are generated in generating processes of focusing waves. The higher-frequency components are mainly the second-order harmonics (3.696 rad/s~7 rad/s). These higher-frequency harmonics of the QCWA spectrum continually become larger and the wave components in input frequency range reduce as the wave group approaches the focus position. Nevertheless, one opposite result is found when the wave group passes the focus position. For the wave spectra variation of the QCWS focusing wave shown in Figure 11, it is observed that the apparent variation of wave component amplitudes occurs within the input frequency range (i.e., the wave energy is redistributed in input wave frequency).
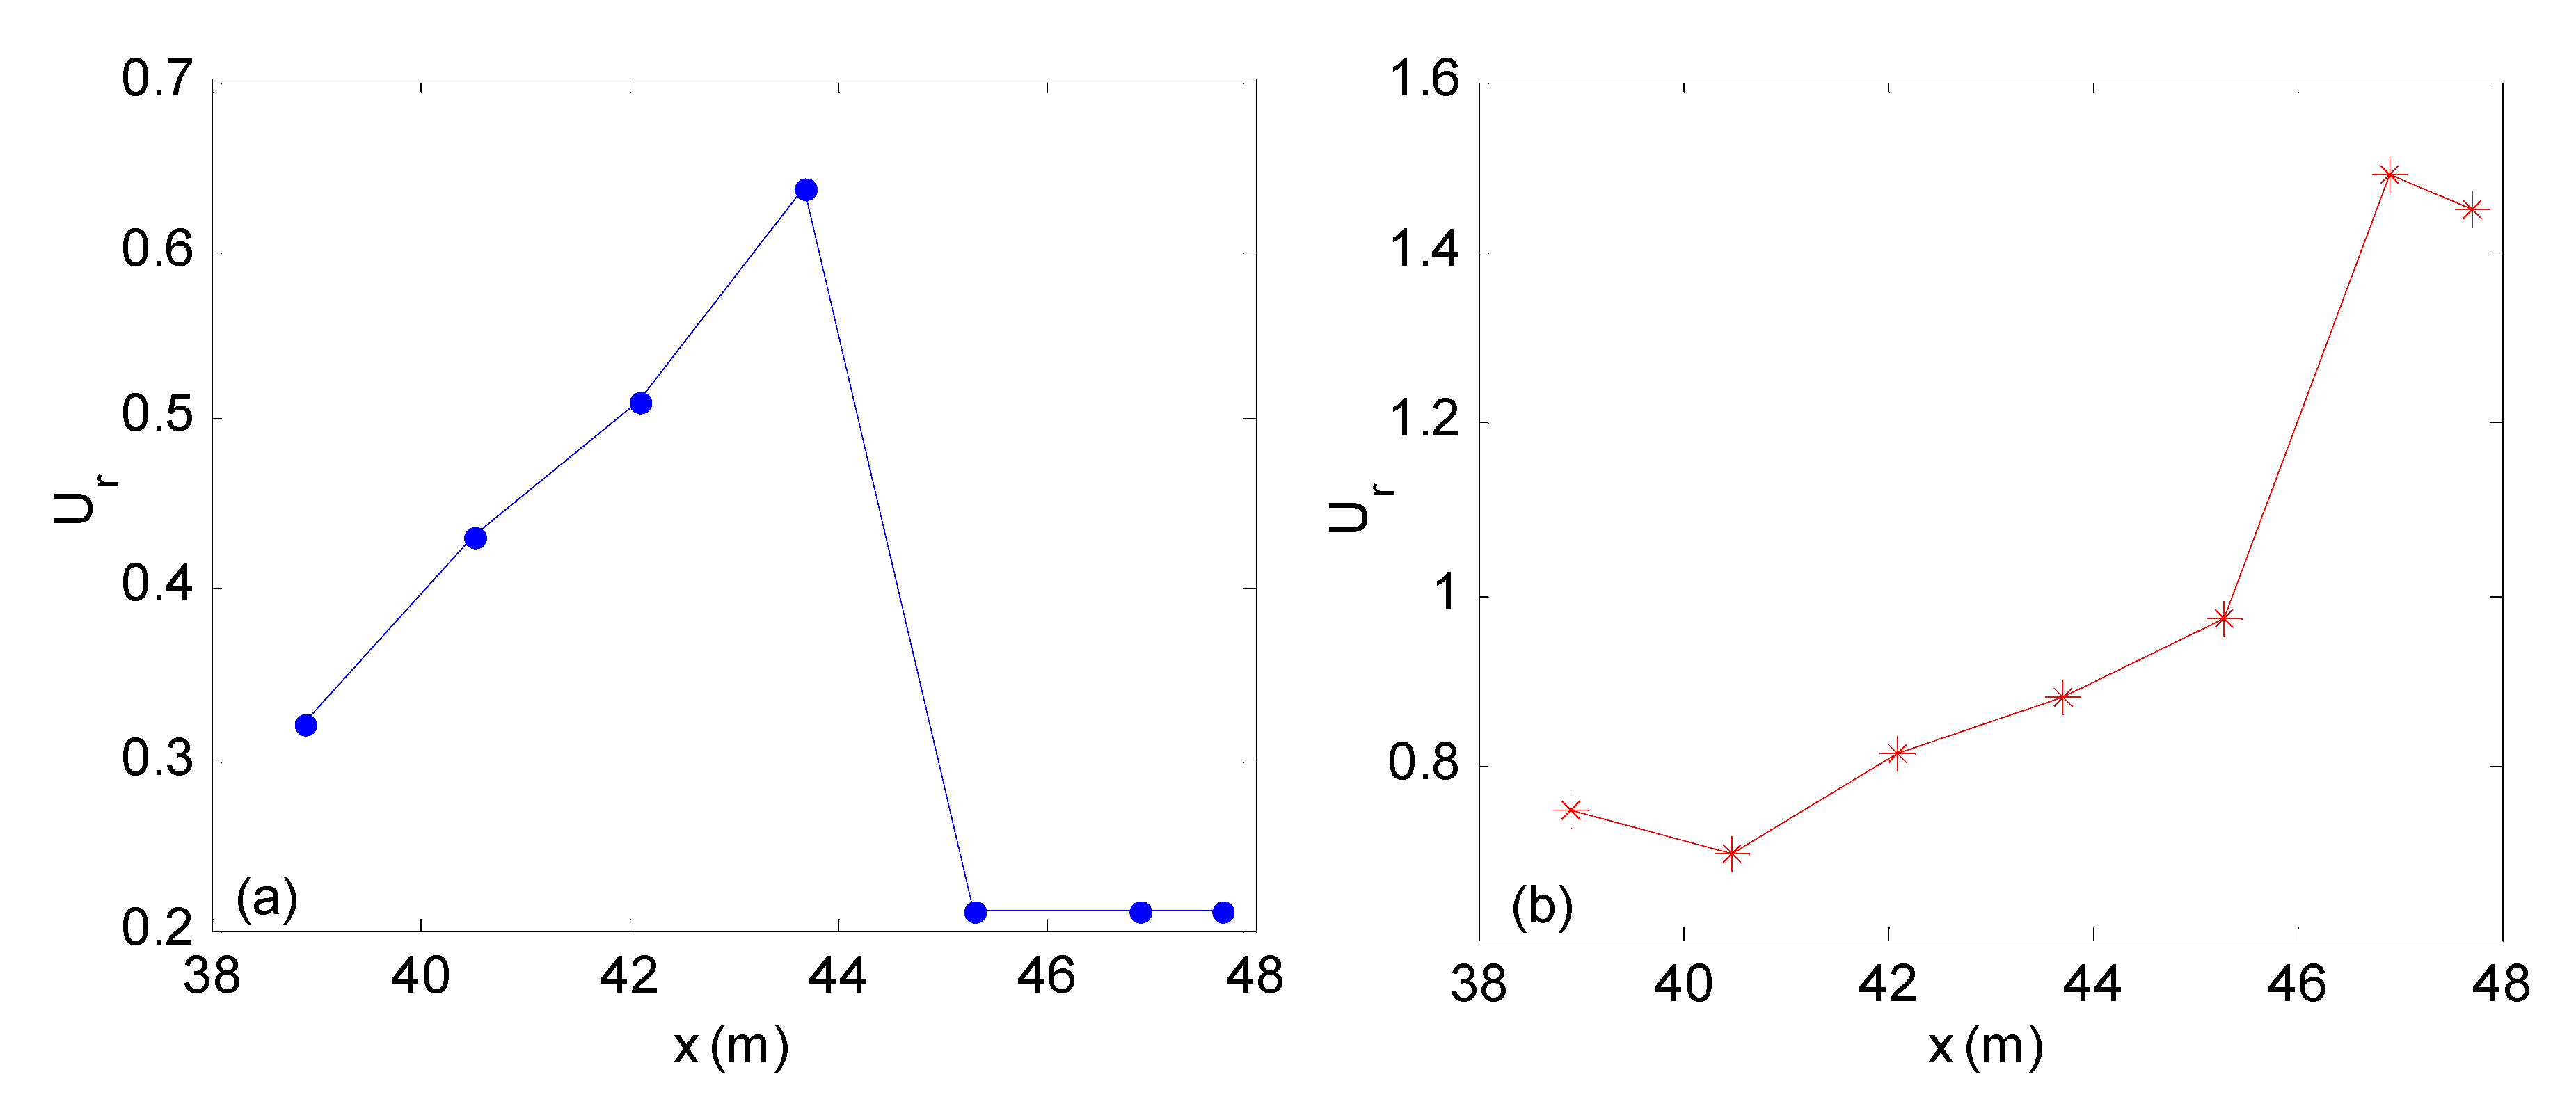
Moreover, for qualitatively identifying the nonlinear effects on focusing wave generation, the local Ursell number at each testing location is calculated by:
The Ursell numbers at different positions are plotted in Figure 12a,b respectively for the QCWA focusing wave and the QCWS focusing wave. From Figure 12a, it is seen that the Ursell number arrives at the maximum as the wave group approaches the focus position, which implies that the wave nonlinearity plays an important role in the QCWA focusing wave generation. This is also observed through the extra higher-order harmonics’ variation at different positions, as shown in Figure 10. However, from Figure 12b, one can observe that the Ursell number of the QCWS focusing wave keeps rising although the wave group has passed the focus position. It is deduced that the QCWS focusing wave generation is probably dominated by wave components in input frequency range. Additionally, the extra higher-order harmonics have smaller amplitudes in wave spectra of Figure 11 which could be considered as evidence of this deduction.
3.2. Focusing Wave Generation under Different an and ωn Parameters
The QCWA and QCWS focusing waves with different frequency ranges are generated in the physical wave tank. The required maximum displacements (i.e., Smax) of hydraulic piston are summarized in Table 1. For wave groups 1-1 and 2-a, their maximum displacements of hydraulic piston both increase with their lower bonds of wave frequencies being extended, whereas, when the upper bonds of the frequency decrease, for wave groups 2-a, 3-b and 4-c, the corresponding maximum displacements also increase. These comparisons indicate that focusing waves with more low-frequency wave components require wider wavemaker stroke range.
By comparing the maximum displacements of the QCWA and QCWS focusing waves in each group, we find the QCWS focusing wave requires wider movement range of the wavemaker and this difference becomes more obvious when the frequency range gets wider. For the example of the focusing wave group 1-1 in Table 1, the maximum displacement of the QCWS focusing wave is almost twice that of the QCWA focusing wave. Therefore, the QCWA spectrum is more effective for the generation of focusing waves containing a wider frequency range from the aspect of the wavemaker stroke.
The generated focusing wave crest elevations of the last three experimental groups (i.e., groups 2-a, 3-b, 4-c, in Table 1) are plotted in Figure 13a. The wave crest elevations from the two spectra both raise when their frequency upper bounds are decreased. A similar relationship between the frequency bandwidth and the focusing wave crest elevation is also found in experimental results of the CWA focusing waves [19] and in numerical investigations [24]. We infer that the wave crest elevation is significantly affected by the wave frequency bandwidth but slightly affected by the type of wave amplitude spectrum, as shown in Figure 13a.
Figure 13b compares focusing positions of the QCWA and QCWS spectra. We observed that both waves focus closer to the flap, with the frequency bandwidth narrower. At the same time, the above results also demonstrate that the focusing position changes with the corresponding central frequencies. Li and Liu [50] presented an opposite correlation between focusing position and frequency bandwidth for the focusing waves based on CWA and CWS spectra, but the correlation between the focusing position and the central frequency in their work is similar to that illustrated in Figure 13b. The comparison of the two tested spectra in this study, showed that the focusing position of the QCWA focusing wave is a bit farther from the flap. Therefore, if a focusing wave with a larger wave crest elevation and a farther location from wavemaker is required, the QCWA spectrum is better than the QCWS. In addition, the QCWA focusing wave can also include a wider frequency range for a specific wavemaker with the fixed stroke range, according to Table 1. The QCWA focusing waves will be further investigated in the following sections.
3.3. Focusing Wave Generation under Different Af and xf Parameters
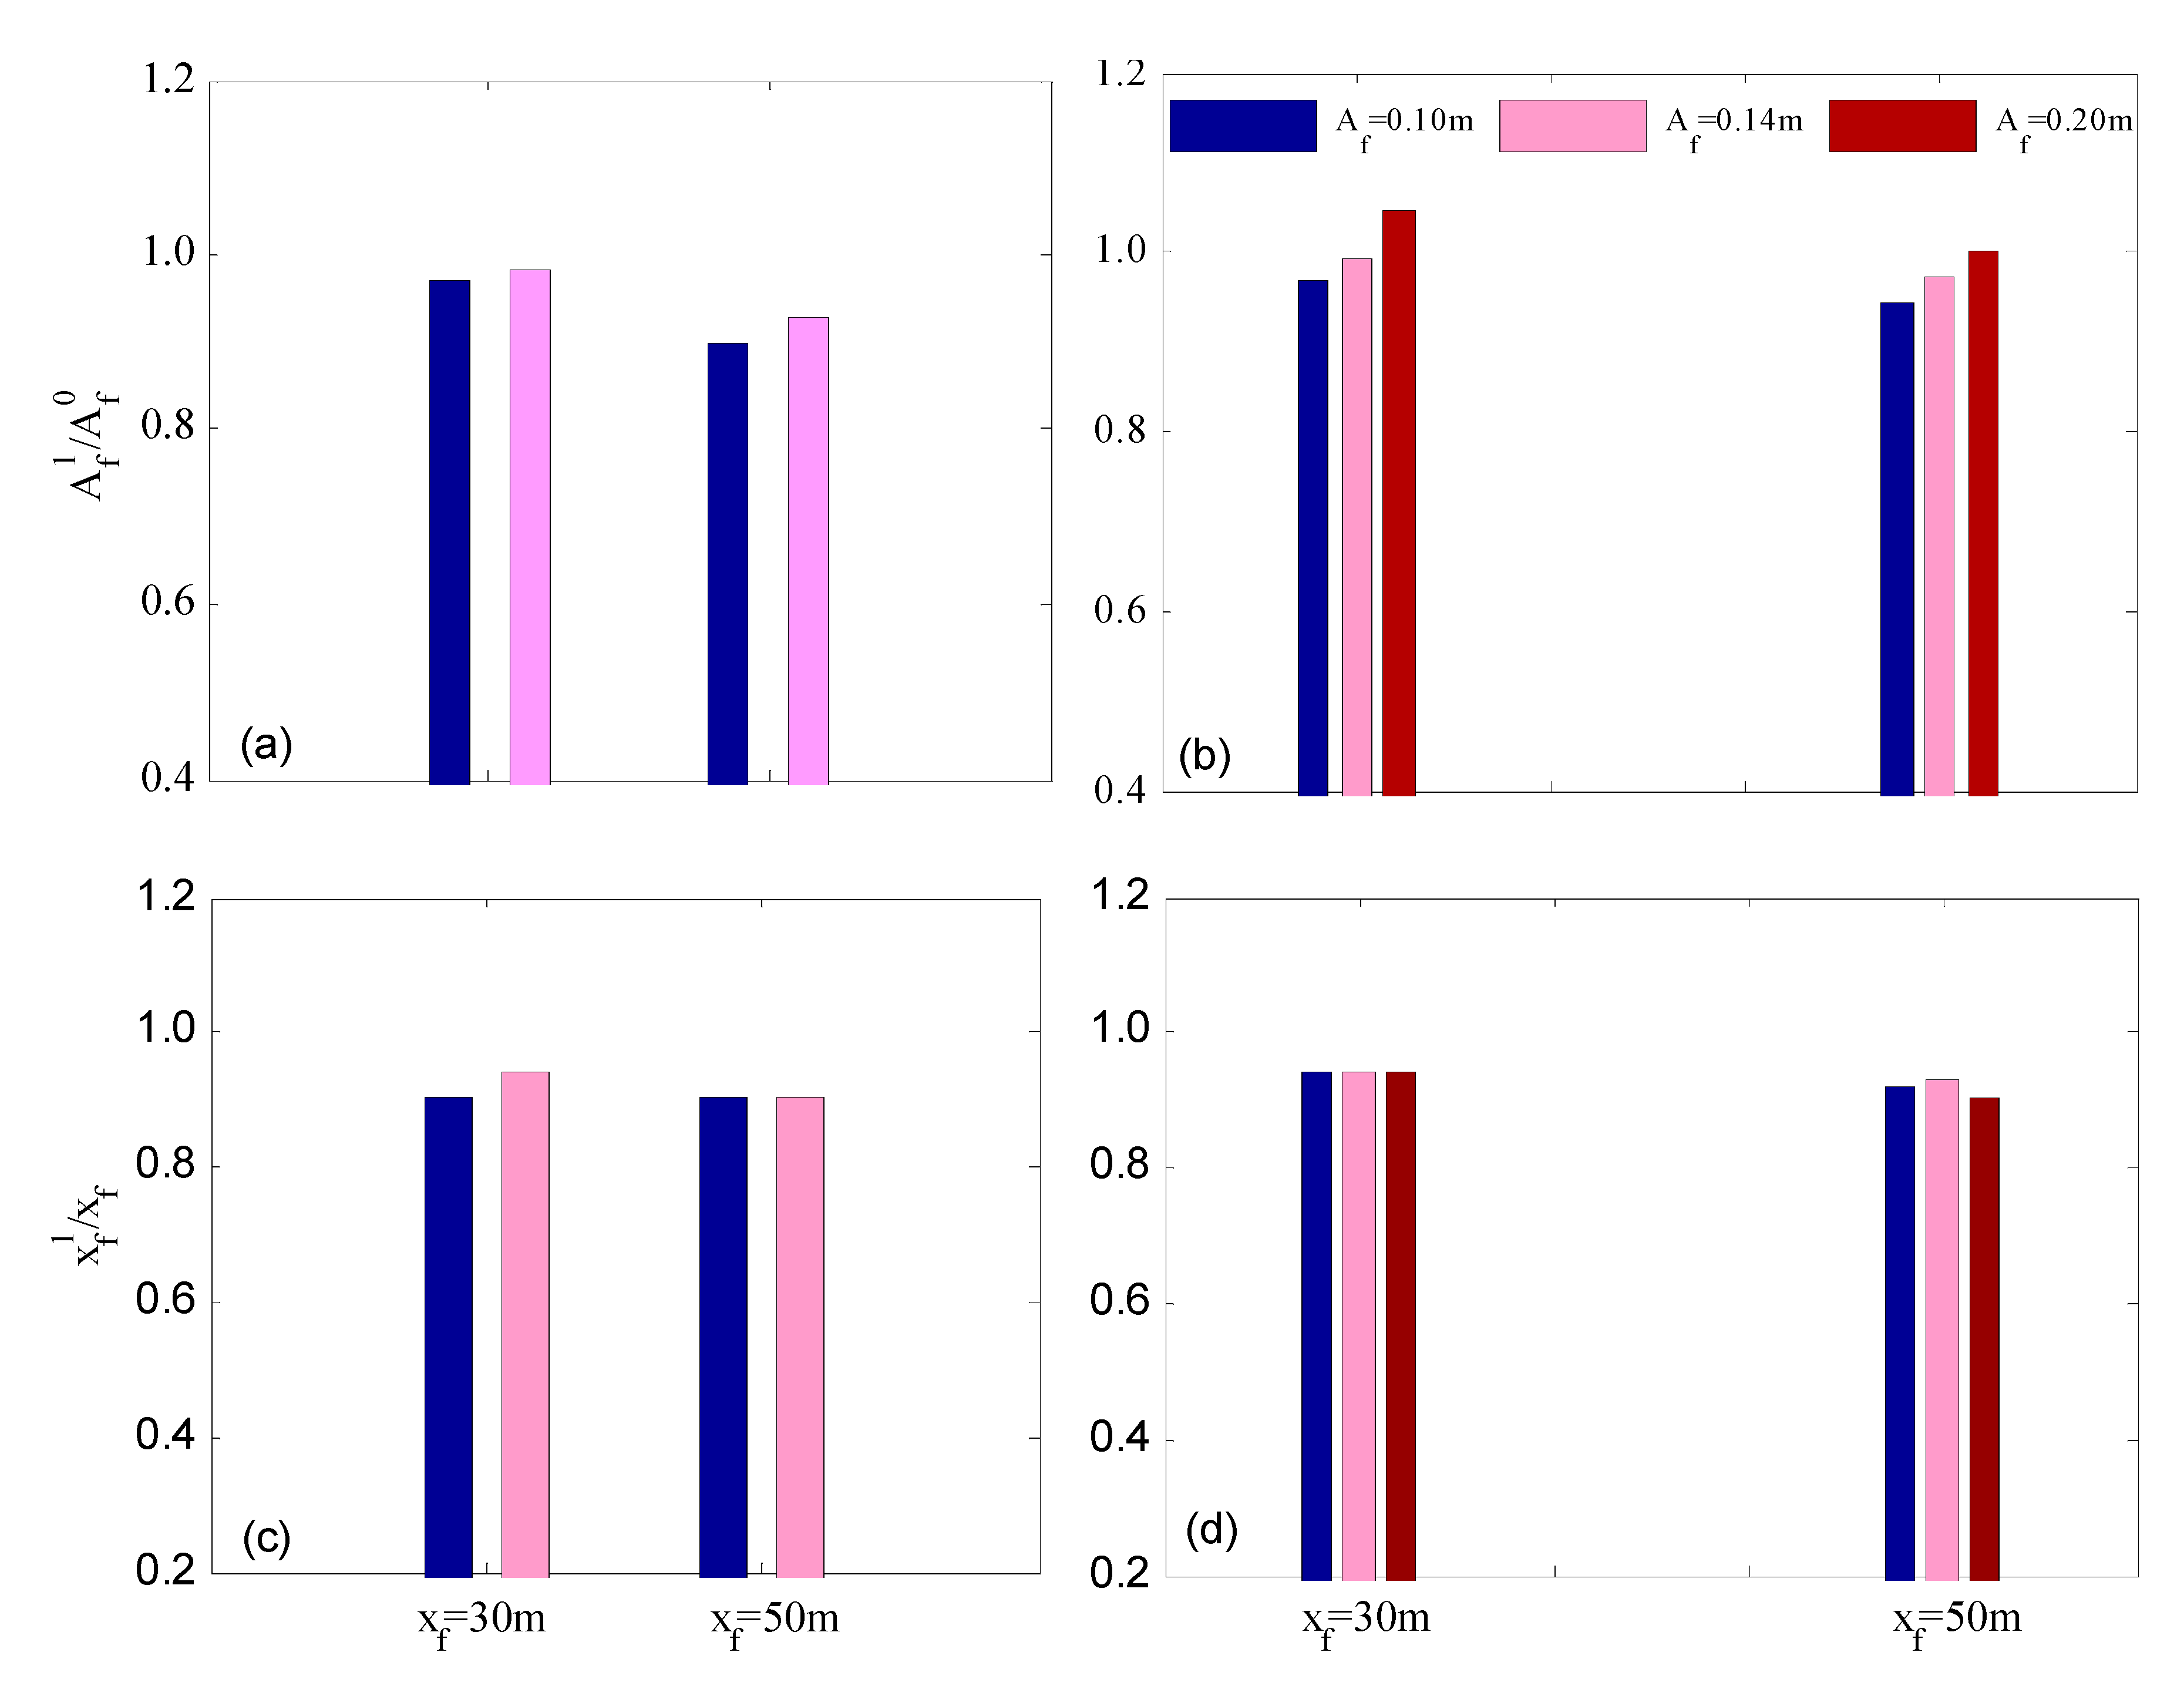
In order to investigate the effect of Af and xf on the generating results, focusing wave groups with two different wave frequency ranges are tested in a physical wave tank. In the first experiment group, ωn = 0.997 rad/s~3.696 rad/s and Af is chosen as 0.1 m and 0.14 m. For the second group of focusing waves, ωn is varied from 1.336 rad/s to 3.142 rad/s with three wave crest elevations, i.e., Af = 0.1 m, 0.14 m, and 0.20 m. All these focusing waves are tested at two different focusing locations, i.e., xf = 30 m and xf = 50 m. The focusing time parameter tf and wave component number N are assigned as 36 s and 32.
Figure 14a,b illustrates tested focusing wave crest elevations under different Af and xf parameters. The generated relative wave crest elevations increase nonlinearly with Af being larger at both specified focusing locations, i.e., the increasing ratio is not a constant. The same conclusion can be also drawn from the comparison of the CWS and CWA focusing waves by Li and Liu [50] and in experimental investigations on the CWA focusing waves by Baldock et al. [19]. The wave crest elevation increase is generally attributed to the generated nonlinear wave components (i.e., extra higher-frequency components) produced in focusing wave generation. By maintaining Af and varying xf parameter from 30 m to 50 m, it is seen that the tested focusing wave crest elevations show a slight decrease in Figure 14a,b. This may be because the wave energy does not fully focus at the assigned location or a small portion of wave energy is dissipated in focusing wave propagation.
Figure 14c,d demonstrates the actual positions of focusing waves with two wave frequency ranges. As for focusing wave cases with ωn = 0.997 rad/s~3.696 rad/s, the larger wave elevation Af results in a forward moving of the focusing point. But the focusing wave group with the other frequency range shows an inversed changing trend. Despite the irregular focusing position variation existing, the overall shift of the focusing position is moderate and the waves approximately focus at 0.9 × xf in the physical wave tank.
3.4. Focusing Wave Generation under Different xf and tf Parameters
A series of focusing wave cases are tested against various focusing position and time parameters with a fixed amplitude of Af = 0.1 m. The total number of wave components is 32 and the wave component frequency ωn is varied from 1.336 rad/s to 3.696 rad/s. The focusing time parameter is, respectively, set as 25 s, 30 s, and 36 s at each focusing position of xf = 30 m, 40 m, and 50 m.
The measured crest elevations of focusing waves are illustrated in Figure 15a. It is found that when xf = 30 m the wave crest elevations are almost the same for three focusing times and they are about 10% higher than the expected wave crest elevations (i.e., Af0). As the focusing position parameter is increased to 40 m, the generated wave crest elevations with tf being 30 s and 36 s basically stay the same as those tested at xf = 30 m. However, the wave crest elevation with tf being 25 s shows a significant drop. When the focusing position is further increased to 50 m, the wave crest elevations highly depend on the focusing time parameter and they significantly increase from about 0.6 to 1.0 as the focusing time parameter ranges from 25 s to 36 s. Comparing the wave crest elevations under three different xf parameters, it is found that the wave crest elevations with the focusing time tf being 25 s and 30 s both show a decreasing trend as the focusing position is changed from 30 m to 50 m. Nevertheless, when the focusing time is increased to 36 s, the generated focusing wave crest elevations are largely maintained as the focusing position parameter varies. We deduce that only when the focusing time parameter tf exceeds a threshold, i.e., about 36 s for this testing case, the expected wave crest elevation can be easily achieved in the physical wave tank.
Figure 15b compares the actual focusing positions against theoretical focusing positions under different focusing times. We observed that experimental focusing waves appear in the position of about 0.9 × xf from the flap, as the focusing time tf is 30 s or 36 s. When the focusing time decreases to 25 s, the ratio of actual and assigned positions is below one and it becomes smaller as the given xf increases from 30 m to 50 m. Thus, according to above analysis, a sufficient time length tf for focusing wave generation is suggested to achieve smaller deviation of the actual focusing position.
To find the relationship between the focusing position, xf, and the focusing time, tf, from the wave energy aspect, the required minimum focusing time tcr, i.e., the time for the highest-frequency wave component energy propagating to the specified focusing position, is calculated by the linear wave theory. As for xf being specified to be 30 m, 40 m, and 50 m, the calculated tcr are 22.59 s, 30.12 s, and 37.65 s, respectively. According to the comparison between the tf parameters of the above focusing wave cases and their corresponding tcr results, we deduced that the smaller wave crest elevation and the forward shift of focusing positions, as seen in Figure 15, result from the wave energy not being completely focused at the specified positions. Therefore, for focusing wave generation in a physical wave tank, the assigned time parameter tf should be longer than tcr as predicted by linear wave theory. It should be noted that for focusing wave cases with large crest elevation the time parameter, tcr, predicted by the linear wave theory may not be applicable due to strong wave nonlinearity.
4. Conclusions
In this paper, two new wave amplitude spectra (i.e., the QCWA and QCWS spectra) used for focusing wave generation in a wave tank have been formulated and experimentally tested. With fixed wave energy, the amplitude and steepness of wave components in these two wave spectra are adjustable. Focusing waves have been generated in the physical wave tank by modifying the wave generator signal through adding two extensions at the beginning and terminating stages. A series of focusing waves based on the two newly-proposed wave amplitude spectra are tested in physical wave tank, demonstrating that by comparing with the QCWS spectrum the focusing waves generated based on the QCWA spectrum can achieve larger wave crest elevation, and are focused further downstream away from the wavemaker. Additionally, to generate a focusing wave with the same wave parameters, the QCWA spectrum requires a smaller wavemaker movement range. The spectral analysis results show that the wave nonlinearity plays an important role in the QCWA focusing wave generation, whereas the redistribution of wave energy in input frequency range significantly affects the focusing wave generated by the QCWS spectrum. It is also found that two spectra have similar effects on wave crest alternation through adjusting wave frequency range and wave crest elevation parameter, whereas actual focusing positions are highly dependent on the type of the wave spectrum.
Experimental investigations on space-time parameters have also been carried out. We found that the space parameter, xf,, and the time parameter, tf,, jointly affect the generated focusing wave crest elevation and focusing position. The focusing time parameter is constrained by a critical value, which could be predicted by linear wave theory for linear or weakly nonlinear focusing waves. On the basis of this research, future work should be carried out on strongly nonlinear focusing wave generation using these two newly formulated spectra and investigating the effects of the space-time parameters on focusing waves with large-crest elevation.
Author Contributions
Investigation, G.X.; validation, H.H.; supervision, Q.M.; writing—original draft; writing—Review and Editing, Q.G.
Funding
The National Natural Science Foundation of China (grant No. 51739001 and No. 51909125), the Zhejiang Provincial Natural Science Foundation of China (grant No. LY17A020002), and the Ningbo University Science Foundation (grant No. XYL19030).
Acknowledgments
The authors want to thank Fenglai Li and Shizhou You, working in towing wave tank of the Harbin Engineering University. They provided help and support for the focusing wave experiments.
Conflicts of Interest
The authors declare no conflicts of interest.
Nomenclature
| H | water depth | g | gravitational acceleration |
| kn | wave number | s0(t) | the inserted auxiliary signal |
| t0 | time length of s0(t) | an | wave component amplitude |
| μj | base function of s0(t) | η | wave-free surface elevation |
| tf | focusing time parameter | xf1 | the tested focusing position |
| N | wave component number | xf | focusing position parameter |
| χ | the coefficient matrix of s0(t) | ωN | the maximum wave frequency |
| tcr | the minimum focusing time | S(t) | Hydraulic piston stroke signal |
| ωn | wave component frequency | γ | the controlling parameter of s0(t) |
| ω1 | the minimum wave frequency | Af | focusing wave elevation parameter |
| Af1 | the tested focusing wave crest elevation | ||
| Er+(−) | the percentage error between η1+(−) and η2+(−) | ||
| s′0(t0)/s″0(t0) | the first- and second-order derivatives of s0(t) | ||
| ηmax | local maximum wave crest of tested focusing wave | ||
| s(0)/s′(0)/s″(0) | initial displacement, velocity, and acceleration of hydraulic piston | ||
| Af0 | focusing wave crest elevation predicted by linear wave theory | ||
| H0 | distance from hydraulic piston to wavemaker flap rotating shaft | ||
| H1 | distance from still water surface to wavemaker flap rotating shaft | ||
| Fn | transfer function between wave component and hydraulic polar stroke | ||
| η1+(−)/η2+(−) | the first and second tested focusing wave elevation (+, maximum; −, minimum) | ||
| λ | local wavelength computed by local wave period of tested focusing wave | ||
| CWS | constant wave steepness | QCWS | quasi constant wave steepness |
| CWA | constant wave amplitude | QCWA | quasi constant wave amplitude |
Appendix A
Focusing wave cases involved in this research are summarized in Table A1, in which the related parameters and wave amplitude spectrum types of each focusing wave case are listed in detail. For parameters in Table A1, their definitions can be found in the Nomenclature section. From Table A1, it is found that the BFI value of each focusing wave case is quite small, which indicates that the nonlinear self-focusing of wave components almost has little influence on focusing wave generation of this research. The focusing wave generation of this research is dominated by the space-time focusing of wave energy.

Table A1.
Focusing wave cases in a physical wave tank.
| No | Name | Inputting Parameters of Focusing Waves | |||||||
|---|---|---|---|---|---|---|---|---|---|
| Af (m) | Af0 (m) | tf (s) | Tf (s) | ωn (rad/s) | Xf (m) | BFI | |||
| 1 | A101f61X30t36 | 0.1 | 0.1145 | 36 | 1.7~6.3 | 0.997~3.696 | 30 | QCWA | 0.0057 |
| 2 | A101f41X30t36 | 0.1 | 0.1078 | 36 | 1.7~4.7 | 1.336~3.696 | 30 | QCWA | 0.00891 |
| 3 | A101f42X30t36 | 0.1 | 0.1099 | 36 | 2.0~4.7 | 1.336~3.142 | 30 | QCWA | 0.00898 |
| 4 | A101f41X30t25 | 0.1 | 0.1078 | 25 | 1.7~4.7 | 1.336~3.696 | 30 | QCWA | 0.00891 |
| 5 | A101f41X30t30 | 0.1 | 0.1078 | 30 | 1.7~4.7 | 1.336~3.696 | 30 | QCWA | 0.00891 |
| 6 | A141f61X30t36 | 0.14 | 0.1603 | 36 | 1.7~6.3 | 0.997~3.696 | 30 | QCWA | 0.0080 |
| 7 | A141f42X30t36 | 0.14 | 0.1539 | 36 | 2.0~4.7 | 1.336~3.142 | 30 | QCWA | 0.01257 |
| 8 | A201f42X30t40 | 0.2 | 0.2199 | 36 | 2.0~4.7 | 1.336~3.142 | 30 | QCWA | 0.01796 |
| 9 | A101f41X40t36 | 0.1 | 0.1078 | 36 | 1.7~4.7 | 1.336~3.696 | 40 | QCWA | 0.00891 |
| 10 | A101f41X40t25 | 0.1 | 0.1078 | 25 | 1.7~4.7 | 1.336~3.696 | 40 | QCWA | 0.00891 |
| 11 | A101f41X40t30 | 0.1 | 0.1078 | 30 | 1.7~4.7 | 1.336~3.696 | 40 | QCWA | 0.00891 |
| 12 | A101f61X50t36 | 0.1 | 0.1145 | 36 | 1.7~6.3 | 0.997~3.696 | 50 | QCWA | 0.0057 |
| 13 | A101f41X50t36 | 0.1 | 0.1078 | 36 | 1.7~4.7 | 1.336~3.696 | 50 | QCWA | 0.00891 |
| 14 | A101f42X50t36 | 0.1 | 0.1099 | 36 | 2.0~4.7 | 1.336~3.142 | 50 | QCWA | 0.00898 |
| 15 | A101f43X50t36 | 0.1 | 0.1201 | 36 | 3.0~4.7 | 1.336~2.094 | 50 | QCWA | 0.01160 |
| 16 | A101f41X50t25 | 0.1 | 0.1078 | 25 | 1.7~4.7 | 1.336~3.696 | 50 | QCWA | 0.00891 |
| 17 | A101f41X50t30 | 0.1 | 0.1078 | 30 | 1.7~4.7 | 1.336~3.696 | 50 | QCWA | 0.00891 |
| 22 | A141f61X50t36 | 0.14 | 0.1603 | 36 | 1.7~6.3 | 0.997~3.696 | 50 | QCWA | 0.0080 |
| 23 | A141f42X50t36 | 0.14 | 0.1539 | 36 | 2.0~4.7 | 1.336~3.142 | 50 | QCWA | 0.01257 |
| 24 | A201f42X50t36 | 0.2 | 0.2199 | 36 | 2.0~4.7 | 1.336~3.142 | 50 | QCWA | 0.01797 |
| 18 | A101f61X50t36c | 0.1 | 0.1270 | 36 | 1.7~6.3 | 0.997~3.696 | 50 | QCWS | 0.0140 |
| 19 | A101f41X50t36c | 0.1 | 0.1132 | 36 | 1.7~4.7 | 1.336~3.696 | 50 | QCWS | 0.0148 |
| 20 | A101f42X50t36c | 0.1 | 0.1145 | 36 | 2.0~4.7 | 1.336~3.142 | 50 | QCWS | 0.0141 |
| 21 | A101f43X50t36c | 0.1 | 0.1219 | 36 | 3.0~4.7 | 1.336~2.094 | 50 | QCWS | 0.0158 |
References
- Adcock, T.; Taylor, P. Focusing of unidirectional wave groups on deep water: An approximate nonlinear Schrödinger equation-based model. Proc. R. Soc. A 2009, 465, 3083–3120. [Google Scholar] [CrossRef]
- Schmittner, C.; Brouwer, J.; Henning, J. Application of focusing wave groups in model testing practice. In Proceedings of the 33rd International Conference on Ocean, Offshore and Arctic Engineering, San Francisco, CA, USA, 8–13 June 2014. [Google Scholar]
- Kharif, C.; Pelinovsky, E. Physical mechanisms of the rogue wave phenomenon. Eur. J. Mech. B Fluids 2003, 22, 603–634. [Google Scholar] [CrossRef]
- Manolidis, M.; Orzech, M.; Simeonov, J. Rogue Wave Formation in Adverse Ocean Current Gradients. J. Mar. Sci. Eng. 2019, 7, 26. [Google Scholar] [CrossRef]
- Steer, N.; McAllister, L.; Borthwick, G.; Van den Bremer, S. Experimental Observation of Modulational Instability in Crossing Surface Gravity Wavetrains. Fluids 2019, 4, 105. [Google Scholar] [CrossRef]
- Yan, S.; Ma, Q. Numerical simulation of interaction between wind and 2D freak waves. Eur. J. Mech. B Fluids 2010, 29, 18–31. [Google Scholar] [CrossRef]
- Mori, N.; Liu, P.C.; Yasuda, T. Analysis of freak wave measurements in the Sea of Japan. Ocean Eng. 2002, 29, 1399–1414. [Google Scholar] [CrossRef]
- Kokorina, A.; Slunyaev, A. Lifetimes of Rogue Wave Events in Direct Numerical Simulations of Deep-Water Irregular Sea Waves. Fluids 2019, 4, 70. [Google Scholar] [CrossRef]
- Cui, C.; Zhang, N.; Yu, Y.; Li, J. Numerical Study on the Effects of Uneven Bottom Topography on Freak Waves. Ocean Eng. 2012, 54, 132–141. [Google Scholar] [CrossRef]
- Clauss, G.; Stempinski, F.; Stuck, R. On Modelling Kinematics of Steep Irregular Seaway and Freak Waves. In Proceedings of the 27th International Conference on Offshore Mechanics and Arctic Engineering, Berlin, Germany, 15–20 June 2008. [Google Scholar]
- Pang, H.; An, Z. Wavelet transform analysis of freak waves and the ringing response of vertical cylinder in a numerical wave tank. In Proceedings of the 19th International Offshore and Polar Engineering Conference, Osaka, Japan, 26 June 2009. [Google Scholar]
- Fonseca, N.; Soares, C.; Pascoal, R. Global loads on a FPSO induced by a set of freak waves. J. Offshore Mech. Arct. Eng. Trans. ASME 2009, 131, 011103. [Google Scholar] [CrossRef]
- Yan, B.; Luo, M.; Bai, W. An Experimental and Numerical Study of Plunging Wave Impact on a Box-Shape Structure. Mar. Struct. 2019, 66, 272–287. [Google Scholar] [CrossRef]
- Hu, Z.; Tang, W.; Xue, H. A Probability-Based Superposition Model of Freak Wave Simulation. Appl. Ocean Res. 2014, 47, 284–290. [Google Scholar] [CrossRef]
- Yan, S.; Ma, Q. Improved Model for Air Pressure Due to Wind On 2D Freak Waves in Finite Depth. Eur. J. Mech. B Fluids 2011, 30, 1–11. [Google Scholar] [CrossRef]
- Dyachenko, A.; Zakharov, V. On the Formation of Freak Waves on the Surface of Deep Water. JETP Lett. 2009, 88, 307–311. [Google Scholar] [CrossRef]
- Rapp, R.; Melville, W. Laboratory measurements of deep water breaking waves. Philos. Trans. R. Soc. A Math. Phys. Eng. Sci. 1990, A331, 735–800. [Google Scholar] [CrossRef]
- Pei, Y.; Zhang, N.; Zhang, Y. Efficient Generation of Freak Waves in Laboratory. China Ocean Eng. 2007, 3, 515–523. [Google Scholar]
- Baldock, T.; Swan, C.; Taylor, P. A laboratory study of nonlinear surface waves on water. Philos. Trans. R. Soc. A Math. Phys. Eng. Sci. 1996, 354, 649–676. [Google Scholar]
- Li, J.; Wang, Z.; Liu, S. Experimental Study of Interactions between Multi-Directional Focused Wave and Vertical Circular Cylinder, Part I: Wave Run-Up. Coast Eng. 2012, 64, 151–160. [Google Scholar] [CrossRef]
- Ma, Q. Numerical Generation of Freak Waves Using MLPG_R and QALE-FEM Methods. CMES-Comp. Model. Eng. Sci. 2007, 18, 223–234. [Google Scholar]
- Ning, D.; Zang, J.; Liu, S.; Eatock, T.; Teng, B.; Taylor, P. Free-Surface Evolution and Wave Kinematics for Nonlinear Uni-Directional Focused Wave Groups. Ocean Eng. 2009, 36, 1226–1243. [Google Scholar] [CrossRef]
- Fochesato, C.; Grilli, S.; Dias, F. Numerical Modeling of Extreme Rogue Waves Generated by Directional Energy Focusing. Wave Motion 2007, 44, 395–416. [Google Scholar] [CrossRef]
- Ai, C.; Ding, W.; Jin, S. A General Boundary-Fitted 3D Non-Hydrostatic Model for Nonlinear Focusing Wave Groups. Ocean Eng. 2014, 89, 134–145. [Google Scholar] [CrossRef]
- Benjamin, T.; Feir, J. The disintegration of wave trains on deep water Part 1—Theory. J. Fluid Mech. 1967, 27, 417–430. [Google Scholar] [CrossRef]
- Janssen, P. Nonlinear Four-Wave Interactions and Freak Waves. J. Phys. Oceanogr. 2003, 33, 863–884. [Google Scholar] [CrossRef]
- Onorato, M.; Osborne, A.; Serio, M.; Cavaleri, L.; Brandini, C.; Stansberg, C. Extreme Waves, Modulational Instability and Second Order Theory: Wave Flume Experiments on Irregular Waves. Eur. J. Mech. B Fluids 2006, 25, 586–601. [Google Scholar] [CrossRef]
- Manzetti, S. Mathematical Modeling of Rogue Waves: A Survey of Recent and Emerging Mathematical Methods and Solutions. Axioms 2018, 7, 42. [Google Scholar] [CrossRef]
- Deng, Y.; Yang, J.; Li, X.; Xiao, L. Experimental and numerical investigation on kinematics of freak waves. In Proceedings of the 25th International Ocean and Polar Engineering Conference, Kona, Big Island, HI, USA, 21–26 June 2015. [Google Scholar]
- Deng, Y.; Yang, J.; Zhao, W.; Xiao, L.; Li, X. An efficient focusing model of focusing wave generation considering wave reflection effects. Ocean Eng. 2015, 105, 125–135. [Google Scholar] [CrossRef]
- Whittaker, C.; Fitzgerald, C.; Raby, A.; Taylor, P.; Borthwick, A. Extreme coastal responses using focused wave groups: Overtopping and horizontal forces exerted on an inclined seawall. Coast Eng. 2018, 140, 292–305. [Google Scholar] [CrossRef]
- Touboul, J.; Giovanangeli, J.; Kharif, C.; Pelinovsky, E. Freak waves under the action of wind: Experiments and simulations. Eur. J. Mech. B Fluids 2006, 25, 662–676. [Google Scholar] [CrossRef]
- Li, J.; Yang, J.; Liu, S.; Ji, X. Wave Groupiness Analysis of the Process of 2D Freak Wave Generation in Random Wave Trains. Ocean Eng. 2015, 104, 480–488. [Google Scholar] [CrossRef]
- Chabchoub, A.; Hoffmann, N.; Onorato, M.; Akhmediev, N. Super rogue waves: Observation of a higher-order breather in water waves. Phys. Rev. X 2012, 2, 11015. [Google Scholar] [CrossRef]
- Chabchoub, A.; Peri, R.; Hoffmann, N. Dynamics of Unstable Stokes Waves: A Numerical and Experimental Study. In Proceedings of the 33rd International Conference on Ocean, Offshore and Arctic Engineering, San Francisco, CA, USA, 8–13 June 2014. [Google Scholar]
- Onorato, M.; Residori, S.; Bortolozzo, U.; Montina, A.; Arecchi, F. Rogue Waves and their Generating Mechanisms in Different Physical Contexts. Phys. Rep. 2013, 528, 47–89. [Google Scholar] [CrossRef]
- Clauss, G.; Schmittner, C.; Klein, M. Generation of rogue waves with predefined steepness. In Proceedings of the 25th International Conference on Offshore Mechanics and Arctic Engineering, Hamburg, Germany, 4–9 June 2006. [Google Scholar]
- Fernández, H.; Sriram, V.; Schimmels, S.; Oumeraci, H. Extreme wave generation using self correcting method—Revisited. Coast Eng. 2014, 93, 15–31. [Google Scholar]
- Deng, Y.; Yang, J.; Tian, X.; Li, X.; Xiao, L. An experimental study on deterministic freak waves: Generation, propagation and local energy. Ocean Eng. 2016, 118, 83–92. [Google Scholar] [CrossRef]
- Liu, S.; Sun, Y.; Li, J.; Zang, J. Experimental Study on 2-D Focusing Wave Run-up on A Vertical Cylinder. China Ocean Eng. 2010, 24, 499–512. [Google Scholar]
- Ma, Y.; Dong, G.; Liu, S.; Zang, J.; Li, J.; Sun, Y. Laboratory study of unidirectional focusing waves in intermediate depth water. J. Eng. Mech. 2010, 136, 78–90. [Google Scholar] [CrossRef]
- Wu, C.; Yao, A. Laboratory measurements of limiting freak waves on currents. J. Geophys. Res. 2004, 109, C12002. [Google Scholar] [CrossRef]
- Clauss, G.; Klein, M. Experimental investigation on the vertical bending moment in extreme sea states for different hulls. Ocean Eng. 2016, 119, 181–192. [Google Scholar] [CrossRef]
- Liang, S.; Zhang, Y.; Sun, Z.; Chang, Y. Laboratory study on the evolution of waves parameters due to wave breaking in deep water. Wave Motion 2017, 68, 31–42. [Google Scholar] [CrossRef]
- Xu, G. Research on Generation of Freak Wave and Its Effect on Truss SPAR Motions. Ph.D. Thesis, Harbin Engineering University, Harbin, China, 2016. [Google Scholar]
- Gramstad, O. Modulational Instability in JONSWAP Sea States Using the Alber Equation. In Proceedings of the 36th International Conference on Ocean, Offshore and Arctic Engineering, Trondheim, Norway, 25–30 June 2017. [Google Scholar]
- Li, J.; Li, P.; Liu, S. Observations of Freak Waves in Random Wave Field in 2D Experimental Wave Flume. China Ocean Eng. 2013, 5, 659–670. [Google Scholar] [CrossRef]
- Cui, C.; Zhang, N. Research on the time-Frequency energy structure of freak wave generation and evolution. In Proceedings of the 30th International Conference on Ocean, Offshore and Arctic Engineering, Rotterdam, The Netherlands, 19–24 June 2011. [Google Scholar]
- Yan, S.; Ma, Q. Numerical study on significance of wind action on 2-D freak waves with different parameters. J. Mar. Sci. Tech. TAIW 2012, 20, 9–17. [Google Scholar]
- Li, J.; Liu, S. Focused Wave Properties Based on A High Order Spectral Method with A Non-Periodic Boundary. China Ocean Eng. 2015, 29, 1–16. [Google Scholar] [CrossRef]
- Hennig, J.; Schmittner, C. Experimental variation of focusing wave groups for the investigation of their predictability. In Proceedings of the 28th International Conference on Ocean, Offshore and Arctic Engineering, Honolulu, HI, USA, 31 May–5 June 2009. [Google Scholar]
Figure 1.
Experimental arrangement sketch.

Figure 2.
Flow chart of focusing wave generation.

Figure 3.
Two wave spectra changing with water depth: (a) The quasi constant wave amplitude QCWA spectrum and (b) the quasi constant wave steepness QCWS spectrum.
Figure 3.
Two wave spectra changing with water depth: (a) The quasi constant wave amplitude QCWA spectrum and (b) the quasi constant wave steepness QCWS spectrum.

Figure 4.
Theoretical signal and processed signal by ramp function.

Figure 5.
Wave-making signal generated by the new scheme.

Figure 6.
Comparison of input and tested stroke signals.

Figure 7.
Experimental repeatability error: (a) Relative error of focusing wave crests and (b) relative error of focusing wave troughs.
Figure 7.
Experimental repeatability error: (a) Relative error of focusing wave crests and (b) relative error of focusing wave troughs.

Figure 8.
Comparison of two wave spectra: (a) Wave amplitude spectrum and (b) wave steepness spectrum.
Figure 8.
Comparison of two wave spectra: (a) Wave amplitude spectrum and (b) wave steepness spectrum.

Figure 9.
Evolution of two focusing waves: (a) The QCWA focusing wave and (b) the QCWS focusing wave.
Figure 9.
Evolution of two focusing waves: (a) The QCWA focusing wave and (b) the QCWS focusing wave.

Figure 10.
Wave amplitude spectra variation of the QCWA focusing wave at different positions.

Figure 11.
Wave amplitude spectra variation of the QCWS focusing wave at different positions.

Figure 12.
Ursell number changing at different space positions for two generations of focusing waves: (a) The QCWA focusing wave and (b) the QCWS focusing wave.
Figure 12.
Ursell number changing at different space positions for two generations of focusing waves: (a) The QCWA focusing wave and (b) the QCWS focusing wave.

Figure 13.
Comparison of generating results of the QCWA and QCWS focusing waves: (a) Focusing wave crest elevation and (b) focusing wave position (a: ωn = 1.336 rad/s~3.696 rad/s, b: ωn = 1.336 rad/s~3.142 rad/s, and c: ωn = 1.336 rad/s~2.094 rad/s).
Figure 13.
Comparison of generating results of the QCWA and QCWS focusing waves: (a) Focusing wave crest elevation and (b) focusing wave position (a: ωn = 1.336 rad/s~3.696 rad/s, b: ωn = 1.336 rad/s~3.142 rad/s, and c: ωn = 1.336 rad/s~2.094 rad/s).

Figure 14.
Generated results of focusing waves under different Af and xf parameters: (a) Focusing wave crest elevations for ωn = 0.997 rad/s~3.696 rad/s, (b) focusing wave crest elevations for ωn = 1.336 rad/s~3.142 rad/s, (c) focusing wave positions for ωn = 0.997 rad/s~3.696 rad/s, and (d) focusing wave positions for ωn = 1.336 rad/s~3.142 rad/s.

Figure 15.
Focusing wave generating results under different focusing position and time parameters: (a) Focusing wave crest elevations and (b) focusing wave positions.
Figure 15.
Focusing wave generating results under different focusing position and time parameters: (a) Focusing wave crest elevations and (b) focusing wave positions.

Table 1.
Required maximum displacements of hydraulic piston.
| No | an | ωn (rad/s) | Smax (m) | SQCWSmax/SQCWAmax |
|---|---|---|---|---|
| 1-1 | QCWA | 0.997~3.696 | 0.202 | 1.834 |
| QCWS | 0.371 | |||
| 2-a | QCWA | 1.336~3.696 | 0.127 | 1.772 |
| QCWS | 0.225 | |||
| 3-b | QCWA | 1.336~3.142 | 0.164 | 1.518 |
| QCWS | 0.249 | |||
| 4-c | QCWA | 1.336~2.094 | 0.387 | 1.062 |
| QCWS | 0.411 | |||
| Af = 0.1 m; xf = 50 m; tf = 36 s; N = 32 | ||||
© 2019 by the authors. Licensee MDPI, Basel, Switzerland. This article is an open access article distributed under the terms and conditions of the Creative Commons Attribution (CC BY) license (http://creativecommons.org/licenses/by/4.0/).
Share and Cite
MDPI and ACS Style
Xu, G.; Hao, H.; Ma, Q.; Gui, Q. An Experimental Study of Focusing Wave Generation with Improved Wave Amplitude Spectra. Water 2019, 11, 2521. https://doi.org/10.3390/w11122521
AMA Style
Xu G, Hao H, Ma Q, Gui Q. An Experimental Study of Focusing Wave Generation with Improved Wave Amplitude Spectra. Water. 2019; 11(12):2521. https://doi.org/10.3390/w11122521
Chicago/Turabian StyleXu, Guochun, Hongbin Hao, Qingwei Ma, and Qinqin Gui. 2019. "An Experimental Study of Focusing Wave Generation with Improved Wave Amplitude Spectra" Water 11, no. 12: 2521. https://doi.org/10.3390/w11122521
Note that from the first issue of 2016, this journal uses article numbers instead of page numbers. See further details here.