A Data-Driven Probabilistic Rainfall-Inundation Model for Flash-Flood Warnings

1
Center for Weather Climate and Disaster Research, National Taiwan University, Taipei 10617, Taiwan
2
Department of Computer Science and Information Engineering, National Taiwan University, Taipei 10617, Taiwan
3
Research Center of Climate Change and Sustainable Development, National Taiwan University, Taipei 10617, Taiwan
*
Author to whom correspondence should be addressed.
Water 2019, 11(12), 2534; https://doi.org/10.3390/w11122534
Submission received: 20 October 2019
/
Revised: 17 November 2019
/
Accepted: 27 November 2019
/
Published: 30 November 2019
(This article belongs to the Special Issue Machine Learning Applied to Hydraulic and Hydrological Modelling)
Abstract
:Owing to their short duration and high intensity, flash floods are among the most devastating natural disasters in metropolises. The existing warning tools—flood potential maps and two-dimensional numerical models—are disadvantaged by time-consuming computation and complex model calibration. This study develops a data-driven, probabilistic rainfall-inundation model for flash-flood warnings. Applying a modified support vector machine (SVM) to limited flood information, the model provides probabilistic outputs, which are superior to the Boolean functions of the traditional rainfall-flood threshold method. The probabilistic SVM-based model is based on a data preprocessing framework that identifies the expected durations of hazardous rainfalls via rainfall pattern analysis, ensuring satisfactory training data, and optimal rainfall thresholds for validating the input/output data. The proposed model was implemented in 12 flash-flooded districts of the Xindian River. It was found that (1) hydrological rainfall pattern analysis improves the hazardous event identification (used for configuring the input layer of the SVM); (2) brief hazardous events are more critical than longer-lasting events; and (3) the SVM model exports the probability of flash flooding 1 to 3 h in advance.
1. Introduction
Flash floods inundate metropolises with intense precipitation within a short time, causing intense damages; moreover, they occur on worldwide spatial scales. Taiwan, located between Japan and the Philippines in the Western Pacific, experiences (on average) three or four typhoons and 166 days of heavy rainfall warnings per year. Here, heavy rainfall is defined as precipitation with an intensity above 40 mm/h, or a 24-h cumulative rainfall exceeding 80 mm. Therefore, a flash-flood warning is a critical requirement of natural disaster mitigation and prevention in Taiwan. Recently, researchers have published observed data and developed various models for flash-flood warnings in different metropolises. Applying a two-dimensional (2-D) inundation model and a road impact method, Yin et al. (2016) [1] evaluated the impact and risk of pluvial flash floods on the intra-urban road network in Shanghai, China, but their evaluation does not execute in real-time. Candela and Aronica (2016) [2] and Douinot et al. (2016) [3] applied 2-D numerical models of flash-flood warning in Italy and France, respectively. However, the spatial extent of their studies was limited by the long computational time of 2-D models. Clark (2017) [4] applied a nonlinear unit hydrograph flow model and the antecedent soil-moisture deficit in a flood warning model of Boscastle in the United Kingdom. Such a combined model is quick and suitable for fluvial floods, but inapplicable to pluvial flash floods. A similar combined hydrological model, which derives the rainfall thresholds in pluvial flash floods, was considered by Forestieri et al. (2016) [5]. In natural hazards induced by short-term heavy rainfall such as flash floods or landslides, a timely warning is more important than evaluating the disaster impacts on people. Therefore, the empirical rainfall thresholds of flash floods and rainfall-induced landslides have been increasingly sought in recent years [5,6,7,8,9,10,11,12,13,14,15].
The local governments in Taiwan also consider the rainfall thresholds in flash floods and landslides [16,17,18]. In the official flash-flood warning system of Taiwan, the rainfall thresholds in all counties and districts are decided from five cumulative rainfalls of durations 1, 3, 6, 12, and 24 h. At least one rain gauge is assigned as the reference rain gauge for each county or district [19]. In 2017, the Water Resources Agency (WRA) used 754 sets of rainfall thresholds based on 500 rain gauges and warned 368 counties and districts of pending flash floods in Taiwan. However, the rainfall thresholds are based on historical flood records, which lack the parameters (start times, areas, and durations of the floods) required in complex flood warning models. Most of the historical flood records in Taiwan are reports of people’s phone calls, which are checked by officers several hours later. Therefore, when determining rainfall thresholds, the historical flood records of the WRA are useful only for predicting whether a rainfall event will cause a disaster. Although potential inundation maps improve the information input [18,20,21], the models based on this information output only a Boolean function that provides decision makers with simplified yes or no answers to the observed rainfalls.
The added (economic) value of probabilistic forecasts over deterministic forecasts has been confirmed in many studies [22,23,24,25]. Probabilistic forecasts quantify the potential risk of impacts for decision makers [26]. Therefore, probabilistic flood warning models are increasingly sought in the hydrological field [18,27,28,29,30,31,32,33,34,35,36,37]. In seven of the above studies [18,27,28,29,30,31,32], the values of the probabilistic information were provided to the flood warning models by hydro-meteorological ensembles. In the other five of the above studies, statistical post-processors are applied to provide probabilistic forecasts, i.e., the predictive uncertainty, from the output of a single (or multiple) deterministic model (either a meteorological or a hydrologic model) [33,34,35,36,37]. In most countries, the rainfall data acquired by rain gauges are the essential weather products for further applications. Therefore, this study develops a data-driven, probabilistic rainfall-inundation model based on the observed rainfall data and a modified SVM.
Among the most popular models in statistics and machine learning is logistic regression [38], which makes probabilistic predictions by linearly combining the observed data. Nevertheless, in practical applications, linear models may be insufficiently powerful to capture the sophisticated relationships within the observed data [38]. Nonlinear models with probabilistic predictions include Random Forest [39], Gradient Boosted Decision Tree [40], and SVM [41]. Among these models, SVM is well-known for its large-margin design, which confers robustness to overfitting, and for its kernel trick, which improves the model’s ability to explore sophisticated relationships in the observed data. Platt (2000) [42] extended the original SVM designed for deterministic classification predictions to probabilistic outputs by adding a logistic-regression-like stage after the usual SVM learning. Platt’s model, which inherits the robustness and power from the SVM, is the main tool of the present study. Using the modified SVM, we develop a data-driven probabilistic model of rainfall-inundation based on the observed rainfall data.
2. Study Area and Data Used
2.1. Xindian River and Its Flood Disaster Events
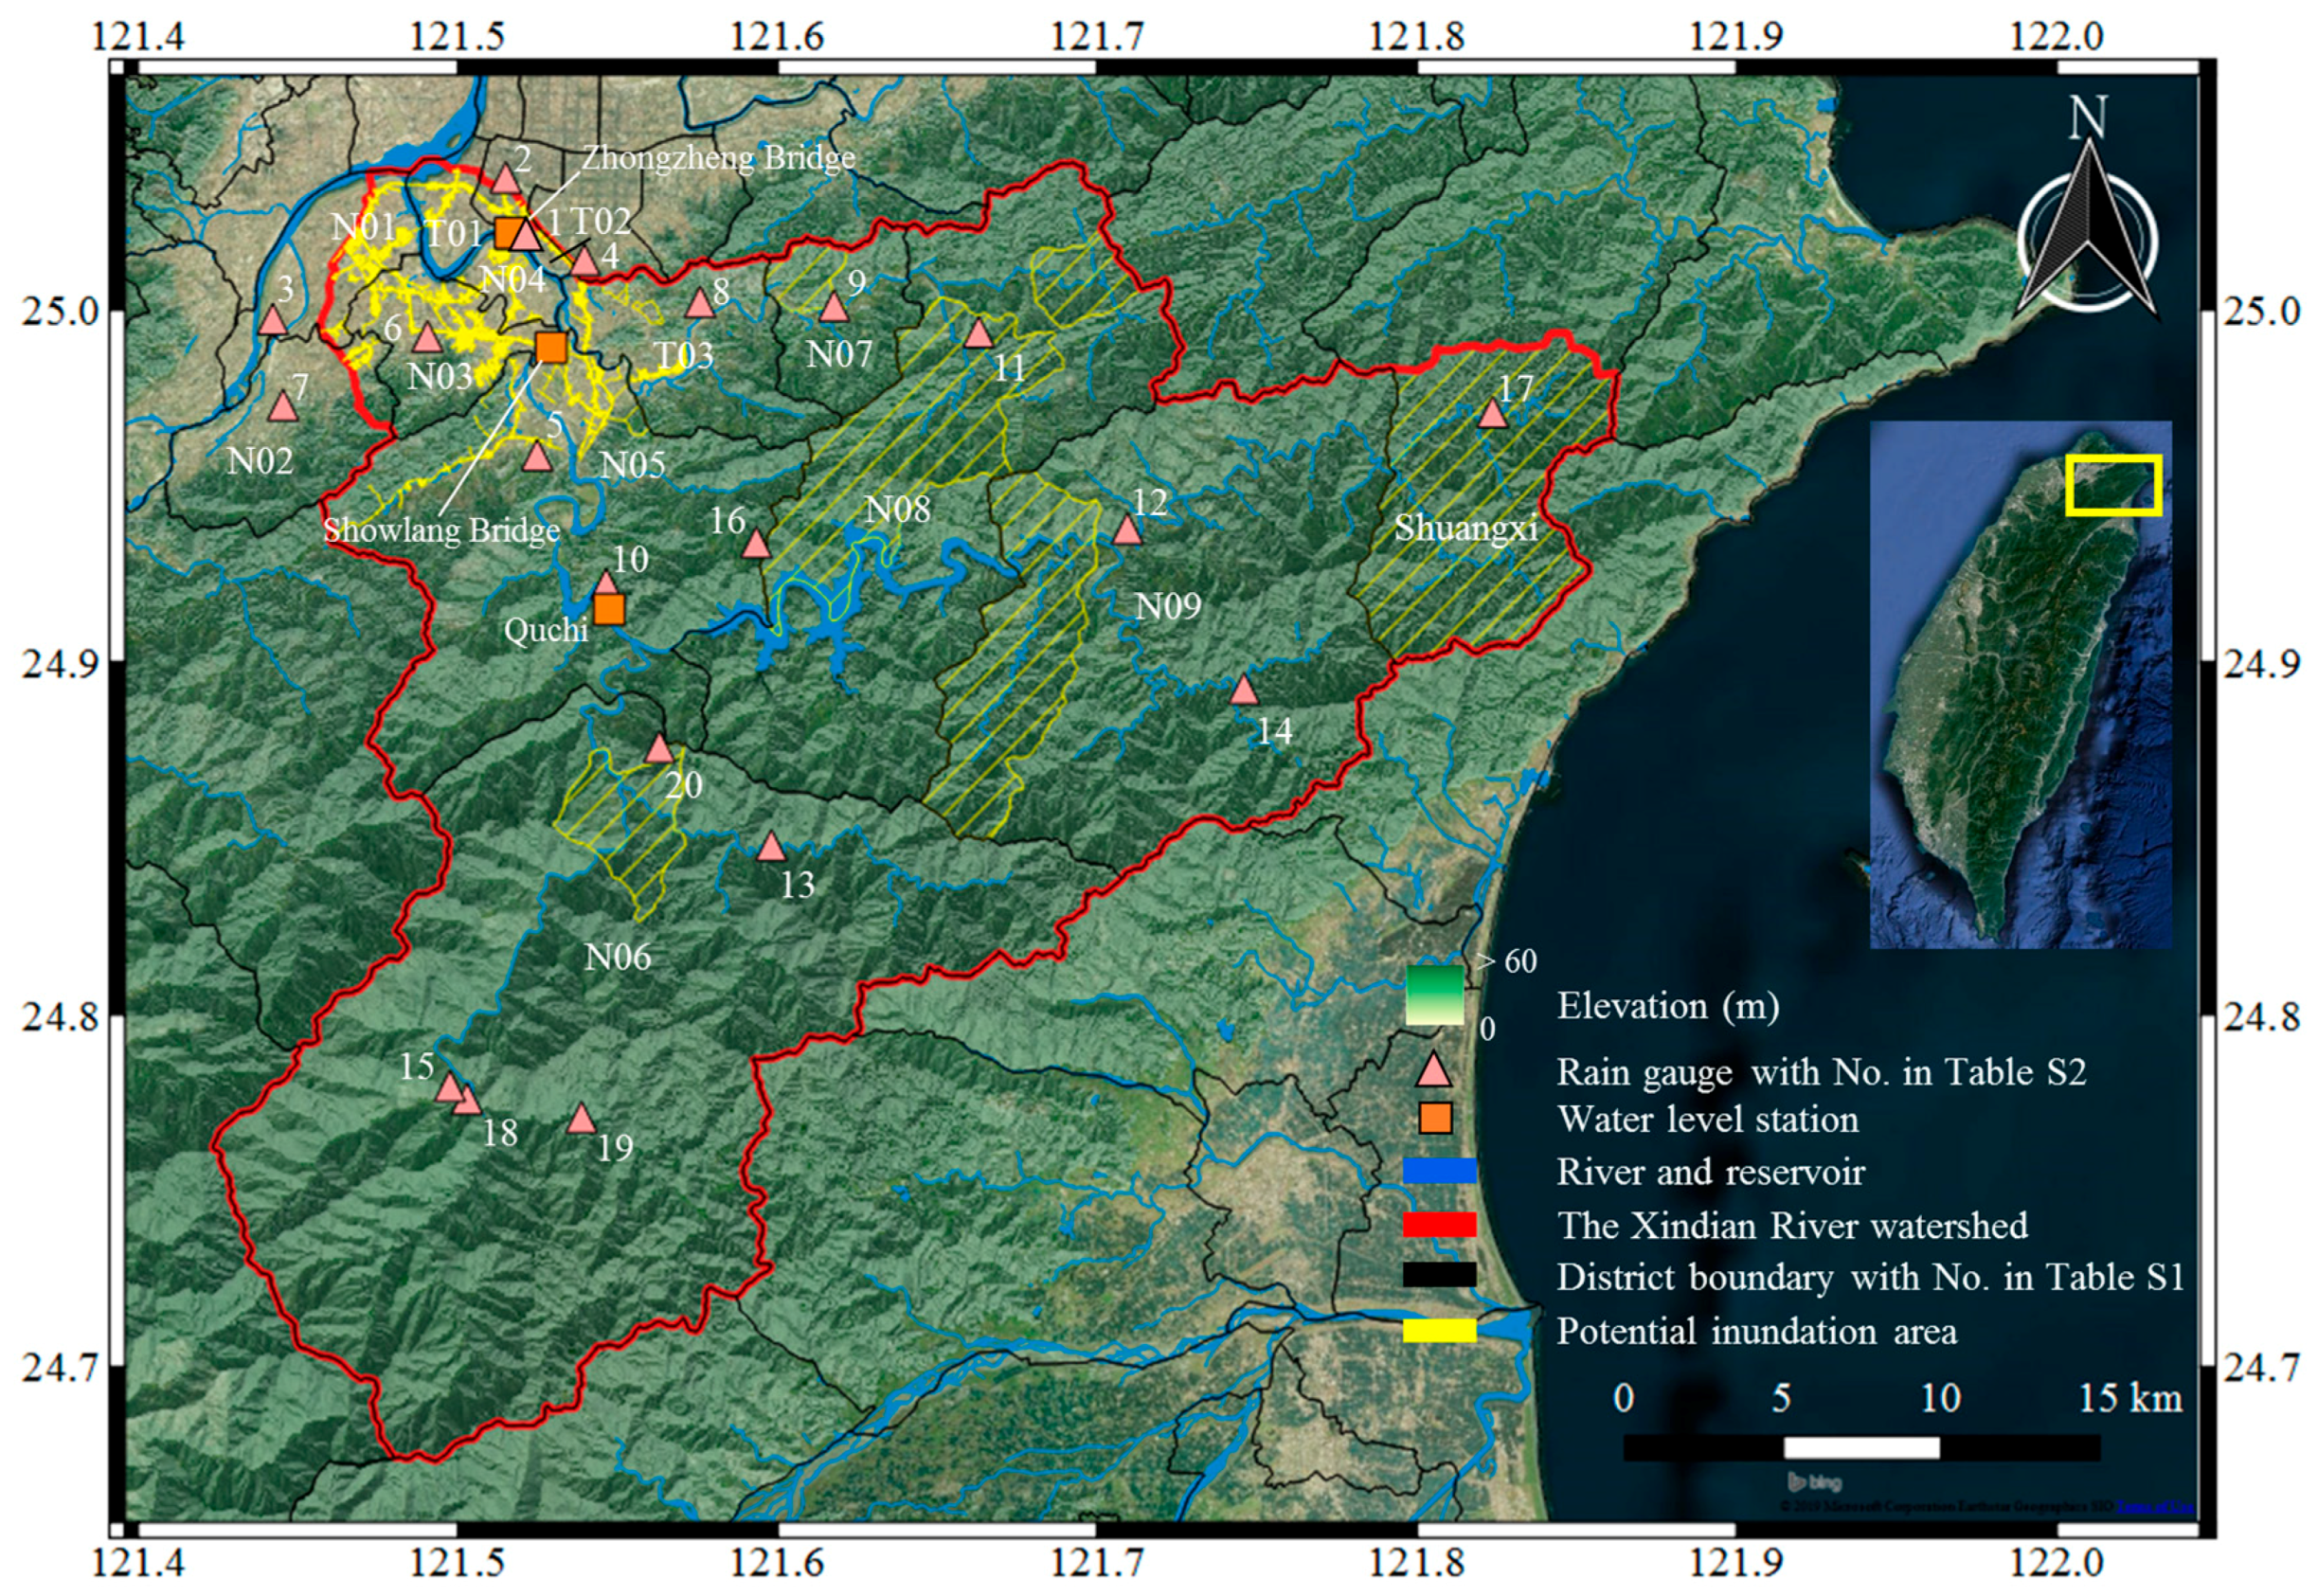
The study area was the Xindian River watershed (see Figure 1). Covering 89% of the mountainous area (921 km2) in Northern Taiwan, the Xindian River watershed lies upstream of the Danshui River, a main river of length 81 km with a mean slope of 1:54 from southeast to northwest. Fed by subtropical monsoons and typhoons, Xindian River’s hydrological environment processes a mean annual precipitation of approximately 3500 mm and experienced mean flows of 92.27 and 50.03 CMS in the Jun. to Nov. and Dec. to May periods, respectively. To provide flood control and a stable water supply to the Taipei Metropolitan Area, Taiwanese authorities constructed the Feitsui Reservoir upstream of the Xindian River in 1987. This reservoir has a watershed area of 303 km2 and a mean water supply of 3.45 million CMD. From Showlang Bridge to the reservoir, the time of concentration is 4.38 hours, the river length is 69.7 km, and the watershed area is 747.75 km2 (Capital Engineering Corporation, 2009) [43]. Levees with 16 pumping stations, designed to prevent floods with a 200-year return period, are built downstream of the Xindian River, and the drainage systems of Taipei City and New Taipei City are designed to prevent floods with a 5-year return period.
Based on the flood reports of WRA from 2012 to 2015, 24 heavy rainfalls and typhoons inundated 12 districts of the Xindian River watershed (see Table S1 in Supplementary Material). As observed in Table S1 in Supplementary Material, most of the heavy rainfalls induced by stationary fronts (so-called Mei-yu fronts) occurred during May and June (the Mei-yu season), and eight typhoons influenced the watershed during July, August, and September. Seven events—the 610 flood event, Typhoon Saola in 2012, Typhoon Trami, the 0822 heavy rainfall event, Typhoon Kong-rey in 2013, the 0519 heavy rainfall event in 2014, and Typhoon Soudelor in 2015—caused large-scale impacts on over half of the districts in the watershed. Furthermore, in the 15 and 14 flood events, the Banqiao and Xindian districts had higher inundation potentials, respectively, than the other 10 districts. Located in the mountainous area with high terrain, Wulai, Shenkeng, Shiding, and Pinglin have relatively low inundation potentials, and all disaster events in these four districts were induced by typhoons.
2.2. Dataset
Twenty rain gauges are set up by the Central Weather Bureau (CWB) throughout the Xindian River watershed (red dots in Figure 1). Table S2 in the Supplementary Material shows the profiles of the rain gauges at elevations ranging from 5 to 916 m. The three rain gauges (Sidu, Sishifen, and Taiping) located upstream of the Feitsui Reservoir were filtered out because the reservoir operation controls the impacts of the reservoir-watershed rainfall on the downstream floods but not on the upstream floods. Among the remaining 17 rain gauges, 15 are designated as reference stations for flood warnings by the WRA (the exceptions are Tunghou and Xiapen).
Table 1 shows the official rainfall thresholds of the 15 rain gauges providing flood warning data to 12 districts. Five of the districts are warned by multiple stations. Officially, 19 sets of rainfall thresholds based on 15 rain gauges are set to warn 12 districts in the Xindian River watershed. To improve the appropriateness of flash-flood warnings in the Xindian River watershed, our data-driven probabilistic rainfall-inundation model uses the observed hourly rainfall data of the 17 rain gauges from 2012 to 2015.
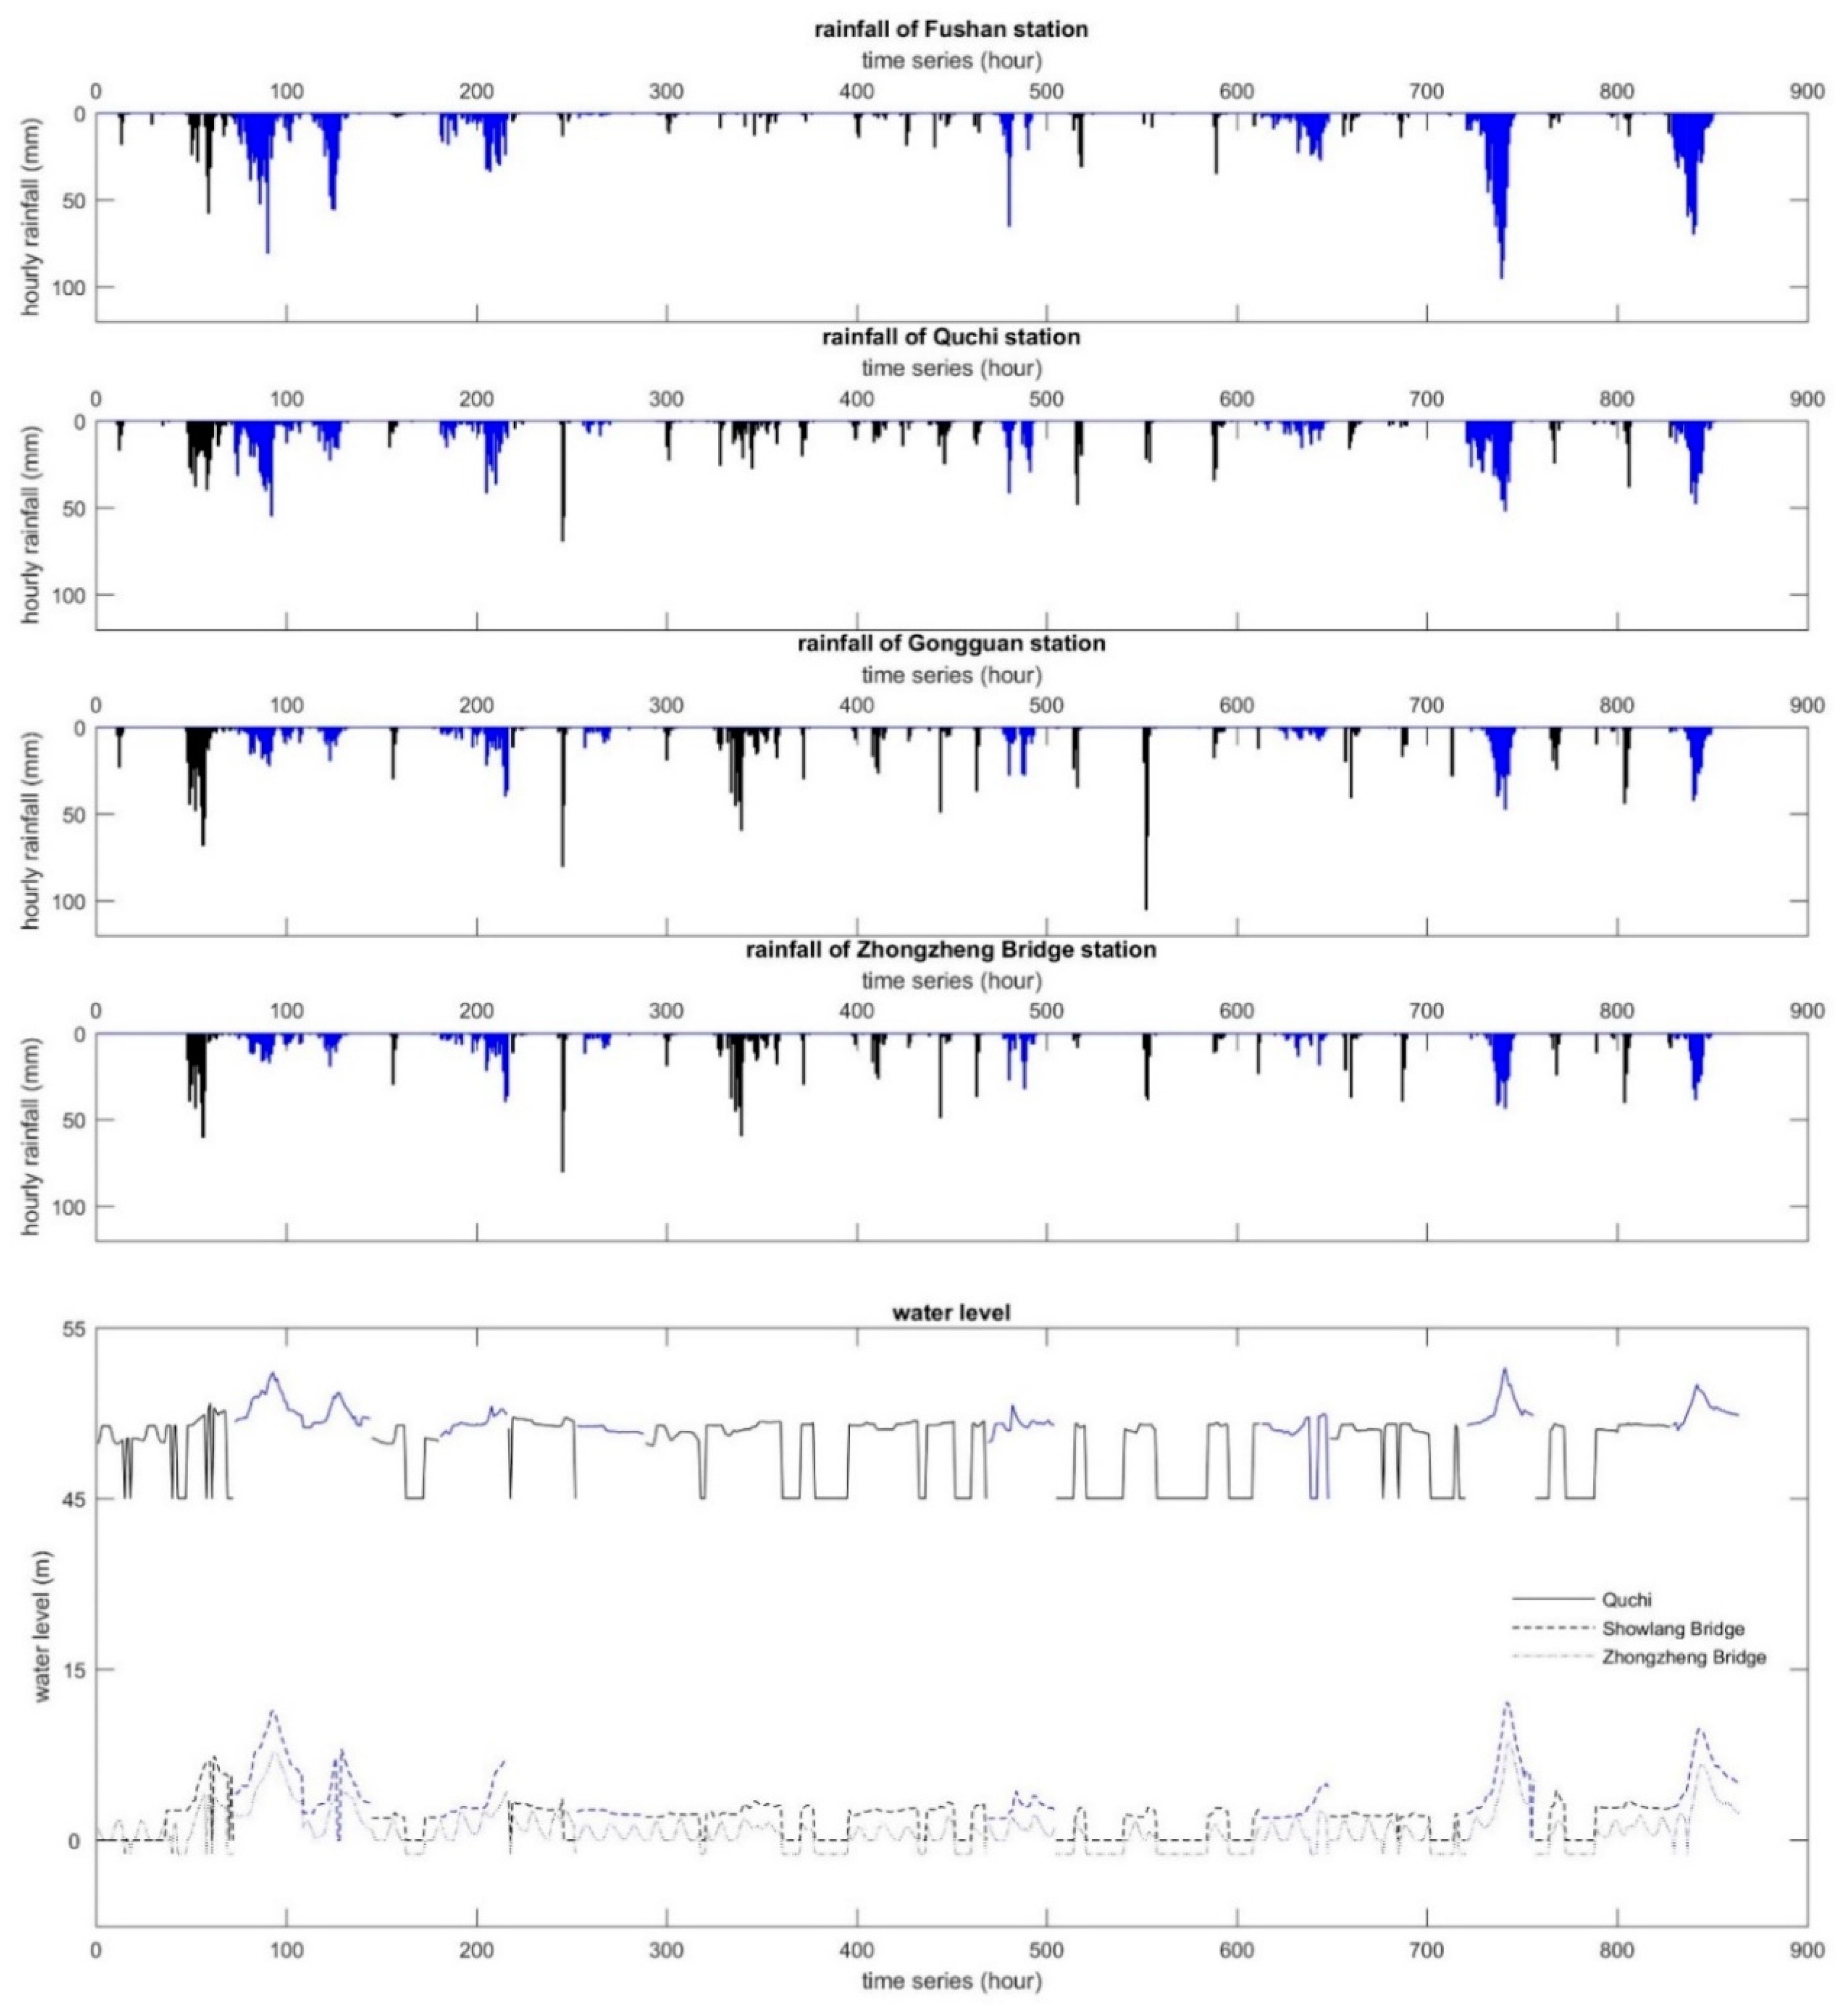
Based on the hourly water level data of WRA and the hourly rainfall data of CWB, Figure 2 shows the 36-hr rainfall-water level processes of the water level stations Quchi, Showlang Bridge, and Zhongzheng Bridge, arranged from upstream to downstream, at their three nearest rain gauges Quchi, Gongguan, and Zhengzheng Bridge respectively, along with the processes at one upstream rain gauge, Fushan. Data are shown for the eight typhoon events (blue) and 16 Mei-yu front events (black). When the water levels at the Quchi, Showlang Bridge, and Zhongzheng Bridge stations are 45, 0, and −1.2 m, respectively, there are no observed data. As revealed in Figure 2, the water levels at the Quchi and Showlang Bridge stations are highly related to the Quchi and Fushan rainfalls upstream of the Xindian River, whereas that at Zhongzheng Bridge is mainly related to the tide. As per the introduction of flood prevention for the Xindian River in Section 2.1, the return periods of designed floods for drainage systems and levees are 5 and 200 years, respectively. Therefore, as no overflow from levees but from manholes occurred during the 24 events, the floods in recent years were induced by the failure of drainage systems, also called pluvial floods. Consequently, only the rainfall data are input to the developed model.
Because the probabilistic model in this study applies data-driven supervised learning, its inputs are the cumulative rainfalls of different durations that enter the observations, and the designed output is a Boolean description that trains the model to identify whether the observed rainfalls will cause flooding. However, because accurate flood times are missing, identifying the relationship between rainfall patterns and floods through supervised learning is a challenging task. Therefore, the maximum cumulative rainfalls of different durations are considered to characterize disaster events in this study.
3. Methodology
3.1. Model Development Process
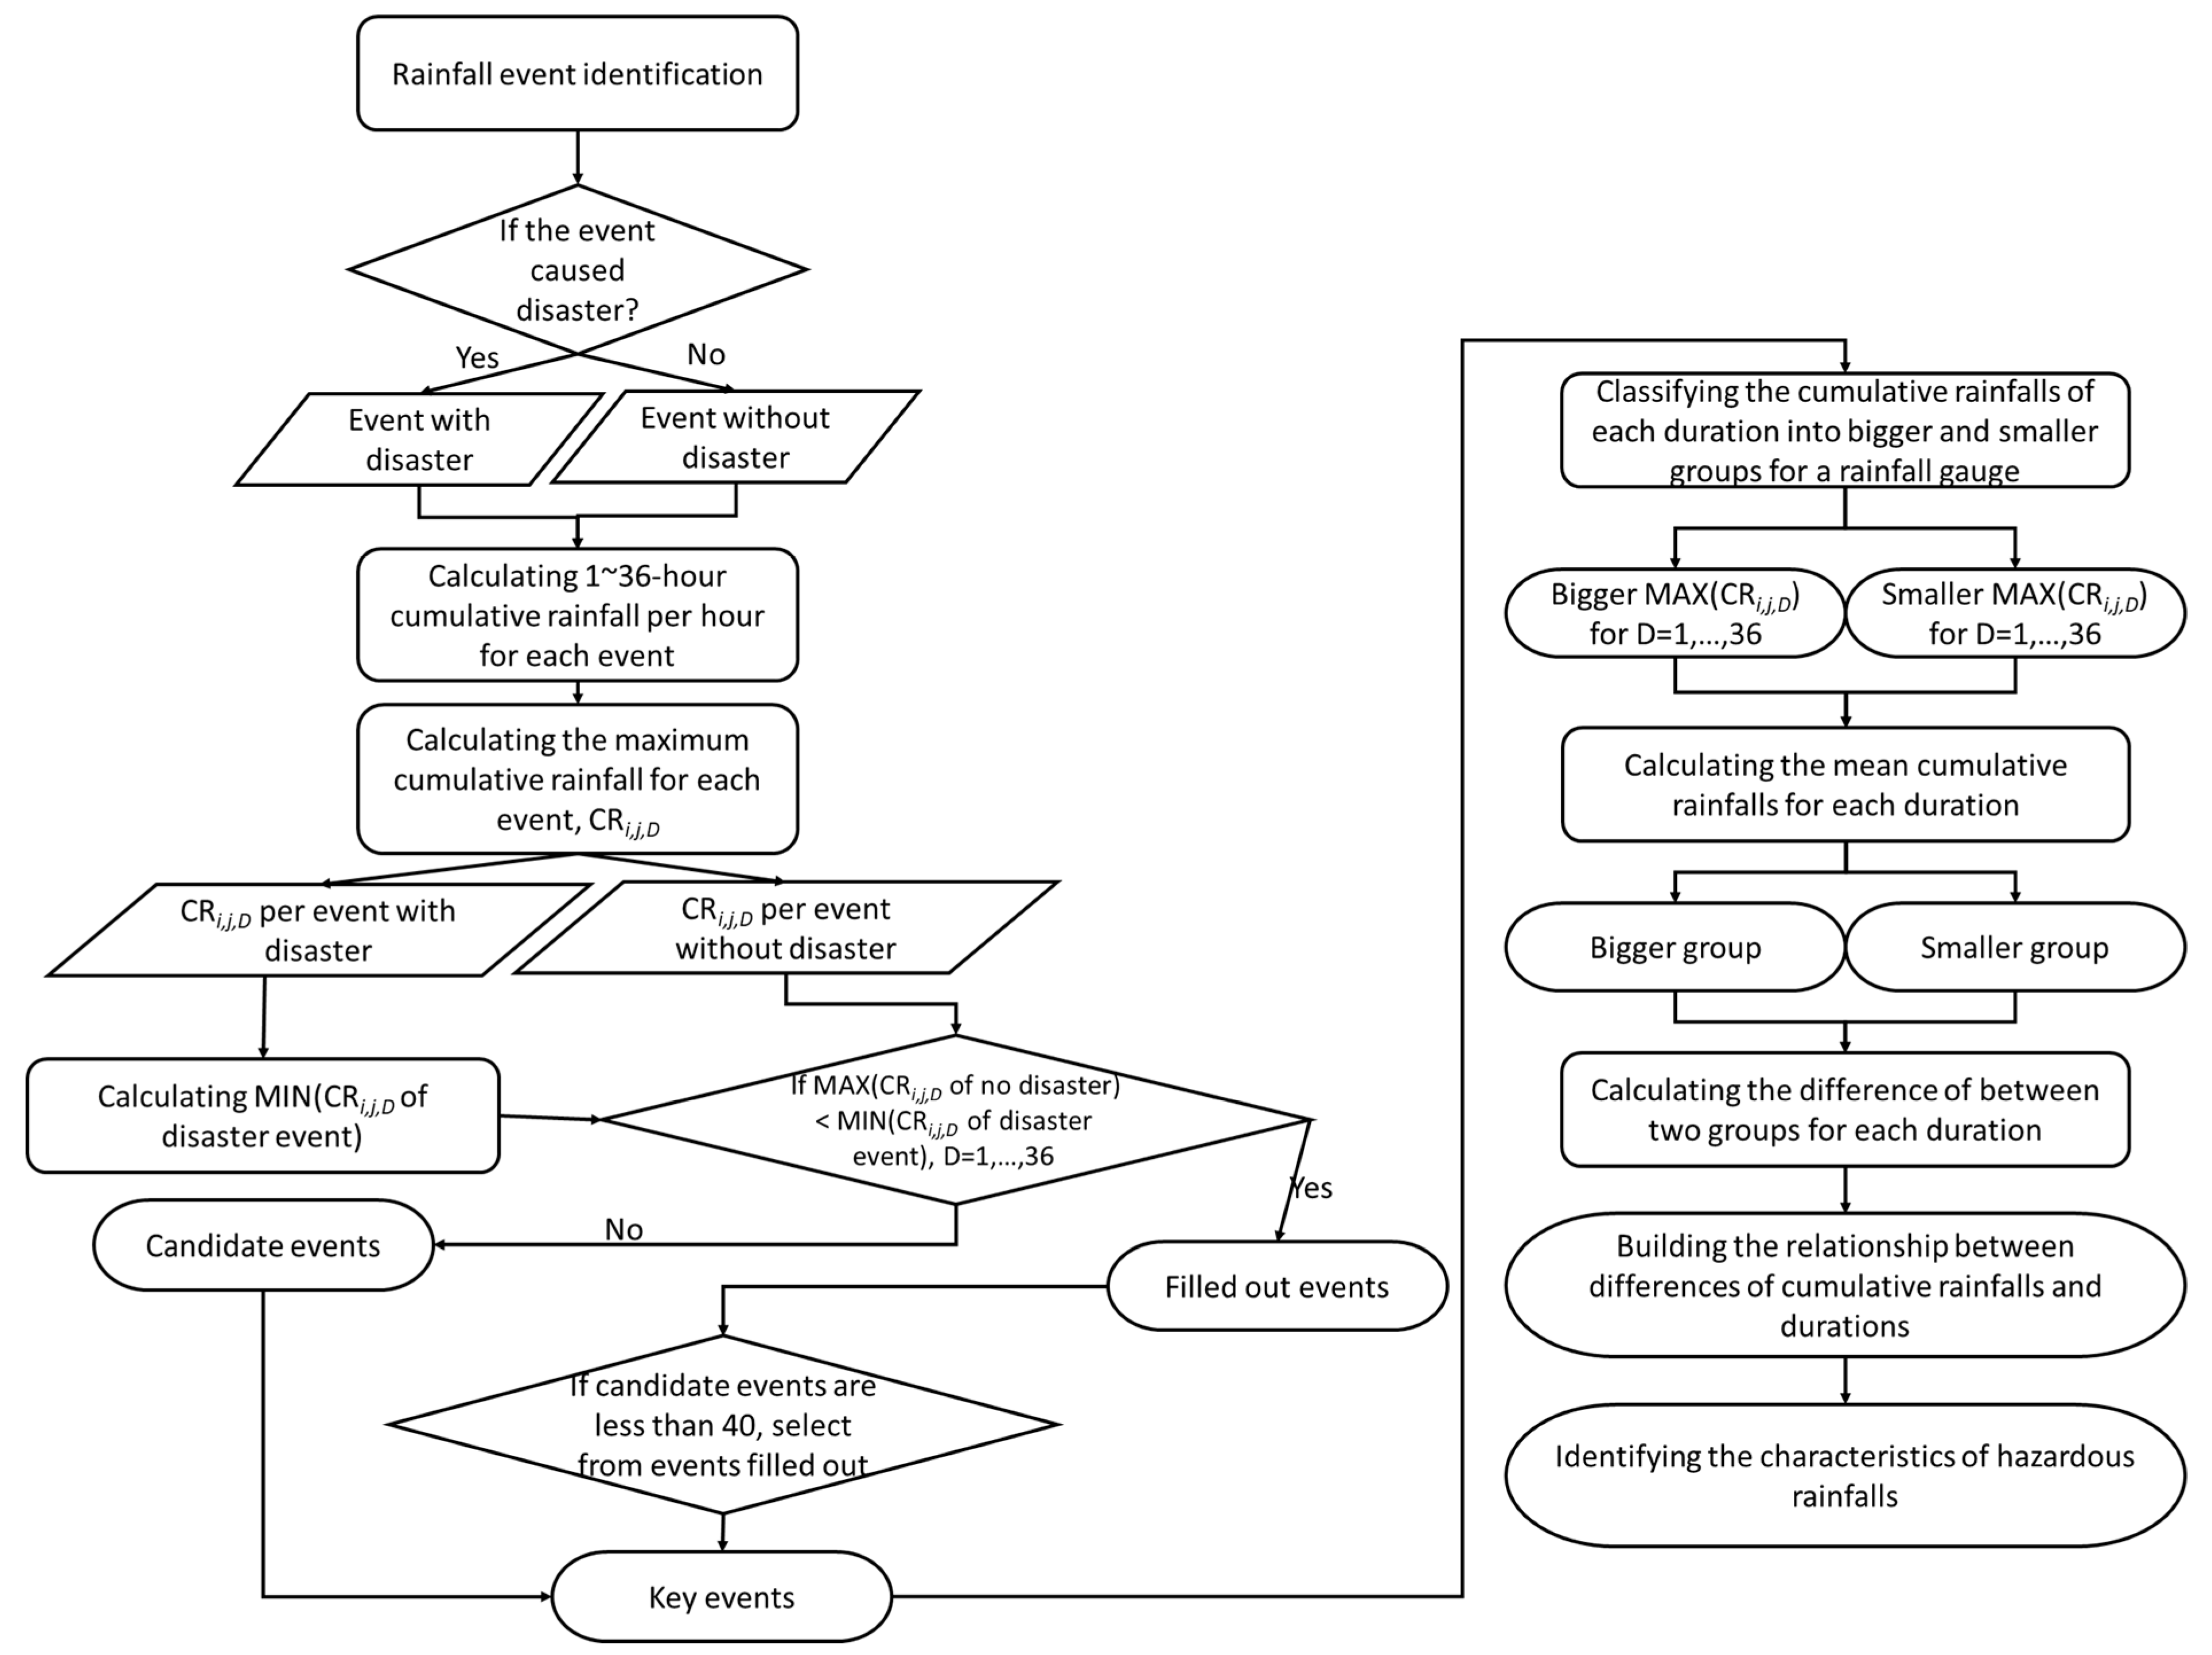
This study aims to develop a data-driven probabilistic model of rainfall-inundation prediction that issues flash-flood warnings. The model development proceeds in three main steps: identifying the characteristics of hazardously extreme rainfalls, optimizing the rainfall-inundation thresholds, and SVM training and validation. A flowchart of the model development is given in Figure 3. The detail of identifying the characteristics of hazardously extreme rainfalls is described in Section 3.2. In the second step, the rainfall thresholds at each rain gauge are optimized by trial and error based on the three statistics given in Section 3.3. The final step trains the probabilistic rainfall-inundation model on operational alarm results generated from the hourly screening of all observed rainfall events under their best rainfall thresholds. The kernel of the probabilistic rainfall-inundation model, SVM, is introduced in Section 3.4. The performance of the developed model is compared with that of the official rainfall-inundation warning system, as shown in Table 1.
3.2. Rainfall Pattern Analysis
The official rainfall thresholds of the WRA in Taiwan combine five durations (1, 3, 6, 12, and 24 h) in all rain gauges throughout Taiwan. However, the rainfall patterns captured by the rain gauges vary with geographical and hydrological environments [44,45,46]. For sensitively detecting hazardous events throughout the study area, one should identify the key durations of the extreme rainfalls.
First, the rainfall events in the data of the 17 rain gauges were identified by the following rules. The beginning of a rainfall event was detected by the hour of rainfall exceeding 0.5 mm/h, and the end of a rainfall event was detected as no rainfall for four consecutive hours [47]. If the ith rain gauge makes Ti hourly observations, the data can be denoted as:
where is the sequence of Ti hourly rainfalls, , of the ith rain gauge, and the jth event of the ith rain gauge can be expressed as Equation (2):
where and are the beginning and end time of the jth event, respectively.
Table S2 in the Supplementary Material shows the number of rainfall events from 2012 to 2015. In the Xindian River watershed, rainfalls were more frequent in mountainous areas than in plain areas, because the number of rainfall events increases from 515 to 890 as the rise of rain gauge elevates. The exceptions are Fushan(3) and Datungshan, where rainfall events are 345 and 322, respectively, due to the lack of observed data in 2013 and 2014. Fortunately, the Wulai district, where Fushan(3) and Datungshan are located, just suffered two floods in 2012 and 2015, respectively. Therefore, the data of both rain gauges were available for the present study.
To capture the temporal characteristics of hazardous rainfalls in the rain gauge data, the minimum values of the maximum cumulative rainfalls in the 1- to 36-h durations of all disaster events from 2012 to 2015 were adopted as the lower boundary. This boundary filters out the rainfall events with no danger potential. The maximum cumulative rainfall in the D-hour duration of the jth event of the ith rain gauge, is calculated as follows:
The key events Keyeventi, to be analyzed in further study, were then calculated by Equation (4).
where Keyeventi means the key events of the ith rain gauge. is screened by comparing with . The calculated results are listed in the column “key event no. (2012–2015)” of Table S2 in the Supplementary Material.
In districts struck by only one or two disaster events, the lower boundary would be high to carry out few events for further study. This situation happens in most of the rain gauges located in mountainous area because it is easy to induce rain but hard to induce floods in mountainous areas with high slope. In order to maintain a sufficient number of rainfall events for statistical analysis, we selected at least 40 rainfall events in each rain gauge based on their distance to the minimum cumulative rainfalls of the 1 to 36-h durations in a 36-dimensional space, as shown in Equation (5).
After classifying the cumulative rainfalls of each duration in a given rain gauge into larger and smaller groups, the difference between the mean cumulative rainfalls of both groups is calculated for each duration. Generally, this difference should reduce with increasing duration. If this trend is violated at a certain duration, we specify a feature of hazardous rainfall at this duration. Consequently, the characteristics of the extreme rainfalls related to disasters at each rain gauge are identified from the cumulative rainfalls in five 5-hourly intervals: 1–5, 6–10, 11–15, 16–20, and 21–25 h. If the differences between the rainfalls of two groups satisfy the decreasing trend for the five durations in a given interval, the cumulative rainfall of the shorter duration is set as the hazardous rainfall feature. The extreme rainfall characteristics related to disaster are identified through the flowchart shown in Figure 4.
3.3. Optimization of Rainfall-Inundation Thresholds
Based on the characteristics of hazardous rainfalls identified from Section 3.2, thresholds of cumulative rainfalls to induce inundation would be carried out in this step. To associate warning events with observed events, the pluvial flash-flood warnings are evaluated by a binary (yes/no) approach on the official reports of flood disaster [8]. Because the historical flood records of many countries mainly contain personal call data, which lack accurate flood times, there should be a certain lag time between flood records and real floods. Therefore, this study ignored the prediction of when floods happen and focused on if floods happen. The inundation warning mechanism of rainfall thresholds is composed of the observed cumulative rainfalls in the five durations identified by the rainfall pattern analysis as hourly input and a “yes” or “no” flood warning for each hour as output sets. By screening the hourly historical rainfalls by a flood warning threshold (which can be any cumulative rainfall in one of the five analyzed durations), one obtains four kinds of results (see Table 2). After constructing the contingency tables, three statistics were computed from the hits, misses, and false alarms in each contingency table. The probability of detection (POD) describes the fraction of observed pluvial flash floods that were correctly forecast:
A POD of 1 indicates that all flash floods were correctly warned, and 0 indicates that no flash floods were detected at the imposed warning threshold. The POD must be considered along with the false alarm ratio (FAR), which describes the fraction of warning events not associated with an observed event:
Similarly to POD, FAR ranges from 0 (all warning events were observed events) to 1 (none of the pluvial flash- flood warnings were associated with an observed event). A third statistic, the critical success index (CSI), or threat score, was computed as
The CSI combines the aspects of POD and FAR, and thus describes the skill of the warning system. The CSI ranges from 0 (no skill) to 1 (perfect skill).
For operational needs, governments have a responsibility of warning people before inundation. Therefore, POD is the first priority applied to evaluate the model performance. The second priority of the three statistics is FAR because the public easily ignores the warning of the model with high FAR. Consequently, the objective function of the optimized flood warning threshold at each rain gauge for warning the corresponding monitoring district via trial and error is the highest POD + (1-FAR) with higher POD. The performances of the given flood warning thresholds could be presented by CSI.
3.4. Support Vector Machine and Its Supervised Data Generation
The SVM [41] is a state-of-the-art supervised learning approach for binary classifications and other problems. Here, we introduce the soft-margin SVM, the most popular SVM for binary classifications. The dataset for binary classification is denoted as , where are the input feature vectors and are the output binary labels representing the two classes (in this case, yes or no). The linear version of the soft-margin SVM tries to locate a large-margin hyperplane by solving the following optimization problem:
subject to
The first term in the objective function attempts to pull each example by a safe margin from the decision hyperplane , and the second term ensures that the margin violations , if any, are properly penalized with a penalty parameter C. The large-margin formulation plays a regularization role and alleviates overfitting of the given dataset by the SVM [41].
The nonlinear extension of the linear version instead solves the following optimization problem:
subject to
In the nonlinear formulation, each feature vector first passes through a nonlinear transformation function Φ, which maps it to a (usually) higher dimensional space that improves the data separation. In principle, the transformation function Φ can map the feature vectors to a super-high or even infinite dimensional space if the kernel function that calculates can be efficiently computed [48]. In this case, the nonlinear SVM can be solved in the so-called dual form:
subject to
Several kernel functions corresponding to different Φ functions have been proposed [48]. Our work adopts the most-widely used kernel function, the Gaussian–RBF kernel . This kernel function is recommended by the standard practical procedure for SVM classification [49], which advocates a proper scaling of the feature vectors before grid-searching over the space, and finding the best parameter combination by cross-validation accuracy. The same procedure was adopted in our experiments. Applying the best on the whole D, one retrieves the optimal and computes the corresponding b through the relationship between the dual form and the original SVM problem [50]. Finally, the decision value of each test feature vector x is computed from the (αn, b) as follows:
The sign of the decision value determines whether vector x belongs to class +1 or class −1. The decision calculation requires only those with non-zero , which are called support vectors. The SVM is so named because it identifies the support vectors (and their coefficients ) needed to compute the decision values.
The original soft-margin SVM deterministically outputs the sign of the decision value . Platt (2000) [42] extended the SVM to probabilistic predictions by plugging as the input to a variant logistic regression formula that solves
In Equation (19), is a dataset-dependent value that approaches 1 when and 0 when . is a cross-validated estimate of . After optimizing the of the problem, the probabilistic prediction for each input vector x is computed as
The optimal A is typically positive, meaning that is large if is large and positive. This echoes the learning of the classifier sign () by the soft-margin SVM. The original extension solves the optimization problem by the Levenberg–Marquardt method [42]. Lin et al. (2007) [51] improved the robustness of the original extension by a Newton-method solution with a backtracking line search. Lin et al.’s (2007) [51] method is adopted in the LIBSVM package [50] and also in the present study.
Because the proposed probabilistic model of rainfall-inundation prediction is a data-driven model, its performance highly depends on the quality of the supervised data. However, as mentioned in the Introduction, the historical flood records of many countries mainly contain personal call data, which lack the accurate start times of floods. Therefore, generating satisfactory supervised data is a crucial step in the present study. The supervised data are composed of hourly input and output sets. The model inputs are the observed cumulative rainfalls in the five durations identified by the rainfall pattern analysis, and the outputs are a “yes” or “no” flood warning for each hour.
4. Results and Discussion
4.1. Identifying the Characteristics of Extreme Rainfalls
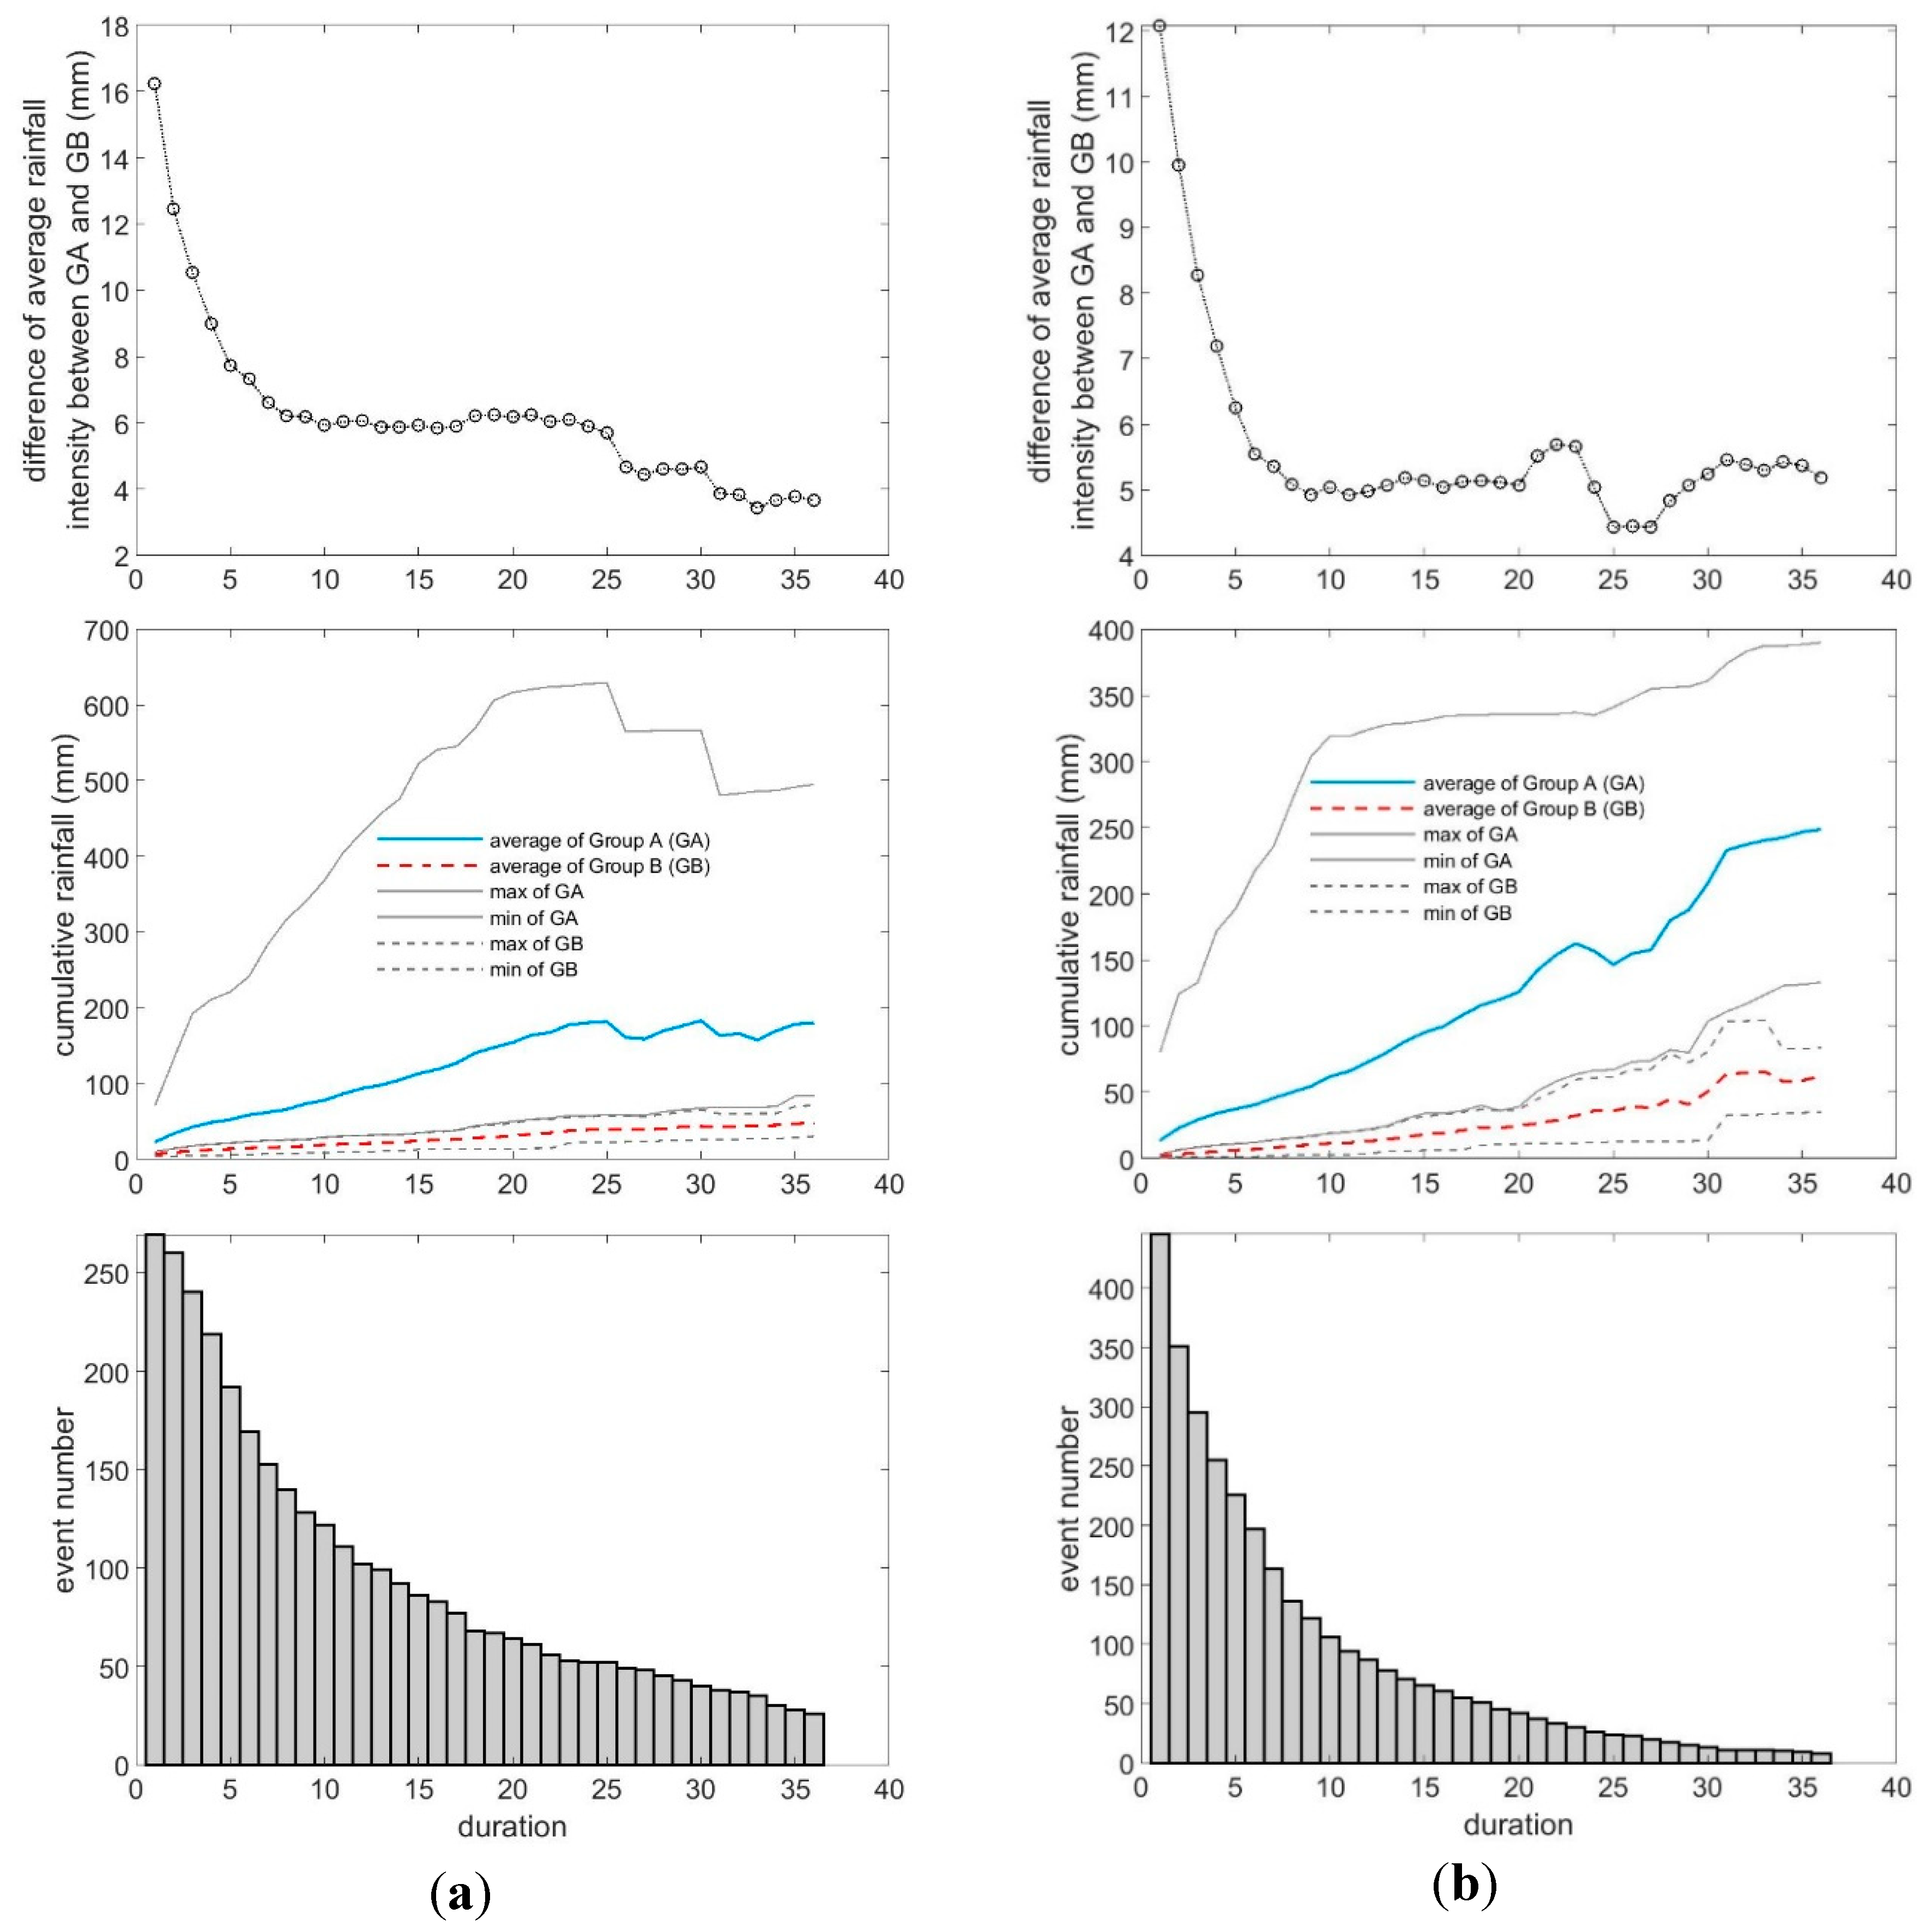
The characteristics of hazardous extreme rainfalls at Quchi (a mountainous area) and Zhongzheng Bridge (a plain area) are presented in panels (a) and (b) of Figure 5, respectively. At each rain gauge, the event number, cumulative rainfalls of two data groups, and the cumulative rainfall differences between the two groups are presented for rainfall durations from 1 to 36 h. At most rain gauges, fewer than 20 events lasted longer than 25 h. Therefore, the characteristics of hazardous extreme rainfalls were identified from the five categories of cumulative rainfalls between 1 and 25 h. At the Zhongzheng Bridge stations, fewer than 19.55% of the events exceeded half a day, confirming that brief, intense bursts of rainfall, such as afternoon thunderstorms, dominate the rainfall patterns on the plains. In contrast, rainfalls lasting longer than 24 h comprised 19.33% of the extreme rainfalls at the Quchi rain gauges. This reveals that typhoons or frontal-system rainfall patterns significantly contribute to the hazardous extreme rainfalls in the mountainous area of Taiwan.
Examining the cumulative rainfalls of the larger (A) and smaller (B) groups for the two rain gauges, the average curve of group A changes at approximately 25 h. The change-point implies that the rainfall pattern of the events lasting longer than one-day changes from typhoon rainfalls to frontal rainfalls or Northeast monsoon in winter. Furthermore, the range variations between the maximum and minimum cumulative rainfalls are significantly different in groups A and B. Such a significant difference in variation can reveal the characteristics of the hazardous rainfall patterns. Therefore, the characteristics of hazardous extreme rainfalls were identified from the differences between the average rainfall intensities in groups A and B (see to panels of Figure 5a,b) The segment above 25 h in the two panels is ignored because the number of events is too small in this region, as mentioned in the bar-graph discussion. At most of the rain gauges, the average hourly rainfall intensities differed by over 20 mm, but at the Zhongzheng Bridge rain gauge, they differed by only around 12 mm because over 400 events were recorded at this location, reducing the variances in the two groups. Although the average rainfall intensity decreased with increasing duration, its difference between groups A and B increased only over a certain duration. These differences were adopted as the characteristics related to hazardous extreme rainfalls.
Figure 6 visualizes the difference in average rainfall intensity between groups A and B over each duration at the 17 rain gauges, and Table 3 shows the key durations defining the hazardous rainfall characteristics. During the first interval (1–5 h), the 1-h rainfall intensity was stronger than the other average rainfall intensities (within 2 to 5 h). If the difference in average rainfall intensity between groups A and B decreases smoothly, the expected key durations are 1, 6, 11, 16, and 21 h. However, during the fifth interval (21–25 h), the key durations at 12 out of the 17 rain gauges exceeded 21 h. Meanwhile, in the second, third, and fourth intervals, 11, 7, and 6 out of the 17 rain gauges recorded key durations exceeding 6, 11, and 16 h, respectively. These results imply that the key durations are relatively more critical in the first, second, and fifth intervals than in the other intervals.
4.2. Optimization of Rainfall-Inundation Thresholds
This subsection optimizes the rainfall-inundation thresholds using the key durations of each rain gauge. According to the observed hourly rainfall data of the 17 rain gauges from 2012 to 2015 and the disaster events shown in Table S1 in the Supplementary Material, the rainfall-inundation thresholds were optimized for both the official key durations (1, 3, 6, 12, and 24 h) (Table S3 in the Supplementary Material) and the key durations identified in the rainfall pattern analysis (Table S4 in the Supplementary Material). Comparing the optimization results with the current official rainfall thresholds (Table 1), the optimized 1-h rainfall thresholds in the plain areas (Gongguan, Tucheng, Quchi, Wenshan, and Zhongzheng Bridge stations) were mostly modified upward (the exceptions were Taipei, Banquiao, and Xindian stations), while those in the mountainous areas (Tunghou, Xiapen, Datungshan, Shenkeng, Shiding, and Pinglin) were mostly modified downward (the exceptions were Fushan and Fushan(3) stations). Most of the optimized 3–24 rainfall thresholds were shifted downward and upward in the plain and mountain areas, respectively. Based on the differences between the current and optimal official rainfall thresholds in Table S3 in the Supplementary Material, the maximum increases were 24 and 20.5 mm for the 1- and 3-h durations respectively in the plains areas, and 25, 113.5, 141, 310, and 326.5 mm for the 1-, 3-, 6-, 12-, and 24-h durations, respectively, in the mountainous areas. The maximum decreases in the plain (mountainous) areas were 24 (25.5), 67.5 (15.5), 88 (88), 151.5 (86.5), and 218 mm (57 mm) for the 1-, 3-, 6-, 12-, and 24-h durations, respectively. The 1-h rainfall threshold might be related to the drainage system because the designed capacity of drainage systems in Taipei and New Taipei cities is calculated by hydrological frequency analysis of the 1- to 1.5-h rainfall events. Therefore, the upward modifications imply an improvement of the drainage system and more intensive maintenance in recent years. All of the 1-h rainfall thresholds exceeded 40 mm/hour, confirming the importance of the official heavy-rain warning threshold (40 mm/h rainfall intensity) drawn up by the Central Weather Bureau in Taiwan. Furthermore, the downward modification of the optimized 1-h rainfall thresholds in the mountainous areas implies that the hazardous rainfalls are often typhoon events with long durations, which have lower rainfall intensities than thundershowers that happened frequently in plain areas. The official and optimized thresholds of the 1-, 3-, and 6-h durations slightly differed at several rain gauges, namely, at Gongguan, Taipei, and Zhongzheng Bridge in the Zhongzheng district, Wenshan in the Wenshan district, Tucheng in the Banqiao district, Banqiao in the Tucheng district, and Zhongzheng Bridge in the Yonghe district. This implies the frequent occurrence of flash-flood disasters by extreme hourly rainfall in these districts. Furthermore, as the optimal thresholds of most rainfall durations in the plains and mountains were below and above the official thresholds, respectively, the current official cumulative rainfall thresholds overestimate and underestimate the number of hazardous extreme rainfall events in the plains and mountains, respectively. Briefly, Table S3 in the Supplementary Material shows the significant improvement of optimizing the official rainfall-inundation thresholds.
Through rainfall pattern analysis, key durations of each rain gauge were carried out to replace the durations of official cumulative thresholds, and the best rainfall-inundation thresholds of the key durations were re-optimized. Table S4 in Supplementary Material shows the optimal cumulative rainfall thresholds of the key durations, with the numbers in parentheses. Most of the 1-h and 6-h rainfall thresholds are matched in Tables S3 and S4 in the Supplementary Material: the exceptions are the 1-h rainfall thresholds at the Taipei rain gauge in Zhongzheng, the Banqiao rain gauge in Tucheng, and the Fushan rain gauge in Wulai, and the 6-h rainfall thresholds at the Banqiao rain gauge in Tucheng. However, at longer durations, only four rain gauges share the same thresholds in Tables S3 and S4 in Supplementary Material: the 12-h rainfall thresholds at the Quchi and Xindian rain gauges in Xindian, and the 24-h rainfall thresholds at the Banqiao and Tucheng rain gauges in Banqiao. The differences between Tables S3 and S4 in the Supplementary Material are related to the event numbers in different durations (e.g., Figure 5a,b): shorter duration events are more frequent than long-lasting events. As the number of events increases, the rainfall thresholds become more sensitive for the change of Table 2, so more of the thresholds converge in Tables S3 and S4 in the Supplementary Material at shorter durations than at longer durations.
4.3. Building a Probabilistic Rainfall-Inundation Model Based on SVM
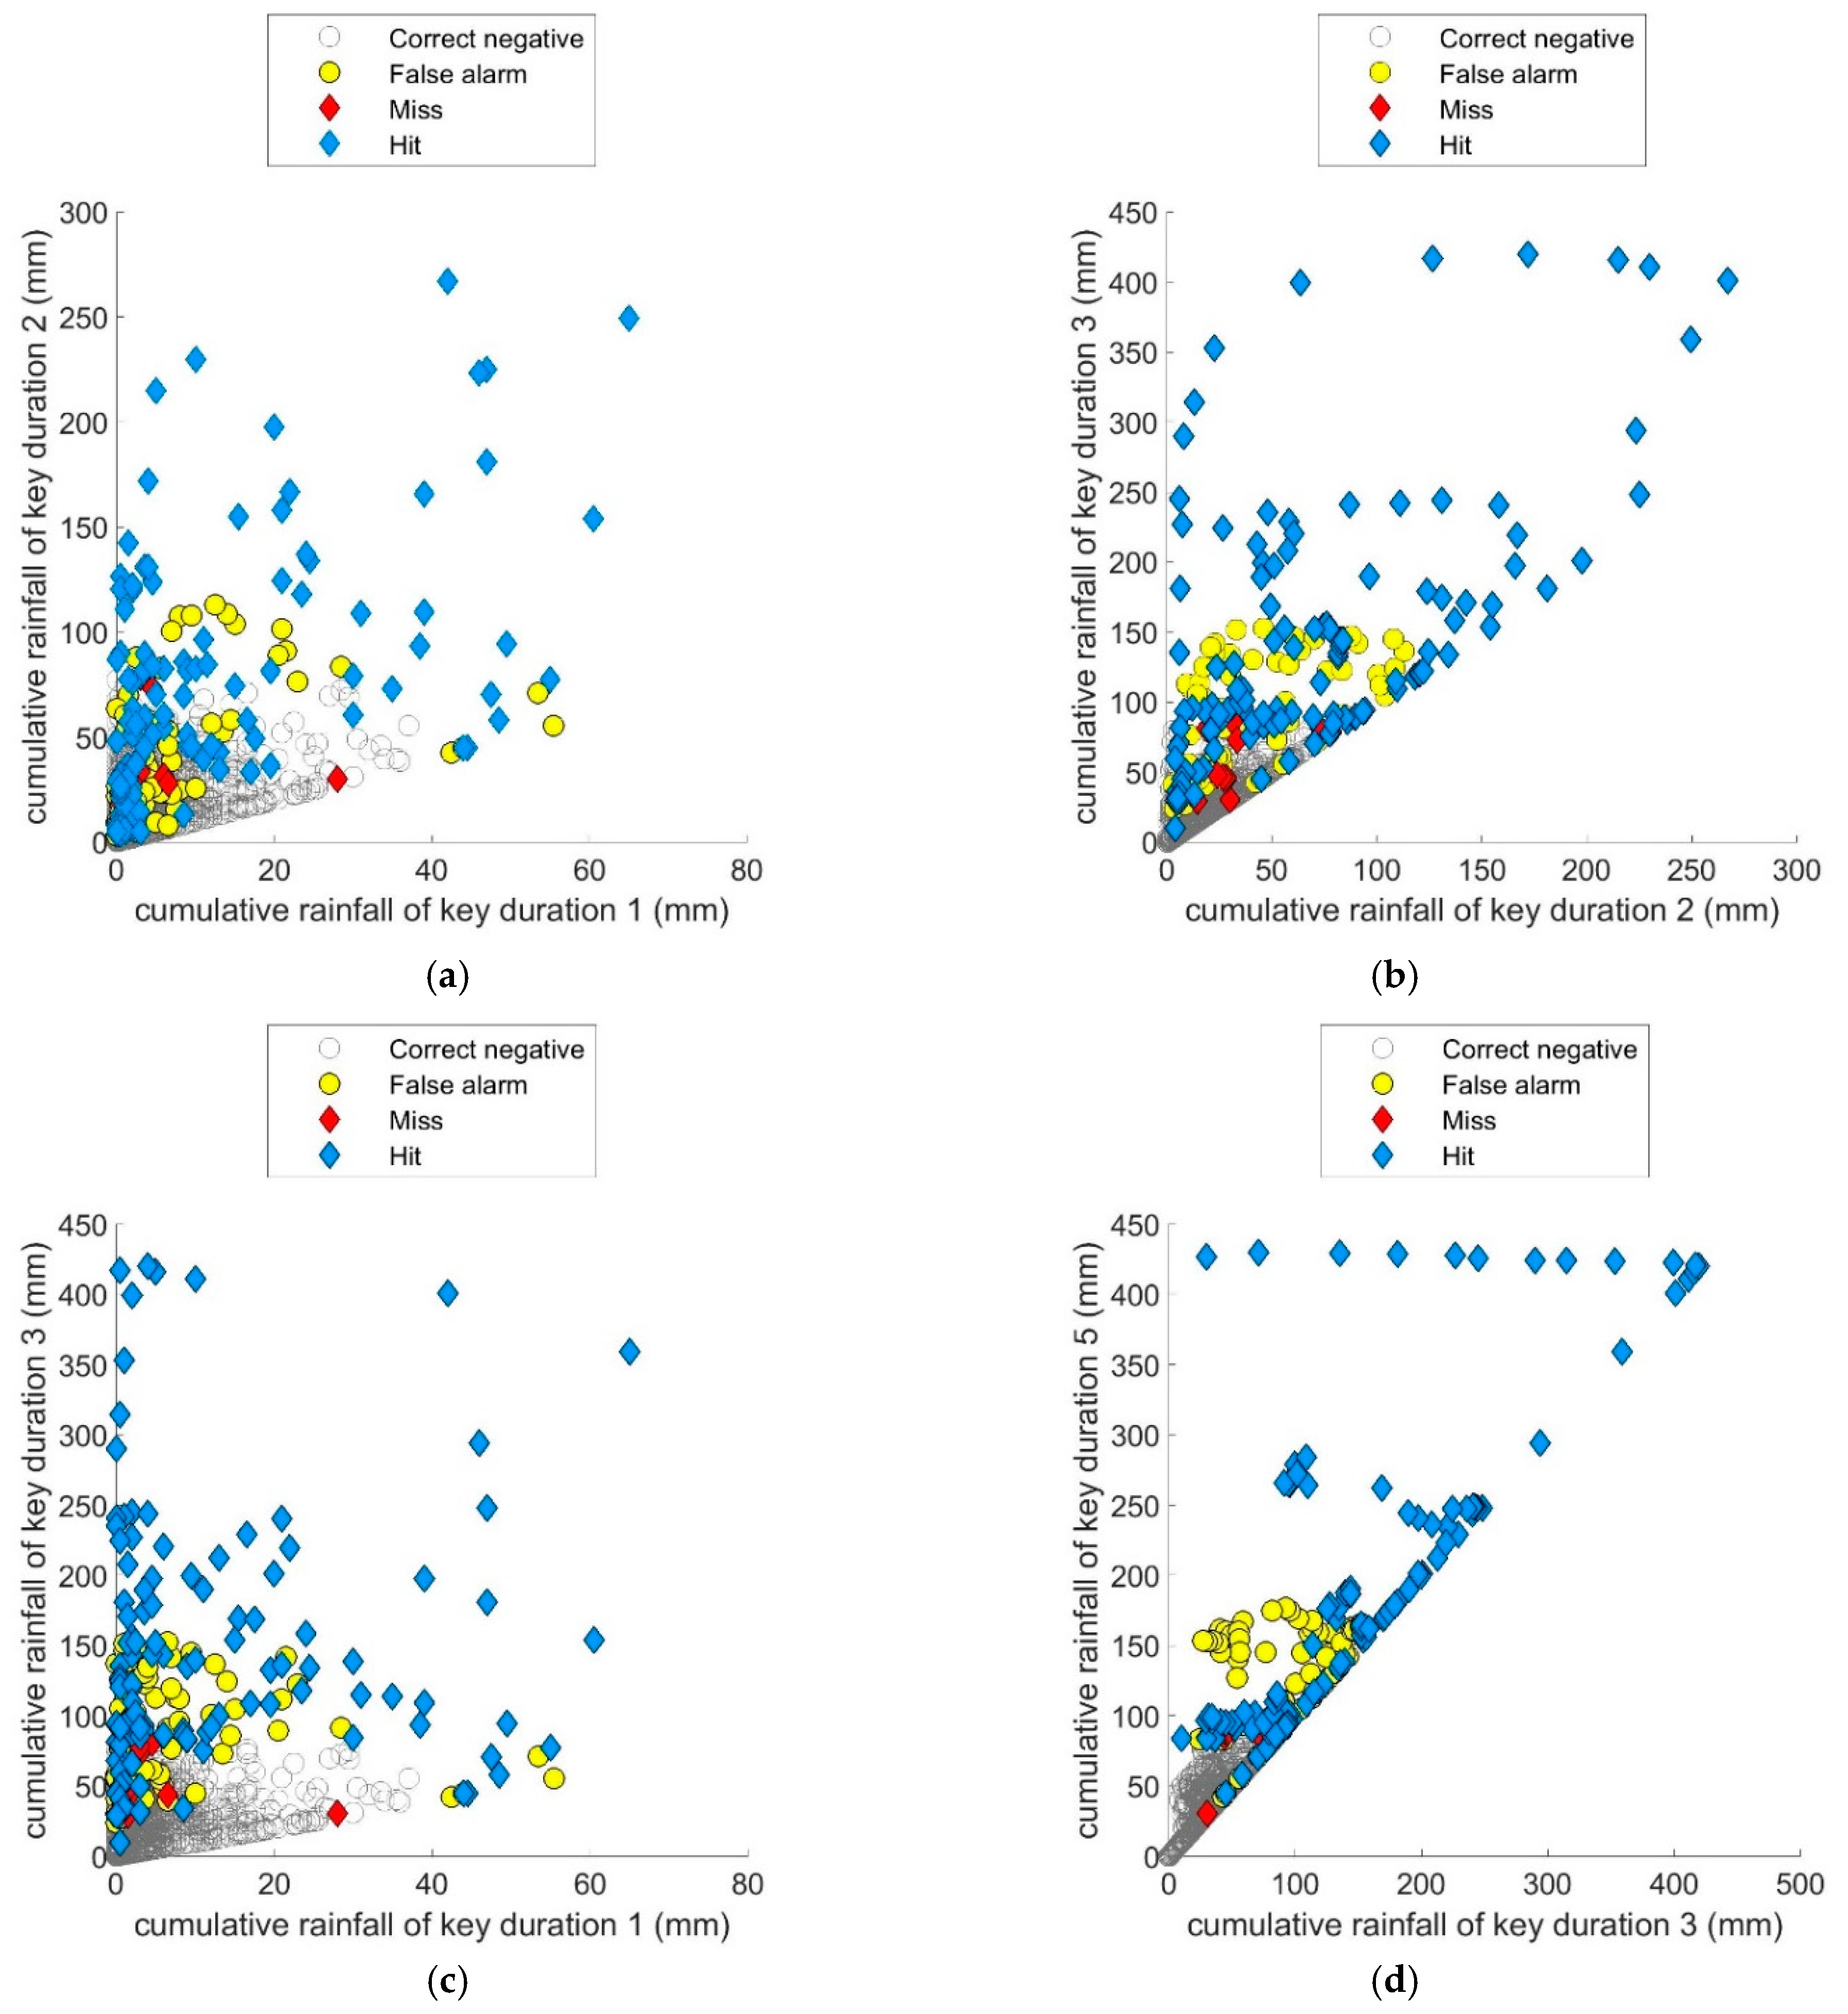
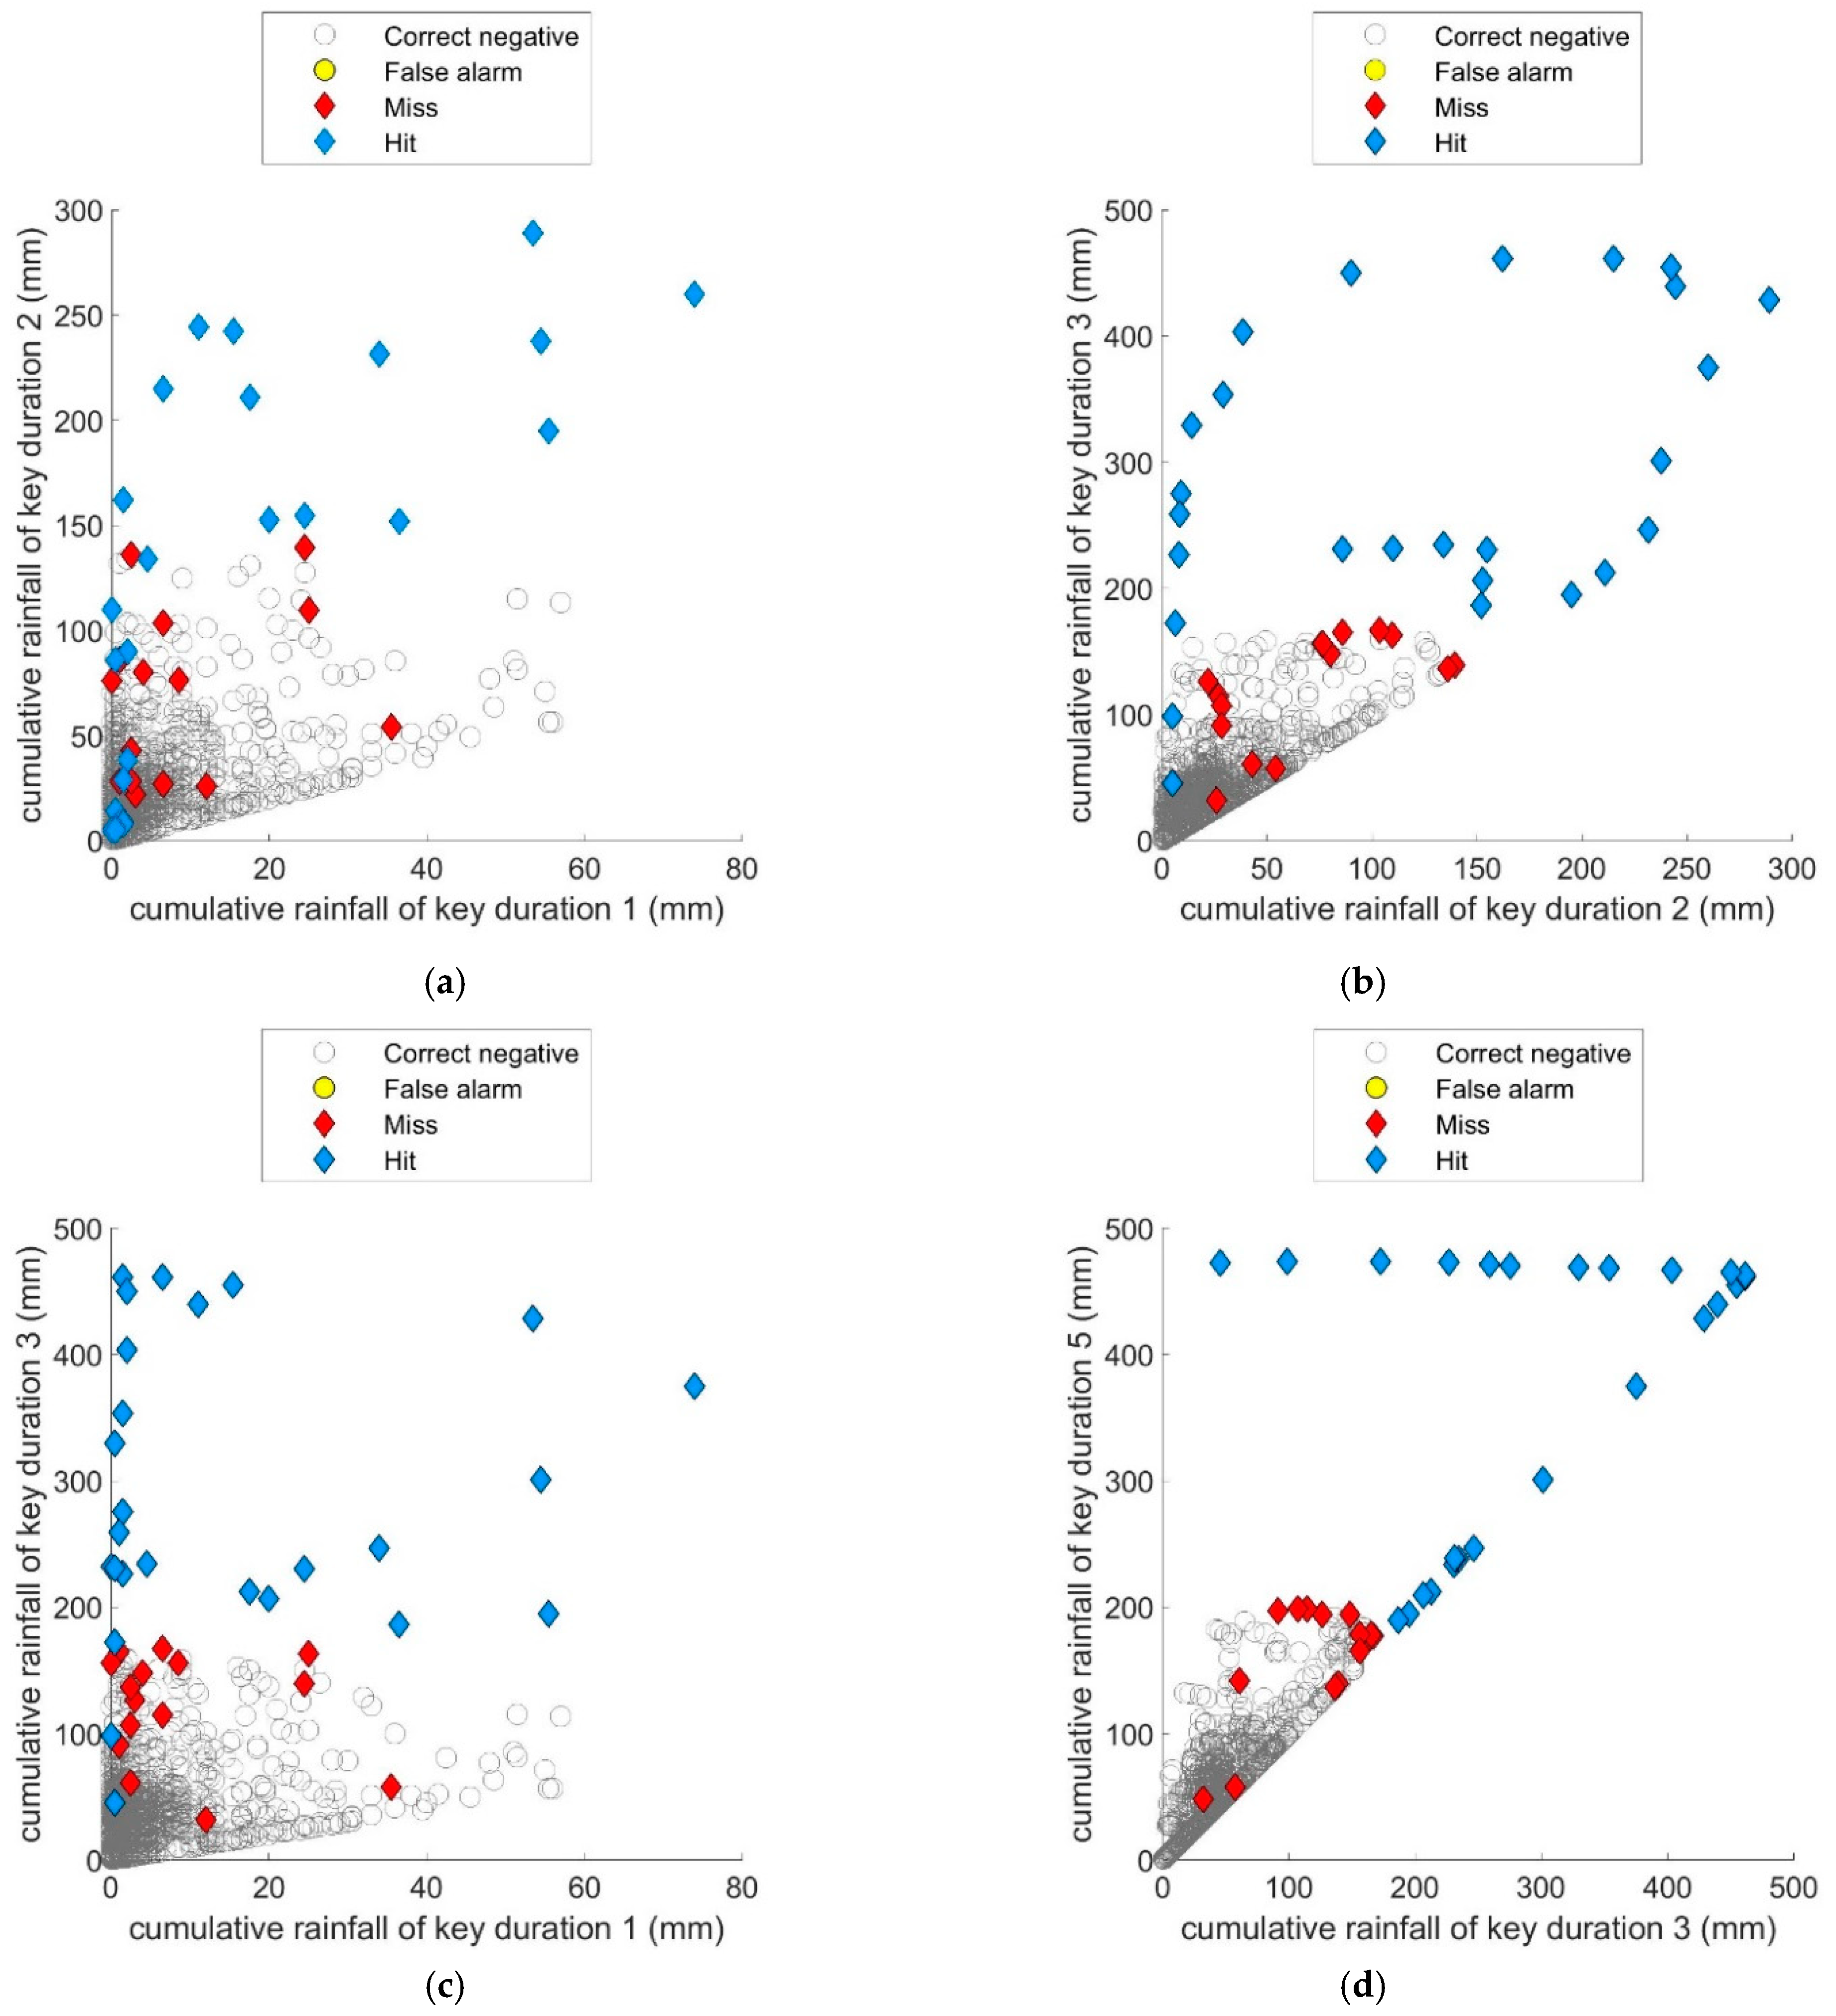
After optimizing the rainfall-inundation thresholds of different key durations, the key events of each rain gauge were screened by optimizing the rainfall-inundation thresholds in a rainfall pattern analysis. The results are shown in Table S5 in Supplementary Material. To ensure a high-quality hourly training and a proper input–output (I/O) dataset for testing the SVM, all hourly I/O data were checked and corrected for hourly misjudgment. Along the time series of the hourly I/O data, the I/O dataset was sampled once every 6 h, so the ratio of the training and testing data was 5:1. The warning results of the probabilistic rainfall-inundation model, obtained by the SVM, are given in the rightmost four columns of Table S5 in Supplementary Material. The warning performances of the four models, evaluated by the POD, FAR, and CSI criteria, are shown in Table S6 in the Supplementary Material. Comparing the criteria of the official cumulative rainfall thresholds with those of the optimized thresholds, the trial-and-error optimization significantly improved the warning performance. The rainfall pattern analysis that determines the key durations only slightly changed the POD but improved the FAR and CSI by reducing the number of false alarms. Consequently, the probabilistic SVM-based rainfall-inundation model was trained by the hourly data and corrected. The cumulative rainfall thresholds were then optimized based on the rainfall pattern analysis. The main advantage of the proposed SVM is its probabilistic output. To obtain a deterministic result, a flood warning was launched when the SVM output exceeded 50%. The well-trained SVM significantly outperformed the official thresholds, except at the Tucheng rainfall station for warning the Tucheng district, and the Fushan and Tunghou rainfall stations for warning the Wulai district. At these stations, the SVM missed one more disaster than the official thresholds but significantly decreased the number of false alarms. Briefly, based on the criteria differences between the developed SVM model and the official warning system, the SVM model most improved the warnings at Banqiao from the Banqiao rain gauge, and least improved the warnings at Tucheng from the Tucheng rain gauge. Figure 7 and Figure 8 are scatter plots of the warning results versus key duration in the Banqiao and Tucheng districts, respectively. The rain gauges in both of these districts are located in the plains area, and are co-monitored, meaning that their geographical separation is small. Therefore, similar key durations were identified in the rainfall pattern analyses of Banqiao (Tucheng): 1 (1), 6 (6), 14(14), 16 (16), and 24 (24) hours. However, as the flood prevention capacities differ between the two districts, their disaster event records are inconsistent (Table S1 in the Supplementary Material). As shown in Figure 7 and Figure 8, the scatter plots are more linear in durations three and five than in the other durations, revealing that the hazardous rainfalls are concentrated around half a day. This phenomenon implies that the rainfall-inundation thresholds of short durations are more important for flash-flood warnings than the long-duration thresholds, owing to the limited capacity of the drainage systems (not by overflow from levees). Figure 7 and Figure 8 also show the complexity of flood warnings based on rainfall thresholds: the hits (hollow circles) are mixed among the false alarms (solid circles) and misses (solid diamonds), posing challenges to classification based on rainfall thresholds. The poor performance of the Tucheng rain gauge in the Tucheng district is likely related to the quality of the training data; because the flooding hours cannot be sampled when the flood time is only one hour, such cases would be missed.
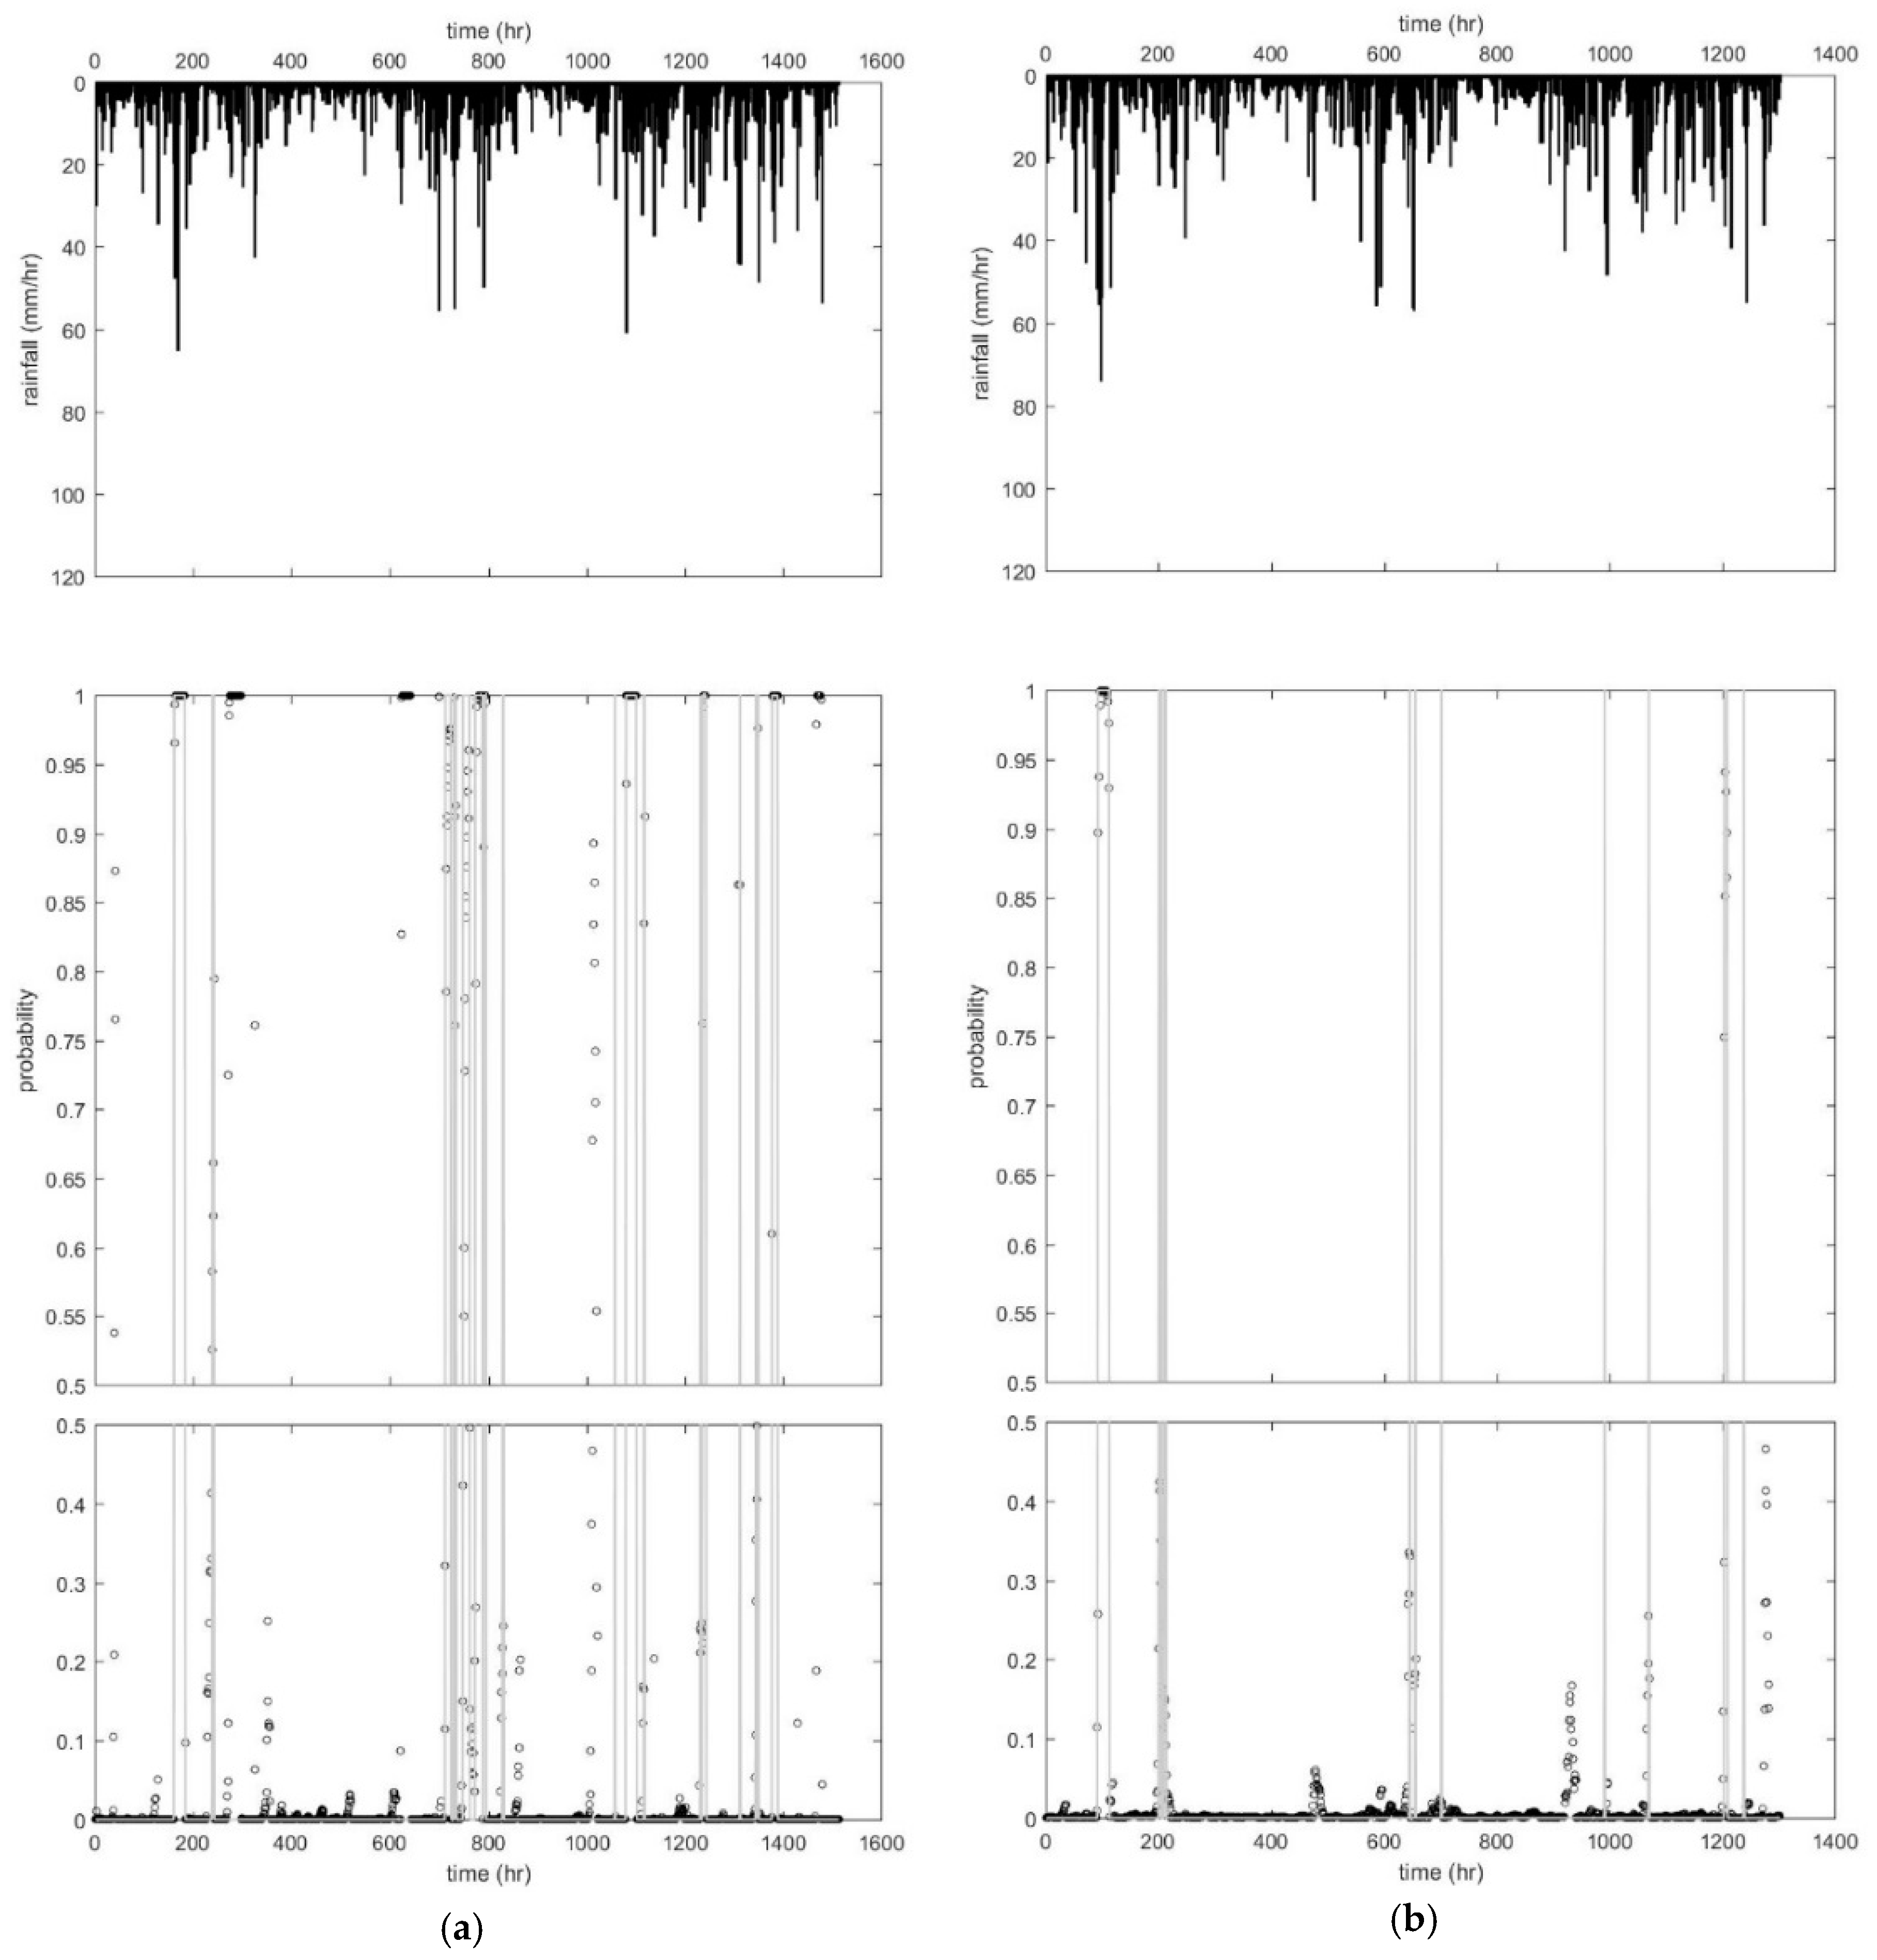
Whereas most rainfall-inundation warning systems output a simple Boolean description, our data-driven probabilistic rainfall-inundation model exports the probability of flooding. The hourly rainfalls of all key events at each rain gauge are shown as a time series in the top panels of the hyetographs in Figure 9. The hollow circles and solid lines indicate the flooding probabilities computed by the SVM model and the ideal Boolean outputs generated from the optimized rainfall-inundation thresholds, respectively. If the flooding probability obtained by the SVM model exceeds 0.5, a flood warning is launched. According to these results, the SVM model can provide 1- to 3-h advance warnings when the probability is approaching 0.5. Comparing panels (a) and (b) of Figure 9, which display the results of the Banqiao and Tucheng rain gauges, respectively, we find that the SVM is more sensitive in the Banqiao district than in the Tucheng district despite the similar rainfall hyetographs because more disaster events were sampled for the training data in the former district.
5. Conclusions and Recommendations
This study developed a data-driven probabilistic rainfall-inundation model based on a modified SVM and applied it to probabilistic flood warning in 12 watershed districts. The development was based on the hourly rainfalls at 17 rain gauges and 24 flood disaster reports from 2012 to 2015. As accurate flooding times are lacking in the data, our approach identifies the characteristics of extreme rainfalls by detecting the rainfall events, screening the key events, and analyzing the rainfall patterns. As a probe of the extreme rainfalls related to disaster events, the key durations are derived from the cumulative rainfall data and flood information only, with yes/no disaster decisions. The training and validation datasets of the SVM are then generated by an hourly screening of all rainfall events by the optimized rainfall thresholds. The screening is performed by trial and error. The resulting probabilistic rainfall-inundation model improves the traditional rainfall-inundation warning system from a simple Boolean description to a probabilistic output. The following conclusions can be drawn from this study:
- The rainfall patterns obtained by the rain gauges depend on the geographical and hydrological environment. Therefore, the key durations of the extreme rainfalls related to disaster events, identified by rainfall pattern analysis of the multi-duration cumulative rainfalls at the rain gauges, can improve the hazardous event identification.
- Because the developed probabilistic rainfall-inundation model is a data-driven model, its performance is highly sensitive to the quality of the supervised data. Here, satisfactory supervised data were generated by screening the hourly historical rainfalls using optimized flood warning thresholds.
- Regarding the characteristics of extreme rainfalls, the rainfall patterns showed that most of the disasters in the plain areas are induced by brief, high intensity rainfall events, whereas those in mountainous areas are caused by longer-duration typhoons or frontal systems. Furthermore, the key durations of the first (1–5 h), second (6–10 h), and fifth (21–25 h) intervals are more critical than those of the third (11–15 h) and fourth (16–20 h) intervals.
- The rainfall thresholds of each duration were optimized by the trial-and-error method, which is time consuming but guarantees a global optimum. The optimized rainfall thresholds were related to the capacities of the drainage systems in the study area. For practical operation, rounding the estimated values of rainfall thresholds at least till integer or 5 mm values would be appropriate due to local measurements of rainfall with complicated structure. Moreover, they ensured adequate supervised data for developing the data-driven probabilistic rainfall-inundation model of flash-flood warnings.
- Among four approaches, applying the rainfall-inundation thresholds established by trial and error to the officially designed durations, and applying the key durations obtained in the rainfall pattern analysis significantly improved the official warning system. Furthermore, determining the key durations by rainfall pattern analysis only slightly affected the probability of disaster detection but significantly improved the FAR and CSI by reducing the number of false alarms. Moreover, although the supervised data were generated from similar optimized rainfall-inundation thresholds, the flash-flood warning performance was significantly higher in the proposed model than in the official warning system.
- Most rainfall-inundation warning systems only provide a Boolean description, but our data-driven probabilistic rainfall-inundation model exports the probability of floods. The modified SVM model can provide 1- to 3-h advance warnings when the probability is approaching 0.5. Through such probabilistic warning, the model not only quantifies the potential risk of impacts for decision makers, but also provides early warnings based on probability changes.
- This analysis was conducted on the station (point) scales. It means local rain gauges only. Therefore, the spatial impacts by considering the whole stations together need to be addressed to check such outputs changes over the whole region for further study.
Although the warning performance of the proposed model could be improved, the proposed framework will promote the quality of real-time flash-flood warnings by quantifying the potential flood disaster risk. In further study, the model’s efficiency could be enhanced by importing multiple flood reports and rainfall data, such as flood maps produced by numerical inundation models. These sources would raise the quality of the flood reports. Moreover, quantified precipitation estimation of radar data would upgrade the observed rainfall from rain gauge points to entire three-dimensional field scanning.
Supplementary Materials
The following are available online at https://www.mdpi.com/2073-4441/11/12/2534/s1, Table S1: Dates and disaster areas of hazardous extreme rainfall events in the Xindian River watershed from 2012 to 2015, Table S2: Profiles of the rain gauges in the Xindian River watershed, Table S3: The optimal official cumulative rainfall thresholds for the key durations, 1, 3, 6, 12, and 24 hours, Table S4: Optimal cumulative rainfall thresholds of the key durations based on rainfall pattern analysis, Table S5: Warning results of 4 models in 12 Taiwanese districts (obtained from the data of 17 rain gauges), Table S6: POD, FAR and CSI performances of the 4 models.
Author Contributions
Conceptualization, T.-Y.P.; formal analysis, T.-Y.P. and H.-Y.L.; funding acquisition, T.-Y.P. and H.-T.L.; investigation, T.-Y.P. and H.-Y.L.; methodology, T.-Y.P. and H.-T.L.; software, T.-Y.P.; supervision, H.-T.L.; validation, T.-Y.P.; visualization, T.-Y.P. and H.-Y.L.; writing—original draft, T.-Y.P.; writing—review and editing, H.-T.L. and H.-Y.L.
Funding
This study is funded by Ministry of Science and Technology, Taiwan, under Grants MOST 107-2628-E-002-008-MY3.
Acknowledgments
The authors would like to thank the Water Resources Agency and Central Weather Bureau in Taiwan for providing the monitoring data. In addition, the authors appreciate, the Center for Weather Climate and Disaster Research of National Taiwan University and Research Center of Climate Change and Sustainable Development of National Taiwan University for their facilities and support.
Conflicts of Interest
The authors declare no conflict of interest.
References
- Yin, J.; Yu, D.; Yin, Z.; Liu, M.; He, Q. Evaluating the impact and risk of pluvial flash flood on intra-urban road network: A case study in the city center of Shanghai, China. J. Hydrol. 2016, 537, 138–145. [Google Scholar] [CrossRef]
- Candela, A.; Aronica, G.T. Rainfall thresholds derivation for warning pluvial flooding risk in urbanised areas. In Proceedings of the 3rd European Conference on Flood Risk Management, Lyon, France, 17–21 October 2016; Volume 7, p. 18016. [Google Scholar] [CrossRef]
- Douinot, A.; Roux, H.; Garambois, P.A.; Larnier, K.; Labat, D.; Dartus, D. Accounting for rainfall systematic spatial variability in flash flood forecasting. J. Hydrol. 2016, 541, 359–370. [Google Scholar] [CrossRef]
- Clark, C. Saving lives: Timely flash flood warnings in the UK. J. Geosci. Environ. Prot. 2017, 5, 60–74. [Google Scholar] [CrossRef]
- Forestieri, A.; Caracciolo, D.; Arnone, E.; Noto, L.V. Derivation of rainfall thresholds for flash flood warning in a Sicilian basin using a hydrological model. Procedia Eng. 2016, 154, 818–825. [Google Scholar] [CrossRef]
- Norbiato, D.; Borga, M.; Degli Esposti, S.; Gaume, E.; Anquetin, S. Flash flood warning based on rainfall thresholds and soil moisture conditions: an assessment for gauged and ungauged basins. J. Hydrol. 2008, 362, 274–290. [Google Scholar] [CrossRef]
- Golian, S.; Saghafian, B.; Elmi, M.; Maknoon, R. Probabilistic rainfall thresholds for flood forecasting: evaluating different methodologies for modelling rainfall spatial correlation (or dependence). Hydrol. Process. 2011, 25, 2046–2055. [Google Scholar] [CrossRef]
- Gourley, J.J.; Erlingis, J.M.; Hong, Y.; Wells, E.B. Evaluation of tools used for monitoring and forecasting flash floods in the United States. Weather Forecast 2012, 27, 158–173. [Google Scholar] [CrossRef]
- Diakakis, M. Rainfall thresholds for flood triggering. The case of Marathonas in Greece. Nat. Hazards 2012, 60, 789–800. [Google Scholar] [CrossRef]
- Seo, D.; Lakhankar, T.; Mejia, J.; Cosgrove, B.; Khanbilvardi, R. Evaluation of operational national weather service gridded flash flood guidance over the Arkansas Red River Basin. J. Am. Water Resour. Assoc. 2013, 49, 1296–1307. [Google Scholar] [CrossRef]
- Clark, R.A.; Gourley, J.J.; Flamig, Z.L.; Hong, Y.; Clark, E. CONUS-wide evaluation of national weather service flash flood guidance products. Weather Forecast 2014, 29, 377–392. [Google Scholar] [CrossRef]
- Bezak, N.; Šraj, M.; Mikoš, M. Copula-based IDF curves and empirical rainfall thresholds for flash floods and rainfall-induced landslides. J. Hydrol. 2016, 541, 272–284. [Google Scholar] [CrossRef]
- Marra, F.; Nikolopoulos, E.I.; Creutin, J.D.; Borga, M. Space–time organization of debris flows-triggering rainfall and its effect on the identification of the rainfall threshold relationship. J. Hydrol. 2016, 541, 246–255. [Google Scholar] [CrossRef]
- Miao, Q.; Yang, D.; Yang, H.; Li, Z. Establishing a rainfall threshold for flash flood warnings in China’s mountainous areas based on a distributed hydrological model. J. Hydrol. 2016, 541, 371–386. [Google Scholar] [CrossRef]
- Liao, H.-Y.; Pan, T.-Y.; Chang, H.-K.; Hsieh, C.-T.; Lai, J.-S.; Tan, Y.-C.; Su, M.-D. Using Tabu Search Adjusted with Urban Sewer Flood Simulation to Improve Pluvial Flood Warning via Rainfall Thresholds. Water 2019, 11, 348. [Google Scholar] [CrossRef]
- Fan, J.C.; Liu, C.H.; Wu, M.F.; Yu, S.K. Determination of critical rainfall thresholds for debris-flow occurrence in central Taiwan and their revision after the 1999 Chi-Chi great earthquake. In Proceedings of the 3rd International DFHM Conference, Davos, Switzerland, 10–12 September 2003; Volume 1, pp. 103–114. [Google Scholar]
- Shieh, C.L.; Chen, Y.S.; Tsai, Y.J.; Wu, J.H. Variability in rainfall threshold for debris flow after the Chi-Chi earthquake in central Taiwan, China. Int. J. Sediment Res. 2009, 24, 177–188. [Google Scholar] [CrossRef]
- Yang, T.H.; Yang, S.C.; Ho, J.Y.; Lin, G.F.; Hwang, G.D.; Lee, C.S. Flash flood warnings using the ensemble precipitation forecasting technique: A case study on forecasting floods in Taiwan caused by typhoons. J. Hydrol. 2015, 520, 367–378. [Google Scholar] [CrossRef]
- Wu, D.S.; Wang, Y.F. A research on using critical precipitation value for Taiwan inundation warning system. In Proceedings of the 2009 Conference for Disaster Management in Taiwan, Taipei, Taiwan, 2009. (In Chinese). [Google Scholar]
- Pan, T.Y.; Yang, Y.T.; Kuo, H.C.; Tan, Y.C.; Lai, J.S.; Chang, T.J.; Lee, C.S.; Hsu, K.H. Improvement of statistical typhoon rainfall forecasting with ANN-based southwest monsoon enhancement. Terr. Atmos. Ocean. Sci. 2011, 22, 633–645. [Google Scholar] [CrossRef]
- Pan, T.Y.; Chang, L.Y.; Lai, J.S.; Chang, H.K.; Lee, C.S.; Tan, Y.C. Coupling typhoon rainfall forecasting with overland-flow modeling for early warning of inundation. Nat. Hazards 2014, 70, 1763–1793. [Google Scholar] [CrossRef]
- Buizza, R. The value of probabilistic prediction. Atmos. Sci. Lett. 2008, 9, 36–42. [Google Scholar] [CrossRef]
- Verkade, J.S.; Werner, M.G.F. Estimating the benefits of single value and probability forecasting for flood warning. Hydrol. Earth Syst. Sci. 2011, 15, 3751–3765. [Google Scholar] [CrossRef]
- Pappenberger, F.; Cloke, H.L.; Parker, D.J.; Wetterhall, F.; Richardson, D.S.; Thielen, J. The monetary benefit of early flood warnings in Europe. Environ. Sci. Policy 2015, 51, 278–291. [Google Scholar] [CrossRef]
- Arnal, L.; Ramos, M.H.; Coughlan de Perez, E.; Cloke, H.L.; Stephens, E.; Wetterhall, F.; Van Andel, S.J.; Pappenberger, F. Willingness-to-pay for a probabilistic flood forecast: a risk-based decision-making game. Hydrol. Earth Syst. Sci. 2016, 20, 3109–3128. [Google Scholar] [CrossRef]
- New, M.; Lopez, A.; Dessai, S.; Wilby, R. Challenges in using probabilistic climate change information for impact assessments: an example from the water sector. Philos. Trans. R. Soc. A 2007, 365, 2117–2131. [Google Scholar] [CrossRef] [PubMed]
- Siccardi, F.; Boni, G.; Ferrais, L.; Rudari, R. A hydrometeorological approach for probabilistic flood forecast. J. Geophys. Res. 2005, 110, D5. [Google Scholar] [CrossRef]
- Pappenberger, F.; Bartholmes, J.; Thielen, J.; Cloke, H.L.; Buizza, R.; de Roo, A. New dimensions in early flood warning across the globe using grand-ensemble weather predictions. Geophys. Res. Lett. 2008, 35, L10404. [Google Scholar] [CrossRef]
- Alfieri, L.; Velasco, D.; Thielen, J. Flash flood detection through a multi-stage probabilistic warning system for heavy precipitation events. Adv. Geosci. 2011, 9, 69–75. [Google Scholar] [CrossRef]
- Dale, M.; Wicks, J.; Mylne, K.; Pappenberger, F.; Laeger, S.; Taylor, S. Probabilistic flood forecasting and decision-making: an innovative risk-based approach. Nat. Hazards 2014, 70, 159–172. [Google Scholar] [CrossRef]
- Hardy, J.; Gourley, J.J.; Kirstetter, P.E.; Hong, Y.; Kong, F.; Flamig, Z.L. A method for probabilistic flash flood forecasting. J. Hydrol. 2016, 541, 480–494. [Google Scholar] [CrossRef]
- Buahin, C.A.; Sangwan, N.; Fagan, C.; Maidment, D.R.; Horsburgh, J.S.; Nelson, E.J.; Merwade, V.; Rae, C. Probabilistic flood inundation forecasting using rating curve libraries. J. Am. Water Resour. Assoc. 2017, 53, 300–315. [Google Scholar] [CrossRef]
- Todini, E. A model conditional processor to assess predictive uncertainty in flood forecasting. Int. J. River Basin Manag. 2008, 6, 123–137. [Google Scholar] [CrossRef]
- Biondi, D.; Todini, E. Comparing hydrological postprocessors including ensemble predictions into full predictive probability distribution of streamflow. Water Resour. Res. 2018, 54, 9860–9882. [Google Scholar] [CrossRef] [Green Version]
- Krzysztofowicz, R. Bayesian theory of probabilistic forecasting via deterministic hydrologic model. Water Resour. Res. 1999, 35, 2739–2750. [Google Scholar] [CrossRef] [Green Version]
- Montanari, A.; Brath, A. A stochastic approach for assessing the uncertainty of rainfall-runoff simulations. Water Resour. Res. 2004, 40, W01106. [Google Scholar] [CrossRef]
- Todini, E.; Coccia, G.; Ortiz, E. On the proper use of Ensembles for Predictive Uncertainty assessment. In Proceedings of the European Geosciences Union General Assembly 2015, Vienna, Austria, 12–17 April 2015; Volume 17. EGU2015-10365. [Google Scholar]
- Abu-Mostafa, Y.S.; Magdon-Ismail, M.; Lin, H.T. Learning from Data: A Short Course; AMLBook: New York, NY, USA, 2012. [Google Scholar]
- Breiman, L. Random forests. Mach. Learn. 2001, 45, 5–32. [Google Scholar] [CrossRef] [Green Version]
- Friedman, J.H. Greedy function approximation: a gradient boosting machine. Ann. Stat. 2001, 29, 1189–1232. [Google Scholar] [CrossRef]
- Cortes, C.; Vapnik, V. Support-vector networks. Mach. Learn. 1995, 20, 273–297. [Google Scholar] [CrossRef]
- Platt, J. Probabilistic outputs for support vector machines and comparison to regularized likelihood methods. In Advances in Large Margin Classifiers; Smola, A., Bartlett, P., Sch¨olkopf, B., Schuurmans, D., Eds.; MIT Press: Cambridge, MA, USA, 2000; Volume 10, pp. 61–74. [Google Scholar]
- Capital Engineering Corporation. The improvement plan of upper and middle reaches of Xin-dian River system; The Tenth River Management Office, Water Resources Agency, MOEA: Taipei, Taiwan, 2009. [Google Scholar]
- Arnaud, P.; Bouvier, C.; Cisneros, L.; Dominguez, R. Influence of rainfall spatial variability on flood prediction. J. Hydrol. 2002, 260, 216–230. [Google Scholar] [CrossRef]
- Burian, S.; Shepherd, J.M. Effect of urbanization on the diurnal rainfall pattern in Houston. Hydrol. Process. 2005, 19, 1089–1103. [Google Scholar] [CrossRef]
- Segond, M.L.; Wheater, H.S.; Onof, C. The significance of spatial rainfall representation for flood runoff estimation: A numerical evaluation based on the Lee catchment. J. Hydrol. 2007, 347, 116–131. [Google Scholar] [CrossRef]
- Cheng, K.S.; Hueter, I.; Hsu, E.C.; Yeh, H.C. A scale-invariant Gauss-Markov model for design storm hyetographs. J. Am. Water Resour. Assoc. 2001, 37, 723–735. [Google Scholar] [CrossRef]
- Vapnik, V. Statistical Learning Theory; John Wiley & Sons: Hoboken, NJ, USA, 1998. [Google Scholar]
- Hsu, C.W.; Chang, C.C.; Lin, C.J. A practical guide to support vector classification; Technical report; Department of Computer Science, National Taiwan University: Taipei, Taiwan, 2003. [Google Scholar]
- Chang, C.C.; Lin, C.J. LIBSVM: a library for support vector machines. ACM Trans. Intell. Syst. Technol. 2011, 2, 27. [Google Scholar] [CrossRef]
- Lin, H.T.; Lin, C.J.; Weng, R.C. A note on Platt’s probabilistic outputs for support vector machines. Mach. Learn. 2007, 68, 267–276. [Google Scholar] [CrossRef] [Green Version]
Figure 1.
The study area: Xindian River watershed with the locations of rain gauges and water level stations (district and rain gauge numbers are described in Tables S1 and S2 in the Supplementary Material, respectively) where the yellow area is a potential inundation area identified by WRA.
Figure 1.
The study area: Xindian River watershed with the locations of rain gauges and water level stations (district and rain gauge numbers are described in Tables S1 and S2 in the Supplementary Material, respectively) where the yellow area is a potential inundation area identified by WRA.

Figure 2.
Rainfall-water level processes of 24 extreme rainfall events in the Xindian River watershed based on the records of the 4 rain gauges and 2 water level stations from 2012 to 2015.
Figure 2.
Rainfall-water level processes of 24 extreme rainfall events in the Xindian River watershed based on the records of the 4 rain gauges and 2 water level stations from 2012 to 2015.

Figure 3.
Flowchart of the data-driven probabilistic rainfall-inundation model for flash flood warnings.
Figure 3.
Flowchart of the data-driven probabilistic rainfall-inundation model for flash flood warnings.

Figure 4.
Flowchart for characterizing extreme rainfalls.

Figure 5.
Event numbers, cumulative rainfalls, and differences in cumulative rainfalls between Quchi and Zhongzheng Bridge, collected over 36 h at (a) the Quchi station and (b) the Zhongzheng Bridge station.
Figure 5.
Event numbers, cumulative rainfalls, and differences in cumulative rainfalls between Quchi and Zhongzheng Bridge, collected over 36 h at (a) the Quchi station and (b) the Zhongzheng Bridge station.

Figure 6.
Spectrum of differences in average rainfall intensities between groups A and B at 17 rain gauges. Red numbers state the key durations identified from the spectrum.
Figure 6.
Spectrum of differences in average rainfall intensities between groups A and B at 17 rain gauges. Red numbers state the key durations identified from the spectrum.

Figure 7.
Scatter plots of warning results projected on different key durations at the Banqiao rain gauge in the Banqiao district where (a) is projected on key duration 1 (1 h) and key duration 2 (6 h); (b) is projected on key duration 2 (6 h) and key duration 3 (14 h); (c) is projected on key duration 1 (1 h) and key duration 3 (14 h); (d) is projected on key duration 3 (14 h) and key duration 5 (24 h).

Figure 8.
Scatter plots of warning results projected on different key durations at the Tucheng rain gauge in the Tucheng district where (a) is projected on key duration 1 (1 h) and key duration 2 (6 h); (b) is projected on key duration 2 (6 h) and key duration 3 (14 h); (c) is projected on key duration 1 (1 h) and key duration 3 (14 h); (d) is projected on key duration 3 (14 h) and key duration 5 (24 h).

Figure 9.
Probabilistic outputs of the rainfall-flood warning processes obtained by the support vector machine (SVM) model (hollow circles) and the ideal Boolean outputs (solid lines) at (a) the Banqiao station for the Banqiao district and (b) the Tucheng rain gauge for the Tucheng district. Outputs were derived from 2012 to 2015 rainfall data.


Table 1.
Official rainfall thresholds of flood warnings at 15 rain gauges covering 12 districts in the Xindian River watershed.
Table 1.
Official rainfall thresholds of flood warnings at 15 rain gauges covering 12 districts in the Xindian River watershed.
| City | District | Reference Rain Gauge | Official Cumulative Rainfall Threshold of Each Duration | ||||
|---|---|---|---|---|---|---|---|
| 1 h | 3 h | 6 h | 12 h | 24 h | |||
| Taipei | Wanhua | Taipei | 70 | 140 | 180 | 340 | 400 |
| Zhongzheng | Gongguan | 70 | 130 | 180 | 250 | 350 | |
| Taipei | 70 | 130 | 180 | 250 | 350 | ||
| Zhongzheng Bridge | 70 | 130 | 180 | 250 | 350 | ||
| Wenshan | Wenshan | 60 | 120 | 170 | 240 | 350 | |
| New Taipei | Banqiao | Banqiao | 50 | 120 | 150 | 200 | 300 |
| Tucheng | 50 | 120 | 150 | 200 | 300 | ||
| Tucheng | Banqiao | 60 | 110 | 150 | 210 | 300 | |
| Tucheng | 50 | 110 | 150 | 210 | 300 | ||
| Zhonghe | Zhonghe | 50 | 110 | 150 | 230 | 300 | |
| Yonghe | Zhongzheng Bridge | 60 | 120 | 170 | 230 | 300 | |
| Xindian | Quchi | 50 | 130 | 180 | 250 | 350 | |
| Xindian | 50 | 130 | 180 | 250 | 350 | ||
| Wulai | Fushan | 70 | 140 | 270 | 310 | 450 | |
| Tunghou | - | - | - | - | - | ||
| Xiapen | - | - | - | - | - | ||
| Fushan(3) | 70 | 140 | 270 | 310 | 450 | ||
| Datungshan | 70 | 140 | 270 | 310 | 450 | ||
| Shenkeng | Shenkeng | 60 | 150 | 230 | 350 | 450 | |
| Shiding | Shiding | 80 | 150 | 230 | 350 | 450 | |
| Pinglin | Pinglin | 80 | 150 | 230 | 330 | 400 | |
Table 2.
Contingency table for evaluating binary (yes/no) warnings of pluvial flash floods.
| Observation | |||
|---|---|---|---|
| Yes | No | ||
| Warning | Yes | Hit | False alarm |
| No | Miss | Correct negative | |
Table 3.
Key durations in 5 intervals identified by rainfall pattern analysis.
| Rain Gauge Name | 1–5 h | 6–10 h | 11–15 h | 16–20 h | 21–25 h |
|---|---|---|---|---|---|
| Zhongzheng Bridge | 1 | 9 | 11 | 16 | 22 |
| Taipei | 1 | 7 | 11 | 16 | 25 |
| Banqiao | 1 | 6 | 14 | 16 | 24 |
| Gongguan | 1 | 7 | 11 | 16 | 22 |
| Xindian | 1 | 6 | 12 | 17 | 21 |
| Zhonghe | 1 | 10 | 11 | 19 | 21 |
| Tucheng | 1 | 6 | 14 | 16 | 24 |
| Wenshan | 1 | 6 | 11 | 17 | 23 |
| Shenkeng | 1 | 8 | 11 | 16 | 21 |
| Quchi | 1 | 6 | 12 | 19 | 21 |
| Shiding | 1 | 9 | 11 | 16 | 23 |
| Pinglin | 1 | 9 | 11 | 16 | 22 |
| Tunghou | 1 | 9 | 13 | 16 | 21 |
| Fushan | 1 | 10 | 11 | 16 | 22 |
| Fushan(3) | 1 | 6 | 13 | 17 | 25 |
| Xiapen | 1 | 10 | 11 | 16 | 25 |
| Datungshan | 1 | 8 | 15 | 17 | 23 |
© 2019 by the authors. Licensee MDPI, Basel, Switzerland. This article is an open access article distributed under the terms and conditions of the Creative Commons Attribution (CC BY) license (http://creativecommons.org/licenses/by/4.0/).
Share and Cite
MDPI and ACS Style
Pan, T.-Y.; Lin, H.-T.; Liao, H.-Y. A Data-Driven Probabilistic Rainfall-Inundation Model for Flash-Flood Warnings. Water 2019, 11, 2534. https://doi.org/10.3390/w11122534
AMA Style
Pan T-Y, Lin H-T, Liao H-Y. A Data-Driven Probabilistic Rainfall-Inundation Model for Flash-Flood Warnings. Water. 2019; 11(12):2534. https://doi.org/10.3390/w11122534
Chicago/Turabian StylePan, Tsung-Yi, Hsuan-Tien Lin, and Hao-Yu Liao. 2019. "A Data-Driven Probabilistic Rainfall-Inundation Model for Flash-Flood Warnings" Water 11, no. 12: 2534. https://doi.org/10.3390/w11122534
Note that from the first issue of 2016, this journal uses article numbers instead of page numbers. See further details here.