Hydraulic Properties in Different Soil Architectures of a Small Agricultural Watershed: Implications for Runoff Generation

College of Resources and Environment, Huazhong Agricultural University, Wuhan 430070, China
*
Author to whom correspondence should be addressed.
Water 2019, 11(12), 2537; https://doi.org/10.3390/w11122537
Submission received: 25 October 2019
/
Revised: 22 November 2019
/
Accepted: 26 November 2019
/
Published: 1 December 2019
(This article belongs to the Section Hydraulics and Hydrodynamics)
Abstract
:Soil architecture exerts an important control on soil hydraulic properties and hydrological responses. However, the knowledge of hydraulic properties related to soil architecture is limited. The objective of this study was to investigate the influences of soil architecture on soil physical and hydraulic properties and explore their implications for runoff generation in a small agricultural watershed in the Three Gorges Reservoir Area (TGRA) of southern China. Six types of soil architecture were selected, including shallow loam sandy soil in grassland (SLSG) and shallow loam sandy soil in cropland (SLSC) on the shoulder; shallow sandy loam in grassland (SSLG) and shallow sandy loam in cropland (SSLC) on the backslope; and deep sandy loam in grassland (DSLG) and deep sandy loam in cropland (DSLC) on the footslope. The results showed that saturated hydraulic conductivity (Ksat) was significantly higher in shallow loamy sand soil under grasslands (8.57 cm h−1) than under croplands (7.39 cm h−1) at the topsoil layer. Total porosity was highest for DSLC and lowest for SSLG, averaged across all depths. The proportion of macropores under SLSG was increased by 60% compared with under DSLC, which potentially enhanced water infiltration and decreased surface runoff. The landscape location effect showed that at the shoulder, Ksat values were 20% and 47% higher than values at the backslope and footslope, respectively. It was inferred by comparing Ksat values with 30 min maximum rainfall intensity at the watershed, that surface runoff would be generated in SSLC, DSLG, and DSLC sites by storms, but that no overland flow is generated in both sites at the shoulder and SSLG. The significantly higher Ksat under grasslands in comparison to croplands at the backslope indicated that planting grasses would increase infiltration capacity and mitigate runoff generation during storm events. The findings demonstrated that croplands in footslope positions might be hydrologically sensitive areas in this small agricultural watershed.
1. Introduction
The knowledge of soil hydraulic properties, including hydraulic conductivity and water retention, is of great importance for understanding hydrological responses such as water infiltration, surface runoff, and water storage. Soil architecture refers to the organization of soil from the microscopic to the megascopic scales and encompasses three interlinked components (solid components, pore space, and their interfaces) at each scale [1,2]. It is commonly recognized by two general categories: (1) soil architecture within a soil profile, such as mineral structure, aggregates, soil horizons, and pedons; and (2) soil architecture in the landscape including soil catena, soilscape, soil sequence, and pedosphere. Soil architecture is often a reflection of natural soil-forming processes affected by parent material, climate, vegetation, topography, anthropogenic effects, and time, leading to varied soil physical and hydraulic properties [3,4,5].
Soil architecture within a soil profile is often different due to the heterogeneity of soil horizonation, texture, rock fragments, and macropores, which results in different hydraulic properties [6,7]. Variable soil horizonation and horizon interfaces created by pedogenic processes usually have different hydraulic properties of individual horizons [8]. Schwen et al. (2014) compared the vertical variations of soil hydraulic properties between silty-loam Chernozem and forested sandy Cambisol profiles and revealed that variations of saturated hydraulic conductivity (Ksat) were largest within the plowed Ap horizon, which could be ascribed to the variation in soil macropores [9]. Studies have shown that the plowed layers of Calcosol and Calcisol have lower hydraulic conductivity values than their respective underlying Cambic horizons [10]. Soil texture strongly influences hydraulic conductivities through its varying pore sizes. Coarser textured soils have higher saturated conductivity compared with fine-textured soils [11]. Cracks and fissures develop better in homogeneous clay soil than in loam soil due to the effects of wetting–drying cycles and vegetation [12,13]. The Ksat value was reduced from 3.96 cm h−1 to 0.37 cm h−1 when the silt entrained by runoff water was transported into a coarse parent alluvium [14,15]. Rock fragments in soil can affect soil physical and hydrological characteristics by altering the internal geometry, size, and density of macropores [16,17,18]. The content, size, distribution, porosity, and type of rock fragments are highly related to the hydraulic properties, which can either improve or weaken hydraulic conductivities and retention properties [19,20]. Zhou et al. (2009) reported that infiltration rates increased when rock fragment content exceeds 40%, whereas when rock fragment content is below 40%, these rates decreased [21]. Although many independent studies have demonstrated that soil hydraulic properties are controlled by an array of factors at the pedon scales, a comprehensive understanding of the effects of various soil architectures in mountainous areas is still required.
Soil architecture in a soil landscape is also influenced by landscape position and management practices. Previous studies have shown that the effects of landscape location and land management on soil hydraulic properties are important aspects in soil and water resources conservation. Landscape position influenced water storage and spatial water redistribution [22,23,24]. Agricultural cultivation practices significantly increased bulk densities and decreased Ksat due to tillage-induced subsoil compaction [25]. Studies on hydraulic properties conducted by [26] demonstrated that soils in a natural prairie (17.91 cm h−1) had approximately one order of magnitude greater hydraulic conductivities than conventional tillage (1.73 cm h−1) and no-till soils (0.48 cm h−1). The authors of [27] compared the soil hydraulic properties under perennial grass buffers and row crops for Putnam soils in a watershed. These authors found that perennial grass buffers decreased soil bulk density, increased water retention, and increased soil porosity compared with row crops. These effects were mainly attributed to the better pore networks and soil structures formed by the extensive root system of grasses; hence, grass increased water infiltration into the soil, enhanced macropore flow, and decreased soil erosion processes [26,28,29,30]. Most studies are focused on individual factors influencing soil hydraulic properties, and there is limited information on heterogeneous soil architectures. Therefore, a more systematic analysis of the relationship between soil architecture and hydraulic properties is needed for understanding the complex hydrological responses in an agricultural watershed.
The main purpose of the study was to demonstrate the effects of soil architecture across pedon and landscape scales on soil hydraulic properties and runoff pathways in a small agricultural watershed. To this end, a detailed survey was conducted, and six typical types of soil architecture were selected in the watershed for this study. The soil properties, including bulk density, saturated hydraulic conductivity (Ksat), water retention, and pore size distribution, were analyzed. We hypothesized that different soil architectures would exert pronounced impacts on soil physical and hydraulic properties. The results of our study may provide a novel insight into the prediction of hydrological processes as a result of landscape evolution.
2. Materials and Methods
2.1. Study Sites and Soil Sampling
The study was conducted in the Zhangjiachong watershed (30°46′51″ N, 110°57′20″ E) located at Zigui County in Hubei Province, China (Figure 1). This area is 5 km southwest of the Three Gorge Reservoir and occupies approximately 162 ha. The climate of the watershed is subtropical monsoon. The average temperature is 16.8 °C, and the annual precipitation is, on average, 1164 mm. The elevation ranges from 148 to 530 m above the Yellow sea level. The average slope of the watershed is 12.4°, and the maximum slope is about 37°. The main soil group of this watershed is yellow-brown soil developed from granites, which can be classified as Entisols, Inceptisols, and Alfisols, according to USDA Soil Taxonomy. Land use mainly consists of cropland, orchard, and woodland. The major agricultural crops in this area are rapeseed, peanut, maize, and tea. Soil samples were obtained from 15 sites for six types of soil architectures at different landscape positions, which represented typical soil architectures of the watershed (Table 1). At the shoulder position, there were two soil types: shallow loam sandy soil in grassland (SLSG) and shallow loam sandy soil in cropland (SLSC). At the backslope position, there were two soil types: shallow sandy loam in grassland (SSLG) and shallow sandy loam in cropland (SSLC). At the footslope position, there were two soil types: deep sandy loam in cropland (DSLC) and deep sandy loam in grassland (DSLG).
The reference soil profiles were excavated to the C horizon. The definition of soil thickness in this study refers to the measured thickness of the soil above the parent material (C) horizon. Undisturbed soil cores (5 cm diameter and 5 cm height) were independently sampled in 10 cm increments up to a 40 cm soil depth for each site with three replicates (180 total soil sample cores). Soil core samples were labeled, carefully trimmed, sealed in self-sealing plastic bags, and refrigerated at 4 °C until they were analyzed. Soil bulk density and saturated hydraulic conductivity (Ksat) were determined for these soil cores in the laboratory. Undisturbed soil core subsamples were also collected to measure water retention properties. After the collection of soil cores, disturbed soil samples were also collected in plastic bags at the same location to determine the organic carbon content and soil texture. All samples were collected from July to August, 2017. Basic soil properties of the selected sites are shown in Table 2.
2.2. Laboratory Analysis
The constant head method, as described by [31], determined Ksat. Soil cores were covered with cheesecloth at the bottom and then saturated gradually in tubs from the lower end for approximately 48 h. Then, another same-sized empty core cylinder was tightly fixed on the top of the soil core as a reservoir, and a constant head to cylinder reservoir was maintained using a Mariotte bottle. A graduated cylinder was used to measure the volume of water eluted from the sample core at 2 min intervals until a steady flow rate was reached. The water temperature (T, °C) during the experiment was also recorded. Equation (1) was used to calculate the saturated hydraulic conductivity at the experimental temperature (KT). To make comparisons of hydraulic conductivity at different temperatures, KT was converted to saturated hydraulic conductivity at 10 °C (Ksat) using Equation (2) [31].
where KT is the saturated hydraulic conductivity measured at temperature T (cm h−1), 60 is a conversion factor that changes the unit of Ksat from centimeters per minute to centimeters per hour, Q is the volume of percolating water (cm3), L is the height of the soil sample (5 cm), S is the soil column’s cross-sectional area (19.6 cm2), h is the thickness of water layer (5 cm), and t is the time interval of data recording (min).
Finally, the undisturbed soil cores were weighed and oven-dried at 105 °C for 24 h and then weighed again to measure the final water content and dry soil bulk density. The wet sieving-pipette method was used to determine soil texture (Gee and Or 2002). The soil organic carbon content was measured by the potassium-dichromate (K2Cr2O7) digestion method [32].
The water retention properties of different soil architectures were determined using the centrifuge methods [33], performed on undisturbed soil core subsamples. For every soil architecture, samples were initially saturated for 24 h and then weighed to measure the soil saturated water content before applying centrifuge methods. The samples were slowly drained using nine water potential steps. After each step, the soil samples were weighed and returned to the apparatus to apply to a higher speed of rotation. This procedure was repeated until the last established water potential (−1500 kPa) was finished. Subsequently, the samples were dried in the oven at 105 °C for 24 h until a constant weight was reached. The soil water contents were fitted to the van Genuchten model [34] for water retention curve fitting:
where θ is the volumetric water content (cm3 cm−3); θr and θs are the fitted residual volumetric water content (cm3 cm−3) and measured saturated volumetric water content (cm3 cm−3), respectively; h is the water pressure head (cm); and α and are both shape parameters (cm−1 and dimensionless, respectively) obtained from the program RETC [35].
Effective pore size distributions were estimated from soil water retention data using the capillary rise equation [36]:
where r represents the effective pore radius (mm), σ the water surface tension (M L−2), β the contact angle between the solid phase and the water–air interface, ρ the density of water (M L−3), and g the gravitational constant (L T−2).
Soil pores were classified into four size fractions: macropores (effective diameter >1000 μm), coarse mesopores (effective diameter 60 to 1000 μm), fine mesopores (effective diameter 10 to 60 μm), and micropores (effective diameter <10 μm), as mentioned in [37]. Total porosity was equal to the saturated water content at 0 kPa water potential.
2.3. Statistical Analysis
All statistical analyses were performed with IBM SPSS program (Version 21.0, SPSS Inc., Chicago, IL, USA), and the figures were depicted by OriginPro 2016 and Microsoft Excel 2013. Kolmogorov–Smirnov (K–S) test was used to test the normality of the variables. Result of the K–S test showed that Ksat was logarithmic normally distributed. Therefore, log-transformed Ksat was used for further statistical analysis. Analysis of variance (ANOVA) was used to test for significant differences among landscape position, land management, and soil depth. We tested the hypothesis that landscape position and management had significant effects on soil hydraulic properties. The significance of treatment effects was tested using a 95% confidence level.
3. Results
3.1. Bulk Density
The bulk densities for the six types of soil architecture are shown in Table 3. The results showed that soil architecture and landscape position had significant effects on bulk density at the topsoil (0–20 cm) (p < 0.05). The descending order of mean bulk densities at the 0–20 cm soil depth was SLSC, SSLG (1.38 g cm−3) > SLSG (1.32 g cm−3) > SSLC (1.25 g cm−3) > DSLC (1.22 g cm−3) > DSLG (1.21 g cm−3). At the footslope, the bulk density was significantly lower than that at the shoulder and backslope positions at the 0–20 cm soil depth (p < 0.05). However, bulk densities showed no significant differences at the 0–20 cm soil depth between soils at the shoulder and backslope (p > 0.05). At the sites of grass cover, the bulk densities varied in the range of 1.09–1.42 g cm−3 at the first (0–10 cm) depth. The mean bulk densities increased with increasing soil depth at all sites, as shown in Table 3, which was similar to the research findings reported by [38].
3.2. Saturated Hydraulic Conductivity
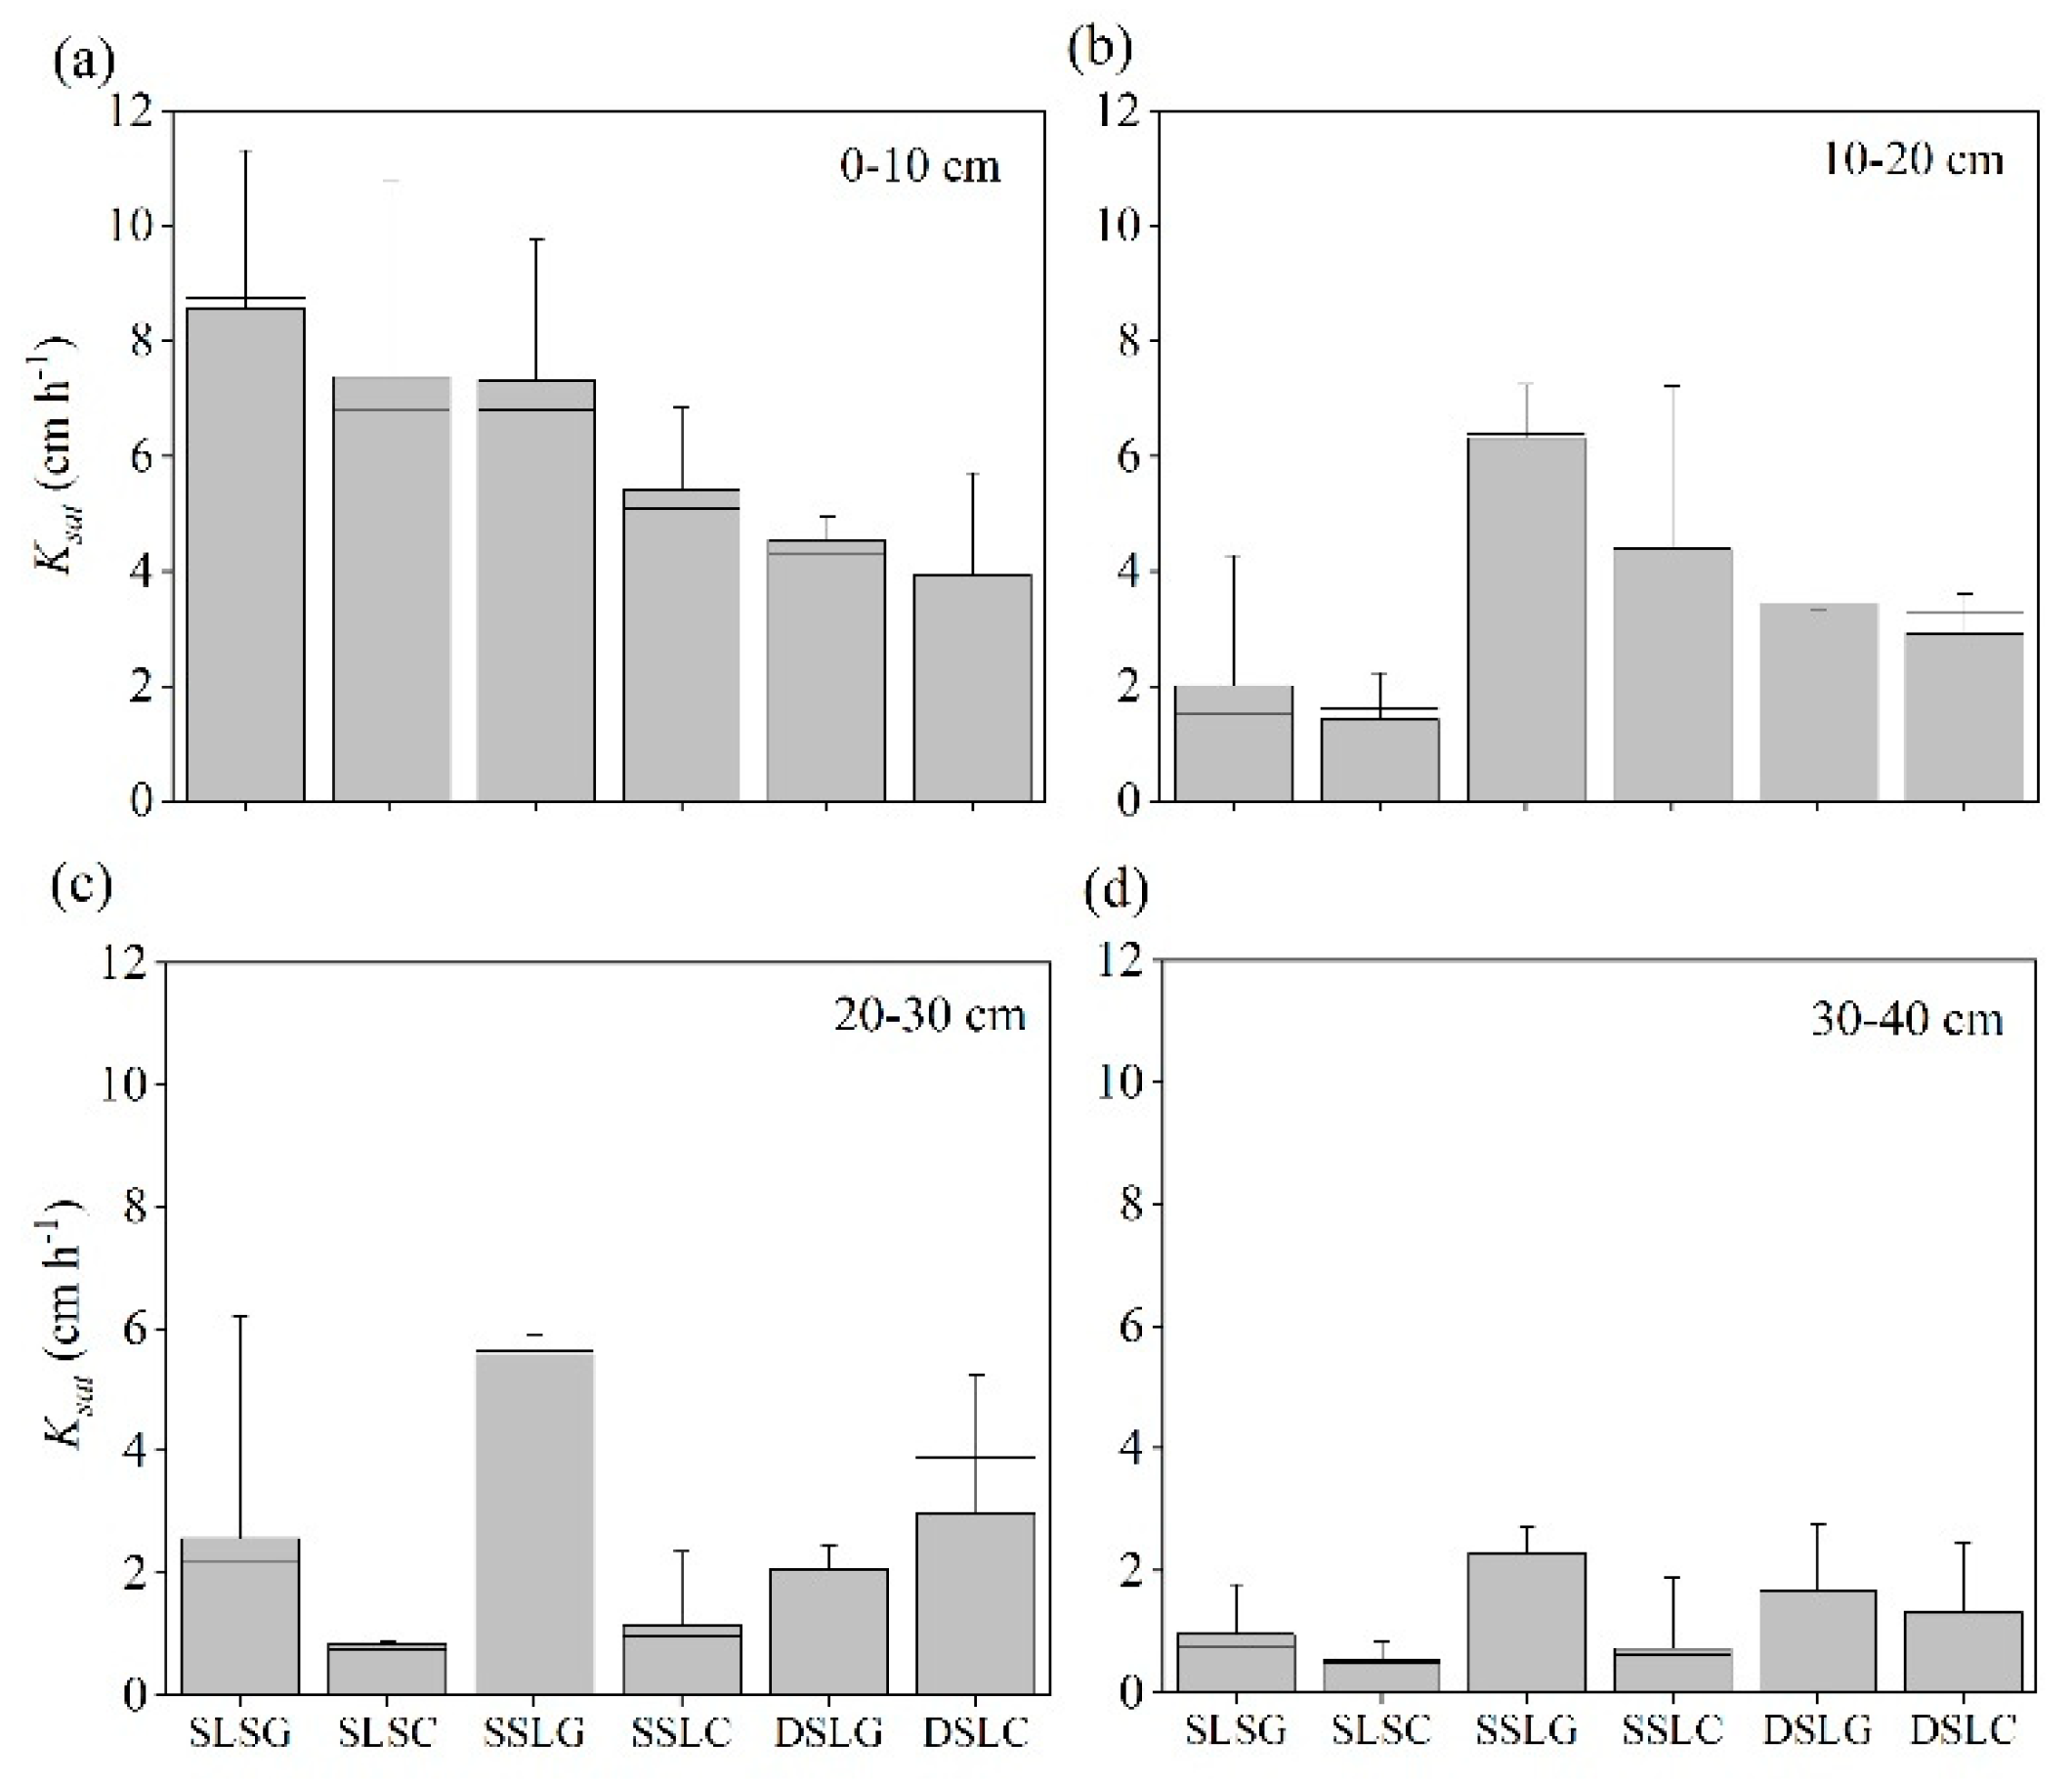
The results of the saturated hydraulic conductivity (Ksat) for all types of soil architecture at four sampling depths are illustrated in Figure 2. The results showed that Ksat values changed (0.09–11.32 cm h−1) significantly among soil types and depths for the study sites. The largest Ksat was measured at SLSG in the first soil depth, which was 1.36 and 1.90 times higher than that at the SSLG and DSLG sites, respectively. The Ksat values of 8.57 cm h−1 (SLSG) and 7.39 cm h−1 (SLSC) at the 0–10 cm depth revealed a high infiltration capacity of shallow soil thickness in the shoulder locations. At the 10–40 cm soil depth, Ksat varied in the range of 0.25–4.28 cm h−1 (SLSG), 0.07–2.24 cm h−1 (SLSC), 2.08–7.25 cm h−1 (SSLG), 0.11–7.23 cm h−1 (SSLC), 0.25–4.35 cm h−1 (DSLG), and 0.09–8.53 cm h−1 (DSLC). The land management effects on Ksat were significant (p < 0.05), with the grassland sites having the largest values. At the 0–10 cm soil depth, the Ksat value of grassland averaged over landscape position was 21% higher (p < 0.05) than that under the cropland. This was probably attributed to more pronounced grass roots that generated abundant connected macropores in the soil profile.
3.3. Soil Water Retention
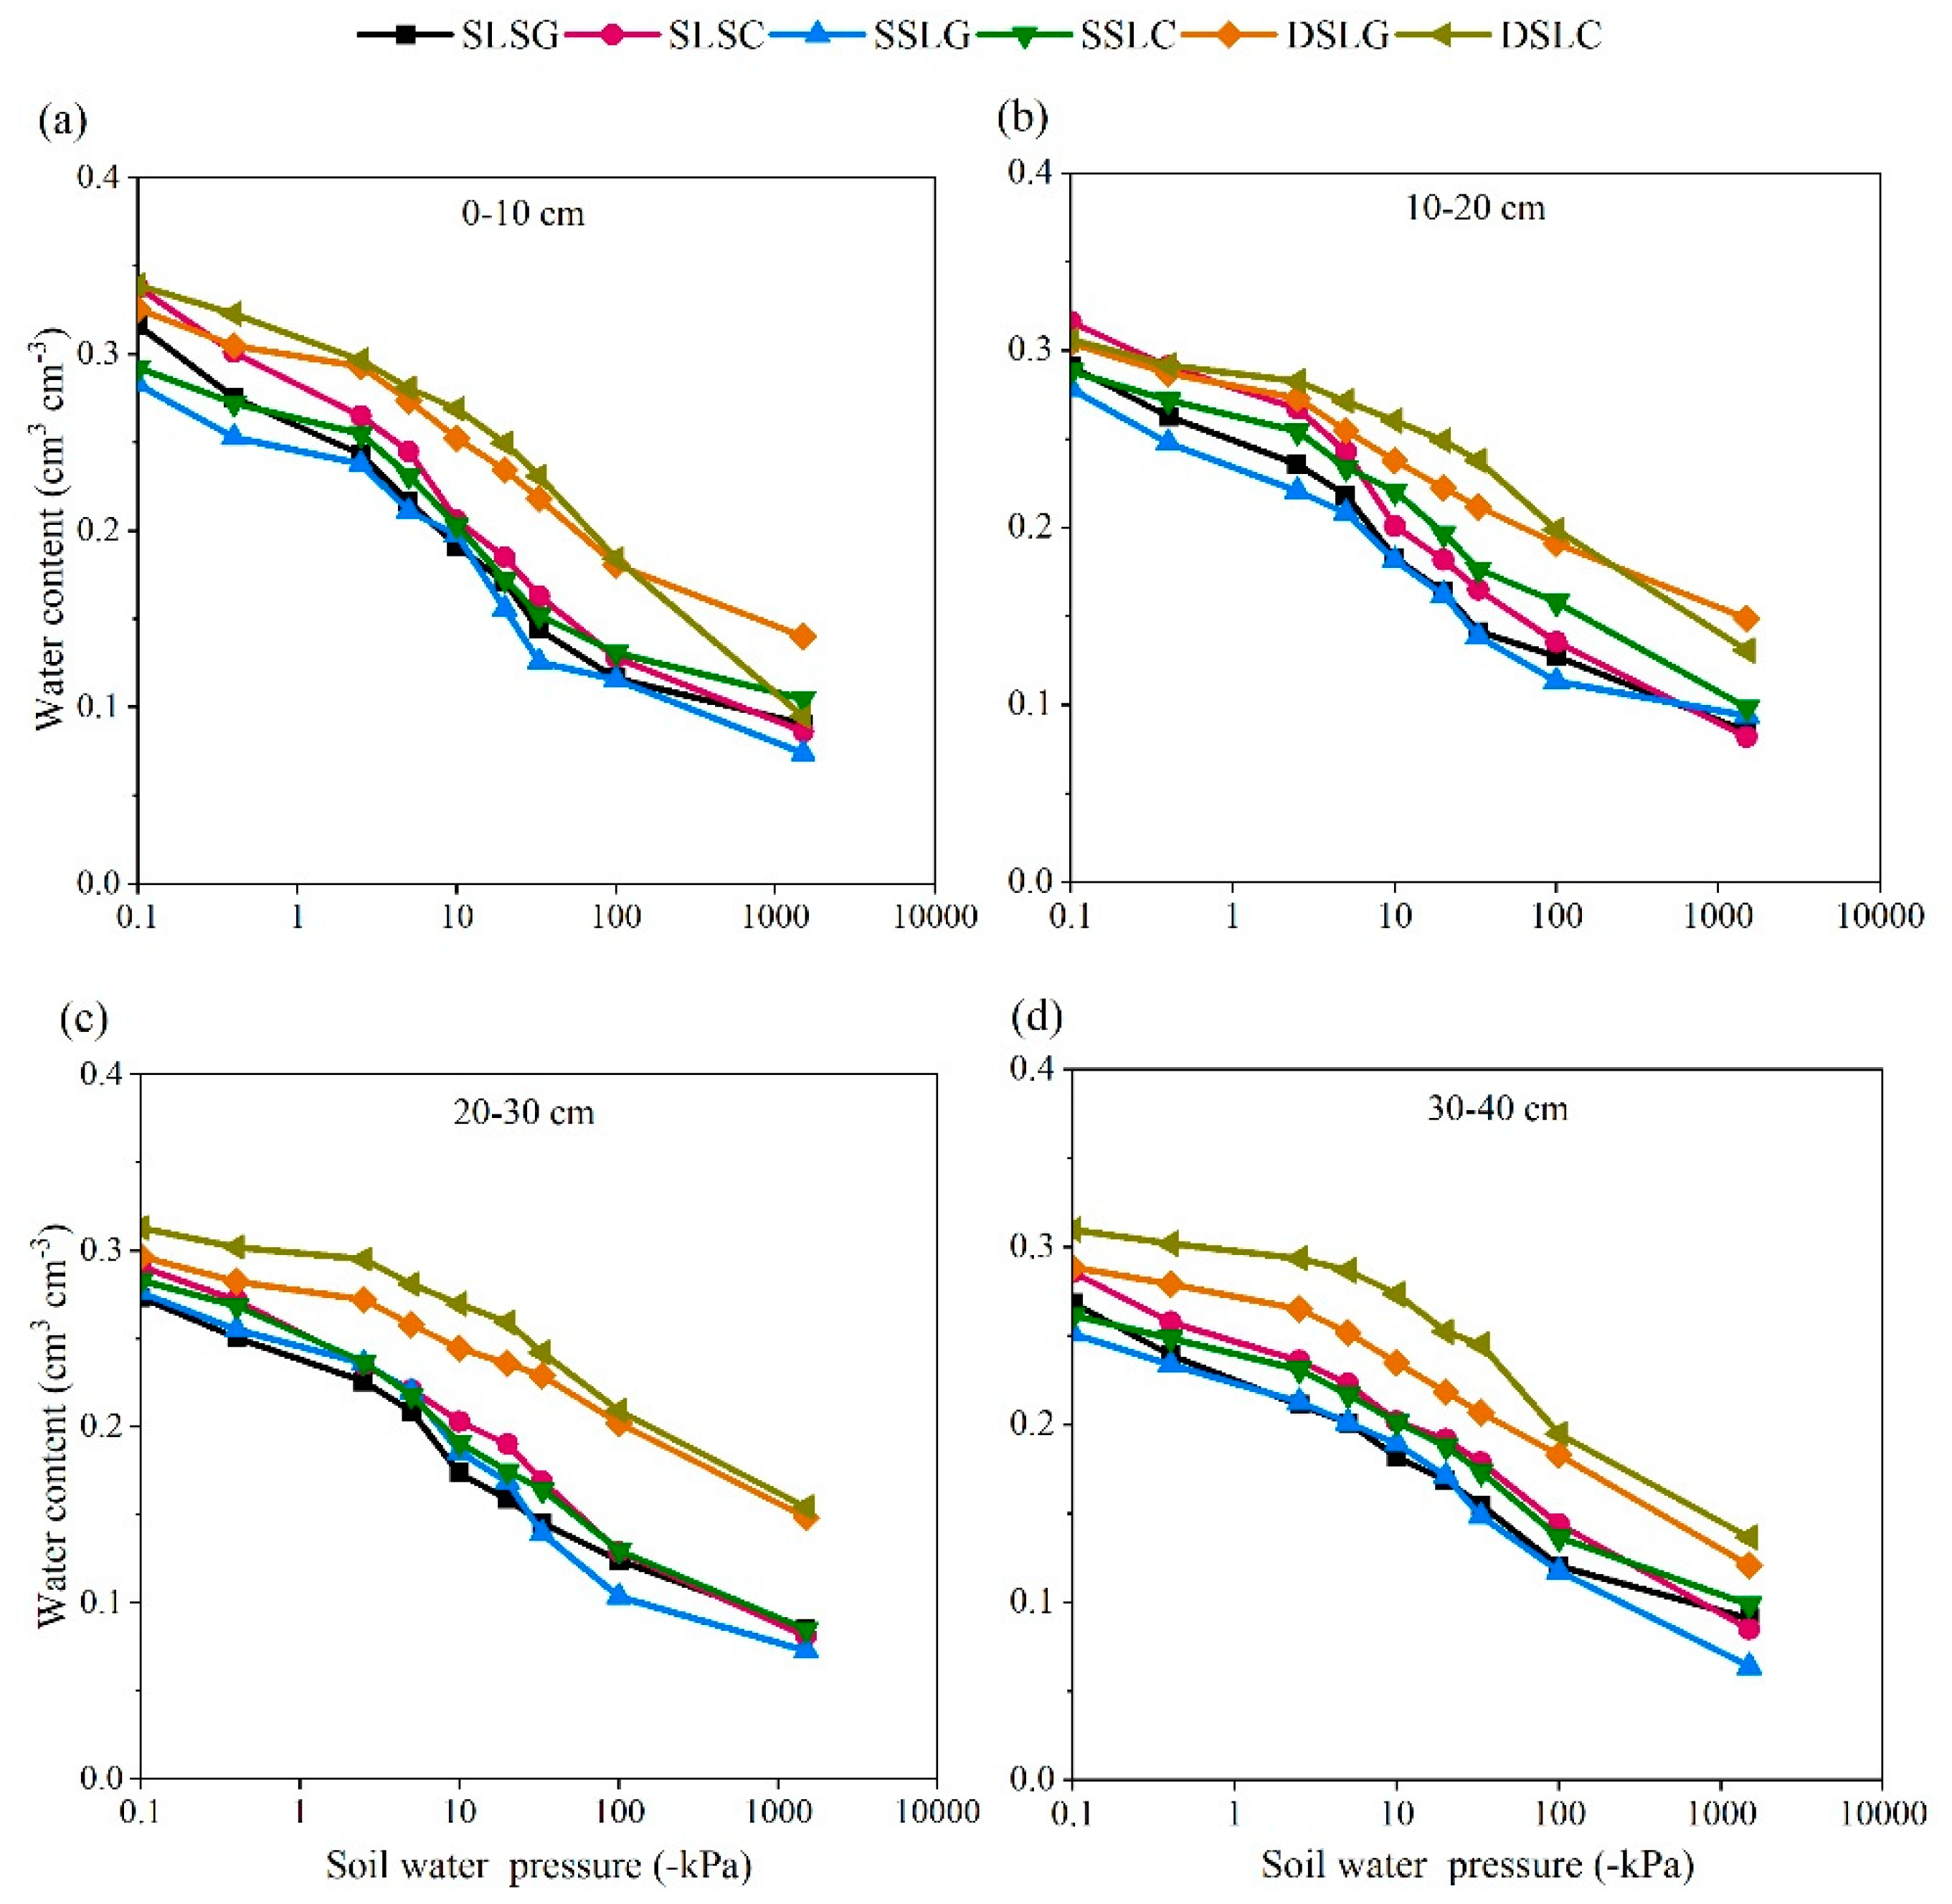
The results of soil water retention at all measured soil water pressures are shown in Table 4 and Figure 3. Water content was significantly higher (p < 0.05) for the DSLG and DSLC sites than values for other sites (SLSG, SLSC, SSLG, and SSLC) at all soil depths and suction pressures used. However, the average soil water contents showed no significant differences (p > 0.05) among SLSG, SLSC, SSLG, and SSLC sites at all measured soil water pressures (Figure 3). Water contents varied significantly with soil depth (p < 0.05). A descending trend was found in saturated water content for all soil architectures. Averaged over land use and soil depths, the footslope location had significantly (p < 0.05) higher saturated water content (0.31 cm3 cm−3) than that in the backslope positions (0.27 cm3 cm−3). However, no significant differences in saturated water content showed between the footslope and shoulder position (p > 0.05). Soil water retention in the cropland at the four sampling depths for all suction pressures were significantly (p < 0.05) higher than for the grassland except at the −1500 kPa pressures (Table 4).
3.4. Pore Size Distribution
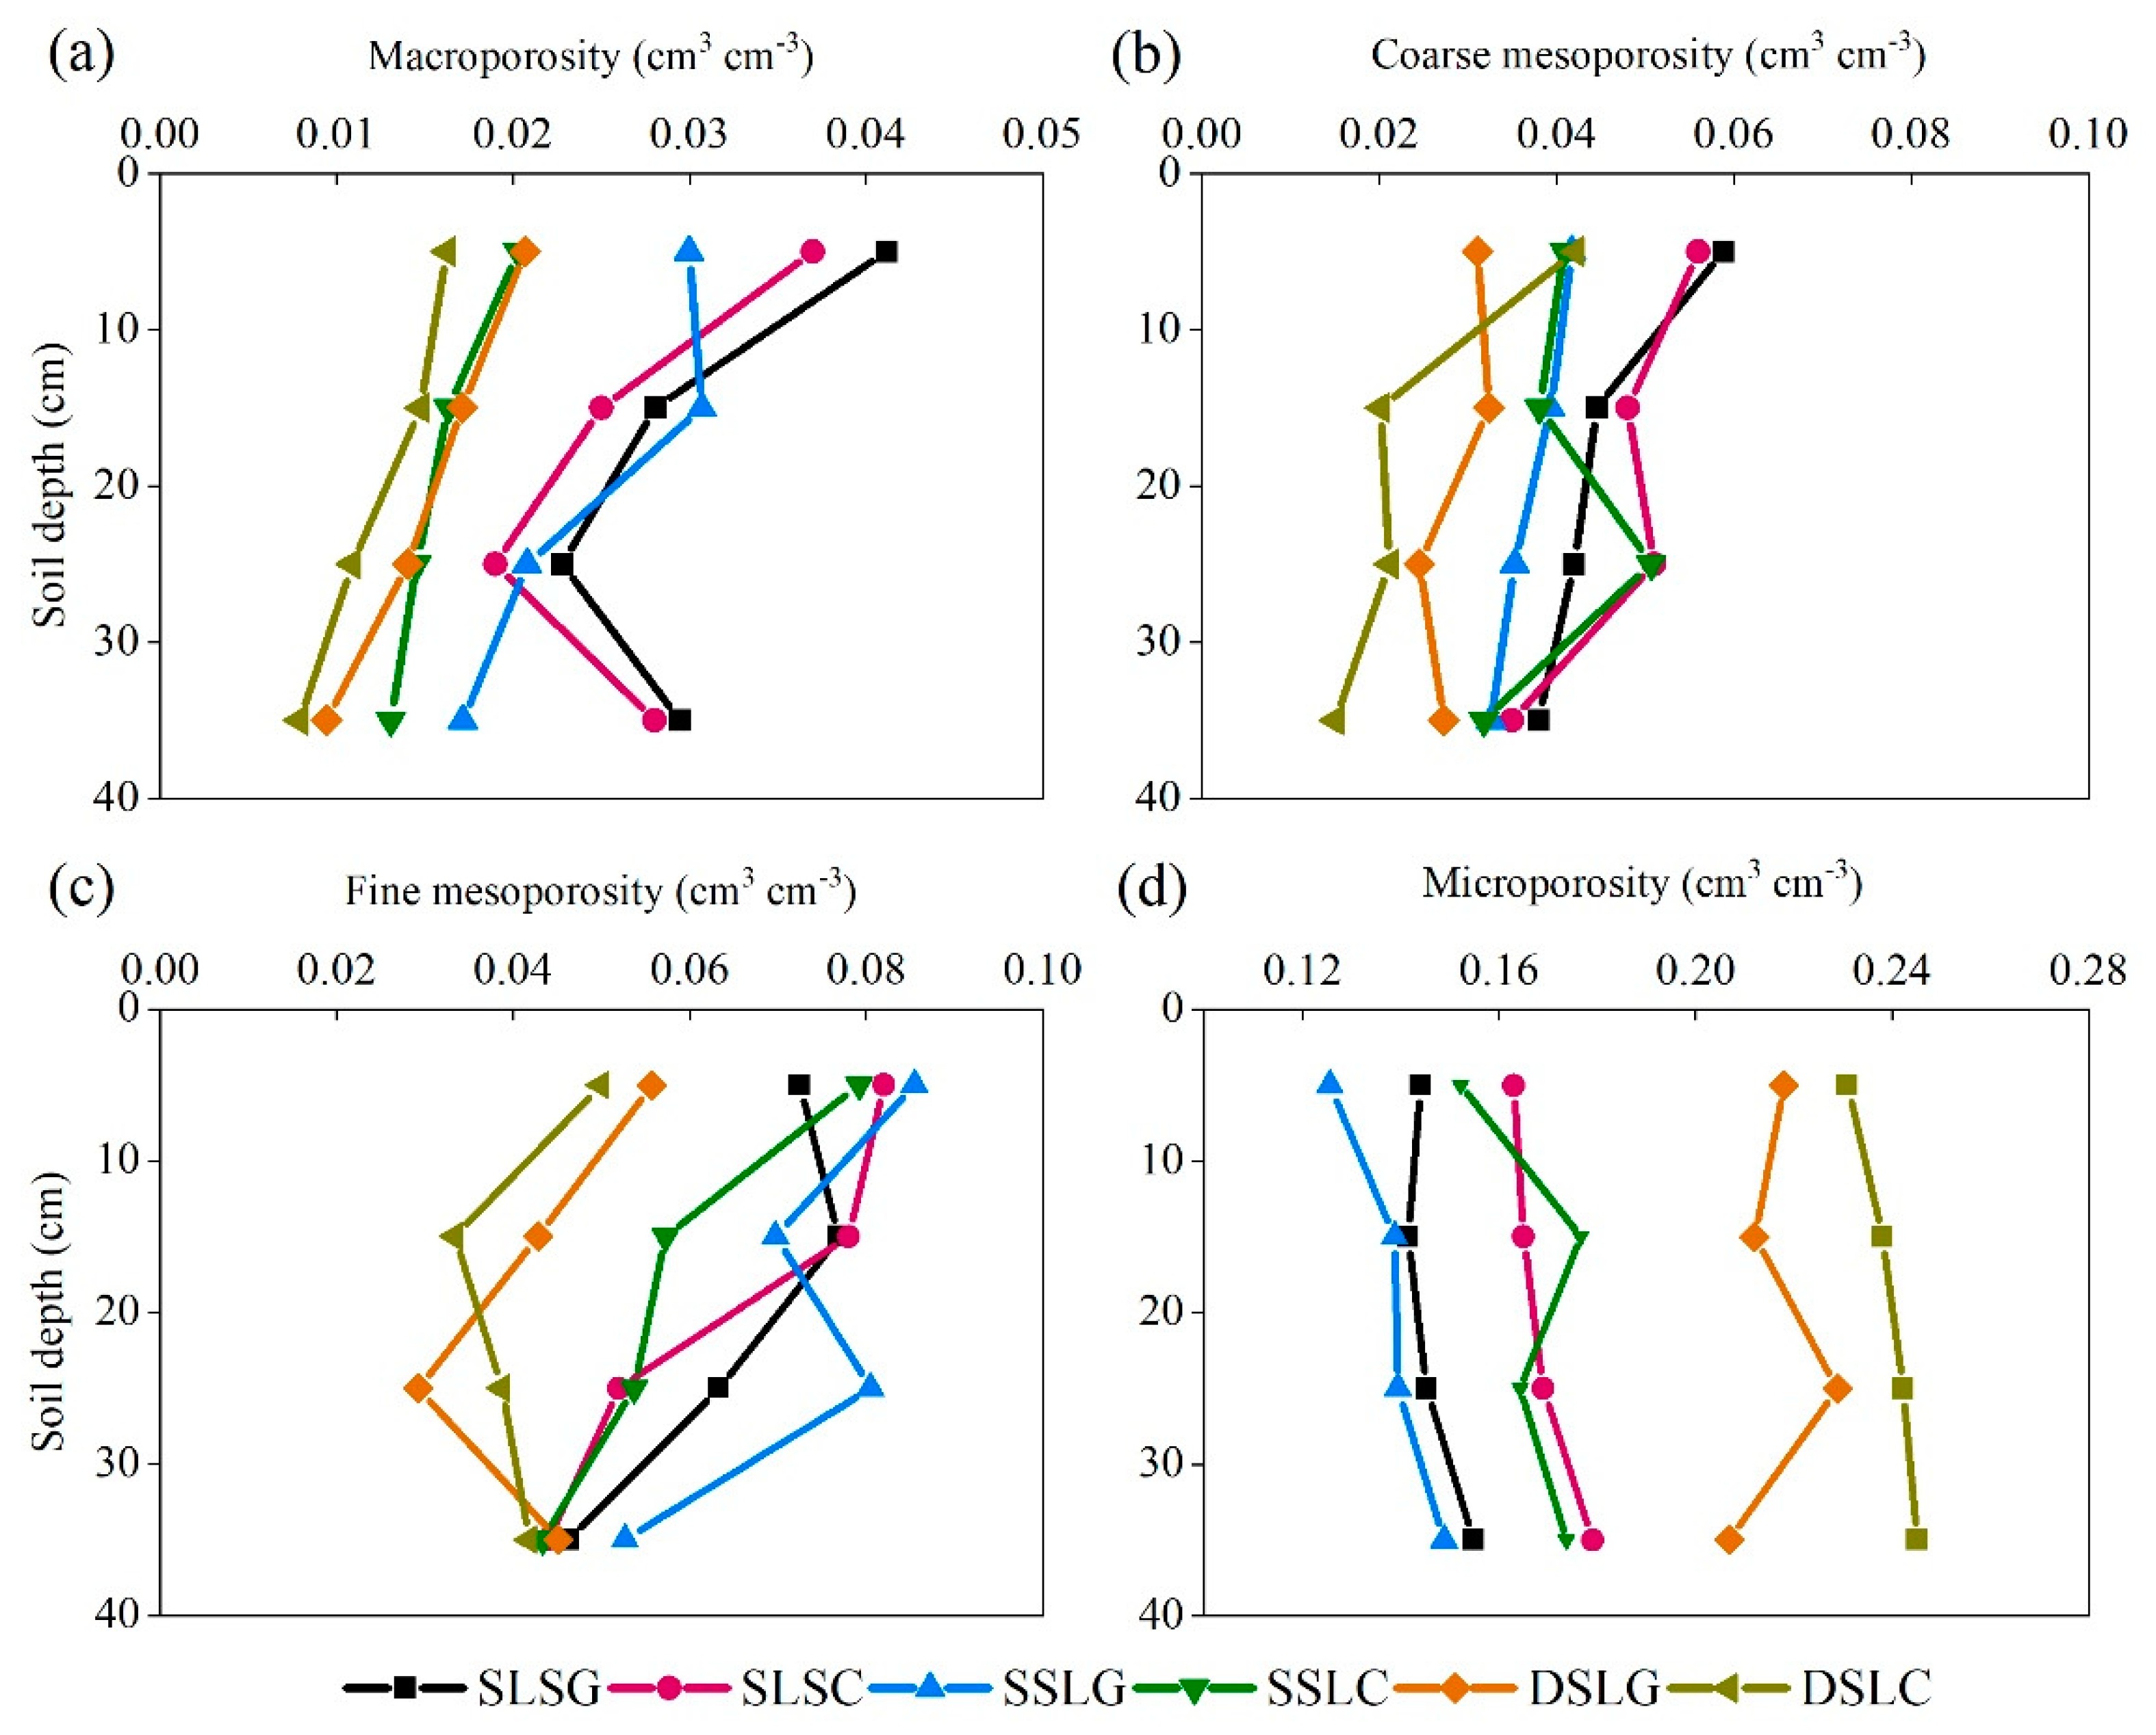
Figure 4 and Table 5 shows the pore size distribution results for all types of soil architectures, landscape positions, and land uses at four depths. Results showed that the macroporosity in SLSG and SLSC was significantly (p < 0.05) higher than that in SSLG, SSLC, DSLG, and DSLC at the first soil depth (Figure 5a). However, no significant differences in macroporosity were found between SLSG and SLSC at four soil depths (p > 0.05). Macroporosity at the SLSG sites at the first soil depth was 22% higher than that at the SSLG sites. No significant differences in macroporosity were showed among SSLC, DSLG, and DSLC at all depths (p > 0.05). The larger macroporosity leads to the higher Ksat values observed for the SLSG site, as reported above. Coarse mesoporosity was significantly higher in SLSG and SLSC in comparison to other types of soil architecture at the first depth (p < 0.05). However, coarse mesoporosity showed no significant differences among soil architectures for the deeper (20–40 cm) soil depths (p > 0.05). Fine mesoporosity for DSLG and DSLC was significantly (p < 0.05) lower at 0–30 cm depths than other study sites. Significantly higher values of microporosity were found in the DSLC sites at all depths compared with other sites (p < 0.05). Microporosities in SSLG were significantly (p < 0.05) lower at all soil depths than that in SLSC, SSLC, DSLG, and DSLC. However, no significant differences in microporosity were found between SSLG and SLSG (p > 0.05). At the sites under the grass cover, the mean microporosity (0.216 cm3 cm−3) at the DSLG sites was significantly (p < 0.05) higher than that at the SLSG (0.146 cm3 cm−3) and SSLG (0.143 cm3 cm−3) sites. Averaged over land management and soil depth, the shoulder position had the highest macroporosity, which was 31% and 52% larger than the backslope and footslope position, respectively. A similar trend was found for coarse and fine mesoporosity. However, the footslope position had higher microporosity compared to the shoulder and backslope position.
4. Discussion
The variations in soil hydraulic properties among landscape positions were due to the differences in soil thickness and architectures. Many researchers have investigated the effects of soil thickness on soil hydraulic properties and water infiltration [30,31,32,33,34,35,36,37,38,39,40,41]. The authors of [42] evaluated the physiochemical and hydraulic properties of surface soils at varying microtopographic positions in the Ozark Highlands. They found that the infiltration rates were approximately twofold higher at the microtopographic low position (thicker soil) than that at the high position (shallower soil). In this study, we observed that the saturated hydraulic properties at the shoulder position with a shallower soil thickness was higher than that at the backslope and footslope positions (thicker soil thickness). However, in a study conducted by [43], they characterized the hydraulic properties in different landscape and conservation practices along a claypan soil catena and found that the backslope (shallow soil) position had lower saturated hydraulic conductivity than the summit and footslope (thick soil) positions. They also concluded that water retention was higher at the backslope position among the landscape positions. These differences from our study could partly be explained by the claypan horizon existing in their study soil profiles. Besides, it was observed that macro-and meso-porosity at SLSG and SLSC sites was significantly higher than that at DSLG and DSLC sites (Table 5). We think that shallow soil thickness resulted in more distinct soil horizonation, which contributed to more subsurface flow movement of the infiltrated water at the SLSG and SLSC sites (Figure 5a,b).
The effect of landscape position on soil architecture was also reflected in soil texture. Soil profiles at DSLG and DSLC sites showed homogeneity, and the clay content was relatively higher than other sites. However, at SLSG and SLSC sites, high rock fragments content and low clay content resulted in more heterogeneous soil profiles (Table 2). The authors of [29] reported that the clay content was the major controlling factor in topsoil thickness effects on water retention. The authors of [44] found that soil with high clay content increases preferential flow and decreases the exchange of lateral flow. In this study, the largest water content was found at the DSLC sites at all measured soil water pressures (Table 4). Moreover, higher spatial heterogeneity was caused by high rock fragments at the SLSG, SLSC, and SSLG sites. Rock fragments increase the interaggregate voids and accelerate the water flow. Higher saturated hydraulic conductivities were observed in SLSG, SLSC, and SSLG with the higher rock fragments content. The same results were obtained by [45]. They observed high extra-interphase or macroporosity between soil matrix and rock fragments, thus increasing water infiltration through the soil.
Many researchers have demonstrated that land management significantly affects soil hydraulic properties [46,47,48,49]. Considering that the selected sites are located on the same hillslope developed upon granites, the significantly higher Ksat under grassland in comparison with cropland (Figure 2), provides a pronounced difference in Ksat between these grasslands and croplands. It often results from the tillage or compaction of the soil in the topsoil layer [50]. In the tillage layer at the SSLC and DSLC sites, the structural macropores were destroyed by cultivation [51], giving rise to the significant difference in Ksat between the topsoil layer and the deeper soil layer (Figure 2). Land management practices are of great importance to soil physical and hydraulic properties, which can be attributed to the influences of compaction, tillage, structural evolution, and consolidation [46,48,52]. On average, grassland soils demonstrated Ksat values 28% higher than cropland soils (Figure 2). Several other types of research [26,30] have reported similar results of differences between grassland and cropland. A higher percentage of difference was reported in Mexico, where the average Ksat of soil under switchgrass was 73% greater than row crop management [30]. The authors of [26] found that Ksat values for natural prairie were almost one order of magnitude higher than those for rotation farmland. The authors of [53] reported that the alfalfa grasslands significantly improved the soil infiltration capacity. Such variations in hydraulic properties of topsoil are of great importance for hydrological responses such as infiltration, overland runoff, and water quality.
This study also showed a higher total porosity in cropland (0.30 cm3 cm−3) than grassland soils (0.28 cm3 cm−3), by a percentage of 7%. The value of water content in this study was much lower than the results by other authors [38,43,54]. The authors of [54] reported that the average saturated water contents of prairie and row crop soils were 0.57 and 0.51 cm3 cm−3. The pronounced differences in water contents between the two studies may be a result of contrasting soil textures in the study soils. The soils in this study consisted of sand and loamy sand, which have poor water retention capacities compared to claypan soils in the study of [54]. This also indicates that the effects of land management are similar regardless of soil textures. Our study was carried out in summer, but the results should be complemented, especially for croplands, by monitoring the temporal variations in soil hydraulic properties. The soil properties for croplands are modified regularly by agricultural activities such as tilling, plowing, leveling, sowing, and irrigating [55,56,57,58].
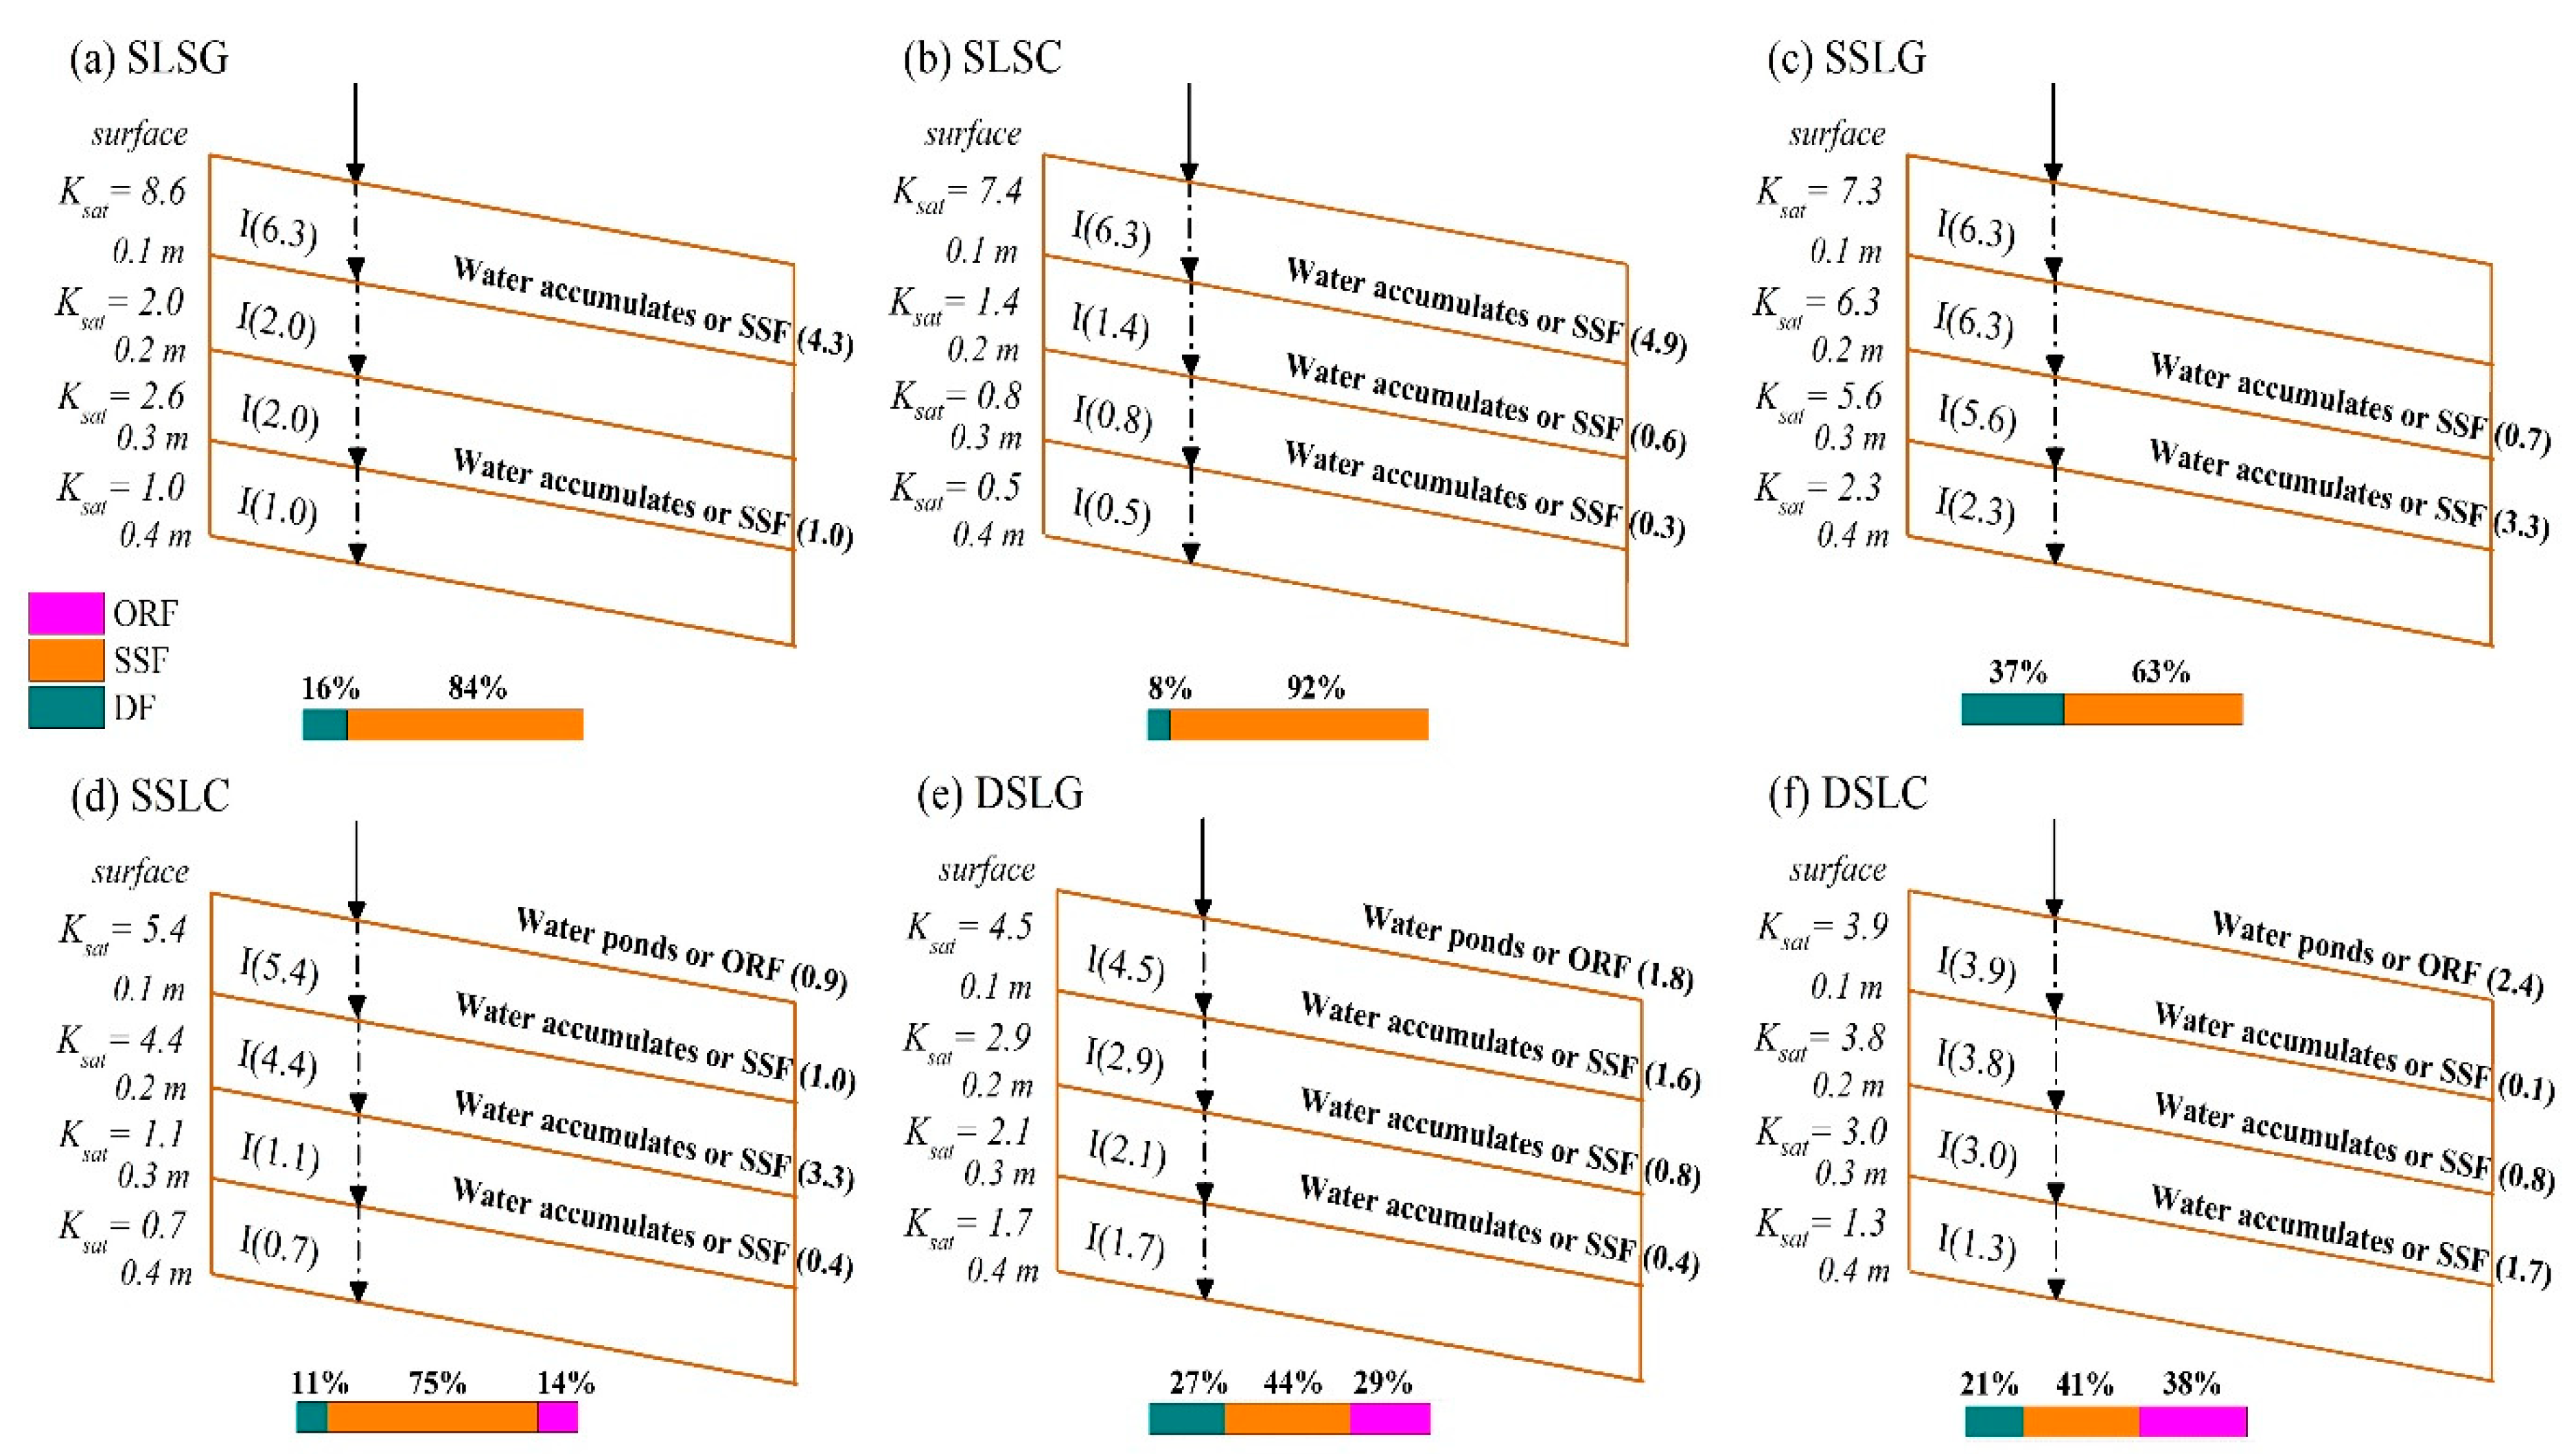
Vertical variation of Ksat combined with rainfall intensity has been shown to affect the dominant runoff pathways [59,60,61,62], including overland flow (ORF, appears when rainfall intensity exceeds the soil infiltration capacity), subsurface flow (SSF, occurs at lateral flow structures), and deep-water infiltration (DF, water penetrates into the soil profile). In this study, the mean I30 (maximum rainfall intensity in 30 min, 6.3 mm h−1) of all erosive rainfalls during 2016 (data were from the collection of the Zigui Soil and Water Conservation Experiment Station, not shown here) was chosen to predict the dominant runoff pathways under different soil architectures. Results indicated that in the shoulder position, SLSG, SLSC, and SSLG sites could not generate overland flow for the condition of mean I30. The percentages of deep infiltration at the SLSG sites (16%) and the SSLG sites (37%) were comparable (Figure 5). In the backslope, the movement of water in SSLG and SSLC profiles was dominated by accumulation or in the form of subsurface flow, with the proportion of 63% and 75%, respectively. A relatively higher incidence of overland flow in the footslope position was found in this study, which indicated that the increased soil thickness resulted in enhanced surface soil water repellency. This is inconsistent with the findings by other researchers [6,63]. With grass cover, the overland runoff was decreased by 23.7% compared with the cropland in the footslope. It has been suggested that appropriate land management is highly recommended for thicker soils to reducing runoff generation as well as soil erosion. The study highlights the differences in soil hydrological processes under six typical soil architectures in a granitic landscape of a mountainous watershed, providing insights into the modeling of hillslope hydrology.
Soil hydraulic properties data are widely applied in environmental and agricultural activities, such as irrigation and drainage planning, water balance calculation, and nutrients leaching prediction [64]. The knowledge of soil and water interaction is very important for evaluating the soil’s role in water quantity and quality and the water’s role in soil quantity and quality [65]. Soil architecture across microscopic to megascopic scales largely controls soil hydraulic properties and water infiltration processes [1,2]. In our study, an in-depth understanding of soil hydraulic properties in real soil-landscape systems explicitly reflects the universal heterogeneity of soil architecture in nature from an aspect of the soil–water feedback response. Runoff generation pathways inferred by precipitation and the vertical variability of saturated hydraulic conductivities provide possible ways to predict surface and subsurface flow [61,66]. Moreover, the results provide important information for improving the accuracy of hydrological modeling in an agricultural watershed and, in turn, promote sustainable agricultural management and water resources management.
5. Conclusions
The study assessed the effects of six different soil architectures (SLSG, SLSC, SSLG, SSLC, DSLG, and DSLC) on bulk density, saturated hydraulic conductivity (Ksat), soil water retention characteristics, and pore size distributions at different landscape positions (shoulder, backslope, and footslope) in a small agricultural watershed. The results showed that the shallow loam sandy soil in grassland (SLSG) on the shoulder had significantly higher Ksat, greater macroporosity than the other selected sites. This may largely increase infiltration and reduce overland runoff in SLSG. The difference was controlled by the high rock fragments content and structural variations in different soil depths. The results of water retention indicated that deep sandy loam in cropland (DSLC) had markedly increased water content at all measured soil water pressures compared with shallow sandy loam in cropland (SSLC) and deep sandy loam in grassland (DSLG). The DSLC sites also had lower Ksat and higher microporosity, which increased the potential to generate surface runoff. The study also demonstrated that land management systems had significant effects on hydraulic properties. The grassland system showed a remarkable improvement in soil hydraulic properties compared to the cropland system. The grassland had 54% higher Ksat and 60% greater macroporosity than DSCL. Land management was the dominant factor influencing hydraulic properties in the surface horizon. Reduced Ksat in deeper horizons was controlled by the compaction and illuvial clay content. Our study also revealed that on a granitic soil hillslope, decreased water infiltration and enhanced runoff was predicted at the footslope position, while on the shoulder, the flow pathway was dominated by subsurface flow and deep percolation into the soil profile. Different hydrological responses to landscape position and management are important for further hydrological modeling in the mountainous watershed.
Author Contributions
Conceptualization, C.D. and Z.L.; methodology, C.D.; software, C.D.; formal analysis, C.D.; investigation, Y.Z. and J.D.; resources, T.W.; data curation, C.D.; writing—original draft preparation, C.D.; writing—review and editing, T.W. and Z.L.; supervision, Z.L.; project administration, Z.L.; funding acquisition, Z.L.
Funding
This research was funded by the National Natural Science Foundation of China (41571266 and 41877084), National Key Research and Development Program of China (2017YFC0505302), Special Fund for Agro-scientific Research in the Public Interest of China (201503106) and China Scholarship Council (201906760038).
Conflicts of Interest
The authors declare no conflict of interest.
References
- Lin, H. Understanding soil architecture and its functional manifestation across scales. In Hydropedology: Synergistic Integration of Soil Science and Hydrology; Lin, H., Ed.; Academic Press: San Diego, CA, USA, 2012; pp. 41–74. [Google Scholar]
- Ma, Y.J.; Li, X.Y.; Guo, L.; Lin, H. Hydropedology: Interactions between pedologic and hydrologic processes across spatiotemporal scales. Earth Sci. Rev. 2017, 171, 181–195. [Google Scholar] [CrossRef]
- Kutílek, M. Soil hydraulic properties as related to soil structure. Soil Tillage Res. 2004, 79, 175–184. [Google Scholar] [CrossRef]
- Kutílek, M.; Nielsen, D.R. Interdisciplinarity of hydropedology. Geoderma 2007, 138, 252–260. [Google Scholar] [CrossRef]
- Chen, Y.; Day, S.D.; Wick, A.F.; McGuire, K.J. Influence of urban land development and subsequent soil rehabilitation on soil aggregates, carbon, and hydraulic conductivity. Sci. Total Environ 2014, 494–495, 329–336. [Google Scholar] [CrossRef] [PubMed]
- Nimmo, J.R.; Perkins, K.S.; Schmidt, K.M.; Miller, D.M.; Stock, J.D.; Singha, K. Hydrologic characterization of desert soils with varying degrees of pedogenesis: 1. Field experiments evaluating plant-relevant soil water behavior. Vadose Zone J. 2009, 8, 480–495. [Google Scholar] [CrossRef]
- Dyck, M.; Kachanoski, R. Scale-dependent covariance of soil physical properties above and below a soil horizon interface: Pedogenic versus anthropogenic influences on total porosity. Can. J. Soil Sci. 2011, 91, 149–159. [Google Scholar] [CrossRef]
- Dyck, M.F.; Kachanoski, R.G. Measurement of transient soil water flux across a soil horizon interface. Soil Sci. Soc. Am. J. 2009, 73, 1604–1613. [Google Scholar] [CrossRef]
- Schwen, A.; Zimmermann, M.; Bodner, G. Vertical variations of soil hydraulic properties within two soil profiles and its relevance for soil water simulations. J. Hydrol. 2014, 516, 169–181. [Google Scholar] [CrossRef]
- Coquet, Y.; Vachier, P.; Labat, C. Vertical variation of near-saturated hydraulic conductivity in three soil profiles. Geoderma 2005, 126, 181–191. [Google Scholar] [CrossRef]
- Lal, R.; Shukla, M.K. Principles of Soil Physics; CRC Press: Boca Raton, FL, USA, 2004. [Google Scholar]
- Novak, S.M.; Portal, J.M.; Schiavon, M. Effects of soil type upon metolachlor losses in subsurface drainage. Chemosphere 2001, 42, 235–244. [Google Scholar] [CrossRef]
- Guo, L.; Lin, H. Critical zone research and observatories: Current status and future perspectives. Vadose Zone J. 2016, 15, vzj2016.06.0050. [Google Scholar] [CrossRef]
- Al-Ismaily, S.S.; Al-Maktoumi, A.K.; Kacimov, A.R.; Al-Saqri, S.M.; Al-Busaidi, H.A. Impact of a recharge dam on the hydropedology of arid zone soils in Oman: Anthropogenic formation factor. J. Hydrol. Eng. 2015, 20, 04014053. [Google Scholar] [CrossRef]
- Al-Saqri, S.M.; Al-Maktoumi, A.K.; Al-Ismaily, S.S.; Kacimov, A.R.; Al-Saqri, S.M.; Al-Busaidi, H.A. Hydropedology and soil evolution in explaining the hydrological properties of recharge dams in arid zone environments. Arab. J. Geosci. 2016, 9, 47. [Google Scholar] [CrossRef]
- Luo, L.; Lin, H.; Li, S. Quantification of 3-D soil macropore networks in different soil types and land uses using computed tomography. J. Hydrol. 2010, 393, 53–64. [Google Scholar] [CrossRef]
- Shi, Z.J.; Xu, L.H.; Wang, Y.H.; Yang, X.H.; Jia, Z.Q.; Guo, H.; Xiong, W.; Yu, P.T. Effect of rock fragments on macropores and water effluent in a forest soil in the stony mountains of the Loess Plateau, China. Afr. J. Biotechnol. 2012, 11, 9350–9361. [Google Scholar]
- Zhang, Y.H.; Zhang, M.X.; Niu, J.Z.; Li, H.; Xiao, R.; Zheng, H.J.; Bech, J. Rock fragments and soil hydrological processes: Significance and progress. Catena 2016, 147, 153–166. [Google Scholar] [CrossRef]
- Parajuli, K.; Sadeghi, M.; Jones, S.B. A binary mixing model for characterizing stony-soil water retention. Agric. For. Meteorol. 2017, 244–245, 1–8. [Google Scholar] [CrossRef]
- Ilek, A.; Kucza, J.; Witek, W. Using undisturbed soil samples to study how rock fragments and soil macropores affect the hydraulic conductivity of forest stony soils: Some methodological aspects. J. Hydrol. 2019, 570, 132–140. [Google Scholar] [CrossRef]
- Zhou, B.B.; Shao, M.A.; Shao, H.B. Effects of rock fragments on water movement and solute transport in a Loess Plateau soil. C. R. Geosci. 2009, 341, 462–472. [Google Scholar]
- Da Silva, P.; Nadler, A.; Kay, B.D. Factors contributing to temporal stability in spatial patterns of water content in the tillage zone. Soil Tillage Res. 2001, 58, 207–218. [Google Scholar] [CrossRef]
- Tomer, M.D.; Cambardella, C.A.; James, D.E.; Moorman, T.B. Surface-soil properties and water contents across two watersheds with contrasting tillage histories. Soil Sci. Soc. Am. J. 2006, 70, 620–630. [Google Scholar] [CrossRef]
- Guber, A.K.; Gish, T.J.; Pachepsky, Y.A.; van Genuchten, M.T.; Daughtry, C.S.T.; Nicholson, T.J.; Cady, R.E. Temporal stability in soil water content patterns across agricultural fields. Catena 2008, 73, 125–133. [Google Scholar] [CrossRef]
- Arnhold, S.; Otieno, D.; Onyango, J.; Koellner, T.; Huwe, B.; Tenhunen, J. Soil properties along a gradient from hillslopes to the savanna plains in the Lambwe Valley, Kenya. Soil Tillage Res. 2015, 154, 75–83. [Google Scholar] [CrossRef]
- Fuentes, J.P.; Flury, M.; Bezdicek, D.F. Hydraulic properties in a silt loam soil under natural prairie, conventional till, and no-till. Soil Sci. Soc. Am. J. 2004, 68, 1679–1688. [Google Scholar] [CrossRef]
- Seobi, T.; Anderson, S.H.; Udawatta, R.P.; Gantzer, C.J. Influence of grass and agroforestry buffer strips on soil hydraulic properties for an Albaqualf. Soil Sci. Soc. Am. J. 2005, 69, 893–901. [Google Scholar] [CrossRef]
- Rachman, A.; Anderson, S.; Gantzer, C.; Alberts, E.E. Soil hydraulic properties influenced by stiff-stemmed grass hedge systems. Soil Sci. Soc. Am. J. 2004, 68, 1386–1393. [Google Scholar] [CrossRef]
- Sahin, H.; Anderson, S.; Udawatta, R. Water infiltration and soil water content in claypan soils influenced by agroforestry and grass buffers compared to row crop management. Agrofor. Syst. 2016, 90, 839–860. [Google Scholar] [CrossRef]
- Zaibon, S.; Anderson, S.H.; Kitchen, N.R.; Haruna, S.I. Hydraulic properties affected by topsoil thickness in switchgrass and corn–soybean cropping systems. Soil Sci. Soc. Am. J. 2016, 80, 1365–1376. [Google Scholar] [CrossRef]
- Ilek, A.; Kucza, J. A laboratory method to determine the hydraulic conductivity of mountain forest soils using undisturbed soil samples. J. Hydrol. 2014, 519, 1649–1659. [Google Scholar] [CrossRef]
- Walkley, A.; Black, I.A. An examination of the Degtjareff method for determining soil organic matter, and a proposed modification of the chromic acid titration method. Soil Sci. 1934, 37, 29–38. [Google Scholar] [CrossRef]
- Russell, M.; Richards, L. The Determination of Soil Moisture Energy Relations by Centrifugation 1. Soil Sci. Soc. Am. J. 1939, 3, 65–69. [Google Scholar] [CrossRef]
- Van Genuchten, M.T. A closed-form equation for predicting the hydraulic conductivity of unsaturated soils 1. Soil Sci. Soc. Am. J. 1980, 44, 892–898. [Google Scholar] [CrossRef]
- Van Genuchten, M.V.; Leij, F.; Yates, S. The RETC Code for Quantifying the Hydraulic Functions of Unsaturated Soils; US Sal. Lab.: Riverside, CA, USA, 1991. [Google Scholar]
- Hill, R.L.; Horton, R.; Cruse, R.M. Tillage Effects on Soil Water Retention and Pore Size Distribution of Two Mollisols 1. Soil Sci. Soc. Am. J. 1985, 49, 1264–1270. [Google Scholar] [CrossRef]
- Anderson, S.H.; Gantzer, C.J.; Brown, J.R. Soil physical properties after 100 years of continuous cultivation. J. Soil Water Conserv. 1990, 45, 117–121. [Google Scholar]
- Haruna, S.I.; Anderson, S.H.; Nkongolo, N.V.; Zaibon, S. Soil hydraulic properties: Influence of tillage and cover crops. Pedosphere 2018, 28, 430–442. [Google Scholar] [CrossRef]
- Power, J.F.; Sandoval, F.M.; Ries, R.E.; Merrill, S.D. Effects of topsoil and subsoil thickness on soil water content and crop production on a disturbed soil. Soil Sci. Soc. Am. J. 1981, 45, 124–129. [Google Scholar] [CrossRef]
- Van Wesemael, B.; Mulligan, M.; Poesen, J. Spatial patterns of soil water balance on intensively cultivated hillslopes in a semi-arid environment: The impact of rock fragments and soil thickness. Hydrol. Process. 2000, 14, 1811–1828. [Google Scholar] [CrossRef]
- Fu, Z.Y.; Li, Z.X.; Cai, C.F.; Zhao, Y.; Shi, Z.H.; Xu, Q.X.; Wang, X.Y. Linking soil thickness and plot-scale hydrological processes on the sloping lands in the Three Gorges Area of China: A hydropedological approach. Hydrol. Process. 2012, 26, 2248–2263. [Google Scholar] [CrossRef]
- DeFauw, S.L.; Brye, K.R.; Sauer, T.J.; Hays, P. Hydraulic and Physiochemical Properties of a Hillslope Soil Assemblage in the Ozark Highlands. Soil Sci. 2014, 179, 107–117. [Google Scholar] [CrossRef]
- Jiang, P.; Anderson, S.H.; Kitchen, N.R.; Sadler, E.J.; Sudduth, K.A. Landscape and Conservation Management Effects on Hydraulic Properties of a Claypan-Soil Toposequence. Soil Sci. Soc. Am. J. 2007, 71, 803–811. [Google Scholar] [CrossRef] [Green Version]
- Wang, F.; Chen, H.; Lian, J.; Fu, Z.; Nie, Y. Preferential Flow in Different Soil Architectures of a Small Karst Catchment. Vadose Zone J. 2018, 17, 180107. [Google Scholar] [CrossRef]
- Nasri, B.; Fouché, O.; Torri, D. Coupling published pedotransfer functions for the estimation of bulk density and saturated hydraulic conductivity in stony soils. Catena 2015, 131, 99–108. [Google Scholar] [CrossRef]
- Gonzalez-Sosa, E.; Braud, I.; Dehotin, J.; Lassabatère, L.; Angulo-Jaramillo, R.; Lagouy, M.; Branger, F.; Jacqueminet, C.; Kermadi, S.; Michel, K. Impact of land use on the hydraulic properties of the topsoil in a small French catchment. Hydrol. Process. 2010, 24, 2382–2399. [Google Scholar] [CrossRef] [Green Version]
- Zhang, Y.W.; Deng, L.; Yan, W.M.; Shangguan, Z.P. Interaction of soil water storage dynamics and long-term natural vegetation succession on the Loess Plateau, China. Catena 2016, 137, 52–60. [Google Scholar] [CrossRef]
- Kalhoro, S.A.; Xu, X.X.; Ding, K.; Chen, W.Y.; Shar, A.G.; Rashid, M. The effects of different land uses on soil hydraulic properties in the Loess Plateau, Northern China. Land Degrad. Dev. 2018, 29, 3907–3916. [Google Scholar] [CrossRef]
- Çerçioğlu, M.; Anderson, S.H.; Udawatta, R.P.; Alagele, S. Effect of cover crop management on soil hydraulic properties. Geoderma 2019, 343, 247–253. [Google Scholar] [CrossRef]
- Hu, W.; Tabley, F.; Beare, M.; Tregurtha, C.; Gillespie, R.; Qiu, W.; Gosden, P. Short-Term Dynamics of Soil Physical Properties as Affected by Compaction and Tillage in a Silt Loam Soil. Vadose Zone J. 2018, 17, 180115. [Google Scholar] [CrossRef] [Green Version]
- Strudley, M.W.; Green, T.R.; Ascough, J.C., II. Tillage effects on soil hydraulic properties in space and time: State of the science. Soil Tillage Res. 2008, 99, 4–48. [Google Scholar] [CrossRef]
- Harden, C.P. Human impacts on headwater fluvial systems in the northern and central Andes. Geomorphology 2006, 79, 249–263. [Google Scholar] [CrossRef]
- Huang, Z.; Sun, L.; Liu, Y.; Liu, Y.F.; López-Vicente, M.; Wei, X.H.; Wu, G.L. Alfalfa planting significantly improved alpine soil water infiltrability in the Qinghai-Tibetan Plateau. Agric. Ecosyst. Environ. 2019, 285, 106606. [Google Scholar] [CrossRef]
- Mudgal, A.; Anderson, S.; Baffaut, C.; Kitchen, N.R.; Sadler, E.J. Effects of long-term soil and crop management on soil hydraulic properties for claypan soils. J. Soil. Water Conserv. 2010, 65, 393–403. [Google Scholar] [CrossRef] [Green Version]
- Mubarak, I.; Mailhol, J.C.; Angulo-Jaramillo, R.; Bouarfa, S.; Ruelle, P. Effect of temporal variability in soil hydraulic properties on simulated water transfer under highfrequency drip irrigation. Agric. Water Manag. 2009, 96, 1547–1559. [Google Scholar] [CrossRef]
- Kargas, G.; Kerkides, P.; Sotirakoglou, K.; Poulovassilis, A. Temporal variability of surface soil hydraulic properties under various tillage systems. Soil Tillage Res. 2016, 158, 22–31. [Google Scholar] [CrossRef]
- Zhang, M.; Lu, Y.; Heitman, J.; Horton, R.; Ren, T. Temporal changes of soil water retention behavior as affected by wetting and drying following tillage. Soil Sci. Soc. Am. J. 2017, 81, 1288–1295. [Google Scholar] [CrossRef]
- Kool, D.; Tong, B.; Tian, Z.; Heitman, J.L.; Sauer, T.J.; Horton, R. Soil water retention and hydraulic conductivity dynamics following tillage. Soil Tillage Res. 2019, 193, 95–100. [Google Scholar] [CrossRef] [Green Version]
- Zimmermann, B.; Elsenbeer, H.; De Moraes, J.M. The influence of land-use changes on soil hydraulic properties: Implications for runoff generation. For. Ecol. Manag. 2006, 222, 29–38. [Google Scholar] [CrossRef]
- Hellebrand, H.; Hoffmann, L.; Juilleret, J.; Pfister, L. Assessing winter storm flow generation by means of permeability of the lithology and dominating runoff production processes. Hydrol. Earth Syst. Sci. 2007, 11, 1673–1682. [Google Scholar] [CrossRef] [Green Version]
- Ghimire, C.P.; Bonell, M.; Bruijnzeel, L.; Coles, N.; Lubczynski, M.W. Reforesting severely degraded grassland in the Lesser Himalaya of Nepal: Effects on soil hydraulic conductivity and overland flow production. J. Geophys. Res. Earth Surf. 2013, 118, 2528–2545. [Google Scholar] [CrossRef] [Green Version]
- Tian, J.; Zhang, B.; He, C.; Yang, L. Variability in soil hydraulic conductivity and soil hydrological response under different land covers in the mountainous area of the Heihe River watershed, northwest China. Land Degrad. Dev. 2017, 28, 1437–1449. [Google Scholar] [CrossRef]
- Meadows, D.G.; Young, M.H.; McDonald, E.V. Influence of relative surface age on hydraulic properties and infiltration on soils associated with desert pavements. Catena 2008, 72, 169–178. [Google Scholar] [CrossRef]
- Rousseva, S.; Kercheva, M.; Shishkov, T.; Lair, G.J.; Nikolaidis, N.P.; Moraetis, D.; Krám, P.; Bernasconi, S.M.; Blum, W.E.H.; Menon, M.; et al. Advances in Agronomy; Chapter Two—Soil Water Characteristics of European SoilTrEC Critical Zone Observatories; Steven, A., Donald, B., Sparks, L., Eds.; Academic Press: Cambridge, MA, USA, 2017; Volume 142, pp. 29–72. [Google Scholar]
- Lin, H.S. Chapter 1: Hydropedology: Addressing fundamentals and building bridges to understand complex pedologic and hydrologic interactions. In Hydropedology: Synergistic Integration of Soil Science and Hydrology; Lin, H.S., Ed.; Elsevier: Amsterdam, The Netherlands, 2012; pp. 3–39. [Google Scholar]
- Ghimire, C.P.; Bruijnzeel, L.A.; Bonell, M.; Coles, N.; Lubczynski, M.W.; Gilmour, D.A. The effects of sustained forest use on hillslope soil hydraulic conductivity in the Middle Mountains of Central Nepal. Ecohydrology 2014, 7, 478–495. [Google Scholar] [CrossRef]
Figure 1.
Study area and typical soil profiles of different architecture. Shallow loam sandy soil on the shoulder: (a) SLSG-grassland, (b) SLSC-cropland; shallow sandy loam on the backslope: (c) SSLG-grassland, (d): SSLC-cropland; deep sandy loam on the footslope: (e) DSLG-grassland, (f) DSLC-cropland.

Figure 2.
Saturated hydraulic conductivities (Ksat) of different soil architectures at (a) 0–10 cm, (b) 10–20 cm, (c) 20–30 cm, and (d) 30–40 cm. SLSG: shallow loam sandy-shoulder-grassland; SLSC: shallow loam sandy-shoulder-cropland; SSLG: shallow sandy loam-grassland-backslope; SSLC: shallow sandy loam-cropland-backslope; DSLG: deep sandy loam-grassland-footslope; DSLC: deep sandy loam-cropland-footslope.

Figure 3.
Soil water retention curves under different soil architectures at 0–10 cm (a), 10–20 cm (b), 20–30 cm (c), and 30–40 cm (d) depths. SLSG: shallow loam sandy-shoulder-grassland; SLSC: shallow loam sandy-shoulder-cropland; SSLG: shallow sandy loam-grassland-backslope; SSLC: shallow sandy loam-cropland-backslope; DSLG: deep sandy loam-grassland-footslope; DSLC: deep sandy loam-cropland-footslope.

Figure 4.
Pore size distributions under different soil architectures: (a) macroporosity, (b) coarse mesoporosity, (c) fine mesoporosity, (d) microporosity. SLSG: shallow loam sandy-shoulder-grassland; SLSC: shallow loam sandy-shoulder-cropland; SSLG: shallow sandy loam-grassland-backslope; SSLC: shallow sandy loam-cropland-backslope; DSLG: deep sandy loam-grassland-footslope; DSLC: deep sandy loam-cropland-footslope.

Figure 5.
The infiltration of rainfall at the rates of mean I30 of 6.3 cm h−1. The histogram represents the percentage of different runoff pathways under different soil architectures. ORF: overland flow; SSF: subsurface flow; DF: deep-water infiltration. The numbers in the parenthesis are the corresponding flow rates. I is the infiltration that appeared in the soil profile, and the number in the parenthesis is the infiltration rate. Ksat is saturated hydraulic conductivity, cm h−1. SLSG: shallow loam sandy-shoulder-grassland; SLSC: shallow loam sandy-shoulder-cropland; SSLG: shallow sandy loam-grassland-backslope; SSLC: shallow sandy loam-cropland-backslope; DSLG: deep sandy loam-grassland-footslope; DSLC: deep sandy loam-cropland-footslope.


Table 1.
Description of the selected sites.
| Profiles | Landscape Position | Land Use | Replicates | Soil Thickness (cm) | Elevation(m) | Slope Gradient (°) |
|---|---|---|---|---|---|---|
| SLSG | ||||||
| SLSG1 | shoulder | grassland | 3 | 15 | 355 | 5 |
| SLSG2 | shoulder | grassland | 3 | 12 | 334 | 3 |
| SLSC | ||||||
| SLSC1 | shoulder | cropland | 3 | 25 | 342 | 1 |
| SLSC2 | shoulder | cropland | 3 | 20 | 358 | 2 |
| SSLG | ||||||
| SSLG1 | backslope | grassland | 3 | 30 | 292 | 2 |
| SSLG2 | backslope | grassland | 3 | 35 | 307 | 1 |
| SSLC | ||||||
| SSLC1 | backslope | cropland | 3 | 25 | 277 | 7 |
| SSLC2 | backslope | cropland | 3 | 30 | 294 | 1 |
| SSLC3 | backslope | cropland | 3 | 28 | 280 | 5 |
| DSLG | ||||||
| DSLG1 | footslope | grassland | 3 | >100 | 252 | 3 |
| DSLG2 | footslope | grassland | 3 | 90 | 246 | 2 |
| DSLG3 | footslope | grassland | 3 | 85 | 244 | 2 |
| DSLC | ||||||
| DSLC1 | footslope | cropland | 3 | 86 | 253 | 1 |
| DSLC2 | footslope | cropland | 3 | >100 | 221 | 1 |
| DSLC3 | footslope | cropland | 3 | 82 | 241 | 3 |
Note: SLSG: shallow loam sandy-shoulder-grassland; SLSC: shallow loam sandy-shoulder-cropland; SSLG: shallow sandy loam-grassland-backslope; SSLC: shallow sandy loam-cropland-backslope; DSLG: deep sandy loam-grassland-footslope; DSLC: deep sandy loam-cropland-footslope.
Table 2.
Basic topsoil properties of the study profiles (mean ± standard deviation).
| Profile | Bulk Density (g cm−3) | Clay (%) | Silt (%) | Sand (%) | Soil Texture | Total Porosity (%) | Organic Carbon (g kg−1) | Rock Fragment Content (%) |
|---|---|---|---|---|---|---|---|---|
| SLSG | ||||||||
| SLSG1 | 1.28 ± 0.02 | 10.4 ± 1.1 | 9.8 ± 0.8 | 79.8 ± 3.2 | loamy sand | 51.7 ± 1.2 | 28.6 ± 0.8 | 9.5 ± 2.4 |
| SLSG2 | 1.33 ± 0.01 | 10.7 ± 0.5 | 8.8 ± 1.2 | 80.5 ± 0.6 | loamy sand | 49.8 ± 0.8 | 28.1 ± 0.2 | 7.5 ± 0.2 |
| SLSC | ||||||||
| SLSC1 | 1.37 ± 0.03 | 11.3 ± 0.8 | 6.8 ± 0.1 | 81.9 ± 1.8 | loamy sand | 48.3 ± 1.2 | 15.2 ± 0.6 | 8.7 ± 1.5 |
| SLSC2 | 1.41 ± 0.02 | 11.2 ± 1.3 | 6.1 ± 0.3 | 82.7 ± 2.5 | loamy sand | 46.8 ± 0.6 | 14.9 ± 1.3 | 7.6 ± 1.8 |
| SSLG | ||||||||
| SSLG1 | 1.33 ± 0.02 | 14.6 ± 0.4 | 30.6 ± 0.9 | 54.8 ± 1.2 | sandy loam | 49.8 ± 0.6 | 34.4 ± 2.4 | 10.4 ± 0.5 |
| SSLG2 | 1.35 ± 0.04 | 14.4 ± 0.2 | 30.4 ± 1.3 | 55.2 ± 0.5 | sandy loam | 49.1 ± 0.5 | 32.8 ± 0.5 | 9.7 ± 1.3 |
| SSLC | ||||||||
| SSLC1 | 1.20 ± 0.01 | 14.7 ± 0.6 | 17.6 ± 0.2 | 67.7 ± 1.4 | sandy loam | 54.7 ± 0.6 | 26.1 ± 1.6 | 5.6 ± 0.4 |
| SSLC2 | 1.23 ± 0.01 | 12.9 ± 0.4 | 18.2 ± 0.1 | 68.9 ± 1.1 | sandy loam | 53.6 ± 1.8 | 27.1 ± 0.4 | 5.5 ± 0.2 |
| SSLC3 | 1.26 ± 0.01 | 13.8 ± 0.3 | 15.0 ± 0.2 | 71.2 ± 2.3 | sandy loam | 52.5 ± 2.5 | 27.6 ± 1.1 | 4.9 ± 1.1 |
| DSLG | ||||||||
| DSLG1 | 1.12 ± 0.03 | 12.7 ± 0.3 | 18.6 ± 0.2 | 68.7 ± 2.1 | sandy loam | 57.7 ± 1.3 | 31.4 ± 2.5 | 6.6 ± 0.2 |
| DSLG2 | 1.10 ± 0.01 | 12.6 ± 0.5 | 19.2 ± 0.5 | 68.2 ± 0.5 | sandy loam | 58.4 ± 1.2 | 34.6 ± 2.2 | 7.3 ± 0.6 |
| DSLG3 | 1.17 ± 0.01 | 12.6 ± 0.8 | 19.1 ± 0.3 | 68.3 ± 1.6 | sandy loam | 55.8 ± 0.1 | 33.9 ± 0.8 | 5.9 ± 0.1 |
| DSLC | ||||||||
| DSLC1 | 1.11 ± 0.04 | 17.1 ± 1.1 | 7.9 ± 0.4 | 75.0 ± 0.9 | sandy loam | 58.1 ± 1.1 | 15.5 ± 0.3 | 5.2 ± 0.4 |
| DSLC2 | 1.14 ± 0.02 | 18.8 ± 0.6 | 5.9 ± 0.1 | 75.3 ± 3.4 | sandy loam | 56.9 ± 0.6 | 20.2 ± 1.2 | 6.3 ± 1.8 |
| DSLC3 | 1.24 ± 0.01 | 18.2 ± 0.5 | 6.1 ± 0.1 | 75.7 ± 2.9 | sandy loam | 53.2 ± 0.5 | 21.1 ± 0.9 | 5.5 ± 1.4 |
Note: SLSG: shallow loam sandy-shoulder-grassland; SLSC: shallow loam sandy-shoulder-cropland; SSLG: shallow sandy loam-grassland-backslope; SSLC: shallow sandy loam-cropland-backslope; DSLG: deep sandy loam-grassland-footslope; DSLC: deep sandy loam-cropland-footslope.
Table 3.
Bulk density for the sampling sites at each depths (mean ± standard deviation). Different letters represent a significant difference at the 0.05 probability level.
Table 3.
Bulk density for the sampling sites at each depths (mean ± standard deviation). Different letters represent a significant difference at the 0.05 probability level.
| Treatment | Sampling Depth (cm) | |||
|---|---|---|---|---|
| 0–10 | 10–20 | 20–30 | 30–40 | |
| g cm−3 | ||||
| Soil architecture | ||||
| SLSG | 1.28 ± 0.08ab | 1.35 ± 0.07ab | 1.46 ± 0.09a | 1.61 ± 0.07ab |
| SLSC | 1.36 ± 0.09a | 1.40 ± 0.05a | 1.41 ± 0.08a | 1.47 ± 0.07c |
| SSLG | 1.33 ± 0.10a | 1.43 ± 0.11a | 1.46 ± 0.09a | 1.63 ± 0.10a |
| SSLC | 1.23 ± 0.09bc | 1.26 ± 0.08b | 1.40 ± 0.07a | 1.61 ± 0.06ab |
| DSLG | 1.13 ± 0.03d | 1.28 ± 0.09b | 1.30 ± 0.07b | 1.53 ± 0.10bc |
| DSLC | 1.16 ± 0.07cd | 1.28 ± 0.06b | 1.48 ± 0.09a | 1.51 ± 0.06c |
| Landscape position | ||||
| shoulder | 1.32 ± 0.09a | 1.38 ± 0.06a | 1.44 ± 0.09a | 1.54 ± 0.10b |
| backslope | 1.28 ± 0.10a | 1.34 ± 0.13ab | 1.43 ± 0.08a | 1.62 ± 0.08a |
| footslope | 1.14 ± 0.05b | 1.28 ± 0.08b | 1.39 ± 0.12a | 1.52 ± 0.08b |
| Land management | ||||
| grassland | 1.24 ± 0.11a | 1.35 ± 0.11a | 1.41 ± 0.11a | 1.59 ± 0.09a |
| cropland | 1.25 ± 0.11a | 1.31 ± 0.09a | 1.43 ± 0.08a | 1.53 ± 0.09b |
Note: Different letters represent significantly different at the 0.05 probability level. SLSG: shallow loam sandy-shoulder-grassland; SLSC: shallow loam sandy-shoulder-cropland; SSLG: shallow sandy loam-grassland-backslope; SSLC: shallow sandy loam-cropland-backslope; DSLG: deep sandy loam-grassland-footslope; DSLC: deep sandy loam-cropland-footslope.
Table 4.
Soil water retention for different landscape positions and land use (means ± standard deviation).
Table 4.
Soil water retention for different landscape positions and land use (means ± standard deviation).
| Treatment | Soil Water Pressure (kPa) | |||||||||
|---|---|---|---|---|---|---|---|---|---|---|
| 0.0 | −0.4 | −2.5 | −5.0 | −10.0 | −20.0 | −33.0 | −100 | −1500 | ||
| cm3 cm−3 | ||||||||||
| Landscape position | ||||||||||
| Shoulder | 0–10 cm | 0.327 ± 0.015 | 0.288 ± 0.018 | 0.254 ± 0.015 | 0.231 ± 0.020 | 0.199 ± 0.010 | 0.178 ± 0.010 | 0.154 ± 0.013 | 0.122 ± 0.008 | 0.088 ± 0.003 |
| 10–20 cm | 0.304 ± 0.018 | 0.277 ± 0.020 | 0.251 ± 0.022 | 0.231 ± 0.017 | 0.192 ± 0.013 | 0.173 ± 0.013 | 0.153 ± 0.017 | 0.131 ± 0.006 | 0.084 ± 0.002 | |
| 20–30 cm | 0.282 ± 0.012 | 0.261 ± 0.015 | 0.230 ± 0.007 | 0.215 ± 0.009 | 0.188 ± 0.021 | 0.174 ± 0.022 | 0.157 ± 0.017 | 0.127 ± 0.003 | 0.083 ± 0.003 | |
| 30–40 cm | 0.277 ± 0.012 | 0.249 ± 0.013 | 0.224 ± 0.018 | 0.212 ± 0.015 | 0.192 ± 0.014 | 0.180 ± 0.016 | 0.167 ± 0.017 | 0.132 ± 0.017 | 0.088 ± 0.004 | |
| backslope | 0–10 cm | 0.288 ± 0.007 | 0.263 ± 0.014 | 0.246 ± 0.012 | 0.221 ± 0.014 | 0.200 ± 0.004 | 0.164 ± 0.012 | 0.139 ± 0.019 | 0.123 ± 0.011 | 0.089 ± 0.022 |
| 10–20 cm | 0.283 ± 0.007 | 0.260 ± 0.017 | 0.238 ± 0.024 | 0.221 ± 0.018 | 0.201 ± 0.027 | 0.179 ± 0.024 | 0.158 ± 0.027 | 0.136 ± 0.032 | 0.096 ± 0.003 | |
| 20–30 cm | 0.280 ± 0.005 | 0.262 ± 0.010 | 0.236 ± 0.001 | 0.219 ± 0.001 | 0.188 ± 0.004 | 0.172 ± 0.004 | 0.152 ± 0.018 | 0.117 ± 0.019 | 0.079 ± 0.008 | |
| 30–40 cm | 0.257 ± 0.008 | 0.241 ± 0.010 | 0.222 ± 0.013 | 0.209 ± 0.011 | 0.195 ± 0.009 | 0.180 ± 0.012 | 0.161 ± 0.018 | 0.127 ± 0.013 | 0.081 ± 0.025 | |
| footslope | 0–10 cm | 0.332 ± 0.010 | 0.314 ± 0.013 | 0.295 ± 0.002 | 0.277 ± 0.005 | 0.261 ± 0.012 | 0.242 ± 0.011 | 0.224 ± 0.009 | 0.182 ± 0.002 | 0.117 ± 0.032 |
| 10–20 cm | 0.305 ± 0.002 | 0.289 ± 0.003 | 0.278 ± 0.007 | 0.263 ± 0.012 | 0.249 ± 0.016 | 0.236 ± 0.019 | 0.225 ± 0.018 | 0.195 ± 0.006 | 0.140 ± 0.013 | |
| 20–30 cm | 0.305 ± 0.011 | 0.292 ± 0.014 | 0.284 ± 0.016 | 0.270 ± 0.016 | 0.257 ± 0.018 | 0.248 ± 0.016 | 0.236 ± 0.009 | 0.206 ± 0.005 | 0.151 ± 0.004 | |
| 30–40 cm | 0.299 ± 0.015 | 0.291 ± 0.016 | 0.280 ± 0.020 | 0.269 ± 0.025 | 0.254 ± 0.027 | 0.236 ± 0.024 | 0.226 ± 0.027 | 0.189 ± 0.009 | 0.129 ± 0.011 | |
| Land use | ||||||||||
| grassland | 0–10 cm | 0.308 ± 0.023 | 0.278 ± 0.026 | 0.258 ± 0.030 | 0.234 ± 0.035 | 0.214 ± 0.034 | 0.187 ± 0.042 | 0.163 ± 0.049 | 0.138 ± 0.037 | 0.101 ± 0.034 |
| 10–20 cm | 0.291 ± 0.013 | 0.266 ± 0.020 | 0.243 ± 0.027 | 0.227 ± 0.024 | 0.201 ± 0.032 | 0.183 ± 0.034 | 0.164 ± 0.042 | 0.144 ± 0.041 | 0.109 ± 0.035 | |
| 20–30 cm | 0.282 ± 0.013 | 0.263 ± 0.017 | 0.245 ± 0.024 | 0.229 ± 0.026 | 0.201 ± 0.038 | 0.188 ± 0.042 | 0.171 ± 0.050 | 0.143 ± 0.052 | 0.102 ± 0.041 | |
| 30–40 cm | 0.269 ± 0.019 | 0.251 ± 0.025 | 0.230 ± 0.031 | 0.218 ± 0.029 | 0.202 ± 0.029 | 0.186 ± 0.028 | 0.170 ± 0.032 | 0.140 ± 0.037 | 0.092 ± 0.028 | |
| cropland | 0–10 cm | 0.323 ± 0.027 | 0.299 ± 0.025 | 0.272 ± 0.022 | 0.252 ± 0.026 | 0.226 ± 0.037 | 0.202 ± 0.041 | 0.182 ± 0.043 | 0.148 ± 0.032 | 0.095 ± 0.009 |
| 10–20 cm | 0.304 ± 0.014 | 0.285 ± 0.011 | 0.268 ± 0.014 | 0.249 ± 0.020 | 0.227 ± 0.030 | 0.209 ± 0.035 | 0.193 ± 0.039 | 0.164 ± 0.032 | 0.104 ± 0.025 | |
| 20–30 cm | 0.296 ± 0.015 | 0.281 ± 0.018 | 0.256 ± 0.034 | 0.240 ± 0.035 | 0.221 ± 0.042 | 0.208 ± 0.045 | 0.192 ± 0.044 | 0.156 ± 0.046 | 0.107 ± 0.041 | |
| 30–40 cm | 0.286 ± 0.024 | 0.270 ± 0.028 | 0.254 ± 0.035 | 0.242 ± 0.039 | 0.226 ± 0.041 | 0.211 ± 0.036 | 0.199 ± 0.040 | 0.159 ± 0.032 | 0.107 ± 0.027 | |
Note: SLSG: shallow loam sandy-shoulder-grassland; SLSC: shallow loam sandy-shoulder-cropland; SSLG: shallow sandy loam-grassland-backslope; SSLC: shallow sandy loam-cropland-backslope; DSLG: deep sandy loam-grassland-footslope; DSLC: deep sandy loam-cropland-footslope.
Table 5.
Macroporosity, coarse mesoporosity, fine mesoporosity, microporosity for different landscape positions and land use (means ± standard deviation).
Table 5.
Macroporosity, coarse mesoporosity, fine mesoporosity, microporosity for different landscape positions and land use (means ± standard deviation).
| Treatment | Macroporosity | Coarse Mesoporosity | Fine Mesoporosity | Microporosity | |
|---|---|---|---|---|---|
| cm3 cm−3 | |||||
| Landscape position | |||||
| Shoulder | 0–10 cm | 0.039 ± 0.003 | 0.057 ± 0.002 | 0.077 ± 0.007 | 0.154 ± 0.013 |
| 10–20 cm | 0.027 ± 0.002 | 0.046 ± 0.002 | 0.077 ± 0.001 | 0.153 ± 0.017 | |
| 20–30 cm | 0.021 ± 0.003 | 0.046 ± 0.006 | 0.058 ± 0.008 | 0.157 ± 0.017 | |
| 30–40 cm | 0.029 ± 0.001 | 0.036 ± 0.002 | 0.045 ± 0.002 | 0.167 ± 0.017 | |
| backslope | 0–10 cm | 0.033 ± 0.007 | 0.049 ± 0.001 | 0.084 ± 0.004 | 0.144 ± 0.019 |
| 10–20 cm | 0.028 ± 0.010 | 0.044 ± 0.001 | 0.074 ± 0.009 | 0.152 ± 0.027 | |
| 20–30 cm | 0.020 ± 0.004 | 0.043 ± 0.011 | 0.066 ± 0.019 | 0.154 ± 0.018 | |
| 30–40 cm | 0.023 ± 0.003 | 0.034 ± 0.001 | 0.048 ± 0.007 | 0.164 ± 0.018 | |
| footslope | 0–10 cm | 0.025 ± 0.003 | 0.041 ± 0.008 | 0.082 ± 0.004 | 0.139 ± 0.009 |
| 10–20 cm | 0.024 ± 0.002 | 0.039 ± 0.009 | 0.063 ± 0.007 | 0.158 ± 0.018 | |
| 20–30 cm | 0.018 ± 0.002 | 0.043 ± 0.002 | 0.067 ± 0.007 | 0.152 ± 0.009 | |
| 30–40 cm | 0.015 ± 0.001 | 0.032 ± 0.009 | 0.048 ± 0.002 | 0.161 ± 0.027 | |
| Land use | |||||
| grassland | 0–10 cm | 0.031 ± 0.010 | 0.044 ± 0.014 | 0.071 ± 0.015 | 0.163 ± 0.049 |
| 10–20 cm | 0.025 ± 0.007 | 0.039 ± 0.006 | 0.063 ± 0.018 | 0.164 ± 0.042 | |
| 20–30 cm | 0.019 ± 0.005 | 0.034 ± 0.009 | 0.058 ± 0.026 | 0.171 ± 0.050 | |
| 30–40 cm | 0.019 ± 0.010 | 0.033 ± 0.005 | 0.048 ± 0.004 | 0.170 ± 0.032 | |
| cropland | 0–10 cm | 0.025 ± 0.011 | 0.046 ± 0.008 | 0.070 ± 0.018 | 0.182 ± 0.043 |
| 10–20 cm | 0.019 ± 0.006 | 0.035 ± 0.014 | 0.056 ± 0.022 | 0.193 ± 0.039 | |
| 20–30 cm | 0.015 ± 0.004 | 0.041 ± 0.017 | 0.048 ± 0.008 | 0.192 ± 0.044 | |
| 30–40 cm | 0.016 ± 0.010 | 0.027 ± 0.011 | 0.043 ± 0.001 | 0.199 ± 0.040 | |
Note: SLSG: shallow loam sandy-shoulder-grassland; SLSC: shallow loam sandy-shoulder-cropland; SSLG: shallow sandy loam-grassland-backslope; SSLC: shallow sandy loam-cropland-backslope; DSLG: deep sandy loam-grassland-footslope; DSLC: deep sandy loam-cropland-footslope.
© 2019 by the authors. Licensee MDPI, Basel, Switzerland. This article is an open access article distributed under the terms and conditions of the Creative Commons Attribution (CC BY) license (http://creativecommons.org/licenses/by/4.0/).
Share and Cite
MDPI and ACS Style
Dai, C.; Wang, T.; Zhou, Y.; Deng, J.; Li, Z. Hydraulic Properties in Different Soil Architectures of a Small Agricultural Watershed: Implications for Runoff Generation. Water 2019, 11, 2537. https://doi.org/10.3390/w11122537
AMA Style
Dai C, Wang T, Zhou Y, Deng J, Li Z. Hydraulic Properties in Different Soil Architectures of a Small Agricultural Watershed: Implications for Runoff Generation. Water. 2019; 11(12):2537. https://doi.org/10.3390/w11122537
Chicago/Turabian StyleDai, Cuiting, Tianwei Wang, Yiwen Zhou, Jun Deng, and Zhaoxia Li. 2019. "Hydraulic Properties in Different Soil Architectures of a Small Agricultural Watershed: Implications for Runoff Generation" Water 11, no. 12: 2537. https://doi.org/10.3390/w11122537
Note that from the first issue of 2016, this journal uses article numbers instead of page numbers. See further details here.