Effects of Roughness Coefficients and Complex Hillslope Morphology on Runoff Variables under Laboratory Conditions

 , ,
, ,  and
and 
Abstract
:1. Introduction
2. Materials and Methods
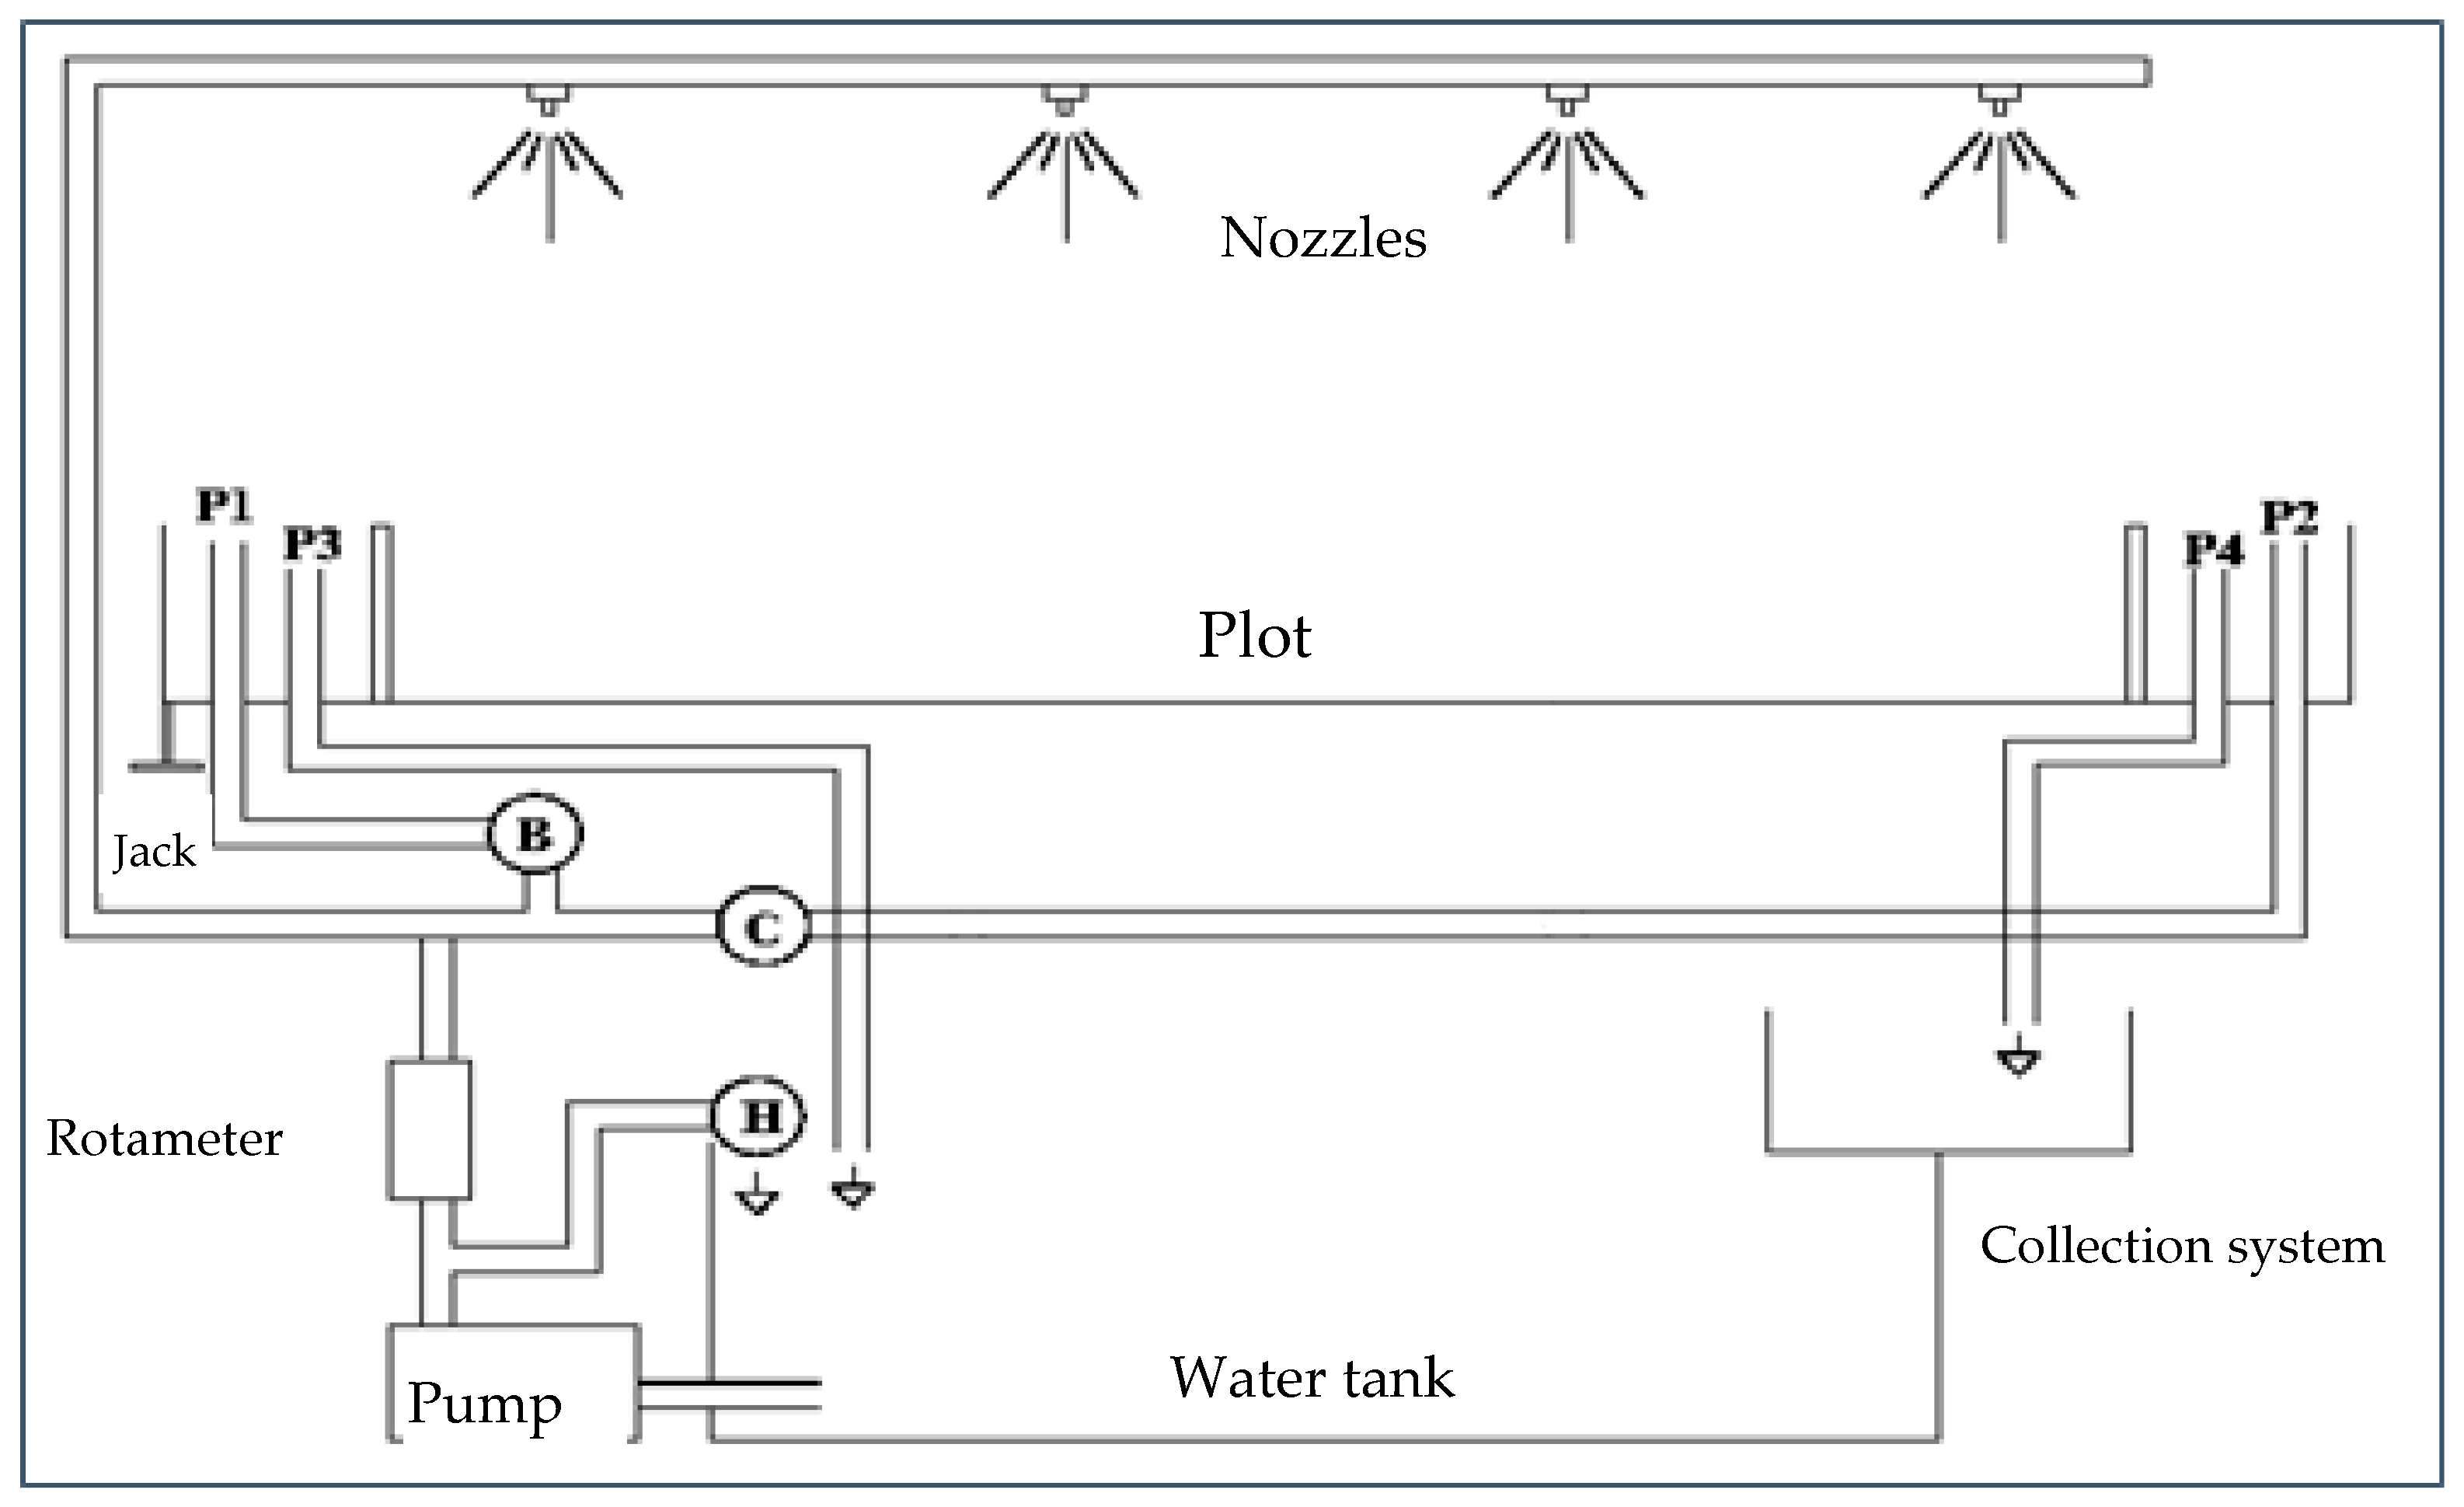
2.1. Preparing Rainfall Simulator Conditions
2.2. Determining the RC
2.3. Statistical Analysis
3. Results and Discussion
3.1. Descriptive Statistics of Runoff Variables in RCs in CHs
3.2. Start Time of Runoff
3.3. Time of Concentration
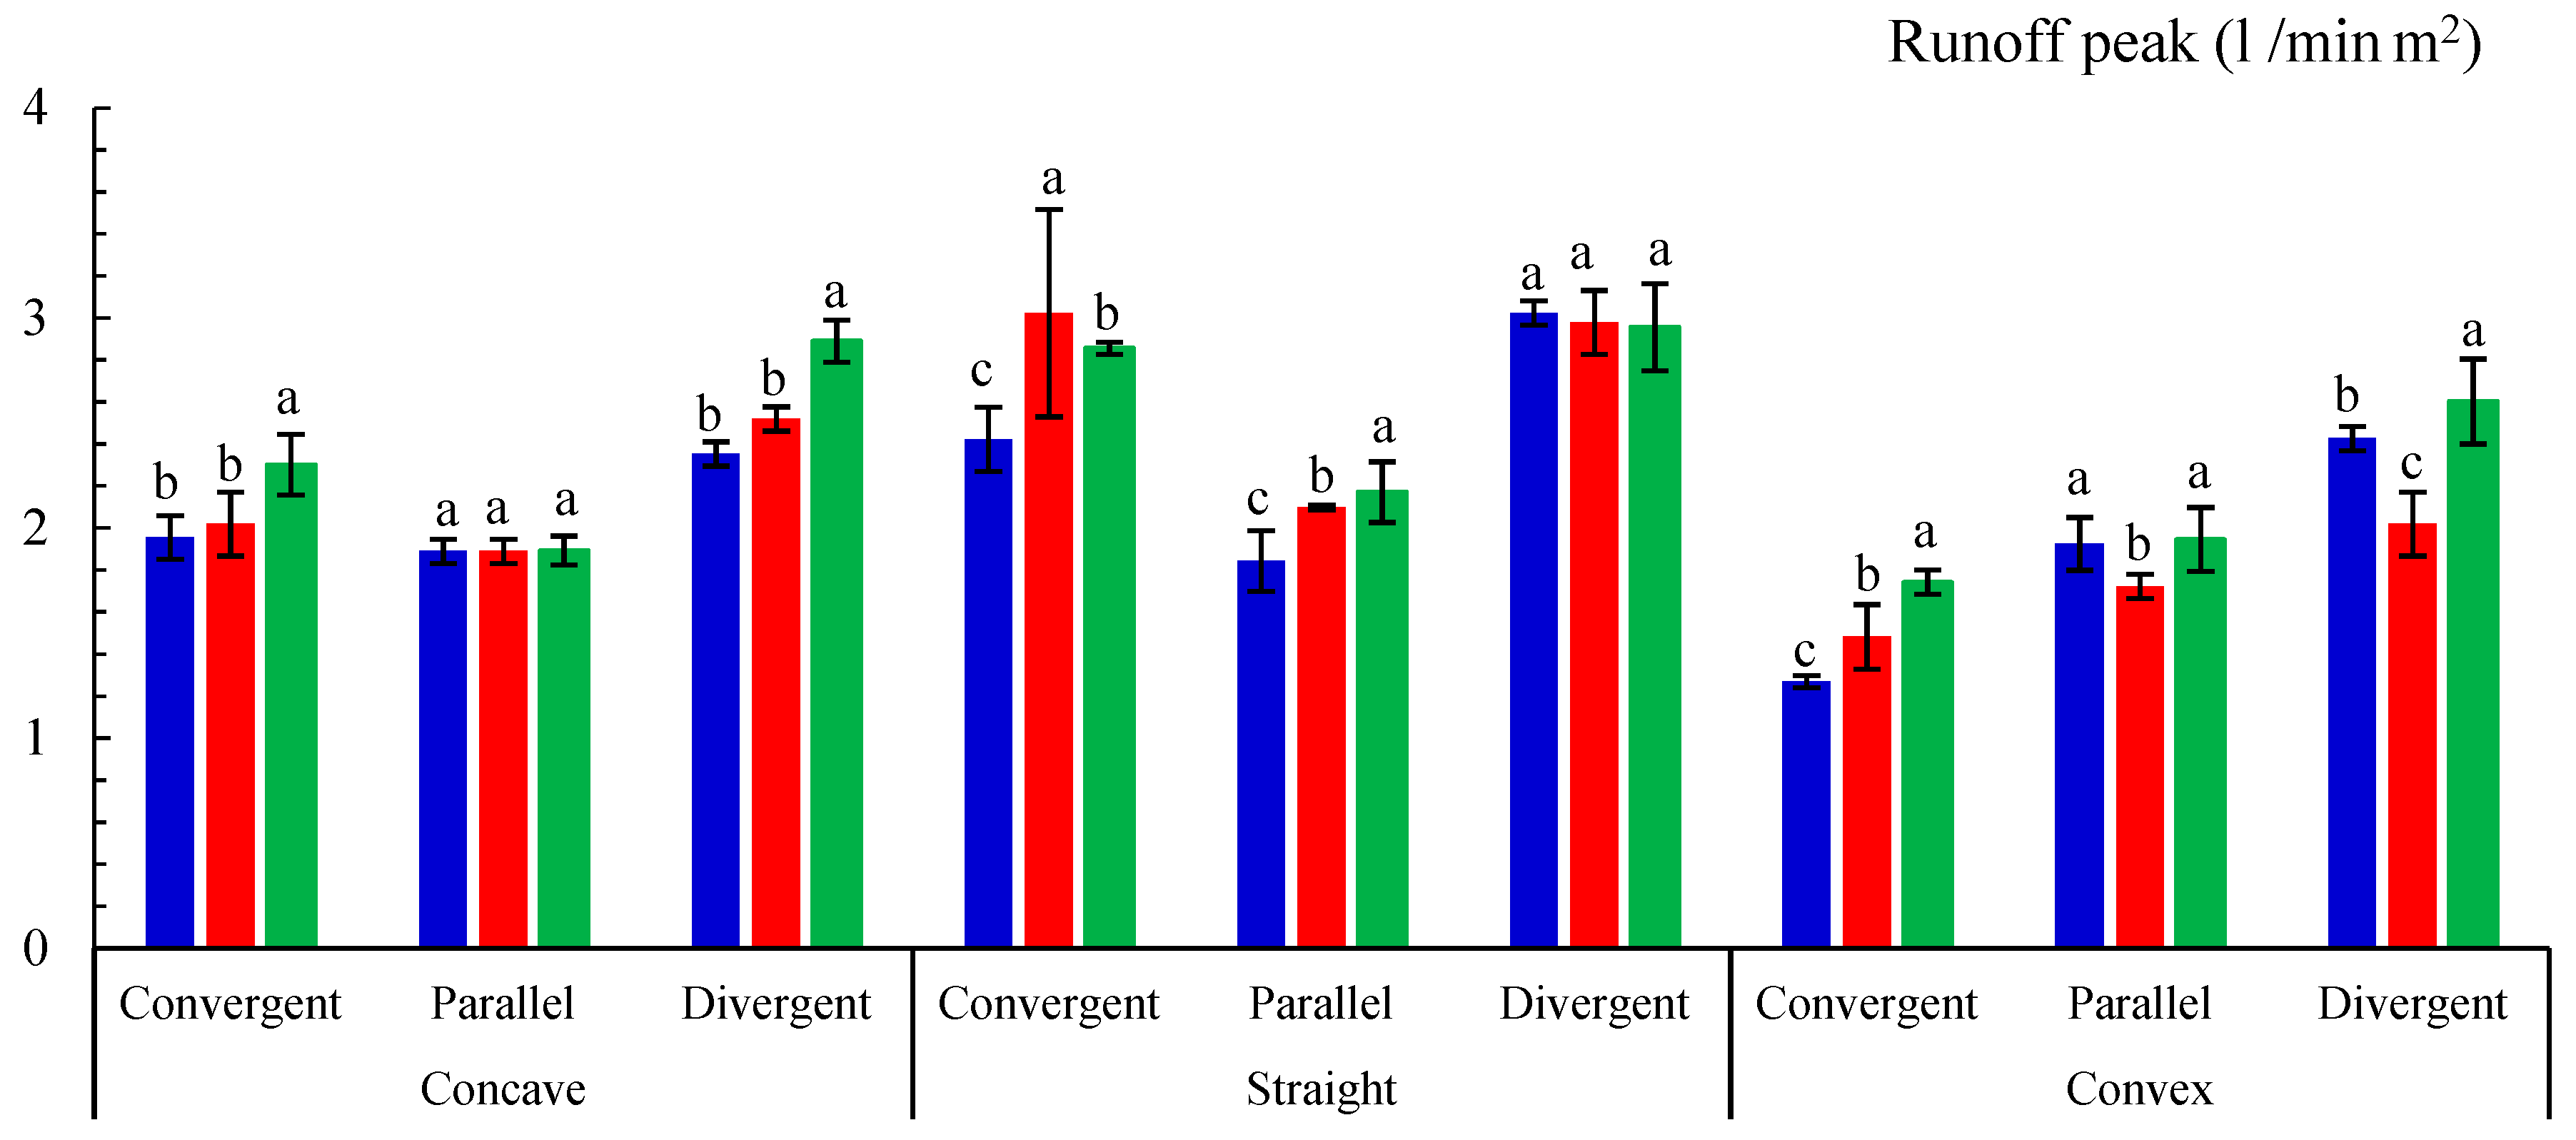
3.4. Runoff Peak
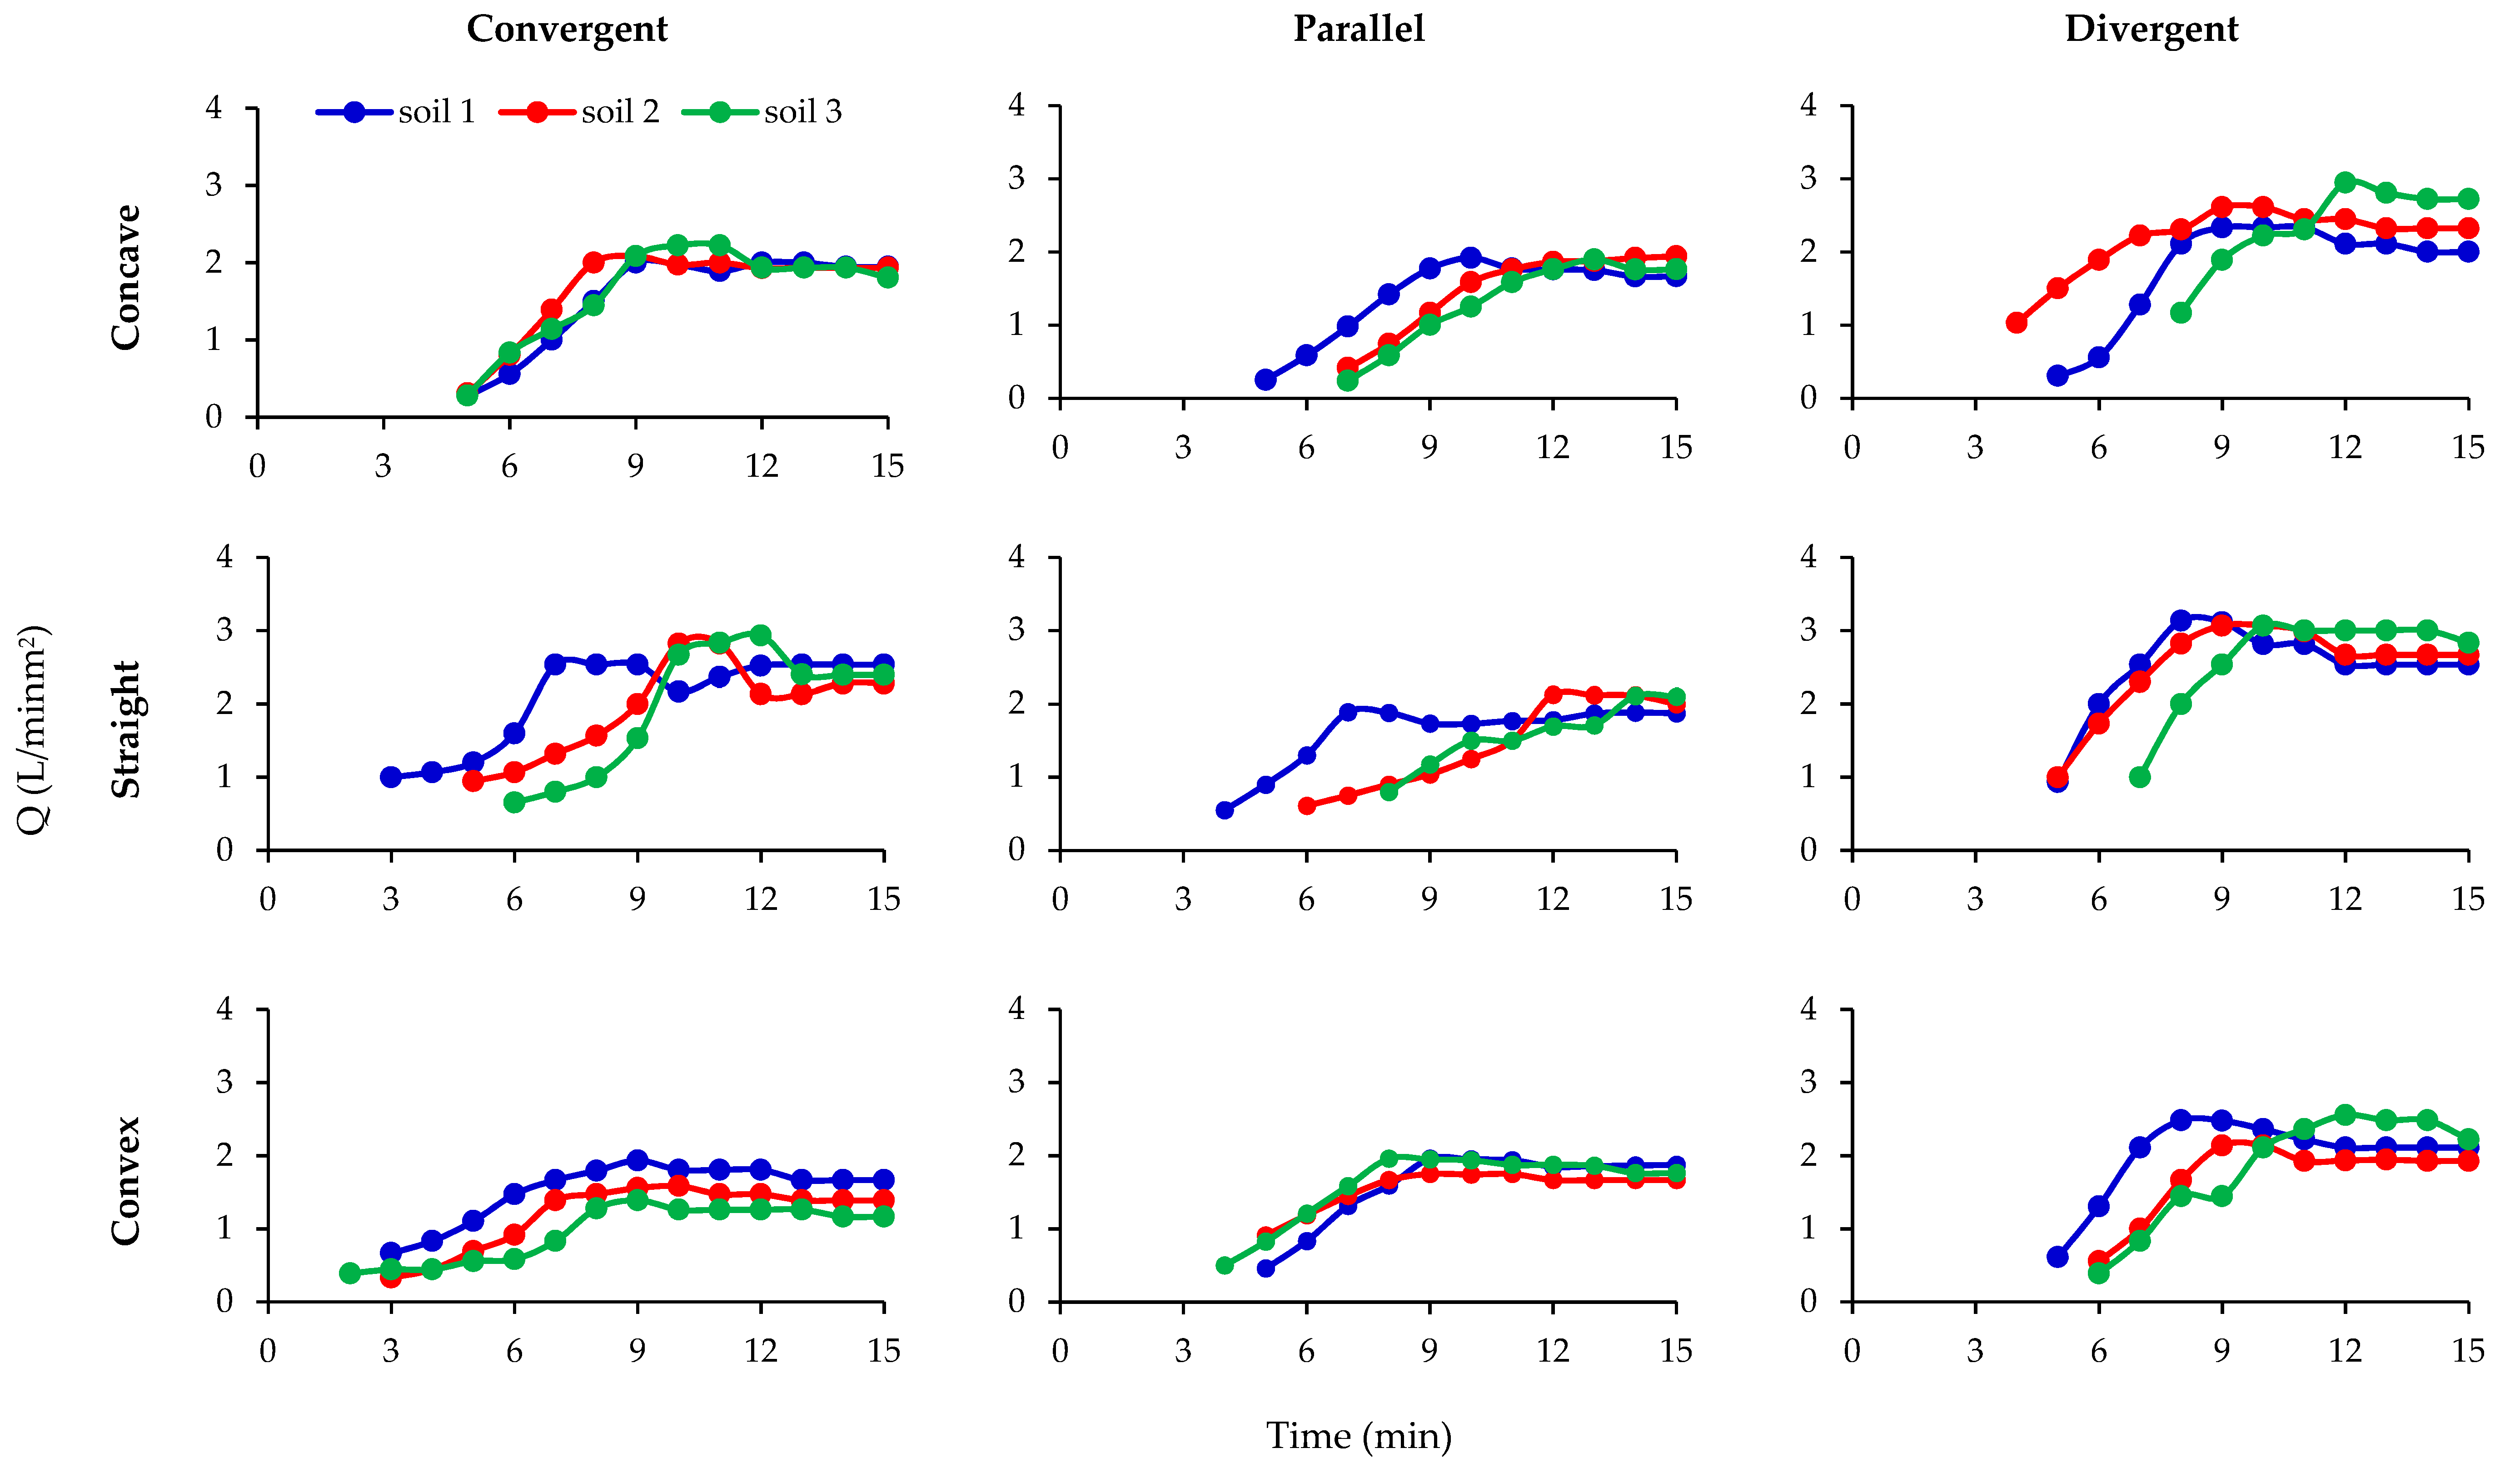
3.5. Hydrographs
3.6. Recommendations, Challenges and Future Research Work
4. Conclusions
Author Contributions
Funding
Acknowledgments
Conflicts of Interest
References
- Bosco, C.; De Rigo, D.; Dewitte, O.; Poesen, J.; Panagos, P. Modelling soil erosion at European scale: Towards harmonization and reproducibility. Nat. Hazard. Earth Sys. Sci. 2015, 15, 225–245. [Google Scholar] [CrossRef] [Green Version]
- Garcia-Ruiz, J.M.; Beguería, S.; Nadal-Romero, E.; Gonzalez-Hidalgo, J.C.; Lana-Renault, N.; Sanjuán, Y. A meta-analysis of soil erosion rates across the world. Geomorphology 2015, 239, 160–173. [Google Scholar] [CrossRef] [Green Version]
- Assouline, S.; Govers, G.; Nearing, M.A. Erosion and lateral surface processes. Vadose Zone J. 2017, 16, 1–4. [Google Scholar] [CrossRef] [Green Version]
- Borrelli, P.; Robinson, D.A.; Fleischer, L.R.; Lugato, E.; Ballabio, C.; Alewell, C.; Meusburger, K.; Modugno, S.; Schütt, B.; Ferro, V.; et al. An assessment of the global impact of 21st century land use change on soil erosion. Nat. Commun. 2017, 8, 2013. [Google Scholar] [CrossRef] [Green Version]
- Sadeghi, S.H.R.; Singh, V.P.; Kiani-Harchegani, M.; Asadi, H. Analysis of sediment rating loops and particle size distributions to characterize sediment source at mid-sized plot scale. Catena. 2018, 167, 221–227. [Google Scholar] [CrossRef]
- Kinnell, P.I.A. Raindrop-impact-induced erosion processes and prediction: A review. Hydrol. Process. 2005, 19, 2815–2844. [Google Scholar] [CrossRef]
- Marzen, M.; Iserloh, T.; Casper, M.C.; Ries, J.B. Quantification of particle detachment by rain splash and wind-driven rain splash. Catena 2015, 127, 135–141. [Google Scholar] [CrossRef]
- Fernández-Raga, M.; Campo, J.; Rodrigo-Comino, J.; Keesstra, S.D. Comparative Analysis of Splash Erosion Devices for Rainfall Simulation Experiments: A Laboratory Study. Water 2019, 11, 1228. [Google Scholar] [CrossRef] [Green Version]
- Sabzevari, T.; Saghafian, B.; Talebi, A.; Ardakanian, R. Time of concentration of surface flow in complex hillslopes. J. Hydrol. Hydromech. 2013, 61, 269–277. [Google Scholar] [CrossRef] [Green Version]
- Kiani-Harchegani, M.; Sadeghi, S.H.R.; Asadi, H. Comparing grain size distribution of sediment and original soil under raindrop detachment and raindrop-induced and flow transport mechanism. Hydrol. Sci. J. 2018, 63, 312–323. [Google Scholar] [CrossRef]
- Minea, G.; Ioana-Toroimac, G.; Moroşanu, G. The dominant runoff processes on grassland versus bare soil hillslopes in a temperate environment—An experimental study. J. Hydrol. Hydromech. 2019, 67, 1–8. [Google Scholar] [CrossRef] [Green Version]
- Lavee, H.; Poesen, J.W.A. Overland flow generation and continuity on stone-covered soil surfaces. Hydrol. Process. 1991, 5, 345–360. [Google Scholar] [CrossRef]
- Sabzevari, T.; Noroozpour, S. Effects of hillslope geometry on surface and subsurface flows. Hydrogeol. J. 2014, 22, 1593–1604. [Google Scholar] [CrossRef]
- Troch, P.; Van Loon, E.; Hilberts, A. Analytical solutions to a hillslope-storage kinematic wave equation for subsurface flow. Adv. Water Resour. 2002, 25, 637–649. [Google Scholar] [CrossRef]
- Hilberts, A.G.J.; Van Loon, E.E.; Troch, P.A.; Paniconi, C. The hillslope-storage Boussinesq model for non-constant bedrock slope. J. Hydrol. 2004, 291, 160–173. [Google Scholar] [CrossRef]
- Chaplot, V.; Poesen, J. Sediment, soil organic carbon and runoff delivery at various spatial scales. Catena 2012, 88, 46–56. [Google Scholar] [CrossRef]
- Orchard, C.M.; Lorentz, S.A.; Jewitt, G.P.W.; Chaplot, V.A.M. Spatial and temporal variations of overland flow during rainfall events and in relation to catchment conditions. Hydrol. Process. 2013, 27, 2325–2338. [Google Scholar] [CrossRef]
- Talebi, A.; Hajiabolghasemi, R.; Hadian, M.R.; Amanian, N. Physically based modelling of sheet erosion (detachment and deposition processes) in complex hillslopes. Hydrol. Process. 2016, 30, 1968–1977. [Google Scholar] [CrossRef]
- Danacova, M.; Vyleta, R.; Valent, P.; Hlavcova, K. The impact of slope gradients on the generation of surface runoff in laboratory conditions. In Proceedings of the 17th International Multidisciplinary Scientific GeoConference SGEM, Vienna, Austria, 27–29 November 2017; Volume 2017, pp. 677–684. [Google Scholar]
- Eshghizadeh, M.; Talebi, A.; Dastorani, M. Thresholds of land cover to control runoff and soil loss. Hydrol. Sci. J. 2018, 63, 1424–1434. [Google Scholar] [CrossRef]
- Zhao, L.; Hou, R.; Wu, F.; Keesstra, S. Effect of soil surface roughness on infiltration water, ponding and runoff on tilled soils under rainfall simulation experiments. Soil. Till. Res. 2018, 179, 47–53. [Google Scholar] [CrossRef]
- Cerdà, A.; Rodrigo-Comino, J. Is the hillslope position relevant for runoff and soil loss activation under high rainfall conditions in vineyards? Ecohydrol. Hydrobiol. 2019, 5, 6. [Google Scholar] [CrossRef]
- Kiani-Harchegani, M.; Sadeghi, S.H.R.; Ghahramani, A. Intra-storm Variability of Coefficient of Variation of Runoff and Soil Loss in Consecutive Storms at Experimental Plot Scale. In Climate Change Impacts on Hydrological Processes and Sediment Dynamics: Measurement, Modelling and Management; Springer: Berlin/Heidelberg, Germany, 2019; pp. 98–103. [Google Scholar]
- Vermang, J.; Norton, L.D.; Huang, C.; Cornelis, W.M.; Da Silva, A.M.; Gabriels, D. Characterization of soil surface roughness effects on runoff and soil erosion rates under simulated rainfall. Soil Sci. Soc. Am. J. 2015, 79, 903–916. [Google Scholar] [CrossRef]
- Ding, W.; Huang, C. Effects of soil surface roughness on interrill erosion processes and sediment particle size distribution. Geomorphology 2017, 295, 801–810. [Google Scholar] [CrossRef]
- Vaezi, A.R.; Ebadi, M. Particle size distribution of surface-eroded soil in different rainfall intensities and slope gradients. J. Water. Soil. 2017, 31, 216–229. (In Persian) [Google Scholar]
- Ferreira, C.S.S.; Walsh, R.P.D.; Steenhuis, T.S.; Shakesby, R.A.; Nunes, J.P.N.; Coelho, C.O.A.; Ferreira, A.J.D. Spatiotemporal variability of hydrologic soil properties and the implications for overland flow and land management in a peri-urban Mediterranean catchment. J. Hydrol. 2015, 525, 249–263. [Google Scholar] [CrossRef] [Green Version]
- Kalantari, Z.; Ferreira, C.S.S.; Koutsouris, A.J.; Ahmer, A.K.; Cerdà, A.; Destouni, G. Assessing flood probability for transportation infrastructure based on catchment characteristics, sediment connectivity and remotely sensed soil moisture. Sci. Total Environ. 2019, 661, 393–406. [Google Scholar] [CrossRef]
- Troch, P.A.; Paniconi, C.; Emiel van Loon, E. Hillslope-storage Boussinesq model for subsurface flow and variable source areas along complex hillslopes: 1. Formulation and characteristic response. Water Resour. Res. 2003, 39, 1316. [Google Scholar] [CrossRef]
- Agnese, C.; Baiamonte, G.; Corrao, C. Overland flow generation on hillslopes of complex topography: Analytical solutions. Hydrol. Process. 2007, 21, 1308–1317. [Google Scholar] [CrossRef]
- Talebi, A.; Troch, P.A.; Uijlenhoet, R. A steady-state analytical slope stability model for complex hillslopes. Hydrol Process. 2008, 22, 546–553. [Google Scholar] [CrossRef]
- Geranian, M.; Amanian, N.; Taleb, A.; Hadian, M.R.; Zeini, M. Laboratorial Investigation of Effect of Plan Shape and Profile Curvature on Variations of Surface Flow In Complex Hillslopes. Water Resour. Res. 2013, 9, 64–72. (In Persian) [Google Scholar]
- Sabzevari, T.; Noroozpour, S.; Pishvaei, M.H. Effects of geometry on runoff time characteristics and time-area histogram of hillslopes. J. Hydrol. 2015, 531, 638–648. [Google Scholar] [CrossRef]
- Fariborzi, H.; Sabzevari, T.; Noroozpour, S.; Mohammadpour, R. Prediction of the subsurface flow of hillslopes using a subsurface time-area model. Hydrogeol. J. 2019, 27, 1401–1417. [Google Scholar] [CrossRef]
- Evans, I. An integrated system of terrain analysis and slope mapping. Z. Geomorphol. 1980, 36, 274–295. [Google Scholar]
- Sabzevari, T.; Talebi, A.; Ardakanian, R.; Shamsai, A. A steady-state saturation model to determine the subsurface travel time (STT) in complex hillslopes. Hydrol. Earth Sys. Sci. 2010, 14, 891–900. [Google Scholar] [CrossRef] [Green Version]
- Rodríguez-Caballero, E.; Cantón, Y.; Chamizo, S.; Afana, A.; Solé-Benet, A. Effects of biological soil crusts on surface roughness and implications for runoff and erosion. Geomorphology 2012, 145, 81–89. [Google Scholar] [CrossRef]
- Tavakoli, B. Engineering Geology; Payame Noor University Press: Tehran, Iran, 2011; p. 420. [Google Scholar]
- Yong, C.T. Sediment Transport: Theory and Practice; McGraw-Hill: New York, NY, USA, 1996; p. 396. [Google Scholar]
- Kiani-Harchegani, M.; Sadeghi, S.H.R.; Singh, V.P.; Asadi, H.; Abedi, M. Effect of rainfall intensity and slope on sediment particle size distribution during erosion using partial eta squared. Catena 2019, 176, 65–72. [Google Scholar] [CrossRef]
- Cavalli, M.; Vericat, D.; Pereira, P. Mapping water and sediment connectivity. Sci. Total Environ. 2019, 673, 763–767. [Google Scholar] [CrossRef]
- López-Vicente, M.; Ben-Salem, N. Computing structural and functional flow and sediment connectivity with a new aggregated index: A case study in a large Mediterranean catchment. Sci. Total Environ. 2019, 651, 179–191. [Google Scholar] [CrossRef]
- Amanian, N.; Geranian, M.; Talebi, A.; Hadian, M.R. The effect of plan and slope profile on runoff initiation threshold. Watershed Manag. Sci. Eng. 2018, 11, 105–108. (In Persian) [Google Scholar]
- Lin, Q.; Xu, Q.; Wu, F.; Li, T. Effects of wheat in regulating runoff and sediment on different slope gradients and under different rainfall intensities. Catena 2019, 183, 104196. [Google Scholar] [CrossRef]
- Rodrigo-Comino, J.; Sinoga, J.R.; González, J.S.; Guerra-Merchán, A.; Seeger, M.; Ries, J.B. High variability of soil erosion and hydrological processes in Mediterranean hillslope vineyards (Montes de Málaga, Spain). Catena 2016, 145, 274–284. [Google Scholar] [CrossRef]
- Fan, C.C.; Wang, H.Z. The behavior of wetting front on slopes with different slope morphologies during rainfall. J. Hydro-Environ. Res. 2019, 25, 48–60. [Google Scholar] [CrossRef]
- Tucker, G.E.; Bras, R.L. Hillslope processes, drainage density, and landscape morphology. Water Resour. Res. 1998, 34, 2751–2764. [Google Scholar] [CrossRef] [Green Version]
- Bonetti, S.; Richter, D.D.; Porporato, A. The effect of accelerated soil erosion on hillslope morphology. Earth Surf. Process. Landf. 2019. Available online: https://doi.org/10.1002/esp.4694 (accessed on 3 December 2019). [CrossRef]
- Baiamonte, G.; Singh, V.P. Overland flow times of concentration for hillslopes of complex topography. J. Irrig. Drain. Eng. 2015, 142, 04015059. [Google Scholar] [CrossRef]
- Cossart, E.; Fressard, M. Assessment of structural sediment connectivity within catchments: Insights from graph theory. Earth Surf. Dyn. 2017, 5, 253–268. [Google Scholar] [CrossRef] [Green Version]
- Cossart, E.; Viel, V.; Lissak, C.; Reulier, R.; Fressard, M.; Delahaye, D. How might sediment connectivity change in space and time? Land Degrade. Dev. 2018, 29, 2595–2613. [Google Scholar] [CrossRef]
- Novara, A.; Gristina, L.; Guaitoli, F.; Santoro, A.; Cerdà, A. Managing soil nitrate with cover crops and buffer strips in Sicilian vineyards. Solid Earth. 2013, 4, 255–262. [Google Scholar] [CrossRef] [Green Version]
- Kavian, A.; Saleh, I.; Habibnejad, M.; Brevik, E.C.; Jafarian, Z.; Rodrigo-Comino, J. Effectiveness of vegetative buffer strips at reducing runoff, soil erosion, and nitrate transport during degraded hillslope restoration in northern Iran. Land Degrad. Dev. 2018, 29, 3194–3203. [Google Scholar] [CrossRef]
- Panagos, P.; Borrelli, P.; Meusburger, K.; van der Zanden, E.H.; Poesen, J.; Alewell, C. Modelling the effect of support practices (P-factor) on the reduction of soil erosion by water at European scale. Environ. Sci. Policy. 2015, 51, 23–34. [Google Scholar] [CrossRef]
- Rodrigo-Comino, J.; Seeger, M.; Iserloh, T.; González, J.M.S.; Ruiz-Sinoga, J.D.; Ries, J.B. Rainfall-simulated quantification of initial soil erosion processes in sloping and poorly maintained terraced vineyards-Key issues for sustainable management systems. Sci. Total Environ. 2019, 660, 1047–1057. [Google Scholar] [CrossRef]
- Ben-Salem, N.; Álvarez, S.; López-Vicente, M. Soil and water conservation in rainfed vineyards with common sainfoin and spontaneous vegetation under different ground conditions. Water. 2018, 10, 1058. [Google Scholar] [CrossRef] [Green Version]
- Marzen, M.; Iserloh, T.; de Lima, J.L.; Fister, W.; Ries, J.B. Impact of severe rain storms on soil erosion: Experimental evaluation of wind-driven rain and its implications for natural hazard management. Sci. Total Environ. 2017, 590, 502–513. [Google Scholar] [CrossRef] [PubMed]
- Jomaa, S.; Barry, D.A.; Heng, B.C.P.; Brovelli, A.; Sander, G.C.; Parlange, J.Y. Effect of antecedent conditions and fixed rock fragment coverage on soil erosion dynamics through multiple rainfall events. J. Hydrol. 2013, 484, 115–127. [Google Scholar] [CrossRef]
- Zuazo, V.H.D.; Pleguezuelo, C.R.R. Soil-erosion and runoff prevention by plant covers: A review. Agron. Sustain. Dev. 2009, 28, 65–86. [Google Scholar] [CrossRef] [Green Version]
- Feng, T.; Wei, W.; Chen, L.; Rodrigo-Comino, J.; Die, C.; Feng, X.; Ren, K.; Brevik, E.C.; Yu, Y. Assessment of the impact of different vegetation patterns on soil erosion processes on semiarid loess slopes. Earth Surf. Process. Landf. 2018, 43, 1860–1870. [Google Scholar] [CrossRef]
- Rodrigo-Comino, J.; Novara, A.; Gyasi-Agyei, Y.; Terol, E.; Cerdà, A. Effects of parent material on soil erosion within Mediterranean new vineyard plantations. Eng. Geol. 2018, 246, 255–261. [Google Scholar] [CrossRef] [Green Version]


| No. | Longitudinal Profile | Plan Shape | CHs | H (m) | n (No Dimension) | L (m) | A (m2) | |
|---|---|---|---|---|---|---|---|---|
| 1 | Concave | Convergent |  | 0.36 | 1.5 | 1.90 | +0.0997 | 1.8 |
| 2 | Parallel |  | 0.0000 | 2.4 | ||||
| 3 | Divergent |  | −0.0997 | 1.8 | ||||
| 4 | Straight | Convergent |  | 0.36 | 1 | 1.90 | +0.0997 | 1.5 |
| 5 | Parallel |  | 0.0000 | 2 | ||||
| 6 | Divergent |  | −0.0997 | 1.5 | ||||
| 7 | Convex | Convergent |  | 0.36 | 0.5 | 1.90 | +0.0997 | 1.8 |
| 8 | Parallel |  | 0.0000 | 2.4 | ||||
| 9 | Divergent |  | −0.0997 | 1.8 |
| N | Hillslopes No. | 1 | 2 | 3 | 4 | 5 | 6 | 7 | 8 | 9 | |
|---|---|---|---|---|---|---|---|---|---|---|---|
| Variables | Soil Type | Profile Plan | Concave | Straight | Convex | ||||||
| Converge | Parallel | Divergent | Converge | Parallel | Divergent | Converge | Parallel | Divergent | |||
| Runoff generation (min) | 1 | Mean | 2.15 | 4.43 | 4.12 | 2.24 | 3.25 | 3.39 | 1.15 | 2.91 | 3.45 |
| SD | 0.50 | 0.76 | 0.29 | 0.51 | 0.45 | 0.32 | 0.50 | 0.10 | 0.50 | ||
| CV | 0.23 | 0.17 | 0.07 | 0.23 | 0.14 | 0.09 | 0.43 | 0.03 | 0.14 | ||
| 2 | Mean | 2.53 | 6.17 | 3.70 | 4.08 | 5.43 | 3.67 | 2.20 | 4.12 | 4.47 | |
| SD | 0.58 | 0.58 | 0.00 | 0.29 | 0.58 | 0.58 | 0.10 | 0.29 | 0.58 | ||
| CV | 0.23 | 0.09 | 0.00 | 0.07 | 0.11 | 0.16 | 0.05 | 0.07 | 0.13 | ||
| 3 | Mean | 4.25 | 6.67 | 7.42 | 3.93 | 7.78 | 6.25 | 1.82 | 3.18 | 5.43 | |
| SD | 0.50 | 0.58 | 0.29 | 0.29 | 0.76 | 0.50 | 0.29 | 0.10 | 0.58 | ||
| CV | 0.12 | 0.09 | 0.04 | 0.07 | 0.10 | 0.08 | 0.16 | 0.03 | 0.11 | ||
| Time of runoff concentration (min) | 1 | Mean | 4.00 | 4.86 | 3.15 | 3.33 | 3.53 | 2.77 | 5.28 | 3.37 | 2.68 |
| SD | 0.20 | 0.11 | 0.09 | 0.15 | 0.15 | 0.12 | 0.03 | 0.06 | 0.16 | ||
| CV | 0.05 | 0.02 | 0.03 | 0.05 | 0.04 | 0.04 | 0.01 | 0.02 | 0.06 | ||
| 2 | Mean | 5.27 | 5.68 | 3.78 | 4.28 | 5.63 | 4.27 | 7.78 | 4.93 | 3.87 | |
| SD | 0.38 | 0.03 | 0.03 | 0.19 | 0.15 | 0.06 | 0.03 | 0.03 | 0.06 | ||
| CV | 0.07 | 0.01 | 0.01 | 0.04 | 0.03 | 0.01 | 0.00 | 0.01 | 0.01 | ||
| 3 | Mean | 5.68 | 6.68 | 5.47 | 6.65 | 6.75 | 4.47 | 7.45 | 3.52 | 4.73 | |
| SD | 0.16 | 0.16 | 0.15 | 0.00 | 0.05 | 0.15 | 0.13 | 0.10 | 0.21 | ||
| CV | 0.03 | 0.02 | 0.03 | 0.00 | 0.01 | 0.03 | 0.02 | 0.03 | 0.04 | ||
| Runoff peak (L min−1 m−2) | 1 | Mean | 1.95 | 1.89 | 2.35 | 2.42 | 1.84 | 3.02 | 1.27 | 1.92 | 2.43 |
| SD | 0.10 | 0.06 | 0.06 | 0.15 | 0.14 | 0.06 | 0.03 | 0.13 | 0.06 | ||
| CV | 0.05 | 0.03 | 0.02 | 0.06 | 0.08 | 0.02 | 0.02 | 0.07 | 0.02 | ||
| 2 | Mean | 2.02 | 1.89 | 2.52 | 3.02 | 2.10 | 2.98 | 1.48 | 1.72 | 2.02 | |
| SD | 0.15 | 0.06 | 0.06 | 0.49 | 0.01 | 0.15 | 0.15 | 0.06 | 0.15 | ||
| CV | 0.08 | 0.03 | 0.02 | 0.16 | 0.01 | 0.05 | 0.10 | 0.03 | 0.08 | ||
| 3 | Mean | 2.30 | 1.89 | 2.89 | 2.86 | 2.17 | 2.96 | 1.74 | 1.94 | 2.60 | |
| SD | 0.14 | 0.07 | 0.10 | 0.03 | 0.14 | 0.21 | 0.06 | 0.15 | 0.20 | ||
| CV | 0.06 | 0.04 | 0.03 | 0.01 | 0.07 | 0.07 | 0.03 | 0.08 | 0.08 | ||
| Variables | Factors | df | Mean Squared | F-Value | p-Value |
|---|---|---|---|---|---|
| Start Time (min) | CH | 8 | 55,945.03 | 2237.80 | 0.00 |
| RC | 2 | 114,643.11 | 4585.72 | 0.00 | |
| CH × RC | 16 | 8513.61 | 340.54 | 0.00 | |
| Time of concentration (min) | CH | 8 | 32,212.25 | 1288.49 | 0.00 |
| RC | 2 | 84,037.00 | 3361.48 | 0.00 | |
| CH × RC | 16 | 5248.25 | 209.93 | 0.00 | |
| Runoff peak (L min−1 m−2) | CH | 8 | 82.36 | 82.40 | 0.00 |
| RC | 2 | 25.44 | 25.40 | 0.00 | |
| CH × RC | 16 | 5.07 | 5.07 | 0.00 |
© 2019 by the authors. Licensee MDPI, Basel, Switzerland. This article is an open access article distributed under the terms and conditions of the Creative Commons Attribution (CC BY) license (http://creativecommons.org/licenses/by/4.0/).
Share and Cite
Meshkat, M.; Amanian, N.; Talebi, A.; Kiani-Harchegani, M.; Rodrigo-Comino, J. Effects of Roughness Coefficients and Complex Hillslope Morphology on Runoff Variables under Laboratory Conditions. Water 2019, 11, 2550. https://doi.org/10.3390/w11122550
Meshkat M, Amanian N, Talebi A, Kiani-Harchegani M, Rodrigo-Comino J. Effects of Roughness Coefficients and Complex Hillslope Morphology on Runoff Variables under Laboratory Conditions. Water. 2019; 11(12):2550. https://doi.org/10.3390/w11122550
Chicago/Turabian StyleMeshkat, Masoud, Nosratollah Amanian, Ali Talebi, Mahboobeh Kiani-Harchegani, and Jesús Rodrigo-Comino. 2019. "Effects of Roughness Coefficients and Complex Hillslope Morphology on Runoff Variables under Laboratory Conditions" Water 11, no. 12: 2550. https://doi.org/10.3390/w11122550