Reductive/Oxidative Sequential Bioelectrochemical Process for Perchloroethylene Removal


Department of Chemistry, Sapienza University of Rome, P.le Aldo Moro 5, 00185 Rome, Italy
*
Author to whom correspondence should be addressed.
Water 2019, 11(12), 2579; https://doi.org/10.3390/w11122579
Submission received: 31 October 2019
/
Revised: 3 December 2019
/
Accepted: 4 December 2019
/
Published: 6 December 2019
(This article belongs to the Special Issue New Perspective on Groundwater Contamination Treatment: Bioelectrochemical Systems)
Abstract
:An innovative bioelectrochemical reductive/oxidative sequential process was developed and tested on a laboratory scale to obtain the complete mineralization of perchloroethylene (PCE) in a synthetic medium. The sequential bioelectrochemical process consisted of two separate tubular bioelectrochemical reactors that adopted a novel reactor configuration, avoiding the use of an ion exchange membrane to separate the anodic and cathodic chamber and reducing the cost of the reactor. In the reductive reactor, a dechlorinating mixed inoculum received reducing power to perform the reductive dechlorination of perchloroethylene (PCE) through a cathode chamber, while the less chlorinated daughter products were removed in the oxidative reactor, which supported an aerobic dechlorinating culture through in situ electrochemical oxygen evolution. Preliminary fluid dynamics and electrochemical tests were performed to characterize both the reductive and oxidative reactors, which were electrically independent of each other, with each having its own counterelectrode. The first continuous-flow potentiostatic run with the reductive reactor (polarized at −450 mV vs. SHE) resulted in obtaining 100% ± 1% removal efficiency of the influent PCE, while the oxidative reactor (polarized at +1.4 V vs. SHE) oxidized the vinyl chloride and ethylene from the reductive reactor, with removal efficiencies of 100% ± 2% and 92% ± 1%, respectively.

1. Introduction
Chlorinated aliphatic hydrocarbons (CAHs) are among the most frequent groundwater contaminants due to their intense use as solvents or degreasing agents in the mechanical industry coupled with unregulated and inappropriate disposal procedures [1]. CAHs, due to their low solubility, are particularly persistent in the environment; however, their low solubility is sufficiently high to overcome the concentration limits established for human health [2]. Engineered bioremediation and natural attenuation (NA) processes permit CAH removal from contaminated groundwater directly in situ, which usually results in an environmentally friendly and cost-effective treatment with respect to conventional technologies such as pump-and-treat [3,4,5]. The engineered bioremediation consists of stimulating the microbial activity that is naturally present in the soil/groundwater matrix to remove pollutants through their metabolic activity [6]. The highly chlorinated CAHs can be removed by a reductive dechlorination (RD) reaction through sequential steps in which the chlorinated molecule loses a chlorine atom at each step until the complete dechlorination of the molecule [7]: For this reaction, the microorganisms usually need an electron donor such as hydrogen, which can be produced by fermenting organic substrates that provide for the slow release of hydrogen [8]. In terms of chlorinated ethenes, such as tetrachloroethene (PCE), the main limitation and risk of RD is represented by its last step, where vinyl chloride is transformed into ethylene, which usually is the most difficult step (only a few microorganisms are able to perform it); therefore, vinyl chloride is the most toxic intermediate of RD, with specific carcinogenetic activity for humans [9,10]. Indeed, due to the high electronegative character of chlorine, highly chlorinated compounds are more affected by RD, whereas the tendency for chlorinated compounds to be degraded by RD decreases with a decrease in the number of chlorine atoms: indeed, less chlorinated compounds such as cis-DCE and VC are more easily oxidized by microbial degradation. Several research works have reported on the capability of mixed dechlorinating aerobic cultures to oxidize cis-DCE and VC via cometabolic pathways that involve the presence of a substrate [11,12,13].
Thus, a sequential anaerobic/aerobic biodegradation approach has been proposed in the literature to overcome the disadvantages of incomplete RD and to promote the complete mineralization of chlorinated pollutants by adding an oxidative treatment of less chlorinated intermediates. The sequential stimulation of anaerobic/aerobic biodegradation has been applied in pilot tests by injecting electron donors and nutrients in an aquifer to stimulate anaerobic RD, while oxygen was provided through biosparging or direct water electrolysis [14,15]. However, some limitations and disadvantages need to be carefully considered, such as the possibility of decreasing aquifer quality as well as the precipitation of ferric iron and related clogging effects when oxygen is injected into an aquifer [16].
The reductive/oxidative environment can be easily created by using bioelectrochemical systems [17,18,19] and more precisely by using microbial electrolysis cells (MECs), which have been widely explored using a cathode as an electron donor for RD [20,21]: meanwhile, a counterelectrode, the anode, is used for the creation of an oxidizing environment. Several works have been conducted in two-chamber bench-scale reactors under continuous flow conditions [22,23], which have shown the effect of applied potential and the loading rate of TCE in the cathode compartment. Moreover, the oxidation of less chlorinated compounds has been shown using an aerobic mixed culture able to oxidize cis-DCE into CO2 by using ethylene as a cosubstrate: this research showed an increase in the oxidation rate of cis-DCE when an oxidizing potential able to obtain electrochemical oxygen evolution was used [24].
The first arrangement of sequential reductive/oxidative involved the use of graphite granules as electrode material for both reduction and oxidation processes [25,26]. Moreover, anodic oxidation performance was poor, and the study showed the scavenging effect of graphite, which strongly reduced oxygen evolution [27], resulting in a strong limitation of the oxidative microbial dechlorination of the less chlorinated CAHs. On the other hand, the study clearly showed the possibility of obtaining the complete removal of the contaminant by using an oxidizing step in which a rutile electrode allowed for in situ oxygen evolution in the anodic chamber, which was necessary for the cometabolic degradation of the VC. It was noteworthy that oxygen evolution in the anodic chamber could inhibit RD through its diffusion, and the presence of an ion exchange membrane not only allowed for electrical separation and ion transfer, but also limited oxygen diffusion; however, the use of an ion exchange membrane as a separator resulted in considerable investment costs, which strongly limited the scale-up of the process [28]. However, as mentioned above, the use of a graphite counterelectrode as a “sacrificial anode” permitted ion exchange membrane removal from the bioelectrochemical cell in favor of a cheaper separator that allowed for free diffusion of the electrolyte and avoided the cell shortcut. Moreover, the free diffusion of the electrolyte could limit the pH split phenomena, which promoted the acidification of the anolyte and the alkalization of the catholyte [29,30], which could cause biomass inhibition and a loss of energy due to overpotential establishment.
In this study, the first scale-up of a reductive/oxidative bioelectrochemical process is presented with an innovative tubular configuration of the reactors, which adopted a membrane-less configuration where no ion exchange membranes were used for the separation of electrode compartments. The sequential reductive/oxidative bioelectrochemical process was then realized through the separation of the two dechlorinating steps into two different tubular MECs, each one equipped with a working electrode and its own counterelectrode. In this way, the two reactors were completely independent of each other, so that the potential of the working electrode could be independently selected and optimized, as were the fluid dynamic parameters concerning the bioelectrochemical dechlorinating reactions. The reductive reactor and the oxidative reactor were hydraulically connected in a series, where the effluent from the first reductive step was used to feed the following oxidative step of the process.
2. Materials and Methods
2.1. Sequential Process Setup
The sequential system consisted of two tubular reactors, i.e., the reductive and the oxidative reactor.
The reductive reactor was a 105-cm-high column with a diameter of 10 cm, giving an empty volume of 8.24 L. The tubular MEC was equipped with several side ports that allowed for the insertion of the current collectors and the reference electrode (Ag/AgCl in saturated solution of KCl). The counterelectrode of the reductive reactor consisted of a concentric tube filled with graphite granules enveloped by a double layer of a grid in plastic material and a permeable textile membrane that avoided the shortcut of the circuit and allowed for electrolyte migration: the membrane was constituted by a multifiber layer of HDPE (high-density polyethylene), also known as textile nontextile membrane. The counterelectrode contained a 30 cm graphite rod connected to a titanium wire as a current collector: the length and the diameter of the counterelectrode were 85 cm and 5 cm, respectively, giving a volume of 1.7 L.
The oxidative reactor consisted of a tubular glass reactor with a length of 40 cm and a diameter of 10 cm, and the empty volume was 3.14 L. Three side ports allowed for the insertion of the current collectors of the working and counterelectrode as well as the insertion of the Ag/AgCl reference electrode. The counterelectrode volume was 0.18 L, and it was constituted by a graphite granule tubular envelopment. The working electrode included three pieces of rutile-type mesh electrode connected by a titanium wire and inserted into a silica bed, which permitted biofilm formation on the dechlorinating microorganisms.
The two reductive and oxidative reactors were separately polarized using an AMEL 549 model potentiostat that allowed for control over the respective working electrodes through the utilization of a three-electrode configuration. The reductive and the oxidative reactors (Figure 1) were hydraulically connected in a series and fed with the same peristaltic pump: The synthetic contaminated medium was fed to the bottom of the reductive reactor, while the outlet flow from the top of the reductive reactor was fed to the bottom of the oxidative reactor. Three different 50 mL sampling cells allowed for the characterization of the CAH concentrations through headspace sampling: The sampling cells were located at the inlet and outlet of the reductive reactor and at the outlet of the oxidative reactor.
The influent solution was a mineral medium composed of 1 g/L NaCl, 0.5 g/L MgCl2·6H2O, 0.2 g/L KH2PO4, 0.3 g/L NH4Cl, 0.3 g/L KCl, 0.015 g/L CaCl2·2H2O, 0.05 g/L Na2S, 2.5 g/L NaHCO3 [31], 1 mL/L metal solution [32], and 10 mL/L vitamin solution [33]: The mineral medium was then contaminated with PCE to obtain a theoretical concentration of 100 μM. The influent and the effluent solutions were collected into Tedlar bags® (Supelco, Cerritos, CA, USA), which consisted of a self-collapsing bag that permitted the quantification of liquid and gaseous flow rates.
2.2. Tracer Test
A tracer test was conducted using a KCl 0.02-M solution as a conservative tracer (performed with a flow rate of 30 L/d), and the conductivity of the outlet of the reactor was continuously monitored by a conductometer Handylab® 330 (SI-analytics, Weilheim, Germany). The conductivity of the outlet solution was utilized to build an F-curve according to the following equations, and the first derivate method was then used for the flex point of the F-curve determination, which represented the experimental hydraulic retention time (HRT). The plug flow reactor (PFR) and the continuous stirred tank reactor theoretical curves were also reported together with the F-curve to graphically show the fluid dynamic behavior of the reactors.
2.3. Cyclic Voltammetry
Cyclic voltammetry was performed using a Biologic SP-300 potentiostat (Biologic, Seyssinet-Pariset, France) that allowed for the automatic acquisition of the curves, where both of the reactors were investigated with the following voltage scan rates: 10–1–0.65–0.3–0.08 mV/s. The potential range investigated for the electrode reaction in the reductive reactor was from 0 to −1.1 V versus SHE, using the cathode as a working electrode, while the oxidative reactor electrode reaction was investigated in the range +1 to +2 V versus SHE, using the anode as a working electrode. For each scan performed, the mineral medium was recirculated with a flow rate of 21 L/d in order to maintain good mixing of the electrolyte, and two cycles of each curve were performed.
2.4. Analytical Methods
The CAHs and the ethylene, ethane, and methane were detected using a Dani Master Gas chromatograph equipped with a flame ionization detector (FID). The reactors’ headspace was analyzed by a DANI master gas chromatograph (GC) equipped with a thermal conductivity detector (TCD) (DANI Instruments, Contone, Switzerland) to determinate the H2, O2, and CO2 concentrations. The aqueous-phase concentrations were calculated by converting the headspace gaseous concentrations using tabulated Henry’s law constants under liquid–gas equilibrium condition assumptions [34]. The compound concentration was reported as the total amount (e.g., in moles) with respect to the volume of the liquid phase, which represented the “nominal” concentrations.
2.5. Calculations
The average rate and coulombic efficiency of RD in the reductive reactor were evaluated according to the following equations:
where Q is the liquid flow rate, F is the Faraday constant (96,485 C/mol), and s/d represents the 86,400 s in a day. The nominal concentrations of the reductive dechlorination products are expressed in mM, while 2, 4, 6, and 8 are the numbers of moles of electrons required for the respective formation of RD intermediates from 1 mol of PCE. The coulombic efficiency of the reductive dechlorination (CE(RD)) represents the amount of electricity utilized for the dechlorination reaction. With the same approach, and in accordance with the literature [35,36], the coulombic efficiency for methane production was evaluated within the reductive reactor by evaluating the methane production rate and transforming it into a current according to the following equation:
in which F is the outlet gaseous flow rate expressed as L/d, 8 is the number of electrons consumed to reduce 1 mol of CO2 into CH4, F is the Faraday constant, and s/d represents the 86,400 s in a day. Equation (4) is
RD (mA) = Q (L/d) × (2 × [TCE]+ 4 × [cis-DCE]+ 6 × [VC] + 8 × [Eth]) + F/s/d
CE (RD)% = RD (mA)/Current (mA) × 100
CH4 (mA) = F (L/d) × 8 [CH4] × F/s/d
CO2 + H+ + 8e− → CH4 +2 H2O
The methane coulombic efficiency was then calculated as the ratio of the produced methane to the average current flowing in the circuit:
CE (CH4)% = CH4 (mA)/Current (mA) × 100
In the oxidative reactor, the oxidation rate for the chlorinated compounds was evaluated by considering the stoichiometry of the VC and ethylene complete oxidation:
in which 2.5 and 3 mol of O2 are required for VC and ethylene oxidation, respectively. Considering the water oxidation reaction.
in which 4 electrons are produced for each mole of oxygen produced, considering a complete conversion of the oxidation current into oxygen, the coulombic efficiency for the oxidative reactor can be expressed as:
C2H3Cl + 2.5 O2 → 2CO2 + H2O + HCl
C2H4 + 3O2 → 2CO2 + 2H2O
2H2O → O2 + 4H+ + 4e−
CE (ox)% = (VC removal × 2.5 + Eth removal × 3)/(Oxidative current (O2)) × 100
Energy consumption was evaluated by considering the amount of applied energy in a day (expressed as kWh/d), which was calculated by the product of the average current and the average cell voltage for both the reduction and oxidation reactors (according to the following expression):
kWh/d = [I (mA) × ΔV (V)reduction] + [I (mA) × ΔV (V)]oxidation]
Moreover, the energetic cost for m3 of treated groundwater was evaluated by dividing the energy consumption by the flow rate (expressed as m3/d).
2.6. Chemicals
The analytical standard and feed solutions were prepared with chemicals of analytical grade. In particular, CAHs, ethylene, and methane were purchased from Sigma-Aldrich (Milano, Italy).
3. Results
3.1. Preliminary Fluid Dynamics and Electrochemical Characterization of the Tubular Reactors
After the setup of the two tubular reactors, a tracer test was utilized to characterize their fluid dynamic behavior and to assess the effect of the internal counterelectrode on the flow path of fluid particles. Figure 2 reports the F-curves obtained for the reductive (Figure 2A) and oxidative reactor (Figure 2B). Both tests clearly show the typical profile of a plug flow reactor (PFR) with a dispersion effect that slightly deviates from the ideal PFR profile.
By using the porosity of the packing materials utilized in the reductive and oxidative reactors, i.e., the graphite granules (porosity 0.5) and the silica (porosity 0.4), the effective empty volume of the two reactors was evaluated and divided by the influent flow rate to obtain the theoretical HRT values, either including or excluding the volume of the respective counterelectrode. Then the experimental HRTs obtained by the tracer test were compared to the theoretical HRTs obtained for each reactor under the two above-reported hypotheses. Table 1 reports the results for both the reductive and oxidative reactors: the experimental HRT of 3.3 h (determined by the tracer test in the reductive reactor) was almost identical to the HRT of the reductive reactor’s overall volume (i.e., including the counterelectrode), meaning that the counterelectrode was fully crossed by the fluid particles without any distinction between the two compartments. On the other hand, the tracer test of the oxidative reactor resulted in an experimental HRT of 0.7 h, which was a value similar to the HRT of the working electrode only; in other words, in the case of the oxidative reactor, the experimental HRT clearly showed that the counterelectrode was only partially crossed by the fluid particles. The last difference probably was a direct effect of the different packing materials utilized for the working and counterelectrode in the oxidative reactor, i.e., a lower porosity in the silica beds can provide for an increase in the linear velocity of the particles and the partial exclusion of the counterelectrode with respect to fluid particle movement.
After the tracer test, the two reactors were filled with the mineral medium, and cyclic voltammetry experiments were then performed adopting different scan rates for the two reactors. The voltage scan rates were in the range from 10 to 0.08 mV/s. The utilization of very low voltage scan rates derived from the necessity to minimize the transient disturbances caused by the capacitive current of the high surface electrode, i.e., the nonfaradic current deriving from the charge–discharge process of the capacitive layer of the electrode surface [37,38]. The reductive reactor cyclic voltammetry tests were conducted by polarizing the cathodic chamber from 0 to −1.1 V versus SHE, while for the oxidative reactor, the potential range of the rutile-type anodic electrode was from +1 to +2 V versus SHE. In Figure 3A, the reductive reactor cyclic voltammetry values are reported, where the curve shapes clearly show the absence of any active redox sites in the potential range explored: the current increase in the range of −0.8–1.0 V versus SHE was a typical representation of the evolution of H2 from proton reduction (which was the only reduced product from the cathodic process). In Figure 3B, the oxidative reactor’s cyclic voltammetry shows an asymptotic increase in current due to oxygen evolution starting from the potential of +1.2 V versus SHE, without any other redox site in the explored range of potentials. The main effect of the scan rate on the cyclic voltammetry shape was clearly that with a slow voltage scan rate, the diffusion layer, which is the layer for the diffusion of electroactive species from the bulk to the electrode surface, was thicker and generated a lower current in comparison to a fast scan rate, which on the contrary, generated smaller diffusion layers and higher currents [39]. Moreover, the effect of the voltage scan rate was more evident in the reductive reactor’s cyclic voltammetry compared to the oxidative reactor’s cyclic voltammetry: this effect could be explained by the strong difference in terms of specific surface area, which was much higher for the cathodic chamber of the reductive electrode.
3.2. Reactor Inoculation
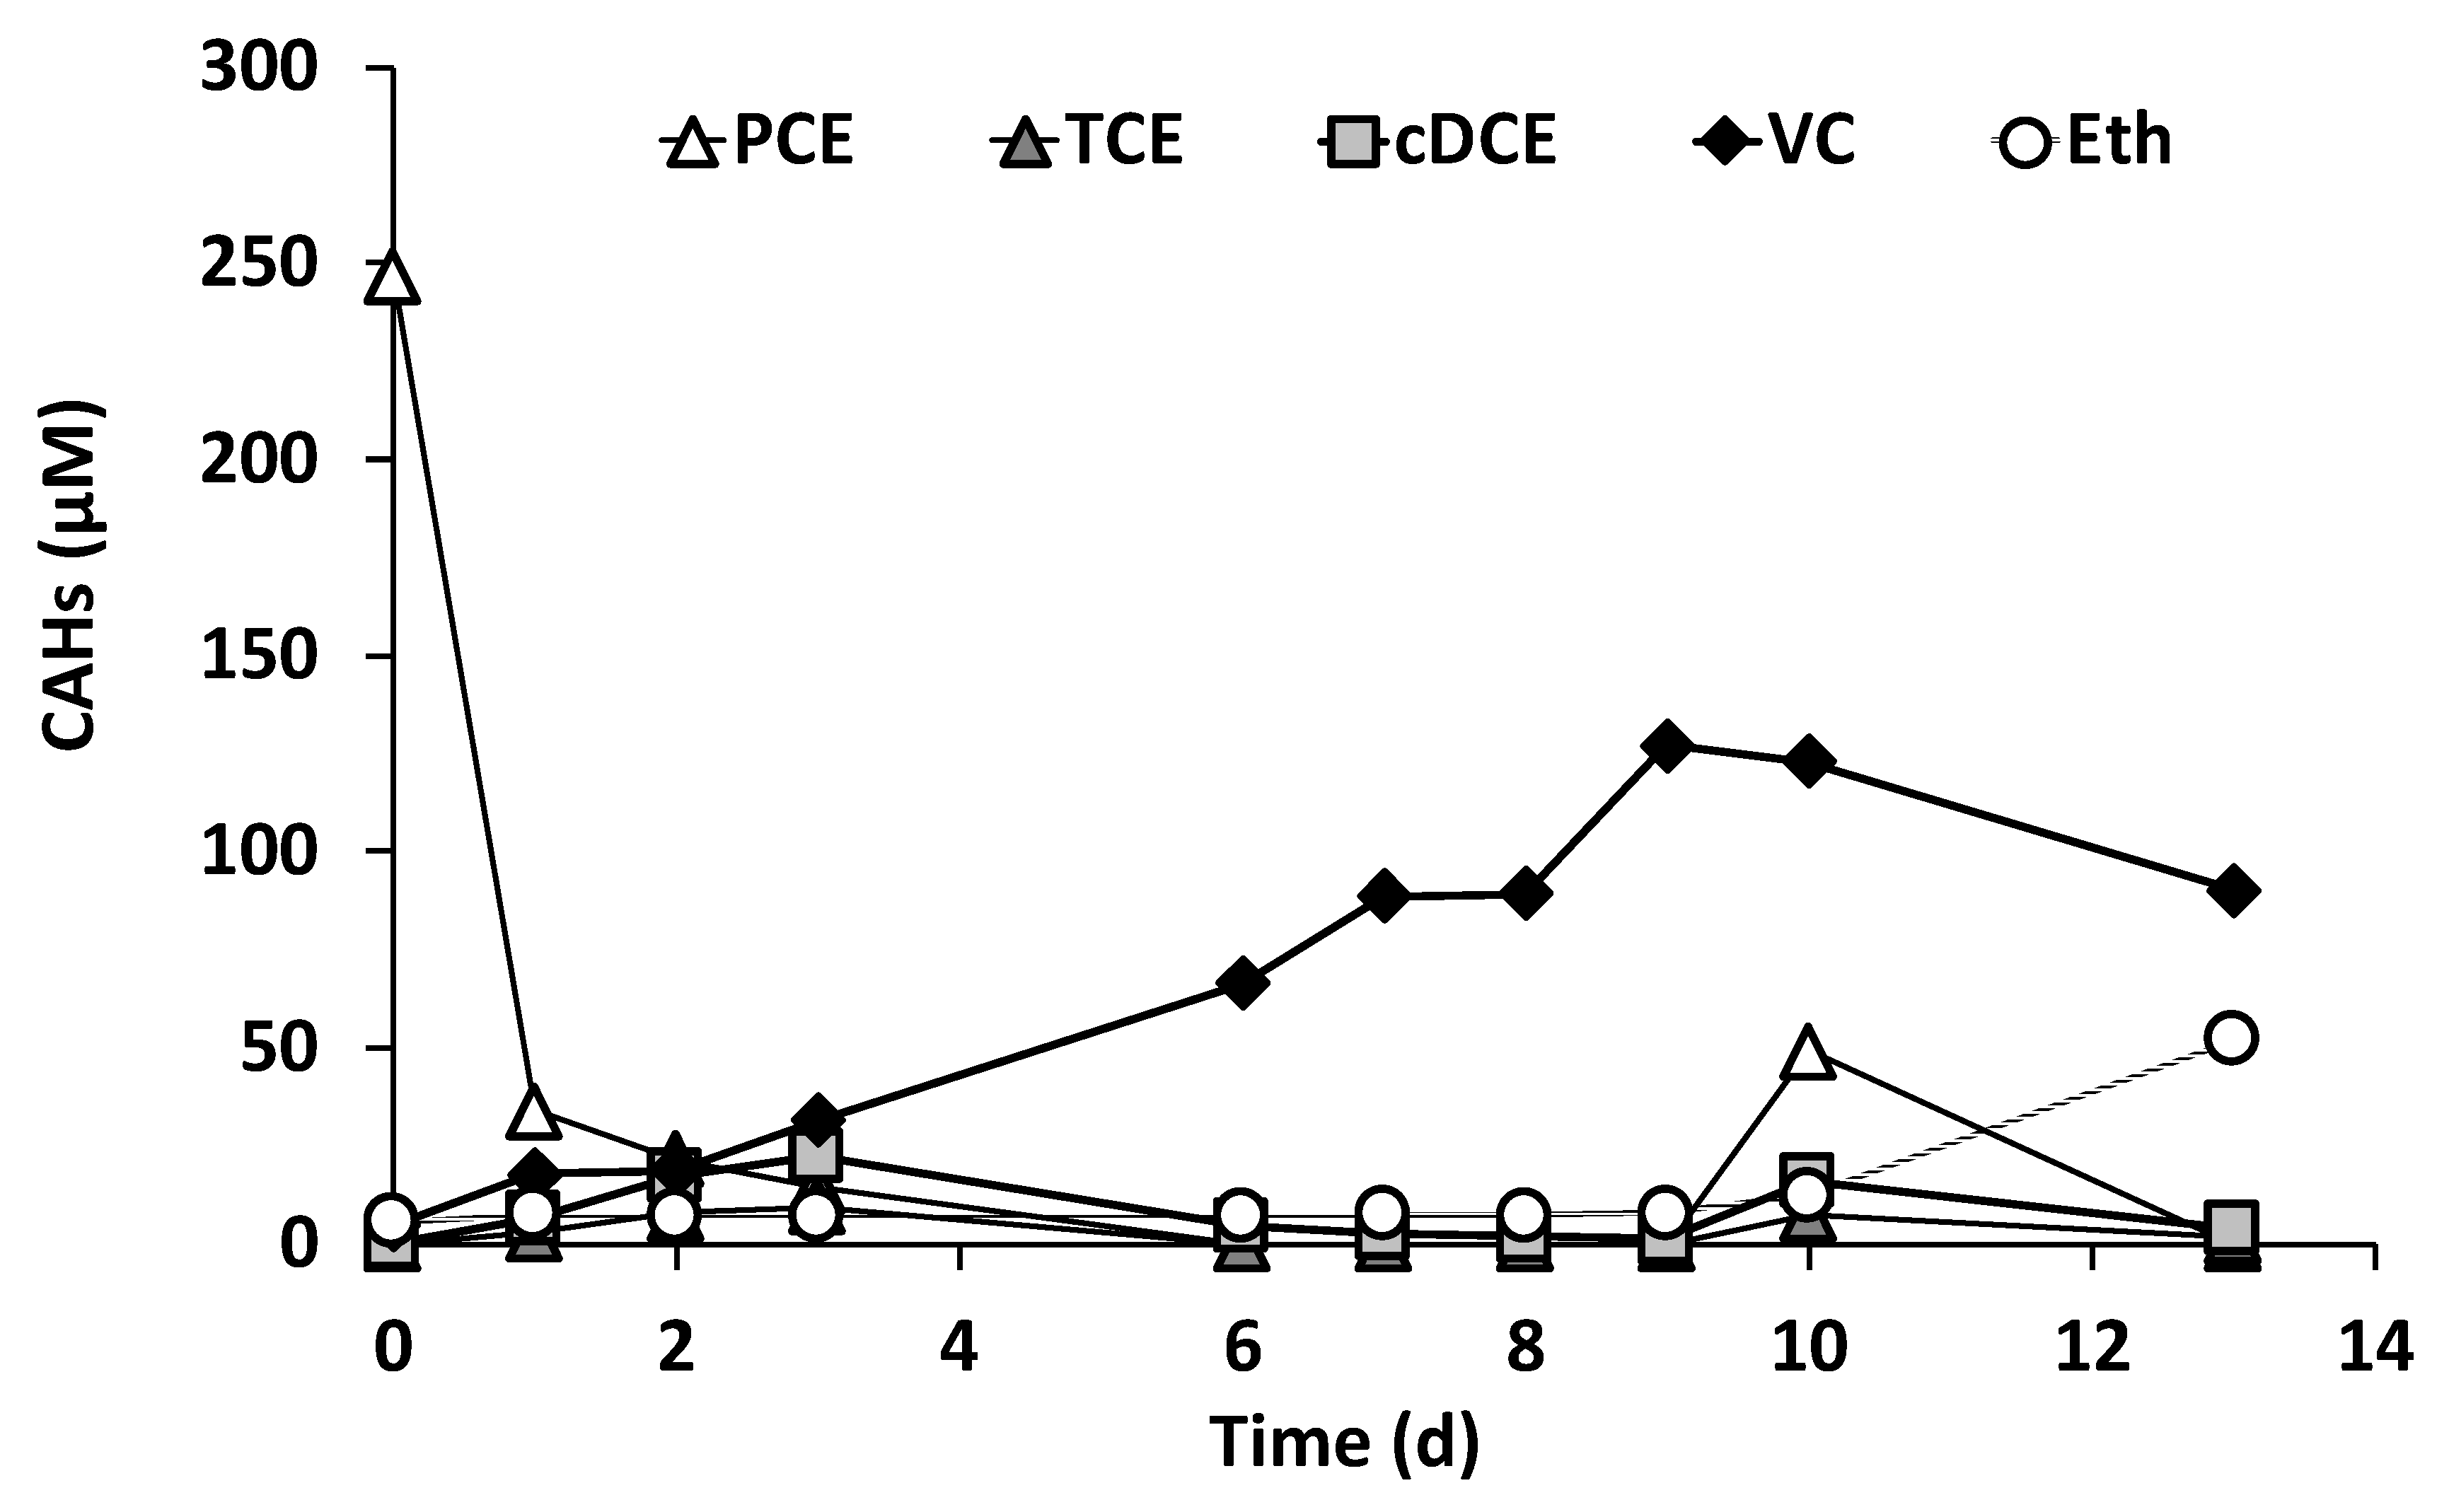
The reductive reactor was inoculated with 1.2 L of an anaerobic dechlorinating culture that used lactate as a reducing power source, and it was maintained under recirculation for 13 days in the presence of PCE as a substrate, while lactate was added to sustain the biofilm growth on the graphite granules. During this startup phase, the column was not polarized. During the 13 days of batch operation of the reductive reactor, the time course of the RD products was monitored in the recycle flow (Figure 4), which showed microbial dechlorinating activity that was responsible for PCE degradation into less chlorinated intermediates such as VC and cis-DCE, with a final predominance of VC and ethylene after 13 days of batch recirculation.
The oxidative reactor was inoculated with a similar approach, in which the inoculation of 1 L of aerobic dechlorinating microorganisms was followed by a recirculation of the liquid phase for 7 days using a synthetic medium containing cis-DCE and ethylene in order to stimulate biofilm growth on the silica beds that constituted the physical support (data not shown).
3.3. Continuous Flow Operation of the Sequential Oxidative/Reductive Process
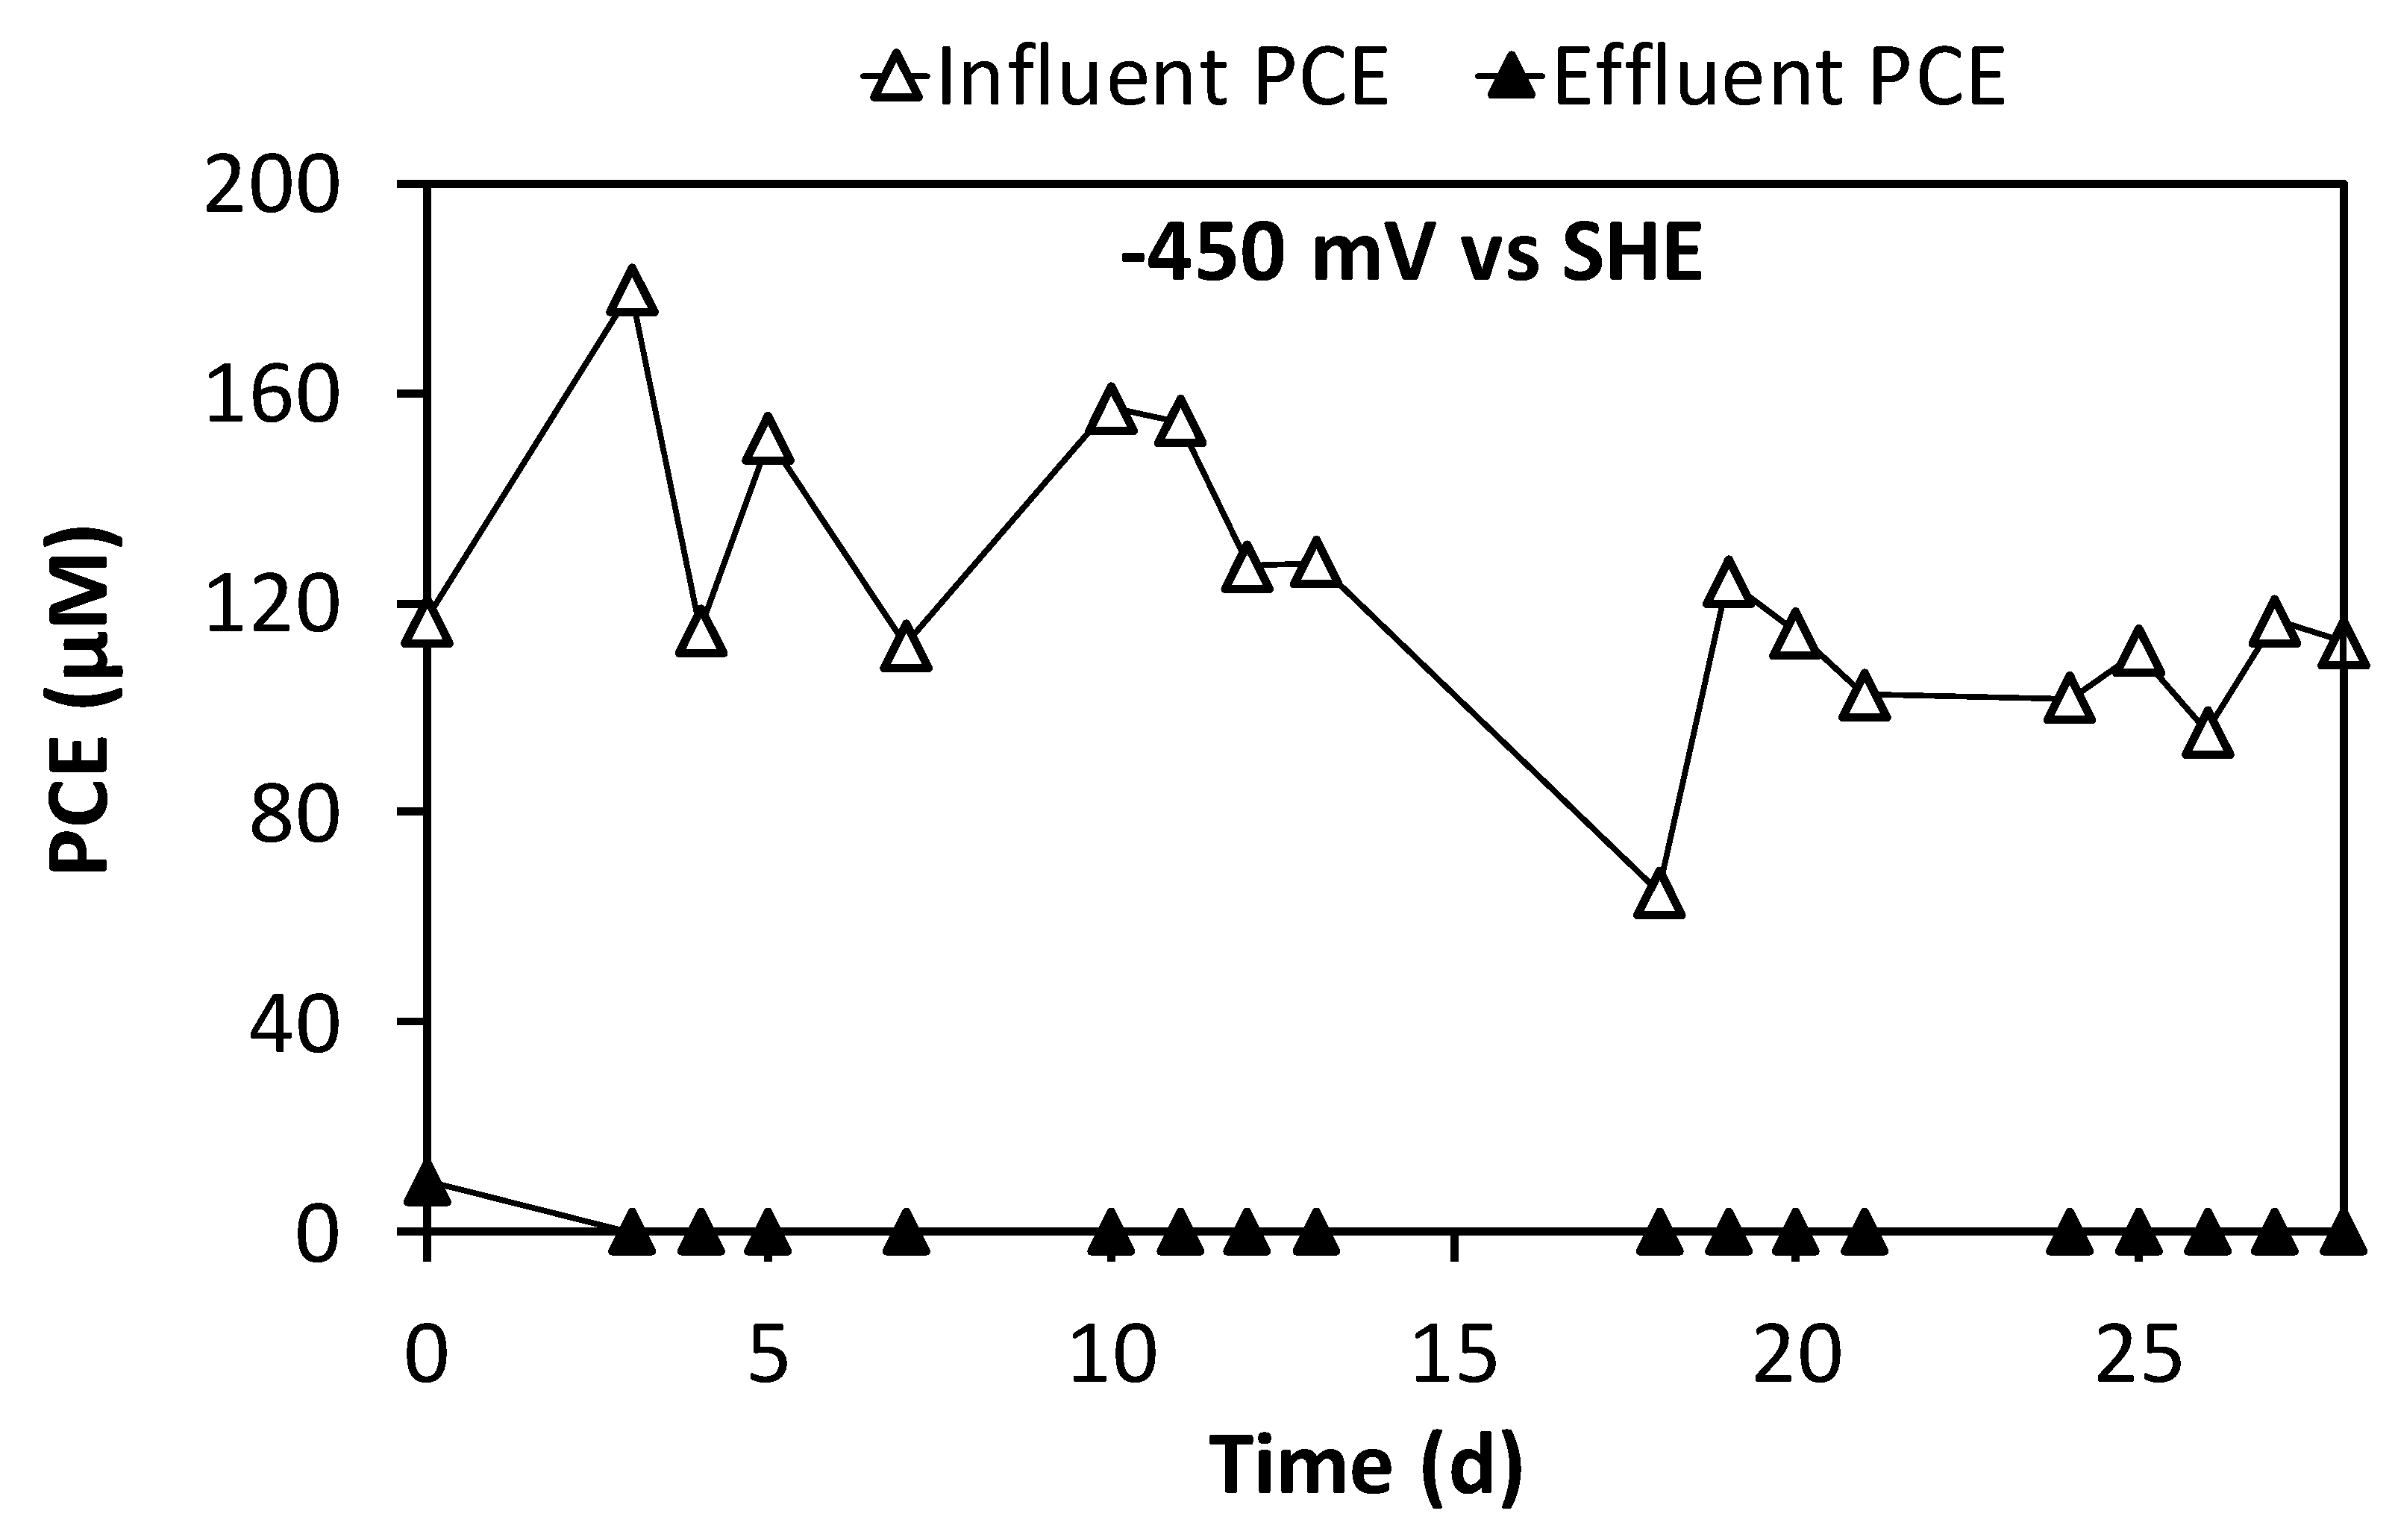
After the inoculation of the two tubular reactors, the sequential reductive/oxidative process was operated with an average flow rate of 1.58 ± 0.03 L/d, which corresponded to an HRT of 5.6 days for the reductive reactor (based on its empty volume) and 2 days for the oxidative reactor. The operating potential utilized in the reductive reactor was −450 mV versus SHE, which was not a strong reductive condition but enough reductive for the production of a small amount of hydrogen to sustain the reductive dechlorination. During the continuous run at −450 mV versus SHE, the electrical output of the reductive reactor resulted in −10.1 ± 0.5 mA, with an average potential difference of −1.62 ± 0.01 V, while the counterelectrode potential was +1.17 ± 0.01 V versus SHE. In the reductive reactor outlet, the PCE was completely removed, as shown in Figure 5, with an average rate of 191 ± 13 μmol/d, which corresponded to a removal efficiency of 100% ± 1%.
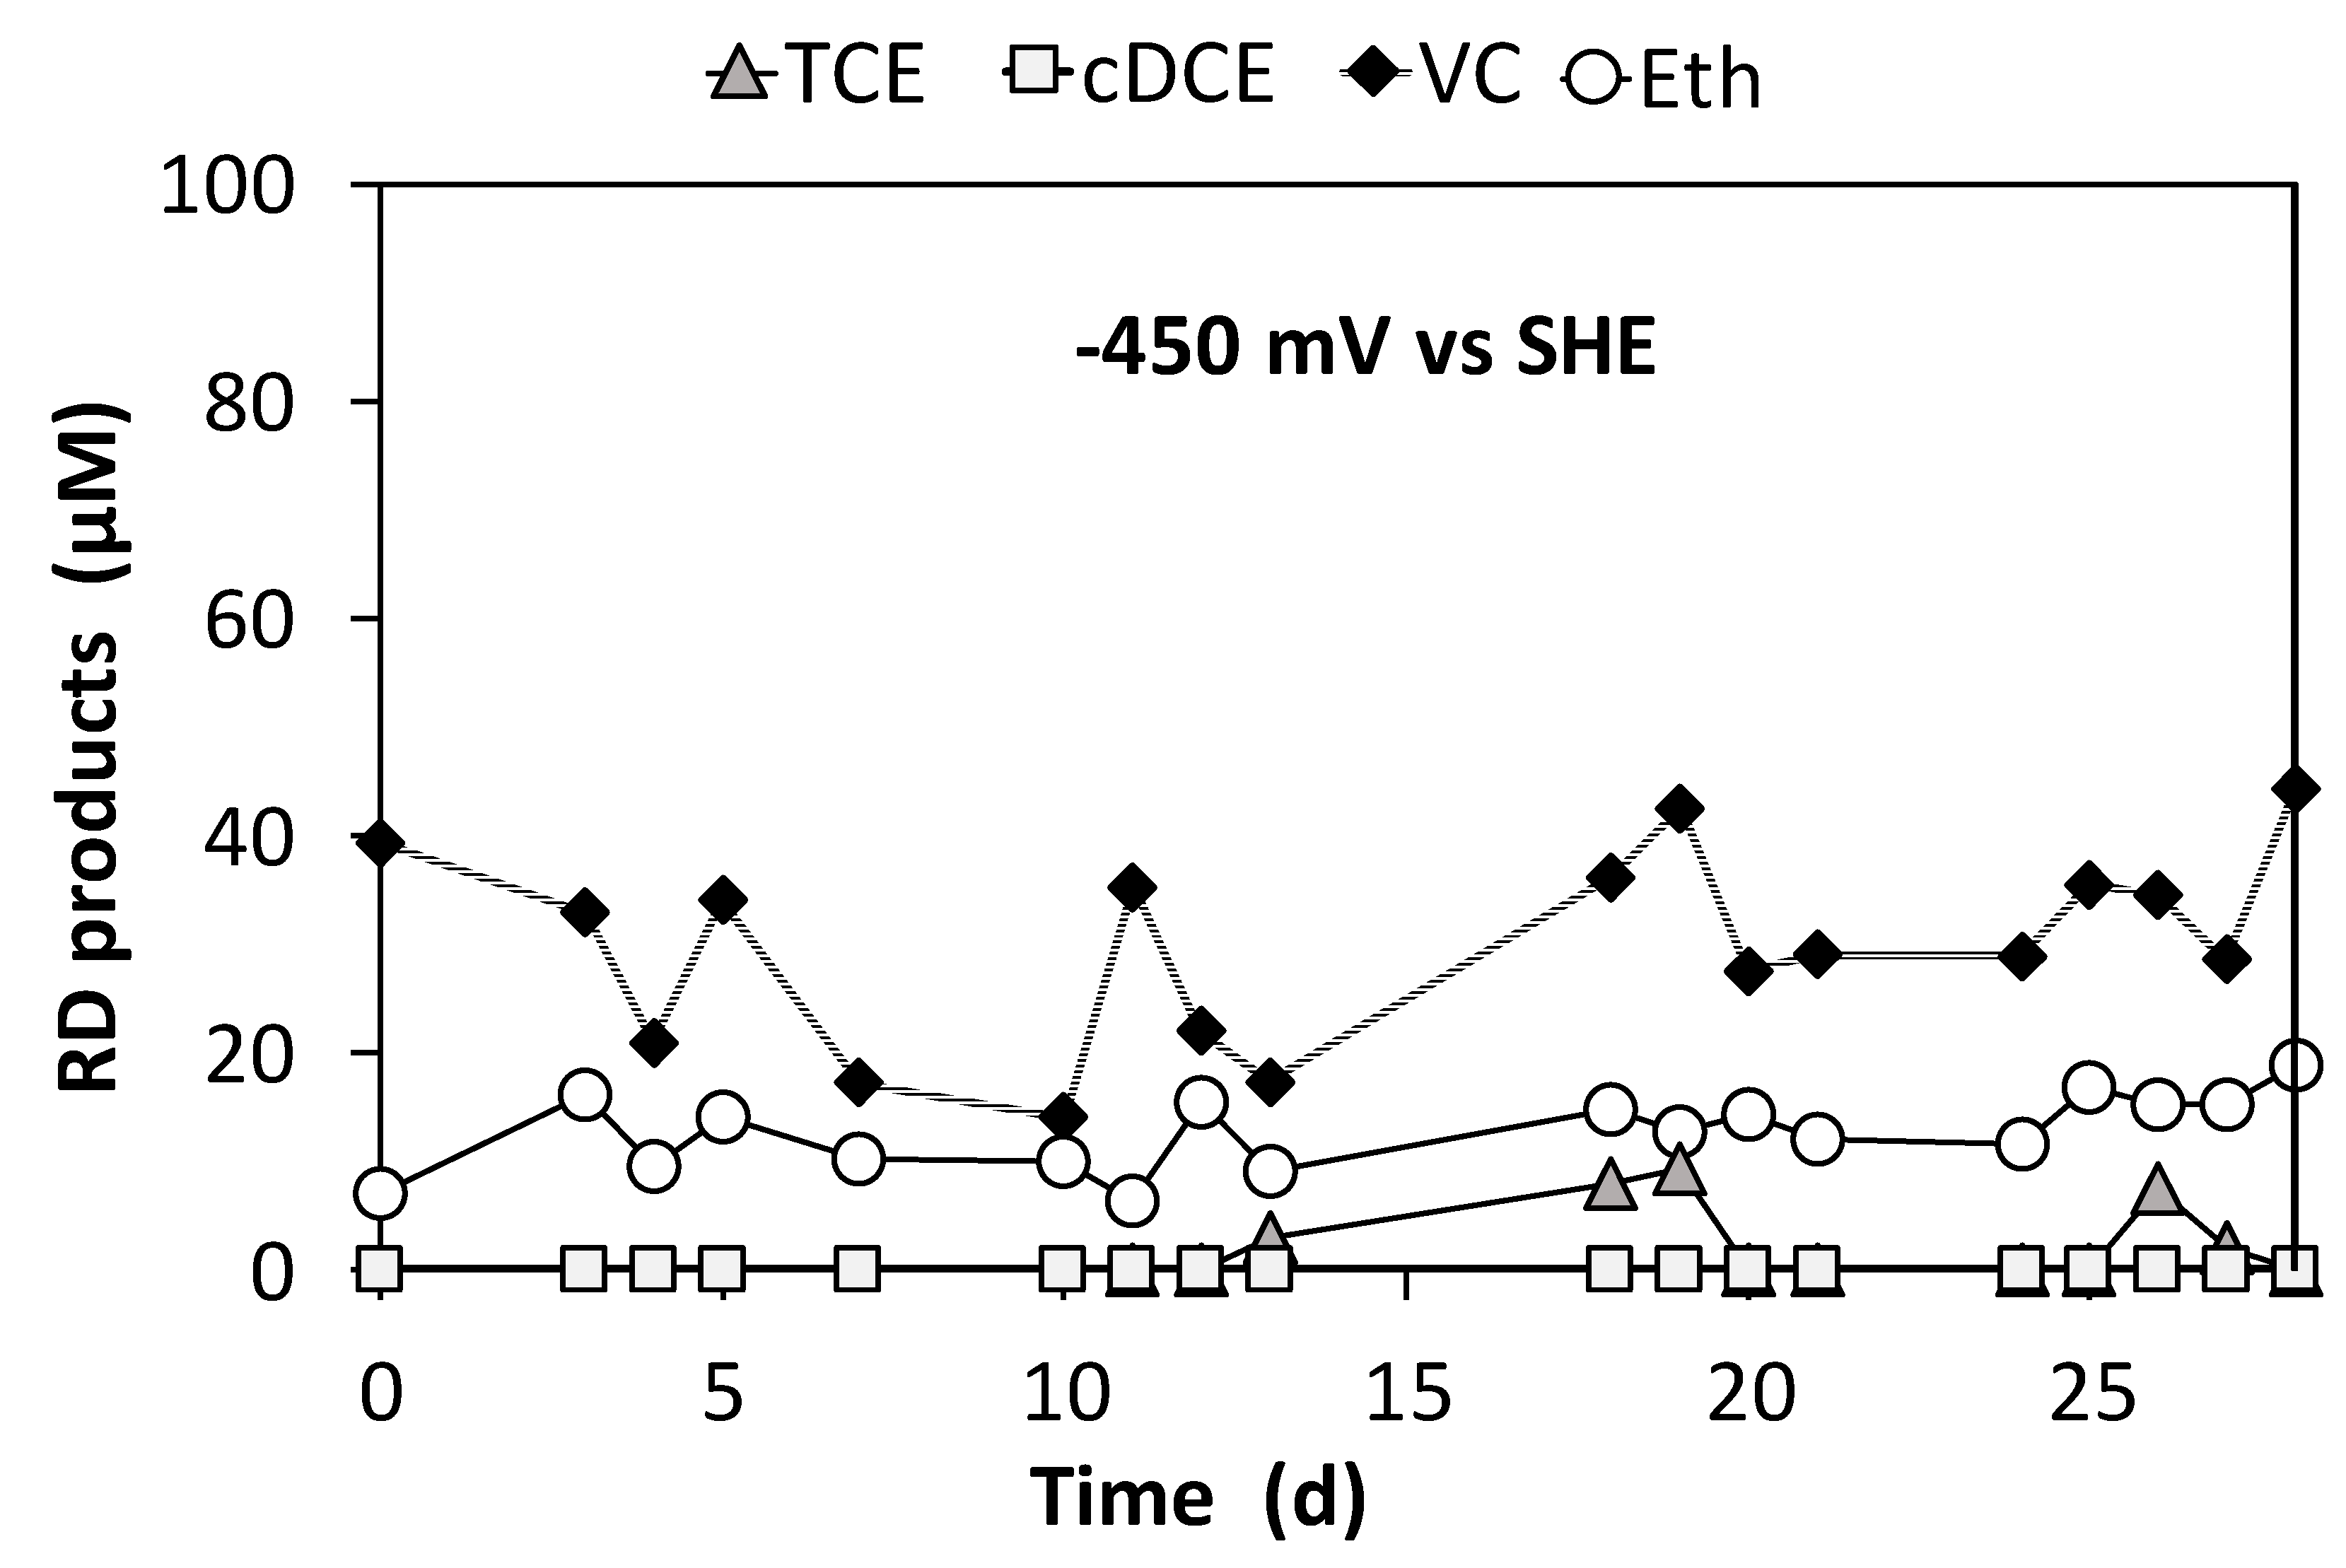
During the run, neither TCE nor cis-DCE were detected, while only vinyl chloride and ethylene were present as daughter products of the PCE reduction, with an average concentration of 30 ± 2 and 13 ± 1 μmol/L, respectively (Figure 6).
The reductive dechlorination products accounted for coulombic efficiency, i.e., the amount of electricity consumed by microorganisms in the reductive dechlorination reaction, of 5% ± 1% on average, while the methane produced (resulting from the other reduction mechanism catalyzed by electroactive methanogens [40,41]) accounted for 22% ± 4% of the current (methane coulombic efficiency). Hence, the global recovery of the current reached 27% ± 4%, which means that a high amount of current was probably lost in parasitic reactions in the reductive reactor, such as in the hydrogen shortcut between the cathode and the anode or in the presence of bioelectrochemical oxidation of the ammonium nitrogen and the sulfide present in the mineral medium. In more detail, in the inner counterelectrode part of the reductive reactor, both ammonium nitrogen and sulfide could be bioelectrochemically oxidized into nitrate and elemental sulfur, respectively, as has been reported in the literature [42,43,44]. Even though the anion determination did not show the presence of nitrate or sulfide removal, the presence of bioelectrochemical oxidation cannot be excluded due to the possibility of an oxidation/reduction electron loop; therefore, the contribution of each mechanism could not be quantified in the electron balance of the process.
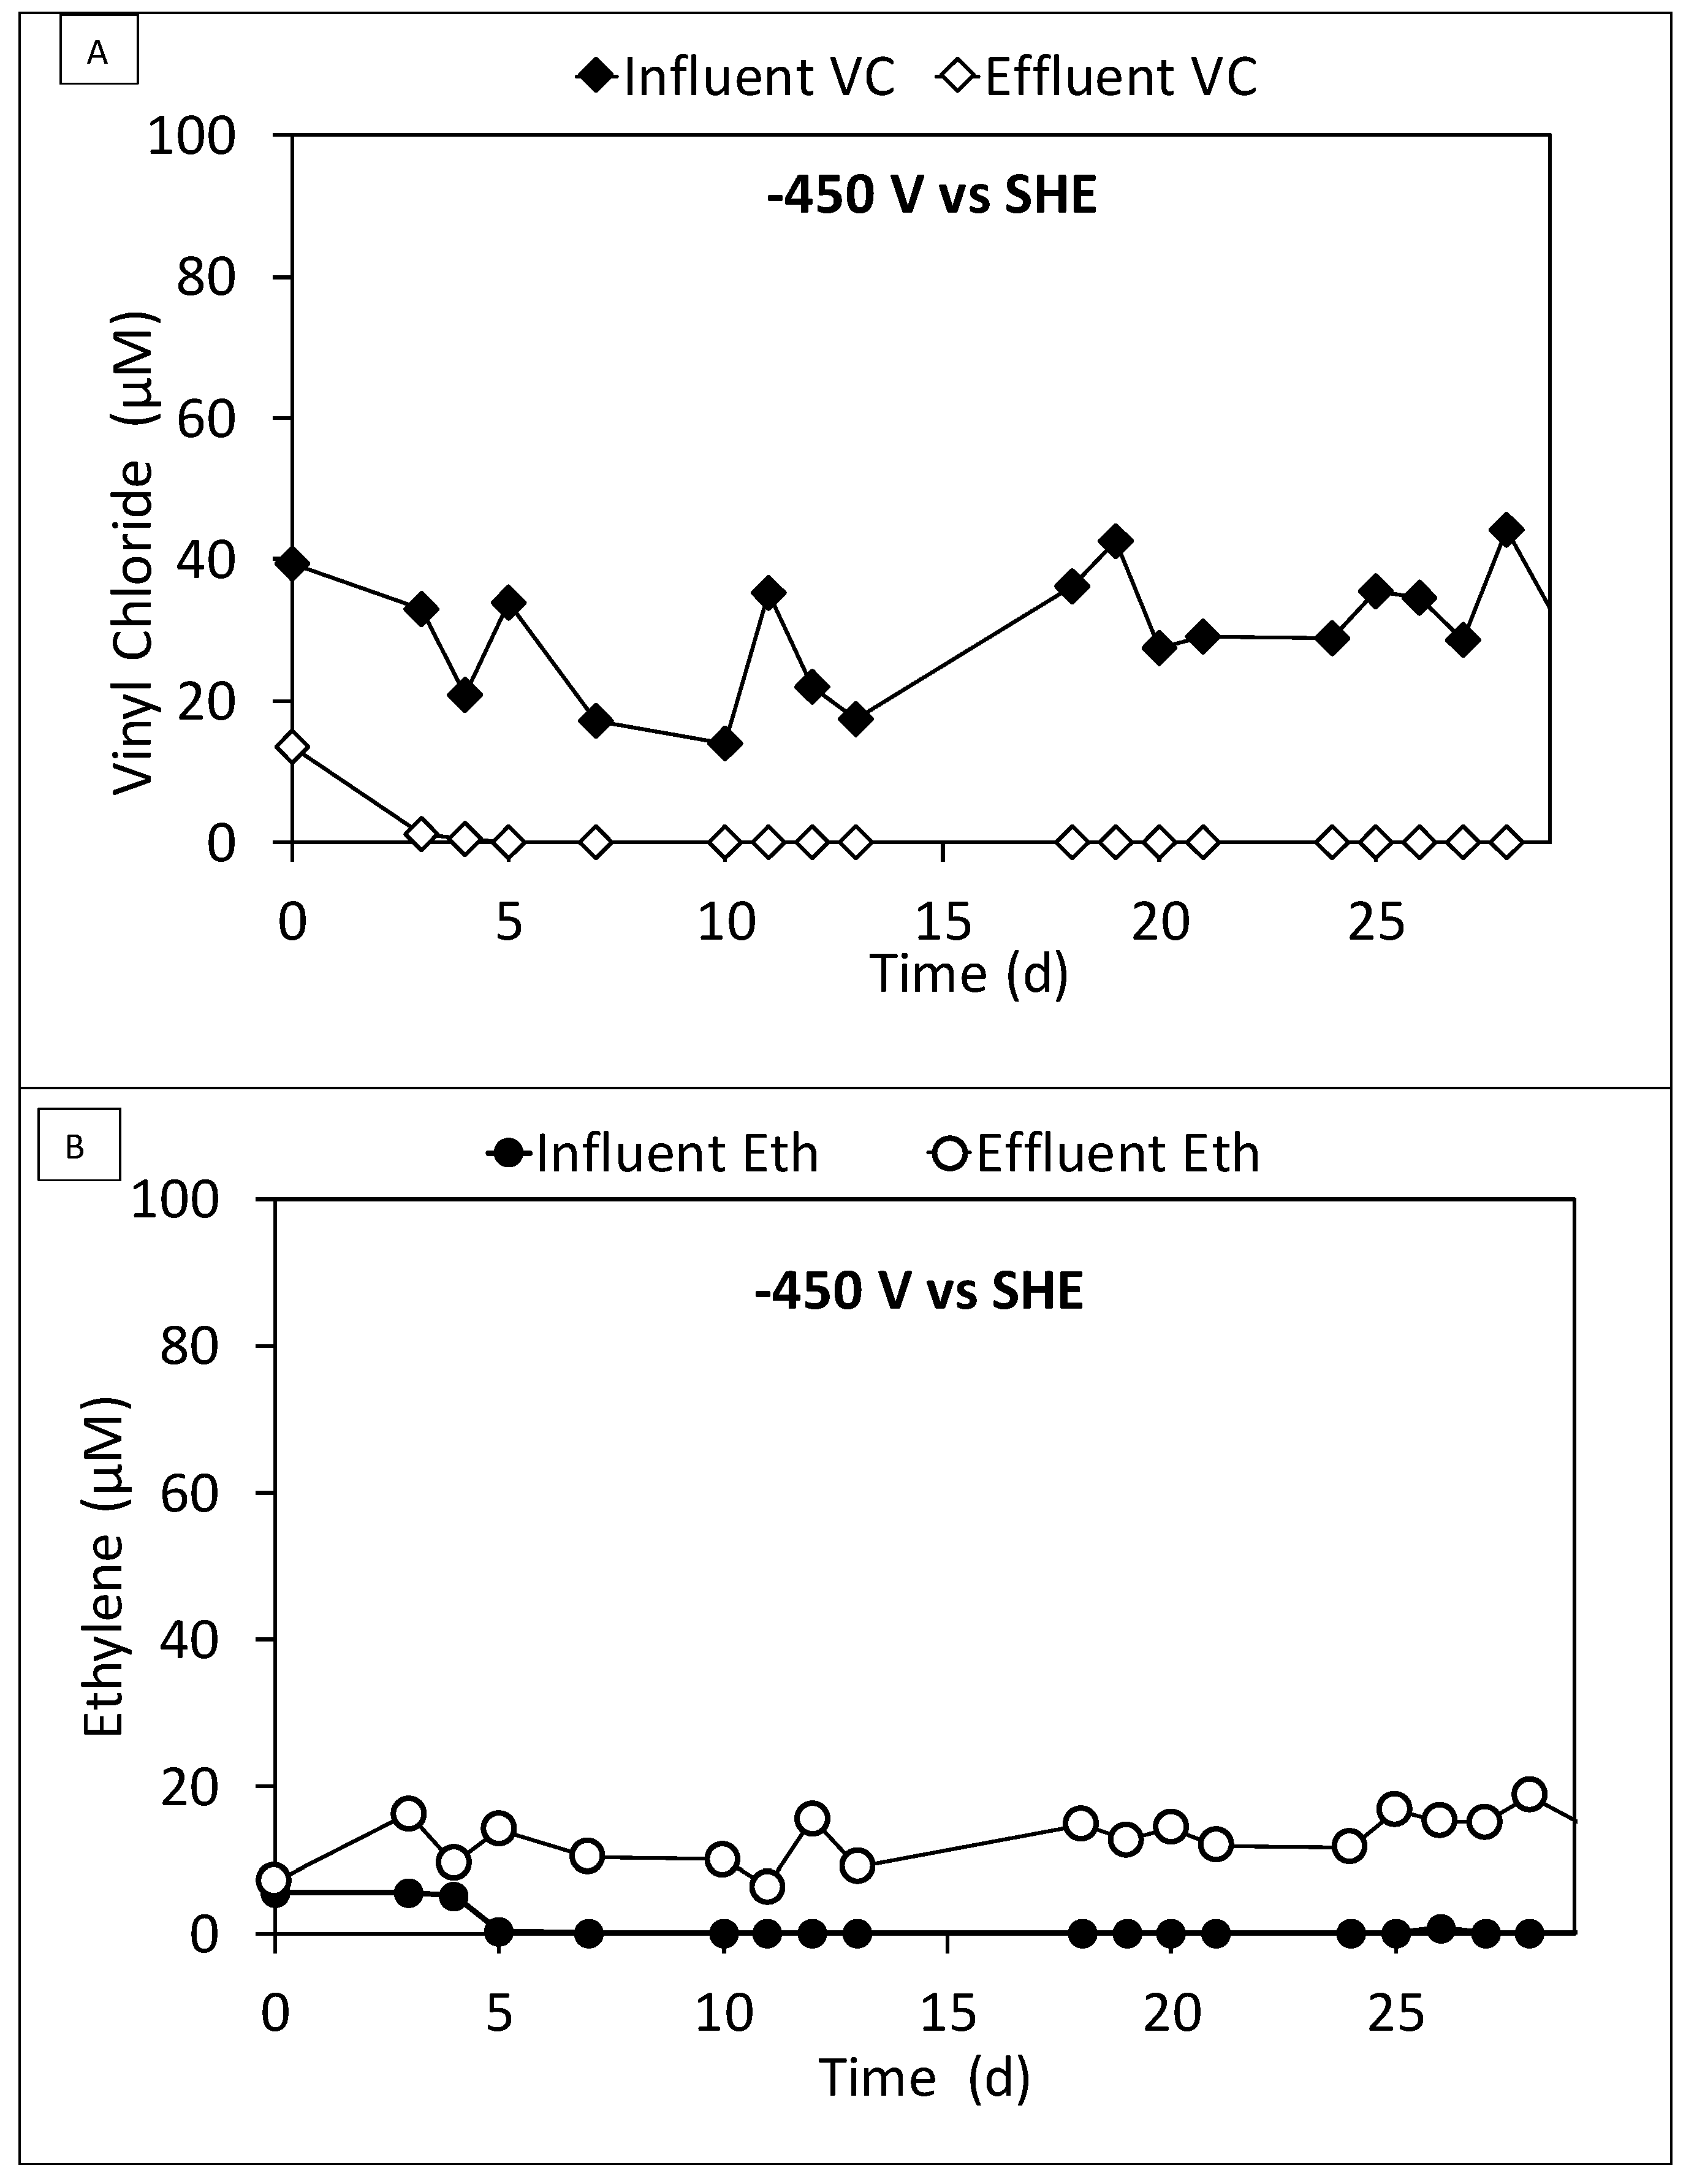
As described above, the outlet from the reductive reactor constituted the influent of the oxidative reactor, which was operated by keeping the anode (i.e., the working electrode) polarized at +1.4 V versus SHE. On the basis of voltammetry, this potential was chosen in order to ensure the O2 production necessary for the oxidative dechlorination pathway [24]. Figure 7 shows the complete removal of the VC (Figure 7A) and ethylene (Figure 7B) through the oxidative step (below the instrumental detection limit).
As is reported in Figure 7, the oxidative reactor performed an average removal efficiency of 100% ± 2% for the VC (Figure 7A) and 92% ± 5% (Figure 7B) for the ethylene; moreover, the methane was also removed in the oxidative rector with an average removal efficiency of 43% ± 4%. By taking into account the average current flowing in the oxidative reactor (11.3 ± 0.9 mA) and the stoichiometry of the oxidative reactions, the coulombic efficiency for the VC and ethylene oxidation accounted for 5% ± 1% and 2% ± 1% of the current, respectively, while the methane removal allowed for a coulombic efficiency of 8% ± 1%. Moreover, methane can also be used as a substrate for the cometabolic oxidation of less chlorinated compounds [12]; thus, methane production in a reductive reactor, which usually is the main competitive mechanism in a reductive dechlorination reaction [22], can positively affect the oxidative step of dechlorination by increasing the substrate availability of the aerobic biomass [45].
All of the main parameters for the reductive and oxidative reactors are reported in Table 2, which summarizes the main results of the sequential process for the −450 mV versus SHE run.
In terms of mass balance, the ethane-backbone daughter products were compared to the influent PCE in the reductive reactor: the mass balance (expressed as reducing products) detected with respect to the influent PCE removed in the reactor was on average only 36%, which indicated a large amount of lost PCE. A possible explanation for the PCE losses could be, in part, an overestimation of the influent PCE concentration due to its extremely low solubility in the medium, which resulted in 192 mg/L [46]. Another possible mechanism that was difficult to estimate was the possible degradation of less chlorinated compounds in the counterelectrode of the reductive column, which could have been due to the possible presence of dechlorinating oxidizing microorganisms. The latter mechanism, in which the oxidative environment of the counterelectrode could promote the selection of oxidizing dechlorinating microorganisms, could also have been sustained by the value of the counterelectrode potential (+1.13 V versus SHE), which in turn was sufficient for oxygen evolution even if the daily analysis of the gaseous phase did not show any oxygen production during the −450 mV versus SHE run. In this sense, the oxygen scavenging effect of graphite, which has been revealed in previous research [26], might be insufficient to hinder oxygen formation in the anodic counterelectrode.
The amount of energy consumed by the whole process was assessed in accordance with the average current and the average potential difference utilized for the continuous run of the sequential dechlorination process: the overall energy consumption was 0.09 kWh/m3 of reactor, which resulted in an energetic cost of 0.62 kWh/m3 of treated water, a considerably low energy consumption that can be converted into an average cost of 0.12 euro/m3 of treated water by using the current electricity cost for industrial applications in Italy.
4. Conclusions
The innovative reactor configurations permitted an effective sequential reductive/oxidative bioelectrochemical process that permitted the complete mineralization of perchloroethylene into nonharmful compounds, driving microbial dechlorinating metabolism through the use of electric currents. The new reactor configuration (with an internal counterelectrode) avoids the use of ion exchange membranes as a separator, resulting in a cost-effective and versatile process. The sequential bioelectrochemical reductive/oxidative process was able to perform the complete mineralization of PCE, which was completely removed in the first reductive step with a removal efficiency of 100% ± 1%, while vinyl chloride, the main reduction product along with ethylene from the first reductive step, was successfully removed in the oxidative reactor with a removal efficiency of 100% ± 2%. The coulombic efficiency, i.e., the number of electrons that are effectively utilized for electrode reactions, resulted in only 5% ± 1% for the reductive dechlorination, while in the oxidative reactor, the coulombic efficiency was 7% ± 2% for the oxidation of vinyl chloride and ethylene. A methanogenesis reaction resulted from the main competitive reaction (observed in the reductive reactor), where it was responsible for the utilization of 22% ± 4% of the reductive current; however, the methane produced in the reductive reactor could also give an additional positive effect because it could be used by aerobic dechlorinating microorganisms as a substrate, boosting dechlorinating aerobic activity.
Even if the required current densities for contaminant removal are quite low, the coulombic efficiencies of the dechlorinating reactions resulted in quite low values. For this reason, future investigations will be focused on optimizing the efficiency of the reactions by supplying a lower reductive potential. We will also investigate in more detail the presence of parasitic and side reactions that promote an electron loop between the anodic and cathodic chamber. Despite the low columbic efficiency reached in the reductive step, the sequential process showed an energy consumption of 0.62 kWh/m3, quite promising results especially with respect to the conventional pump-and-treat approach.
Author Contributions
M.Z.: investigation, validation, preparation of the original draft; E.D.: investigation; L.C.: investigation; M.P.P.: supervision; M.M.: supervision, review of the draft, funding acquisition.
Funding
This research was funded by EUROPEAN COMMUNITY, grant number 826244, and ELECTRA (“Electricity-Driven Low Energy and Chemical input Technology for Accelerated Bioremediation”).
Acknowledgments
Marco Giletti is acknowledged for his skillful assistance in the experimental activity.
Conflicts of Interest
The authors declare no conflicts of interest.
References
- Bradley, P.M. History and ecology of chloroethene biodegradation: A Review. Biorem. J. 2003, 7, 81–109. [Google Scholar] [CrossRef]
- Moran, M.J.; Zogorski, J.S.; Squillace, P.J. Chlorinated solvents in groundwater of the United States. Environ. Sci. Technol. 2007, 41, 74–81. [Google Scholar] [CrossRef] [PubMed]
- Pierro, L.; Matturro, B.; Rossetti, S.; Sagliaschi, M.; Sucato, S.; Alesi, E.; Bartsch, E.; Arjmand, F.; Papini, M.P. Polyhydroxyalkanoate as a slow-release carbon source for in situ bioremediation of contaminated aquifers: From laboratory investigation to pilot-scale testing in the field. New Biotechnol. 2017, 37, 60–68. [Google Scholar] [CrossRef] [PubMed] [Green Version]
- Aulenta, F.; Gossett, J.M.; Papini, M.P.; Rossetti, S.; Majone, M. Comparative study of methanol, butyrate, and hydrogen as electron donors for long-term dechlorination of tetrachloroethene in mixed anerobic cultures. Biotechnol. Bioeng. 2005, 91, 743–753. [Google Scholar] [CrossRef] [PubMed]
- Vainberg, S.; Condee, C.W.; Steffan, R.J. Large-scale production of bacterial consortia for remediation of chlorinated solvent-contaminated groundwater. J. Ind. Microbiol. Biotechnol. 2009, 36, 1189–1197. [Google Scholar] [CrossRef]
- Matturro, B.; Presta, E.; Rossetti, S. Reductive dechlorination of tetrachloroethene in marine sediments: Biodiversity and dehalorespiring capabilities of the indigenous microbes. Sci. Total Environ. 2016, 545, 445–452. [Google Scholar] [CrossRef]
- Seshadri, R.; Adrian, L.; Fouts, D.E.; Eisen, J.A.; Phillippy, A.M.; Methe, B.A.; Ward, N.L.; Nelson, W.C.; Deboy, R.T.; Khouri, H.M.; et al. Genome sequence of the PCE-dechlorinating bacterium Dehalococcoides ethenogenes. Science 2005, 307, 105–108. [Google Scholar] [CrossRef]
- Luijten, M.L.G.C.; Roelofsen, W.; Langenhoff, A.A.M.; Schraa, G.; Stams, A.J.M. Hydrogen threshold concentrations in pure cultures of halorespiring bacteria and at a site polluted with chlorinated ethenes. Environ. Microbiol. 2004, 6, 646–650. [Google Scholar] [CrossRef]
- Majone, M.; Verdini, R.; Aulenta, F.; Rossetti, S.; Tandoi, V.; Kalogerakis, N.; Agathos, S.; Puig, S.; Zanaroli, G.; Fava, F. In situ groundwater and sediment bioremediation: barriers and perspectives at European contaminated sites. New Biotechnol. 2015, 32, 133–146. [Google Scholar] [CrossRef]
- Nam, S.H.; An, Y.J. Assessing the ecotoxicity of vinyl chloride using green alga P. subcapitata, nematode C. elegans, and the SOS chromotest in a closed system without headspace. Sci. Total Environ. 2010, 408, 3148–3152. [Google Scholar] [CrossRef]
- Gossett, J.M. Sustained aerobic oxidation of vinyl chloride at low oxygen concentrations. Environ. Sci. Technol. 2010, 44, 1405–1411. [Google Scholar] [CrossRef] [PubMed]
- Wendlandt, K.D.; Stottmeister, U.; Helm, J.; Soltmann, B.; Jechorek, M.; Beck, M. The potential of methane-oxidizing bacteria for applications in environmental biotechnology. Eng. Life Sci. 2010, 10, 87–102. [Google Scholar] [CrossRef]
- Mattes, T.E.; Alexander, A.K.; Coleman, N.V. Aerobic biodegradation of the chloroethenes: pathways, enzymes, ecology, and evolution. FEMS Microbiol. Rev. 2010, 34, 445–475. [Google Scholar] [CrossRef] [PubMed] [Green Version]
- Noell, A.L. Estimation of sequential degradation rate coefficients for chlorinated ethenes. Pract. Period. Hazard. Toxic Radioact. Waste Manag. 2009, 13, 35–44. [Google Scholar] [CrossRef]
- Devlin, J.F.; Katic, D.; Barker, J.F. In situ sequenced bioremediation of mixed contaminants in groundwater. J. Contam. Hydrol. 2004, 69, 233–261. [Google Scholar] [CrossRef]
- Tiehm, A.; Müller, A.; Alt, S.; Jacob, H.; Schad, H.; Weingran, C. Development of a groundwater biobarrier for the removal of polycyclic aromatic hydrocarbons, BTEX, and heterocyclic hydrocarbons. Water Sci. Technol. 2008, 58, 1349–1355. [Google Scholar] [CrossRef]
- Logan, B.E.; Rabaey, K. Conversion of wastes into bioelectricity and chemicals by using microbial electrochemical technologies. Science 2012, 337, 686–690. [Google Scholar] [CrossRef] [Green Version]
- Rabaey, K.; Angenent, L.; Schröder, U.; Keller, J. Bioelectrochemical systems: from extracellular electron transfer to biotechnological application. Water Intell. Online 2009, 8, 9781780401621. [Google Scholar] [CrossRef]
- Rozendal, R.A.; Hamelers, H.V.M.; Rabaey, K.; Keller, J.; Buisman, C.J.N. Towards practical implementation of bioelectrochemical wastewater treatment. Trends Biotechnol. 2008, 26, 450–459. [Google Scholar] [CrossRef]
- Aulenta, F.; Canosa, A.; Reale, P.; Rossetti, S.; Panero, S.; Majone, M. Microbial reductive dechlorination of trichloroethene to ethene with electrodes serving as electron donors without the external addition of redox mediators. Biotechnol. Bioeng. 2009, 103, 85–91. [Google Scholar] [CrossRef]
- Aulenta, F.; Catervi, A.; Majone, M.; Panero, S.; Reale, P.; Rossetti, S. Electron transfer from a solid-state electrode assisted by methyl viologen sustains efficient microbial reductive dechlorination of TCE. Environ. Sci. Technol. 2007, 41, 2554–2559. [Google Scholar] [CrossRef] [PubMed]
- Verdini, R.; Aulenta, F.; de Tora, F.; Lai, A.; Majone, M. Relative contribution of set cathode potential and external mass transport on TCE dechlorination in a continuous-flow bioelectrochemical reactor. Chemosphere 2015, 136, 72–78. [Google Scholar] [CrossRef] [PubMed]
- Aulenta, F.; Tocca, L.; Verdini, R.; Reale, P.; Majone, M. Dechlorination of trichloroethene in a continuous-flow bioelectrochemical reactor: Effect of cathode potential on rate, selectivity, and electron transfer mechanisms. Environ. Sci. Technol. 2011, 45, 8444–8451. [Google Scholar] [CrossRef] [PubMed]
- Aulenta, F.; Verdini, R.; Zeppilli, M.; Zanaroli, G.; Fava, F.; Rossetti, S.; Majone, M. Electrochemical stimulation of microbial cis-dichloroethene (cis-DCE) oxidation by an ethene-assimilating culture. New Biotechnol. 2013, 30, 749–755. [Google Scholar] [CrossRef]
- Lohner, S.T.; Becker, D.; Mangold, K.M.; Tiehm, A. Sequential reductive and oxidative biodegradation of chloroethenes stimulated in a coupled bioelectro-process. Environ. Sci. Technol. 2011, 45, 6491–6497. [Google Scholar] [CrossRef]
- Lai, A.; Aulenta, F.; Mingazzini, M.; Palumbo, M.T.; Papini, M.P.; Verdini, R.; Majone, M. Bioelectrochemical approach for reductive and oxidative dechlorination of chlorinated aliphatic hydrocarbons (CAHs). Chemosphere 2017, 169, 351–360. [Google Scholar] [CrossRef]
- Kinoshita, K.; Bett, J. Electrochemical oxidation of carbon black in concentrated phosphoric acid at 135°C. Carbon 1973, 11, 237–247. [Google Scholar] [CrossRef]
- Chouler, J.; Bentley, I.; Vaz, F.; O’Fee, A.; Cameron, P.J.; Di Lorenzo, M. Exploring the use of cost-effective membrane materials for Microbial Fuel Cell based sensors. Electrochim. Acta 2017, 231, 319–326. [Google Scholar] [CrossRef]
- Rozendal, R.A.; Sleutels, T.H.J.A.; Hamelers, H.V.M.; Buisman, C.J.N. Effect of the type of ion exchange membrane on performance, ion transport, and pH in biocatalyzed electrolysis of wastewater. Water Sci. Technol. 2008, 57, 1757–1762. [Google Scholar] [CrossRef]
- Zeppilli, M.; Paiano, P.; Villano, M.; Majone, M. Anodic vs. cathodic potentiostatic control of a methane producing microbial electrolysis cell aimed at biogas upgrading. Biochem. Eng. J. 2019, 152, 107393. [Google Scholar] [CrossRef]
- Matturro, B.; Pierro, L.; Frascadore, E.; Petrangeli Papini, M.; Rossetti, S. Microbial community changes in a chlorinated solvents polluted aquifer over the field scale treatment with poly-3-Hydroxybutyrate as amendment. Front. Microbiol. 2018, 9. [Google Scholar] [CrossRef] [PubMed] [Green Version]
- Balch, W.E.; Fox, G.E.; Magrum, L.J.; Woese, C.R.; Wolfe, R.S. Methanogens: reevaluation of a unique biological group. Microbiol. Rev. 1979, 43, 260–296. [Google Scholar] [PubMed]
- Zeikus, J.G. The biology of methanogenic bacteria. Bacteriol. Rev. 1977, 41, 514–541. [Google Scholar] [PubMed]
- Gossett, J.M. Measurement of Henry’s law constants for C1 and C2 chlorinated hydrocarbons. Environ. Sci. Technol. 1987, 21, 202–208. [Google Scholar] [CrossRef]
- Zeppilli, M.; Lai, A.; Villano, M.; Majone, M. Anion vs. cation exchange membrane strongly affect mechanisms and yield of CO2 fixation in a microbial electrolysis cell. Chem. Eng. J. 2016, 304, 10–19. [Google Scholar] [CrossRef]
- Villano, M.; Ralo, C.; Zeppilli, M.; Aulenta, F.; Majone, M. Influence of the set anode potential on the performance and internal energy losses of a methane-producing microbial electrolysis cell. Bioelectrochemistry 2016, 107, 1–6. [Google Scholar] [CrossRef]
- Bard, A.; Faulkner, J. Electrochemical Methods Fundamentals and Applications; Wiley: New York, NY, USA, 2001. [Google Scholar]
- Savéant, J.M. Elements of Molecular and Biomolecular Electrochemistry: An Electrochemical Approach to Electron Transfer Chemistry; John Wiley & Sons Inc.: Hoboken, NJ, USA, 2006. [Google Scholar]
- Elgrishi, N.; Rountree, K.J.; McCarthy, B.D.; Rountree, E.S.; Eisenhart, T.T.; Dempsey, J.L. A practical beginner’s guide to cyclic voltammetry. J. Chem. Educ. 2017, 95, 197–206. [Google Scholar] [CrossRef]
- Villano, M.; Aulenta, F.; Giuliano, A.; Ciucci, C.; Ferri, T.; Majone, M. Bioelectrochemical reduction of CO2 to CH4 via direct and indirect extracellular electron transfer by a hydrogenophilic methanogenic culture. Bioresour. Technol. 2010, 101, 3085–3090. [Google Scholar] [CrossRef]
- Dutta, P.K.; Rabaey, K.; Yuan, Z.; Rozendal, R.A.; Keller, J. Electrochemical sulfide removal and recovery from paper mill anaerobic treatment effluent. Water Res. 2010, 44, 2563–2571. [Google Scholar] [CrossRef]
- Watanabe, T.; Hashimoto, S.; Kuroda, M. Simultaneous nitrification and denitrification in a single reactor using bio-electrochemical process. Water Sci. Technol. 2002, 46, 163–169. [Google Scholar] [CrossRef]
- Ter Heijne, A.; de Rink, R.; Liu, D.; Klok, J.B.M.; Buisman, C.J.N. Bacteria as an Electron Shuttle for Sulfide Oxidation. Environ. Sci. Technol. Lett. 2018, 5, 495–499. [Google Scholar] [CrossRef] [PubMed] [Green Version]
- Zeppilli, M.; Simoni, M.; Paiano, P.; Majone, M. Two-Side cathode microbial electrolysis cell for nutrients recovery and biogas upgrading. Chem. Eng. J. 2019, 370, 466–476. [Google Scholar] [CrossRef]
- Guiot, S.R.; Cimpoia, R.; Kuhn, R.; Alaplantive, A. Electrolytic methanogenic−methanotrophic coupling for tetrachloroethylene bioremediation: Proof of concept. Environ. Sci. Technol. 2008, 42, 3011–3017. [Google Scholar] [CrossRef] [PubMed]
- Knauss, K.G.; Dibley, M.J.; Leif, R.N.; Mew, D.A.; Aines, R.D. The aqueous solubility of trichloroethene (TCE) and tetrachloroethene (PCE) as a function of temperature. Appl. Geochem. 2000, 15, 501–512. [Google Scholar] [CrossRef]
Figure 1.
Schematic view of the reductive/oxidative bioelectrochemical process (A) and pictures of the two tubular reactors and the sacrificial counterelectrode (B).
Figure 1.
Schematic view of the reductive/oxidative bioelectrochemical process (A) and pictures of the two tubular reactors and the sacrificial counterelectrode (B).

Figure 2.
Tracer test results for the reductive reactor (A) and for the oxidative reactor (B). Plug flow reactor (PFR) and continuous stirred tank reactor CSTR theoretical curves are also reported.
Figure 2.
Tracer test results for the reductive reactor (A) and for the oxidative reactor (B). Plug flow reactor (PFR) and continuous stirred tank reactor CSTR theoretical curves are also reported.

Figure 3.
Cyclic voltammetry at different scan rates for the reductive (A) and oxidative reactor (B).
Figure 3.
Cyclic voltammetry at different scan rates for the reductive (A) and oxidative reactor (B).

Figure 4.
Time course of perchloroethylene (PCE) and its dechlorination products during the startup of the reductive reactor during the first 13 days after inoculation.
Figure 4.
Time course of perchloroethylene (PCE) and its dechlorination products during the startup of the reductive reactor during the first 13 days after inoculation.

Figure 5.
Perchloroethylene concentration in the reductive reactor influent and effluent during the continuous flow run at −450 mV.
Figure 5.
Perchloroethylene concentration in the reductive reactor influent and effluent during the continuous flow run at −450 mV.

Figure 6.
Dechlorination products in the reductive reactor effluent during the continuous flow condition at −450 mV versus SHE.
Figure 6.
Dechlorination products in the reductive reactor effluent during the continuous flow condition at −450 mV versus SHE.

Figure 7.
Removal of the vinyl chloride (A) and ethylene (B) in the oxidative reactor during the first continuous-flow potentiostatic condition explored.
Figure 7.
Removal of the vinyl chloride (A) and ethylene (B) in the oxidative reactor during the first continuous-flow potentiostatic condition explored.


Table 1.
Tracer test results. HRT: hydraulic retention time.
| HRT | Reductive Reactor | Oxidative Reactor |
|---|---|---|
| Working electrode (h) | 2.6 | 0.8 |
| Overall reactor (h) | 3.3 | 1 |
| Experimental (h) | 3.3 | 0.7 |
Table 2.
Main performance of the sequential reductive/oxidative process in the three different potentiostatic conditions explored.
Table 2.
Main performance of the sequential reductive/oxidative process in the three different potentiostatic conditions explored.
| Reductive Reactor Potential | −450 mV versus SHE |
| PCE removal rate (μmol/d) | 191 ± 13 |
| PCE removal efficiency (%) | 100 ± 1 |
| Coulombic efficiency of reductive dechlorination (RD) (%) | 5 ± 1 |
| Coulombic efficiency CH4 (%) | 22 ± 4 |
| Oxidative Reactor Potential | +1.4 V versus SHE |
| Vinyl chloride (VC) removal efficiency (%) | 100 ± 2 |
| Ethylene removal efficiency (%) | 92 ± 5 |
| Coulombic efficiency of oxidative VC-ethylene (%) | 7 ± 2 |
| Coulombic efficiency of oxidative CH4 (%) | 8 ± 1 |
© 2019 by the authors. Licensee MDPI, Basel, Switzerland. This article is an open access article distributed under the terms and conditions of the Creative Commons Attribution (CC BY) license (http://creativecommons.org/licenses/by/4.0/).
Share and Cite
MDPI and ACS Style
Zeppilli, M.; Dell’Armi, E.; Cristiani, L.; Petrangeli Papini, M.; Majone, M. Reductive/Oxidative Sequential Bioelectrochemical Process for Perchloroethylene Removal. Water 2019, 11, 2579. https://doi.org/10.3390/w11122579
AMA Style
Zeppilli M, Dell’Armi E, Cristiani L, Petrangeli Papini M, Majone M. Reductive/Oxidative Sequential Bioelectrochemical Process for Perchloroethylene Removal. Water. 2019; 11(12):2579. https://doi.org/10.3390/w11122579
Chicago/Turabian StyleZeppilli, Marco, Edoardo Dell’Armi, Lorenzo Cristiani, Marco Petrangeli Papini, and Mauro Majone. 2019. "Reductive/Oxidative Sequential Bioelectrochemical Process for Perchloroethylene Removal" Water 11, no. 12: 2579. https://doi.org/10.3390/w11122579
Note that from the first issue of 2016, this journal uses article numbers instead of page numbers. See further details here.