Choosing the LID for Urban Storm Management in the South of Taiyuan Basin by Comparing the Storm Water Reduction Efficiency

1
Hydrology and Water Resources Department, Nanjing Hydraulic Research Institute, Nanjing 210029, China
2
College of Hydrology and Water Resources, Hohai University, Nanjing 210098, China
3
State Key Laboratory of Hydrology-Water Resources and Hydraulic Engineering, Nanjing 210098, China
4
Nanjing R&D Tech Group Co., Ltd., Nanjing 210029, China
*
Author to whom correspondence should be addressed.
Water 2019, 11(12), 2583; https://doi.org/10.3390/w11122583
Submission received: 14 November 2019
/
Revised: 4 December 2019
/
Accepted: 4 December 2019
/
Published: 7 December 2019
(This article belongs to the Section Urban Water Management)
Abstract
:Low impact development (LID) is a storm management philosophy. This paper aims at choosing the LID for urban storm management by comparing the efficiency in the south urban district in the Taiyuan Basin. Firstly, we set up a 1D–2D model to simulate the hydrological and hydraulic process of the area. Then the efficiency of different LID scenarios was analyzed by ratio of surcharging pipeline, percentage of ponding road, external outflow, infiltration, surface runoff, facility storage, and LID area ratio. It was found that the continuous porous pavement and rain garden are beneficial for use in residential and commercial settings in urban areas, and the rain garden performs more effectively and efficiently than the continuous porous pavement. The area occupied by LID might be under 20% of the impervious building area, because the LID performance was not improved significantly with the LID area when the ratio exceeded 20%. The LIDs could be more useful for small return periods and short duration storms, and could not replace conventional runoff management practices and drainage systems.
1. Introduction
Urban flooding caused by storm water has been widely recognized as one of the main scientific issues that needs to be addressed with priority [1], and poses significant threats for flooding in urban areas. Among 672 cities in mainland China, there are 643 cities with flood control tasks, but only 177 cities have reached national flood control standards, accounting for only 27.6% [2].
Climate changes and urbanization are two of the most influential drivers that challenge the current and future urban flood management strategies [3,4]. Climate change creates large impacts on water cycles and patterns of precipitation extremes, and changes the surface runoff and the frequency and magnitude of floods [5,6,7,8,9]. In China, the annual amount and frequency of rainstorms have increased significantly, though the intensity of rainstorms remained unchanged [7]. Urbanization increases impervious surfaces, makes great land use changes, and has a great impact on hydrology in a watershed surrounding a city [9,10,11]. Impermeable pavements and buildings of urban built-up areas reduce the pervious area and reduce storm water infiltration. There is no place to store storm water or to delay floods, because the depressions, lakes, and reservoirs are gradually filled or destroyed artificially. The drainage infrastructure also affects urban flooding. For example, the logged water cannot be drained out of the system in time, due to the low-level drainage standards, poor drainage capacity, aged drainage facilities, and intricate drainage pipe networks with unreasonable settings [12]. The topography can aggravate urban flooding. If the urban district is located in a basin, the steep land slope could speed up the production of runoff and conflux, and urban flooding might be more serious than the urban district in the plain [13].
The drainage infrastructure construction lags behind the increasing urban area, composed by impervious surfaces, in the fast urbanization in Taiyuan, the provincial capital of Shanxi province. Thus, as a result, Taiyuan has suffered from urban floods for years. The most concerning issue is to reduce urban flooding in urban areas. The drainage systems in the urban area are redesigned and planned in Taiyuan. Besides the conventional drainage systems, an ideal way to control urban flooding is by use of some management techniques. Storm water management, such as best management practices (BMPs) [14], low impact development (LID) [15], green infrastructures (GIs) [16], sustainable urban drainage system (SUDS) [17], and water sensitive urban design (WSUD) [18], have considered ecology, water quality, and flood detention. LID is an environmentally friendly development approach with minimal impacts on hydrologic regime and water quality. LID is intended to eliminate or reduce these problems through an alternate, comprehensive approach to storm water management, including retention and storage of rainfall. At the beginning of the twenty-first century, many metropolises in China began to implement the LID conception [19,20]. Since 2010, the storm water management or sponge city were promoted by the government, many laws and guidelines have been enacted [21,22,23], and theory, technology, law, and management systems were combined to manage the storm water. These management techniques not only focus on the policies and theories, but they also employ some LID facilities, such as rain gardens, green roofs, permeable pavements, vegetative swales, and bio-retention cells.
Computer modeling is the most effective tool for the design and optimization of sewer systems [24], and is commonly employed to assess urban flood and storm water management [25,26,27]. Bosley [28] gives an in-depth review of the common models. A lot of studies use computer models to analyze the hydrological process in LID controls [29]. Bai et al. [2] evaluated the effect of four different types of LID scenarios. Wang et al. [27] assessed hydrological effects of bioretention cells for urban storm water runoff. Cipolla et al. [30] conducted a long-term hydrological simulation experiment of green roofs through SWMM; the results confirmed that green roofs function well in restoring natural water. Zheng et al. [31] provided an improved understanding on effectiveness of LID infiltration for groundwater supplementation in an urbanized area. Liu et al. [32] assessed the impacts of BMPs and LID practices on storm runoff with an enhanced rainfall-runoff model. With budget being a major limiting factor in storm water management projects, the optimal selection and placement of LID controls is necessary in order to achieve the maximum runoff/peak flow reductions at minimum cost. In order to properly evaluate and compare LID scenarios, optimization tools are employed to decide selection factors, such as sizes, number of controls, locations, and combinations of controls. Bai et al. [33] provide a guide to optimize LID layouts. Mao et al. [34] assessed the ecological benefits of aggregate LID-BMPs through modelling. Helmi et al. [35] developed a modeling tool to allocate LID practices in a cost-optimized method. Most of the studies mainly focus on the hydrological process in LID controls; the hydraulic process, such as the drainage pipe network, is often neglected or generalized. The study area usually is a simple flat urban block; complex study cases with rivers, low hills, and flat plains have been seldom addressed in the literature as yet.
In this study, we focus on choosing the LID co-working with the drainage system to relieve urban flooding in the south urban district of Taiyuan, which is located in a piedmont basin. We try to find the proper LID scenarios and the LID scales. A 1D–2D model, which could simulate the hydrological and hydraulic process of the area, is set up to analyze different LID scenarios. Then indexes are selected and used to assess different LID scenarios. The efficiency of LID is discussed and the LID scale is evaluated. Finally, the performance of the selected LID is analyzed. This work might be useful for flood prevention, city programming, and LID development of the Taiyuan city or other similar cases.
2. Materials and Methods
2.1. Study Site
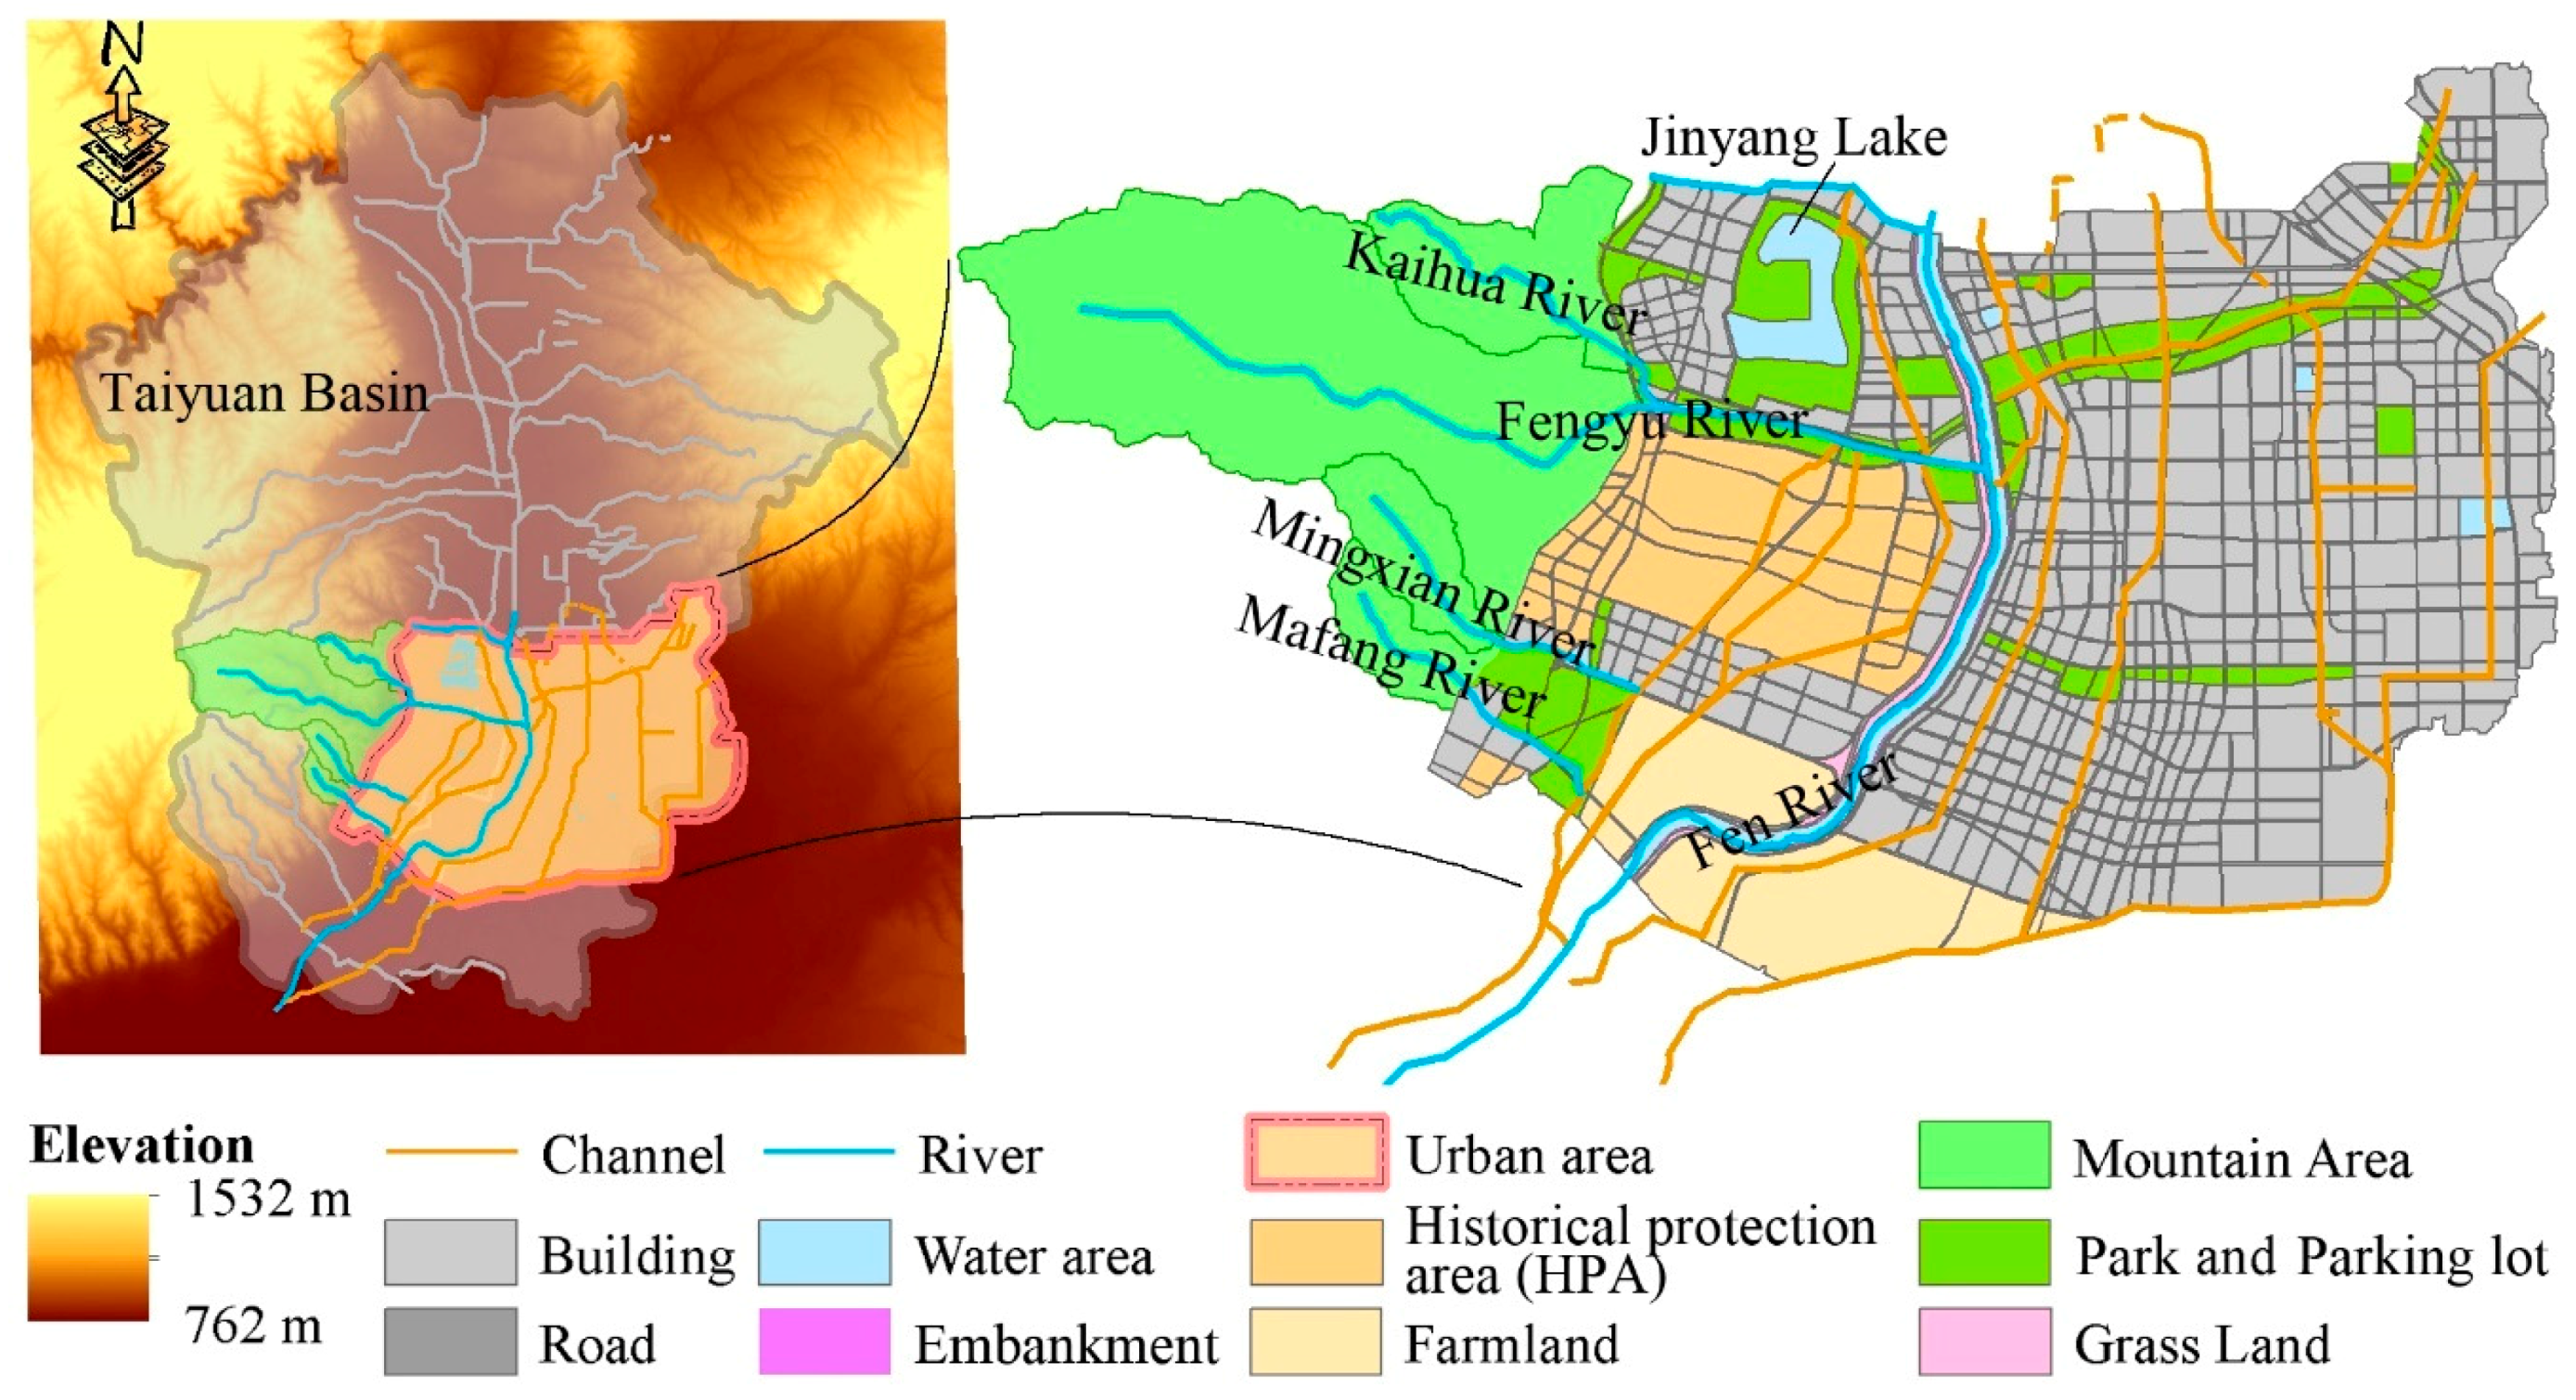
The study area is the south urban district of the city of Taiyuan, which lies in the Taiyuan Basin (Figure 1), with mean annual precipitation of about 456 mm. The south part of this area is about 241 km2 and has the lowest elevation, and the west of it is mountain area. The Fen River flows across the area, from the north to the south, and the Fengyu River (including the Kaihua River), Mingxian River, and Mafang River flow from the west to the east and converge together in the area [36]. The study area is experiencing urbanization. The whole area will become an urban area, about 65% of which may be covered by roads and modern buildings, by 2020 (Table 1). The whole study area could be taken as a completed drainage system, so we suppose that all the water that gets into or out of the area is conveyed by the rivers, channels, and pipelines [37]. As the biggest water body in the area, the Jinyang Lake could store 24 million m3 of water. The two small ponds located in the area could store 238 thousand m3 of water [37]. Both the lake and the ponds could be used to decrease the flood and be taken as the artificial sights in the area. Several big parks and parking lots are designed and assembled as contiguous green land to increase the rainfall infiltration and reduce the surface runoff.
2.2. Model Settings
PCSWMM, version 7.1.2480 (Computational Hydraulics International, Guelph, ON, Canada) [38], an advanced modeling software for EPA SWMM 5, was used to assess the performance of LIDs in this study. PCSWMM has been widely used for analysis, planning, and design of various LID practices, storm water, wastewater, watershed, and water distribution systems.
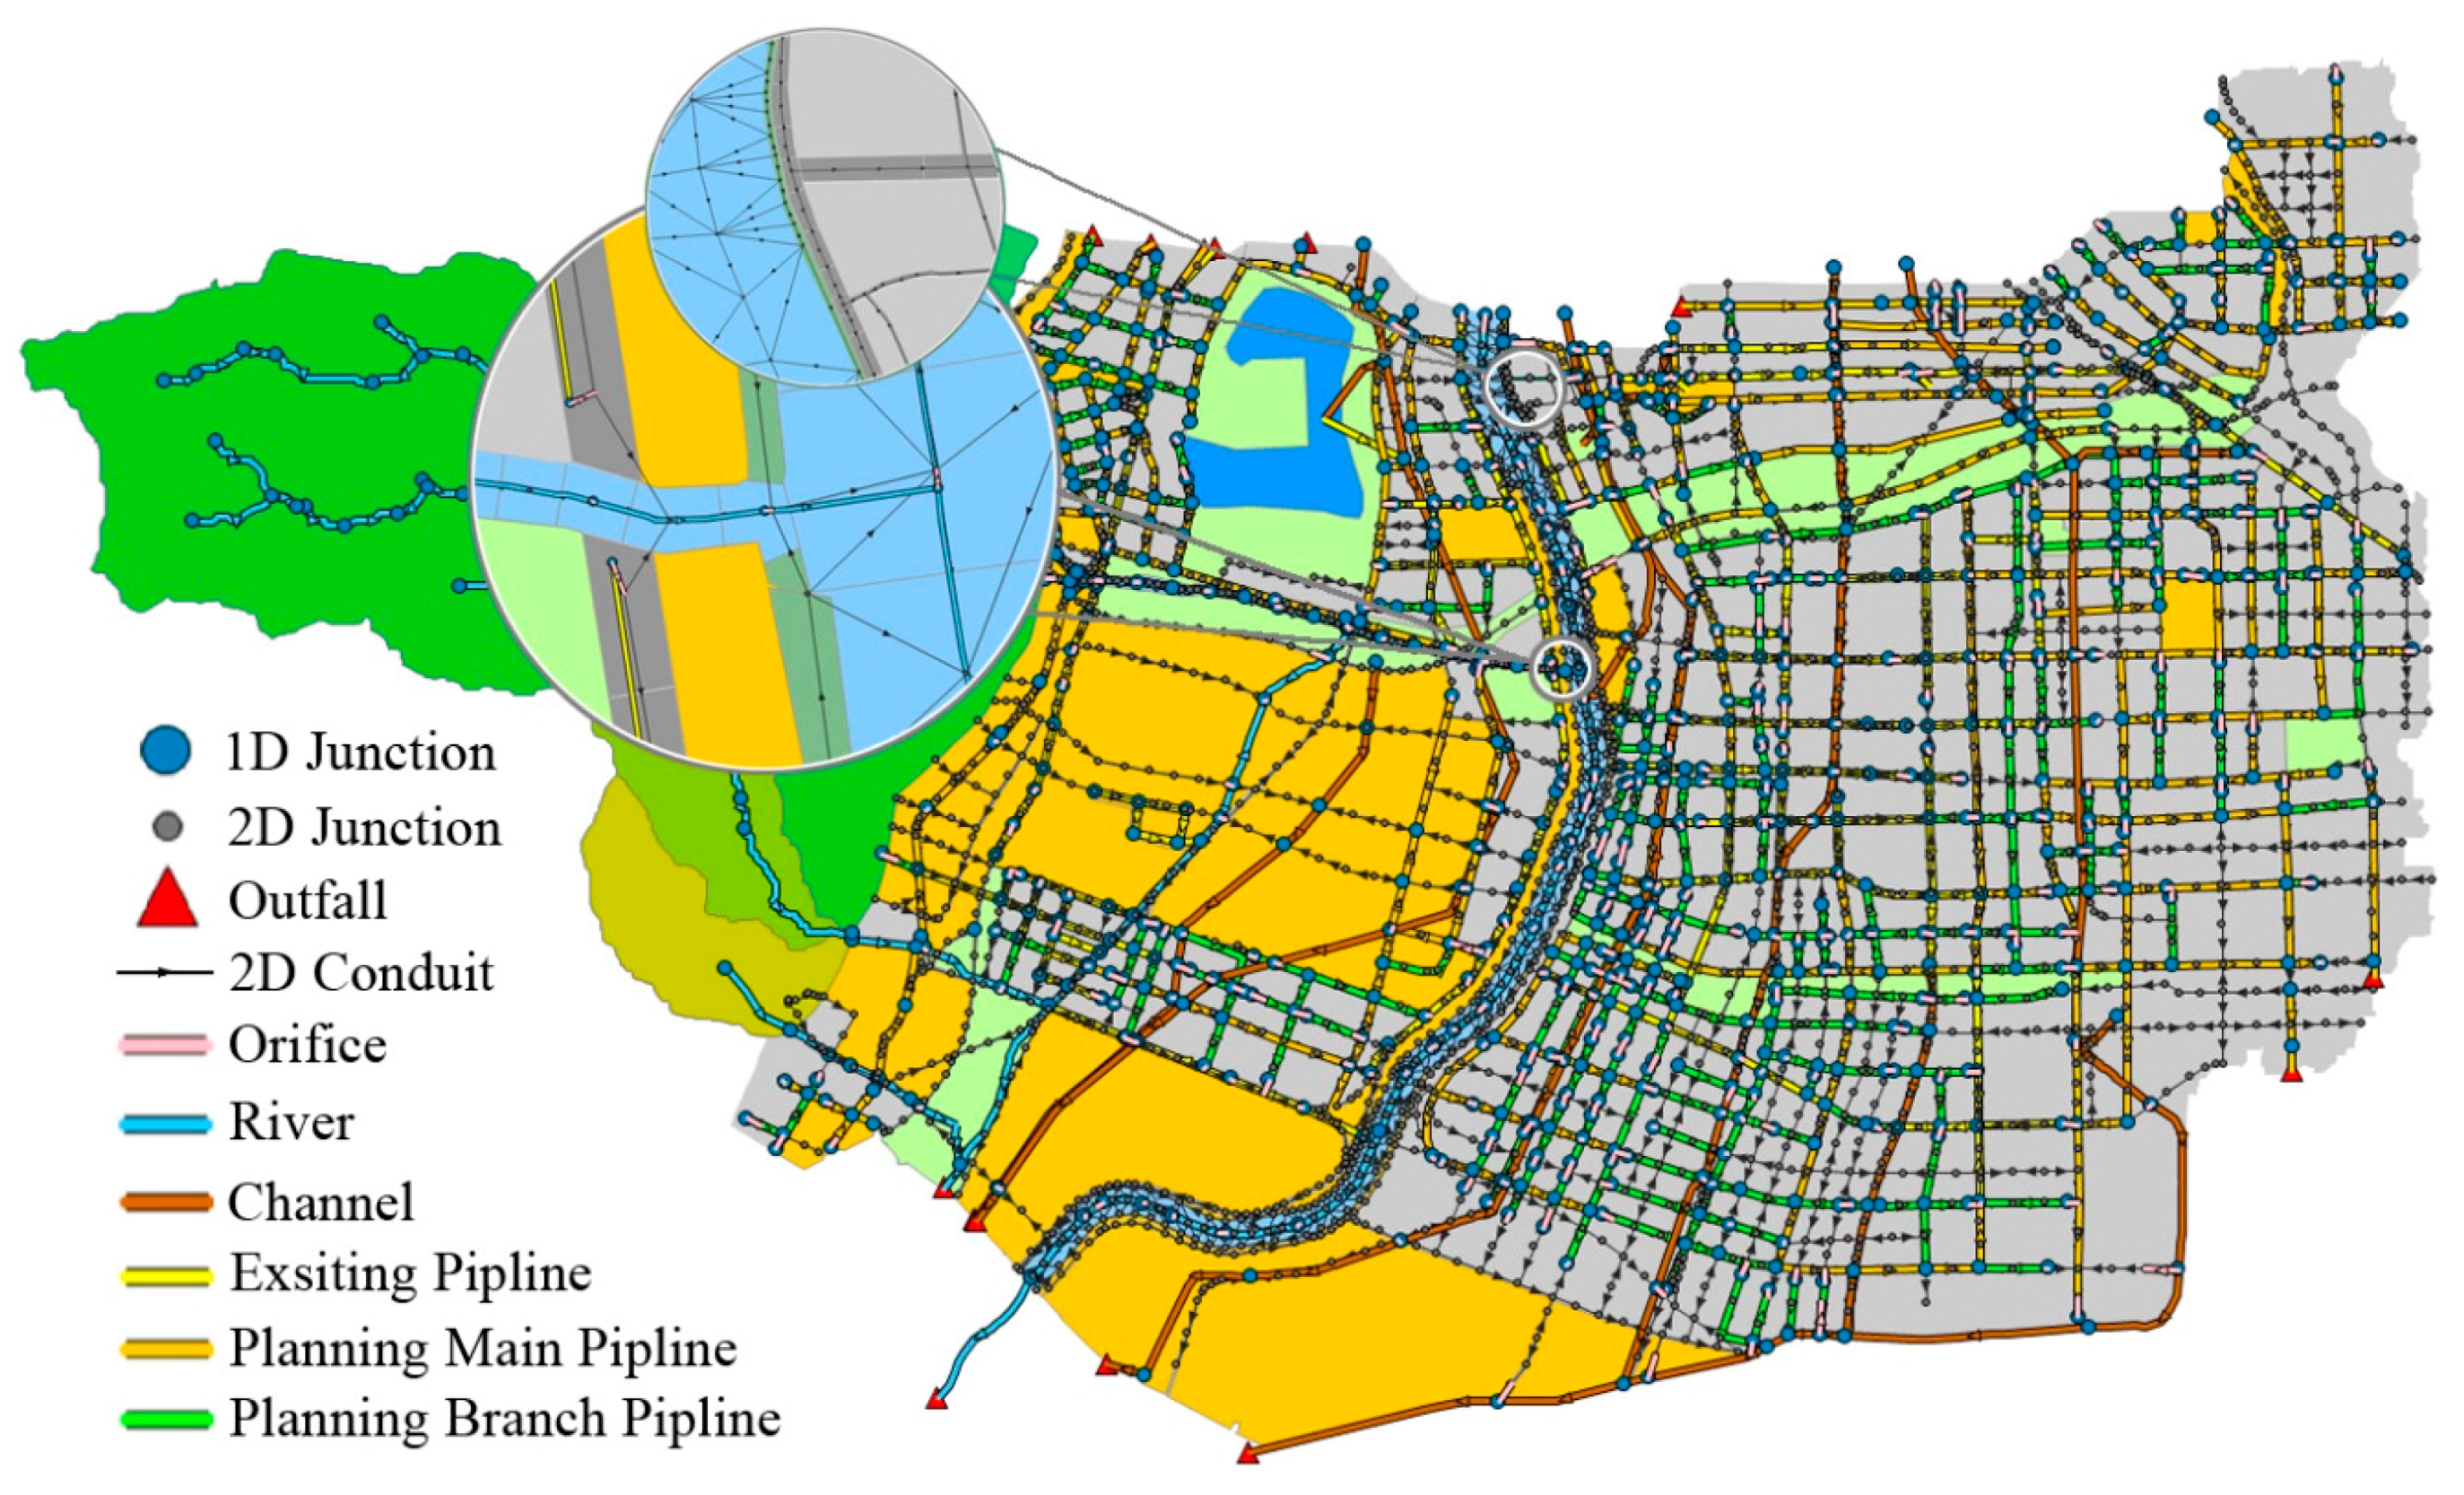
We built the model of the area on the basis of the planning [37]. We setup a 1D–2D model to simulate the runoff and drainage in the urban district located in the plain in the south of the Taiyuan Basin. The 1D conduit represents the branch rivers, the pipelines under the ground, or the irrigation channels. The 2D meshes were used to model the broad roads, the Fen River channel.
A hydrologic water balance is the equivalence between precipitation or other inputs, and the outflow of water through runoff, evapotranspiration, groundwater recharge, and stream flow. In the study, the inflow components of the water balance include rainfall and the external inflow, the outflow include evaporation loss, infiltration loss, external outflow.
2.2.1. Inflow
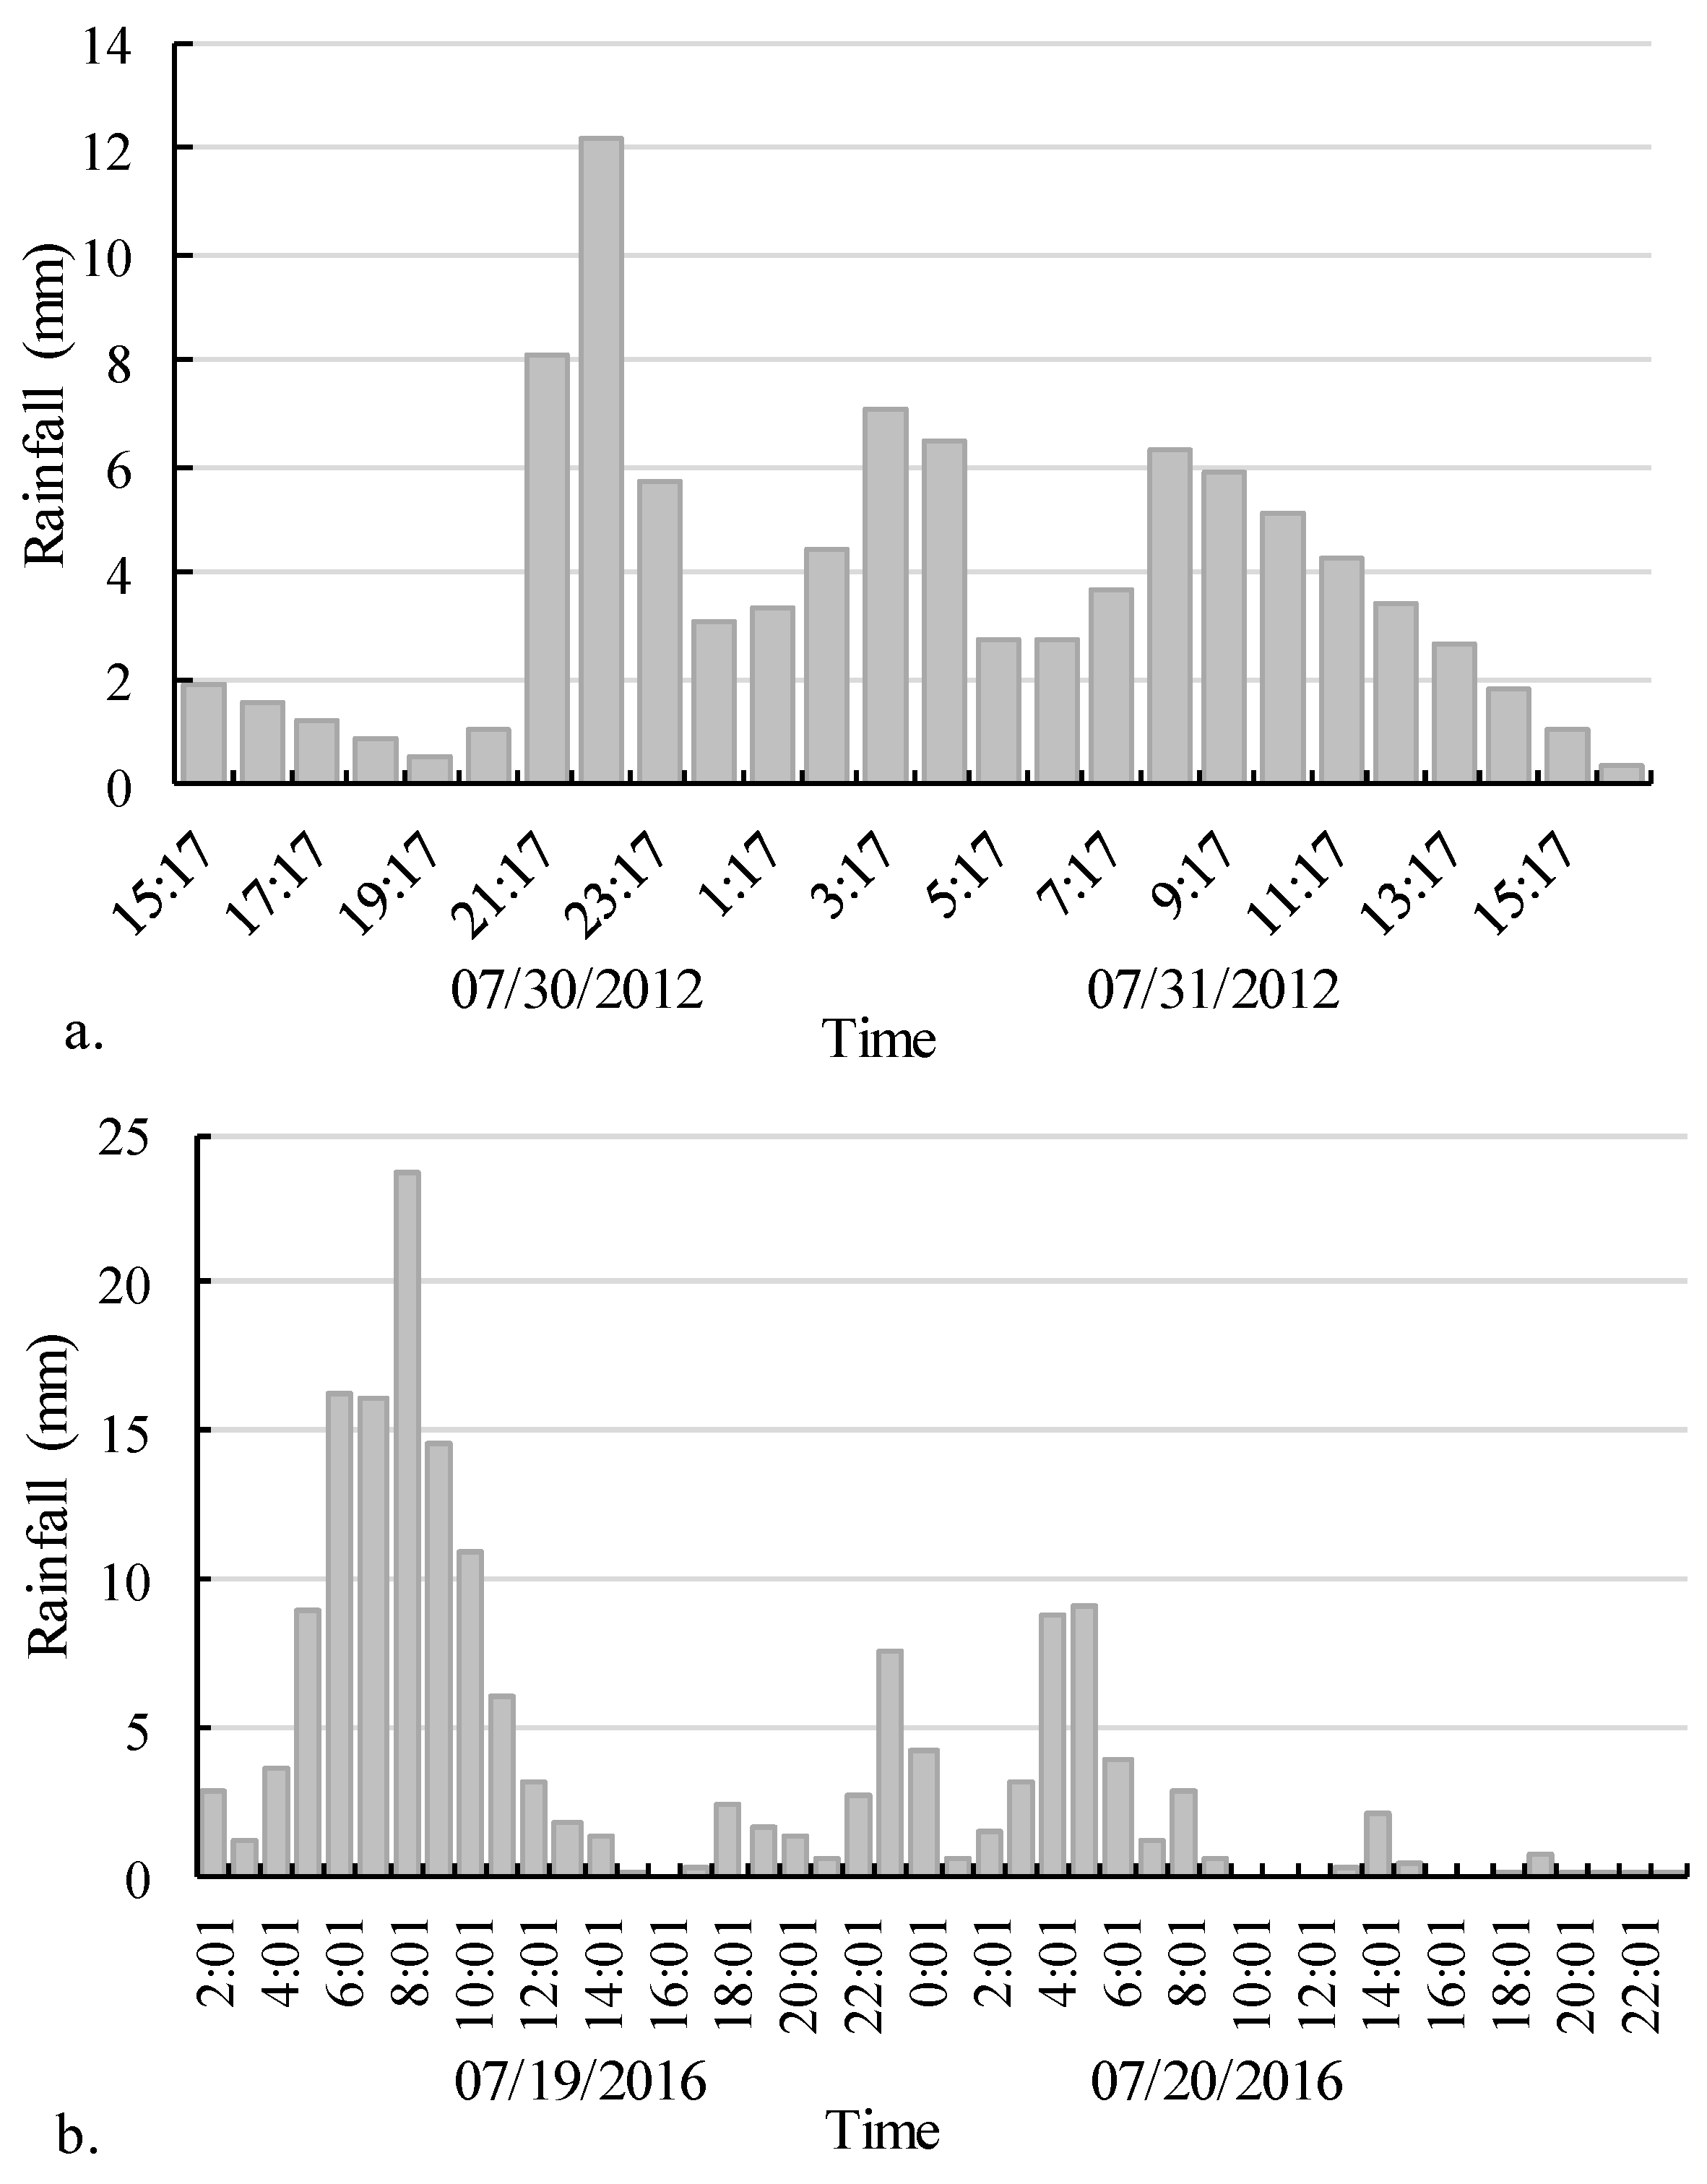
Rainfall is an important inflow of the study area. The heavy rainfall in July 2012 and July 2016 caused serious urban waterlog in the Taiyuan city. The observed rainfall series of the two rainfall events were used to calibrate and validate the model (Figure 2).
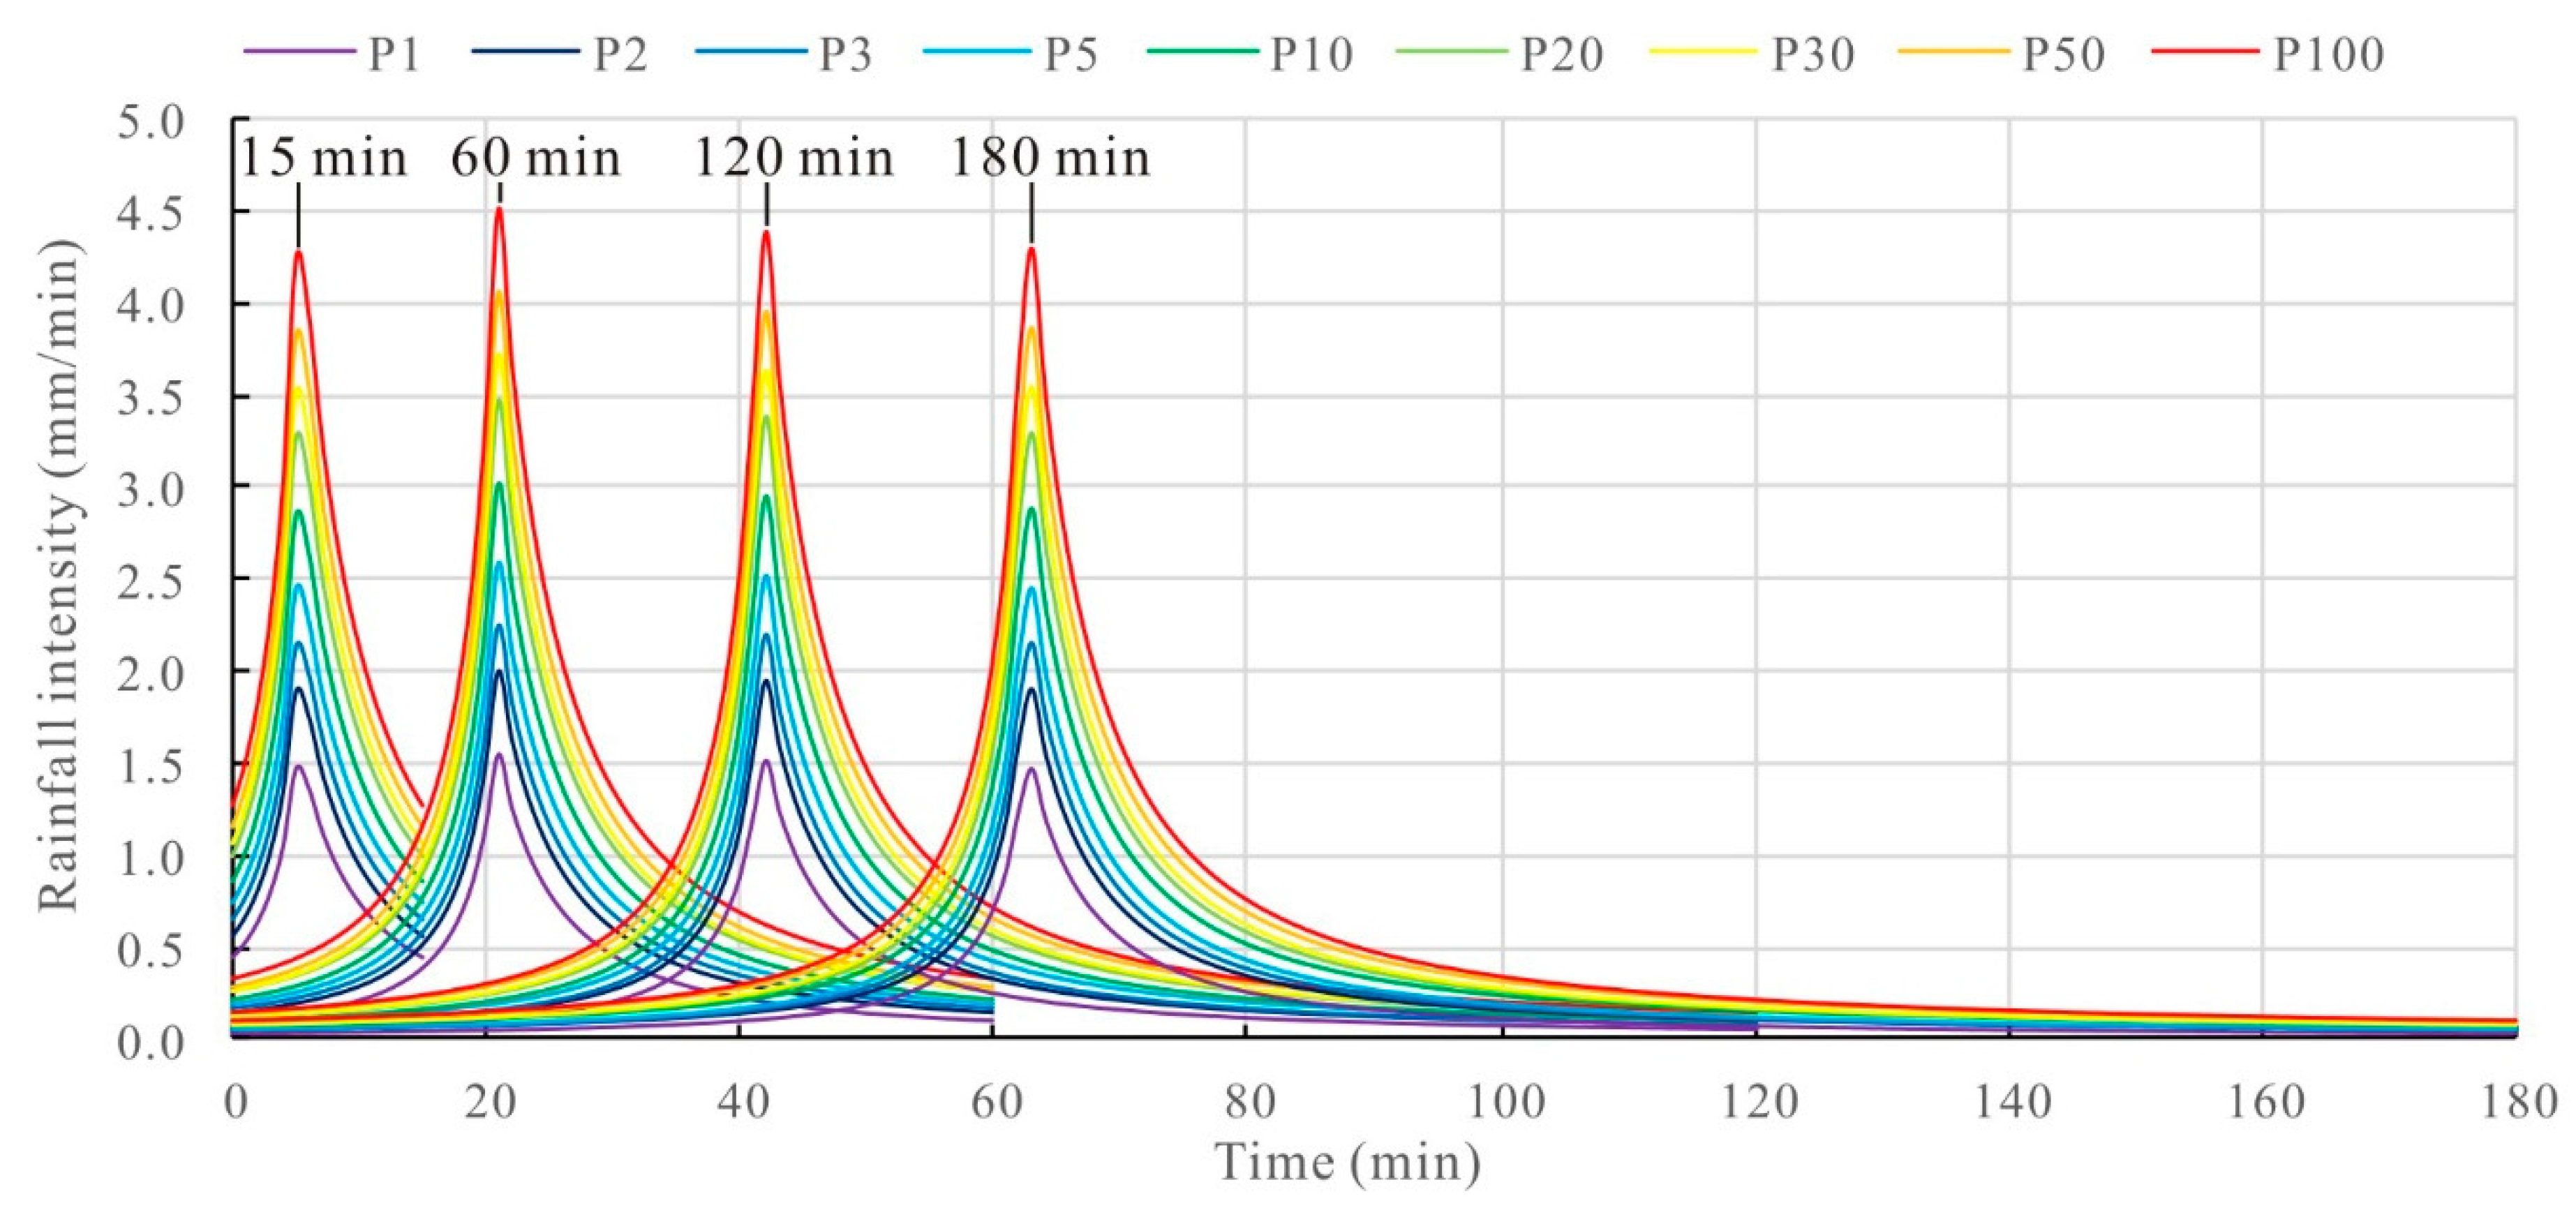
The Chicago hydrograph model was adopted for the rainfall simulation and used to analyze the different LID scenarios. The storm events were based on the relationship of rainstorm intensity–duration–frequency in Taiyuan city, as shown in Equation (1) [39].
where P is the return period (year), t is the rainfall duration (min), and i is the rainfall intensity (mm/min). The time-to-peak ratio r is set at 0.348.
We chose the rainfall durations of 15, 60, 120, and 180 min of different return periods as examples, the design hyetographs are shown in Figure 3.
Because we wanted to model the urban district located in the plain in the south of the Taiyuan Basin, the inflow of the Fen River flowing across the area was the external inflow that we had to take account of. The Fen Reservoir I (the capacity is 700 million m3), the Fen Reservoir II (the capacity is 130 million m3), and the flood storage area (the capacity is 10.5 million m3) are located upstream of the Fen River, out of the study area. The two reservoirs and the flood storage area could control the 100-year flood, and give a flow at 8 m3/s as the external inflow of the study area [40].
2.2.2. Outflow
Evaporation is an important outflow for long-term modelling or water resources evaluation. In this study, we focused on the runoff and drainage during a short storm process, so the evaporation was neglected.
The Horton’s equation [41] was employed to describe the infiltration. This method is based on empirical observations showing that infiltration decreases exponentially, from an initial maximum rate to some minimum rate, over the course of a long rainfall event. Input parameters required by this method include the maximum and minimum infiltration rates, a decay coefficient that describes how fast the rate decreases over time, and the time it takes fully saturated soil to completely dry (used to compute the recovery of infiltration rate during dry periods).
External outflow is the amount of water flowing out of the study area though the rivers, channels, and pipelines. The surface runoff was modelled by the 2D meshes connected by the conduits, which could be taken as special channels, so we took the overland outflow as the outflow from these special channels.
2.2.3. Subcatchment
The study area was divided into 3342 subcatchments. The area of the subcatchments was calculated by GIS (geographic information system) geometry. The slope of subcatchments was calculated by the DEM (digital elevation model). The percent of impervious area of each subcatchment was obtained from the planning of the Taiyuan City [36].
2.2.4. Flow Process
Channels and pipelines were modelled by 1D conduits. Surface runoff of broad roads and farmland were modelled by the 2D meshes connected by the 1D conduits (Figure 4). Wide rivers were modelled by both 1D conduits and 2D meshes. 1D conduits with irregular transects were used to model the river channel and 2D meshes were used to represent flooding. This method assumes that the water elevation in the 1D channel will not be accounted for by the 2D mesh until the water has hit the elevation of the bank station and flooding occurs [42]. The 1D conduits and 2D meshes were directly connected by orifices, which is represented as a link connecting two nodes. The flow in both the 1D conduits and the 2D meshes were calculated by 1D Saint-Venant equations.
2.2.5. Model Calibration and Validation
The parameter values were calibrated and validated by the comprehensive runoff coefficient (CRC) method [2]. At first, the initial parameter values were obtained from the sponge city guidance [21] and the city planning [36,37], then these parameters were input into the model, and the simulated CRC was obtained. If the simulated CRC met the requirement range of corresponding empirical CRC [21] (Table 1), then the final parameters were obtained, otherwise the input parameters were modified until the simulated CRC fell in the range of the corresponding CRC. The simulated CRCs all satisfied the requirement range of the empirical CRC (Table 1). The final parameters are shown in Table 2, Table 3 and Table 4.
2.3. Low-Impact Development Facilities
The buildings of the study area contribute most of the impervious area, which might lead to more overland runoff. The most important way to increase the pervious area and the rainfall storage is to reduce the overland runoff. The study area is zoned for commercial and residential purposes, so the LID should act as an important urban landscape. Because the continuous porous pavement and rain garden are beneficial for use in both residential and commercial settings [43], they were selected for the urban area.
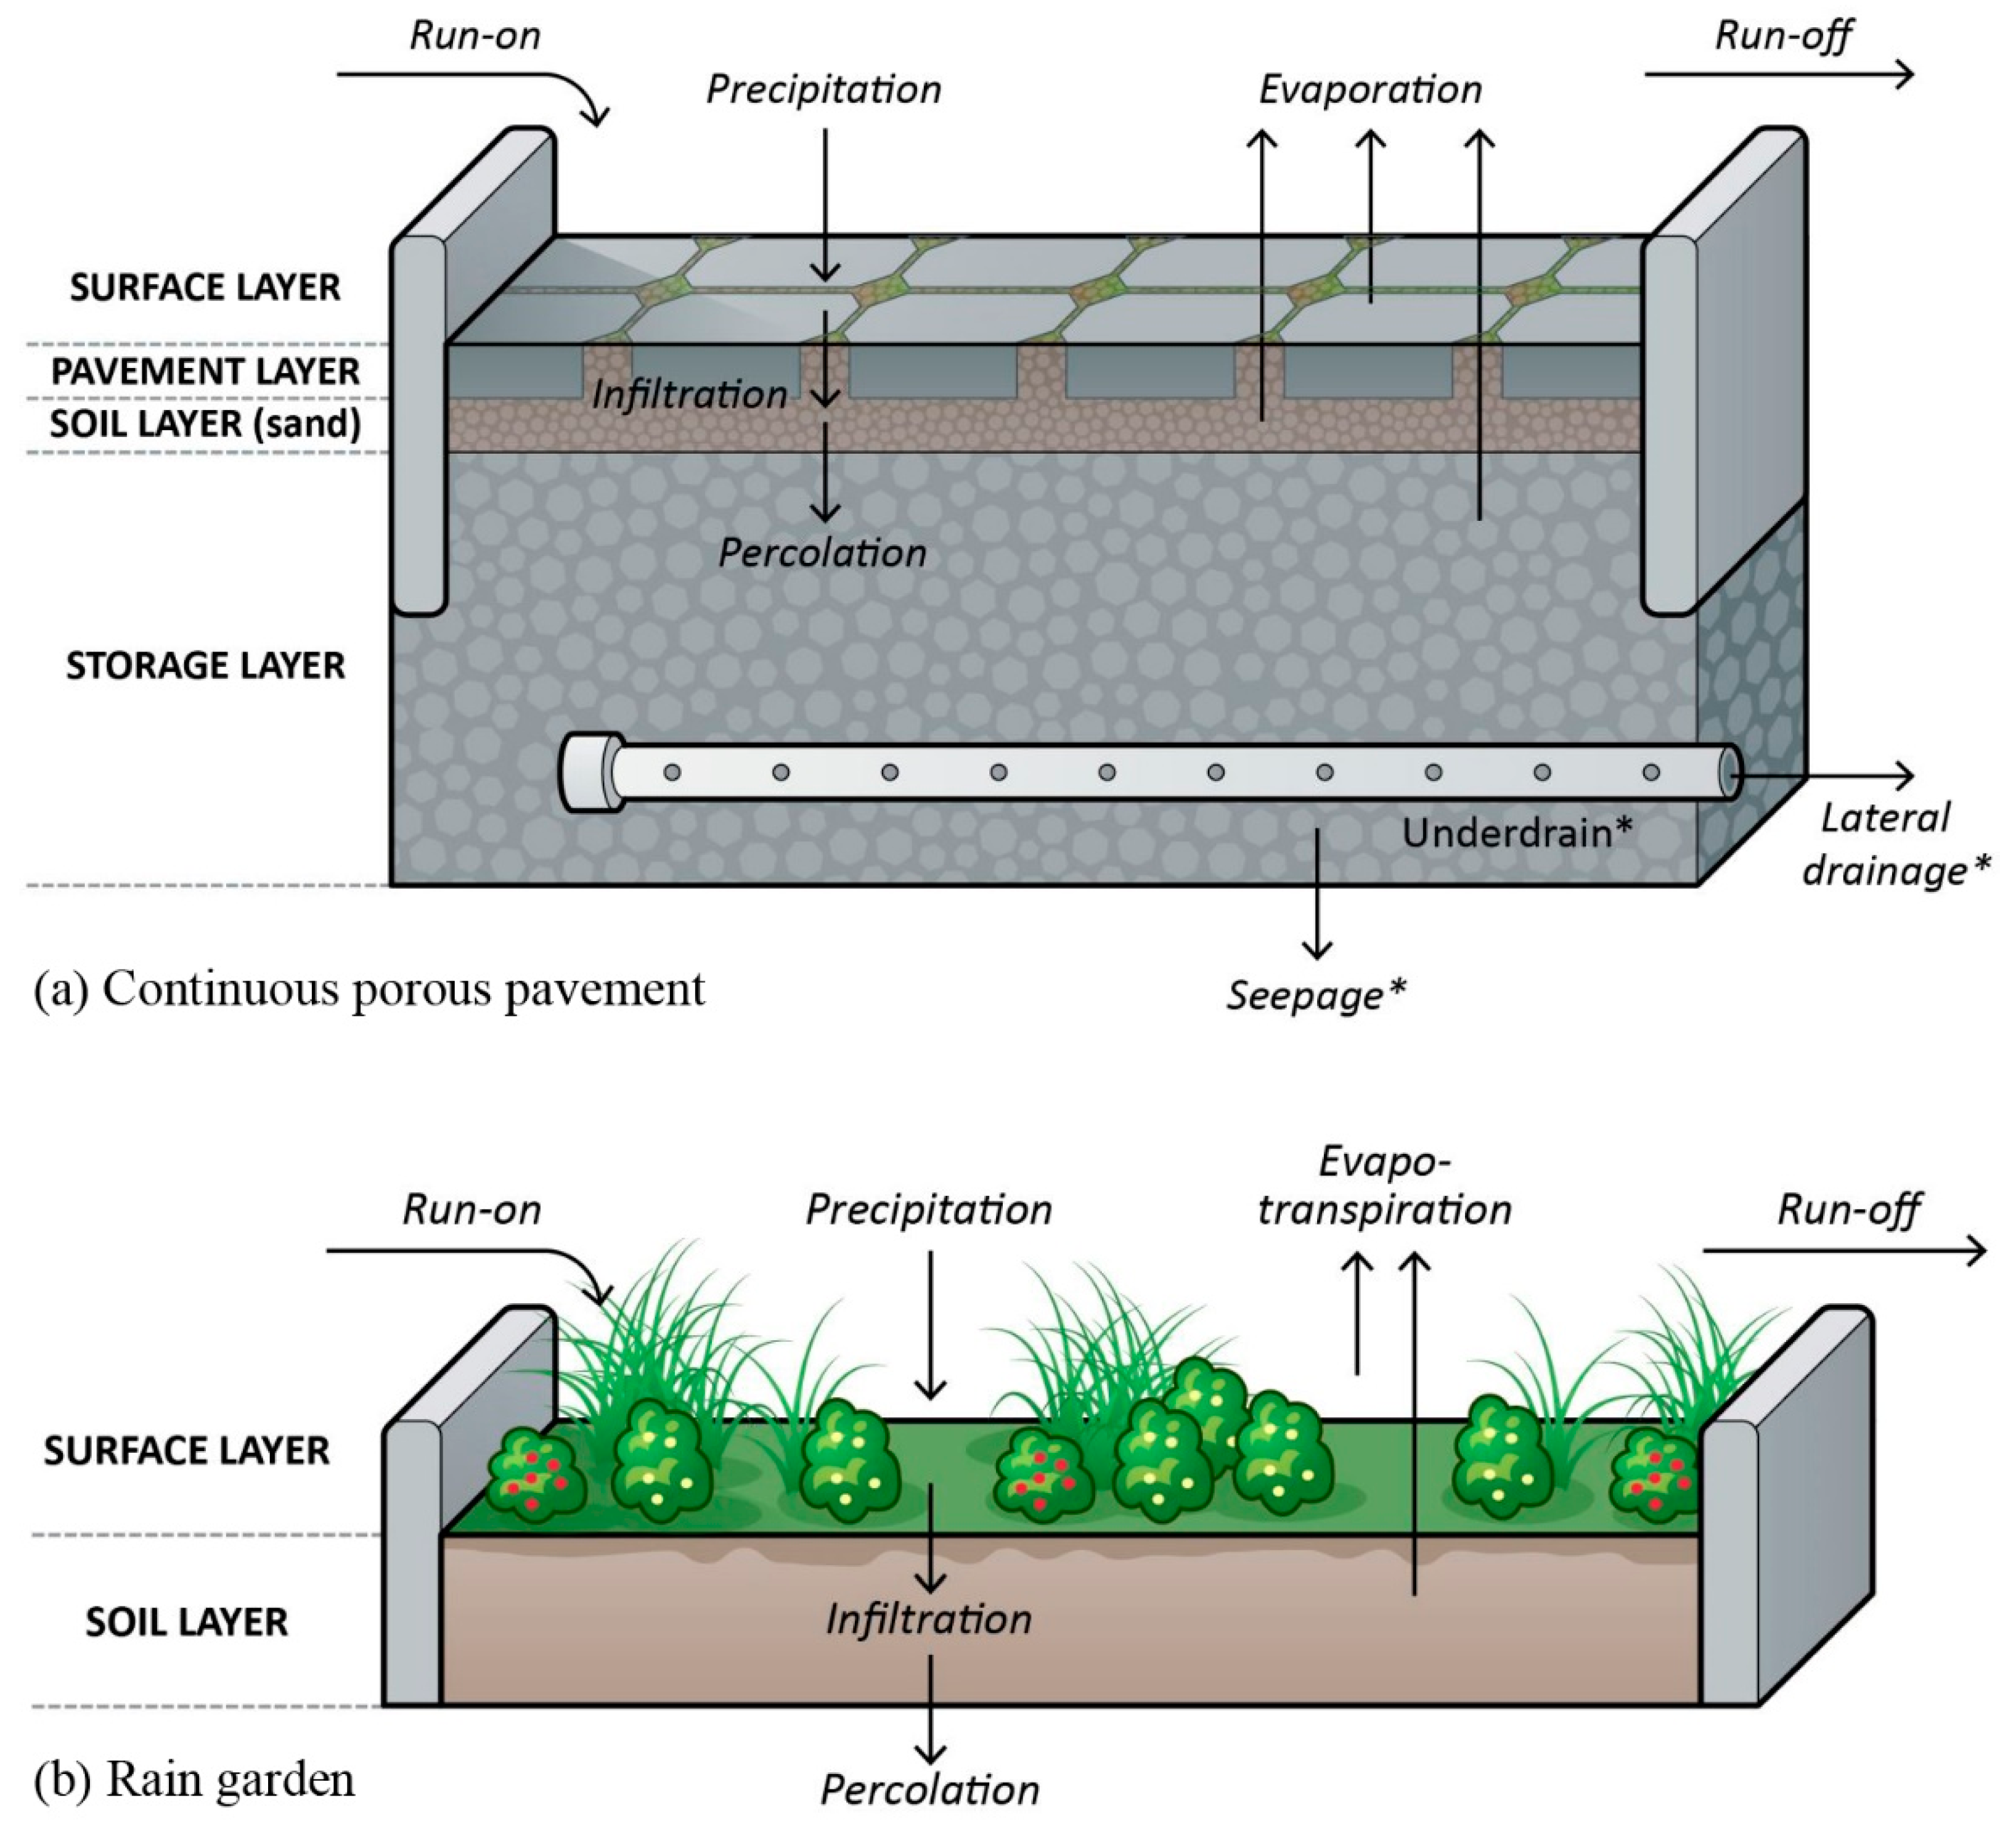
Continuous porous pavement systems (CPPs) are excavated areas filled with gravel and paved over with porous concrete or asphalt mix (Figure 5a) [44]. Normally all rainfall will immediately pass through the pavement into the gravel storage layer below, where it can infiltrate at natural rates into the site’s native soil. The technical specification for pavement of water permeable brick [45] gives the parameters of the continuous porous pavement (Table 5).
A rain garden (RG), also called a storm water garden [46], is a designed depression storage or a planted hole that allows rainwater runoff from impervious urban areas, like roofs, driveways, walkways, parking lots, and compacted lawn areas, the opportunity to be absorbed (Figure 5b). The Rain garden is similar to a bioretention cell with vegetated surface storage and an engineered soil layer without an underlying drainage layer [44]. The technical code for rainwater collection, storage, and utilization [47] gives the parameters of the rain garden (Table 6).
2.4. Performance Metrics Calculation
The ratio of surcharging pipeline, percentage of ponding road, external outflow, infiltration, surface runoff, facility storage, and LID area ratio were used to compare the pervious pavement and rain garden for urban storm management in the south of Taiyuan Basin. Firstly, efficiency is discussed with these indexes, then the scale of LID is evaluated.
2.4.1. Indexes
The ratio of surcharging pipeline is defined as a percentage of surcharging pipeline to the total pipelines.
where is the ratio of surcharging pipeline, is the length of the surcharging pipelines, and is the total length of pipeline.
According to the city planning [36], if the depth of ponding water in a place exceeds 0.15 m, the place is a ponding area. If the depth exceeds 0.5 m, a waterlogging disaster happens.
The percentage of ponding road is calculated in the same way:
where is the percentage of the ponding road, is the area of the ponding road, and is the total area of road.
The external outflow is the sum of the water flowing out of the study area though the rivers, channels, and pipelines. The infiltration is calculated by the Horton’s equation. The surface runoff is modelled by the 2D meshes connected with pipelines, channels, and rivers, and flow out the study area through these conduits. The facility storage is composed of the storage of depression, lakes, and the LID.
LID area ratio means the area occupied by the LIDs with respect to the total area of the building area.
where is the LID area ratio, is the LID area, and is the total area of building.
2.4.2. Comparing the Efficiency of the Two Kinds of LIDs
The waterlog caused by storm water is the main concerning issue for the Taiyuan city. In this paper, we focus on the efficiency of storm water quantity reduction. The building area is intended for residential and commercial use. LIDs could reduce the land area for constructing buildings that might be negative for economy purpose. If the land area covered by the two kinds of LID are the same, the LID that could deal with more storm water is more efficient.
To estimate the efficiency of the pervious pavement and rain garden, we made the assumption that the building area only uses one kind of LID in each scenario. The model was run with the design storms of duration of 180 min and a return period (P) of 10 years. The rainfall duration and the return period were recommended in the special planning for the sponge city of Taiyuan [37]. The LID-occupied area increases from 5% to 30%. The indexes mentioned above are used to estimate the efficiency of the two kinds of LID.
2.4.3. Evaluating the Scale of LIDs
The city planning of the study area shows the pervious area could be 40% [36], so we took 40% as the maximum ratio of the area occupied by LIDs. The design storm had a duration of 180 min and a return period (P) of 10 years. The LID-occupied area increases from 5% to 40%. The indexes mentioned above were used to evaluate the scale of the LID.
3. Results and Discussion
3.1. The Efficiency of the Two Kinds of LID
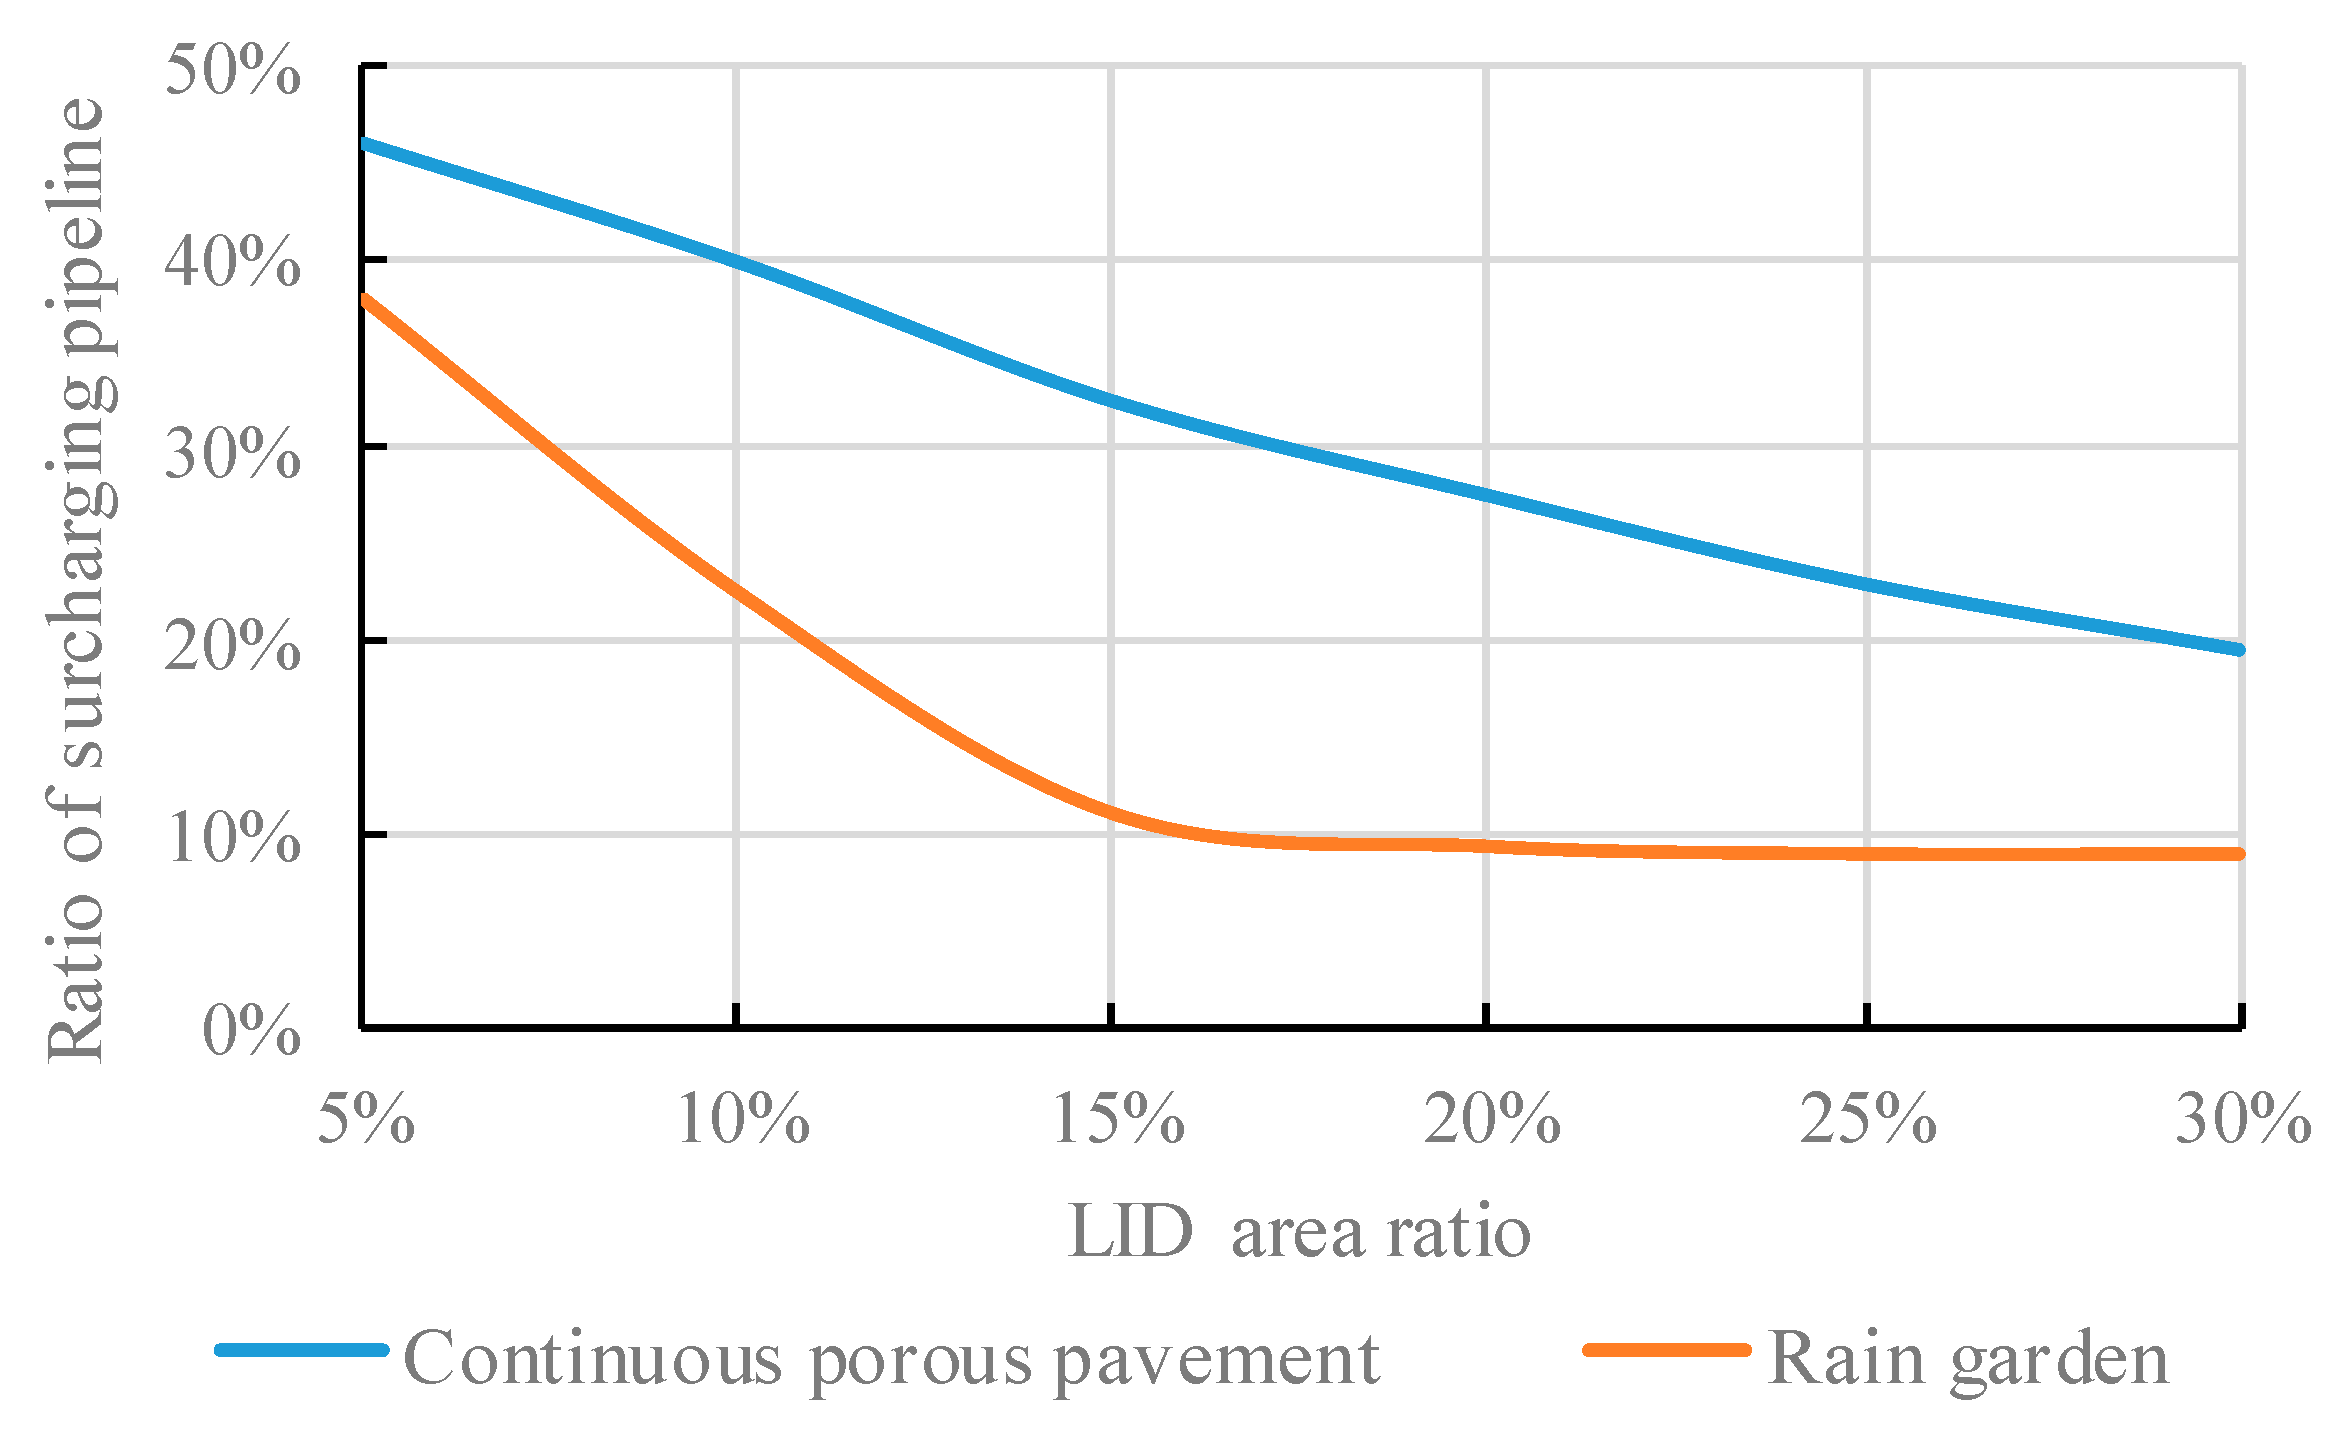
When the LID area increases, the ratio of surcharging pipeline decreases (Figure 6). The rain garden performs more efficiently than the continuous porous pavement. Taking the storms of duration of 180 min and return period (P) of 10 years as an example, when the LID area ratio is 10%, the continuous porous pavement could reduce the ratio of surcharging pipeline to 40%, and the rain garden could reduce it to 22%. If it needs to reduce the ratio of surcharging pipeline to 30%, the LID area ratio of the rain garden is 8%, but the continuous porous pavement is 17%.
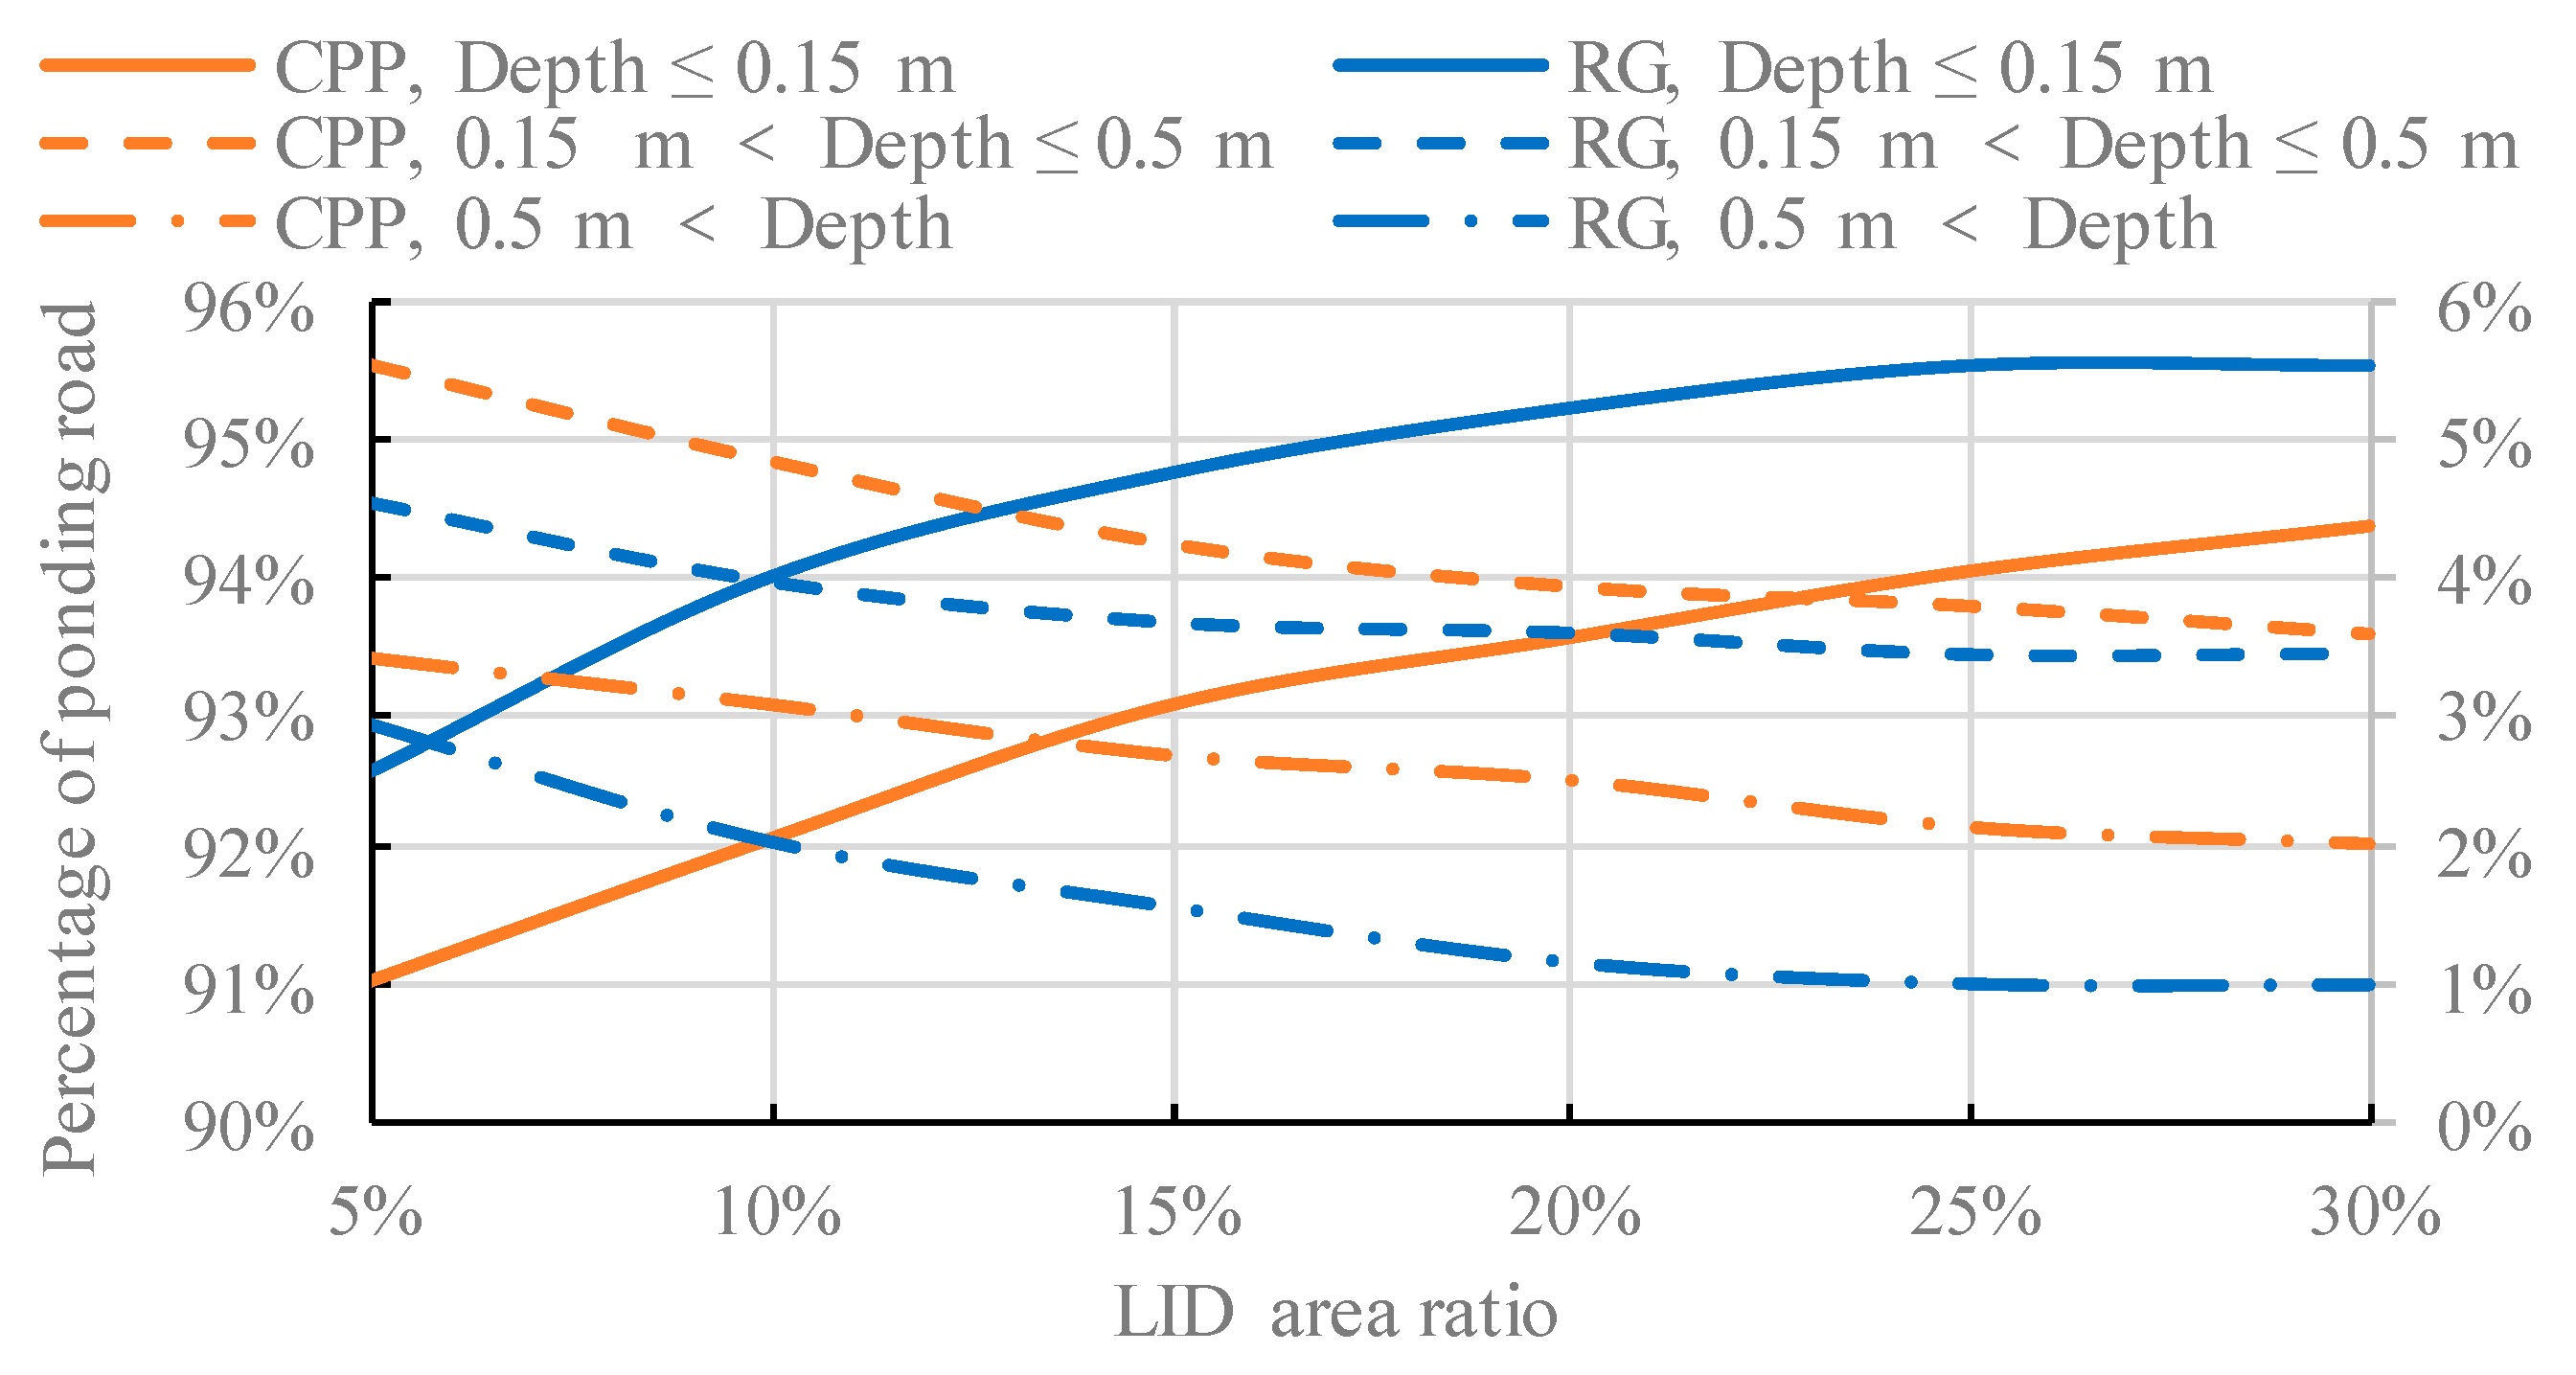
When the LID area increases, the non-ponding area increases, and the ponding area decreases (Figure 7). The rain garden performs more efficiently than the continuous porous pavement. Taking the storms of duration of 180 min and return period (P) of 10 years as an example, when the LID area ratio is 10%, the continuous porous pavement could reduce the ratio of the road area whereby the depth of ponding water in a place exceeds 0.5 m to 3%, and the rain garden could reduce it to 2%. If it needs to reduce the ratio to 2%, the LID area ratio of the rain garden is 10%, but the continuous porous pavement is 25%.
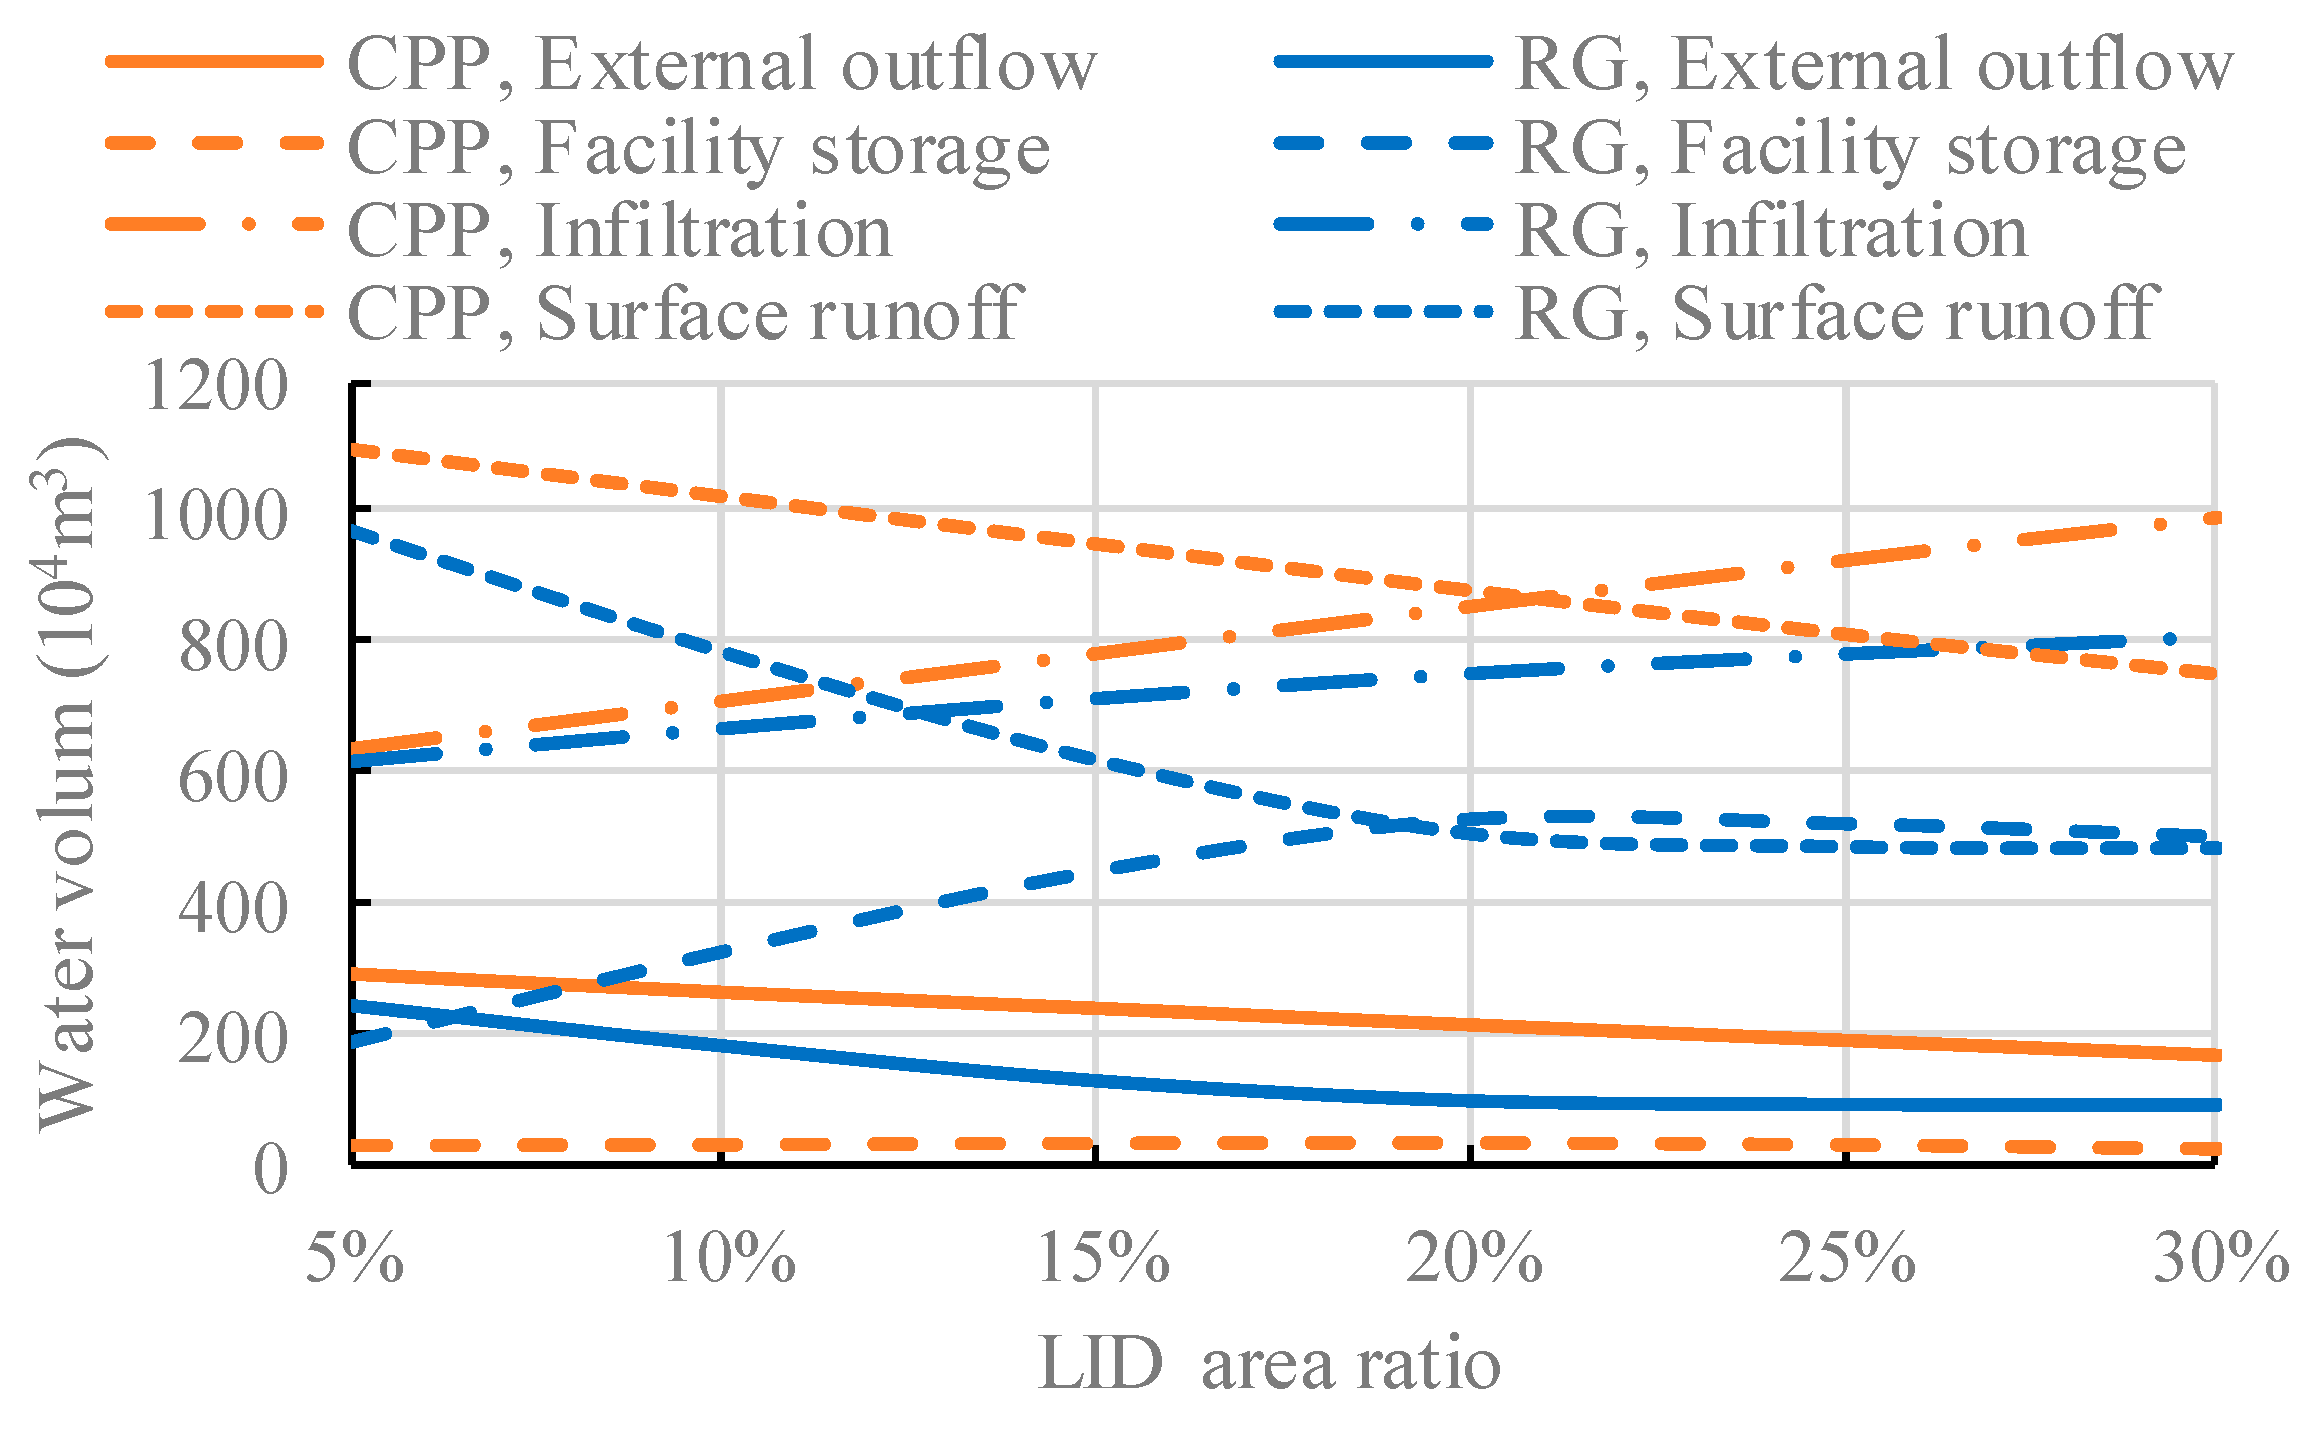
When the LID area increases, the external outflow decreases (Figure 8). The rain garden performs more efficiently than the continuous porous pavement. Taking the storms of duration of 180 min and return period (P) of 10 years as an example, when the LID area ratio is 10%, the continuous porous pavement could reduce external outflow to 2.7 million m3, and the rain garden could reduce it to 1.8 million m3. If it needs to reduce the external outflow to 2 million m3, the LID area ratio of the rain garden is 8%, but the continuous porous pavement is 23%.
When the LID area increases, the surface runoff decreases (Figure 8). The rain garden performs more efficiently than the continuous porous pavement. Taking the storms of duration of 180 min and return period (P) of 10 years as an example, when the LID area ratio is 10%, the continuous porous pavement could reduce surface runoff to 10 million m3, and the rain garden could reduce it to 8 million m3. If it needs to reduce the surface runoff to 8 million m3, the LID area ratio of the rain garden is 10%, but the continuous porous pavement is 25%.
When the LID area increases, the infiltration increases and the continuous porous pavement performs more efficiently than the rain garden (Figure 8). But the rain garden could store more water than the continuous porous pavement (Figure 8).
According to the effect and efficiency of the two kinds of LID, the rain garden performs better than the continuous porous pavement, thus the rain garden could be used as the main LID of the study area. But this finding is different from the literature [33], which found the permeable pavement to provide higher reduction rates of runoff than the rain garden. In the literature [33], the permeable pavement had a berm height of 25 mm, thickness of pavement layer of 60 mm, and thickness of storage layer of 250 mm. With the berm height, the permeable pavement could intercept more runoff, the thinner pavement layer and thicker storage layer are better for infiltration. The vegetation volume fraction of literature [33] was 0.1; the vegetation could occupy more volume that might be used to intercept runoff. Therefore, it could be the structures of the permeable pavement and rain garden that cause the different results.
3.2. The Scale of Rain Garden
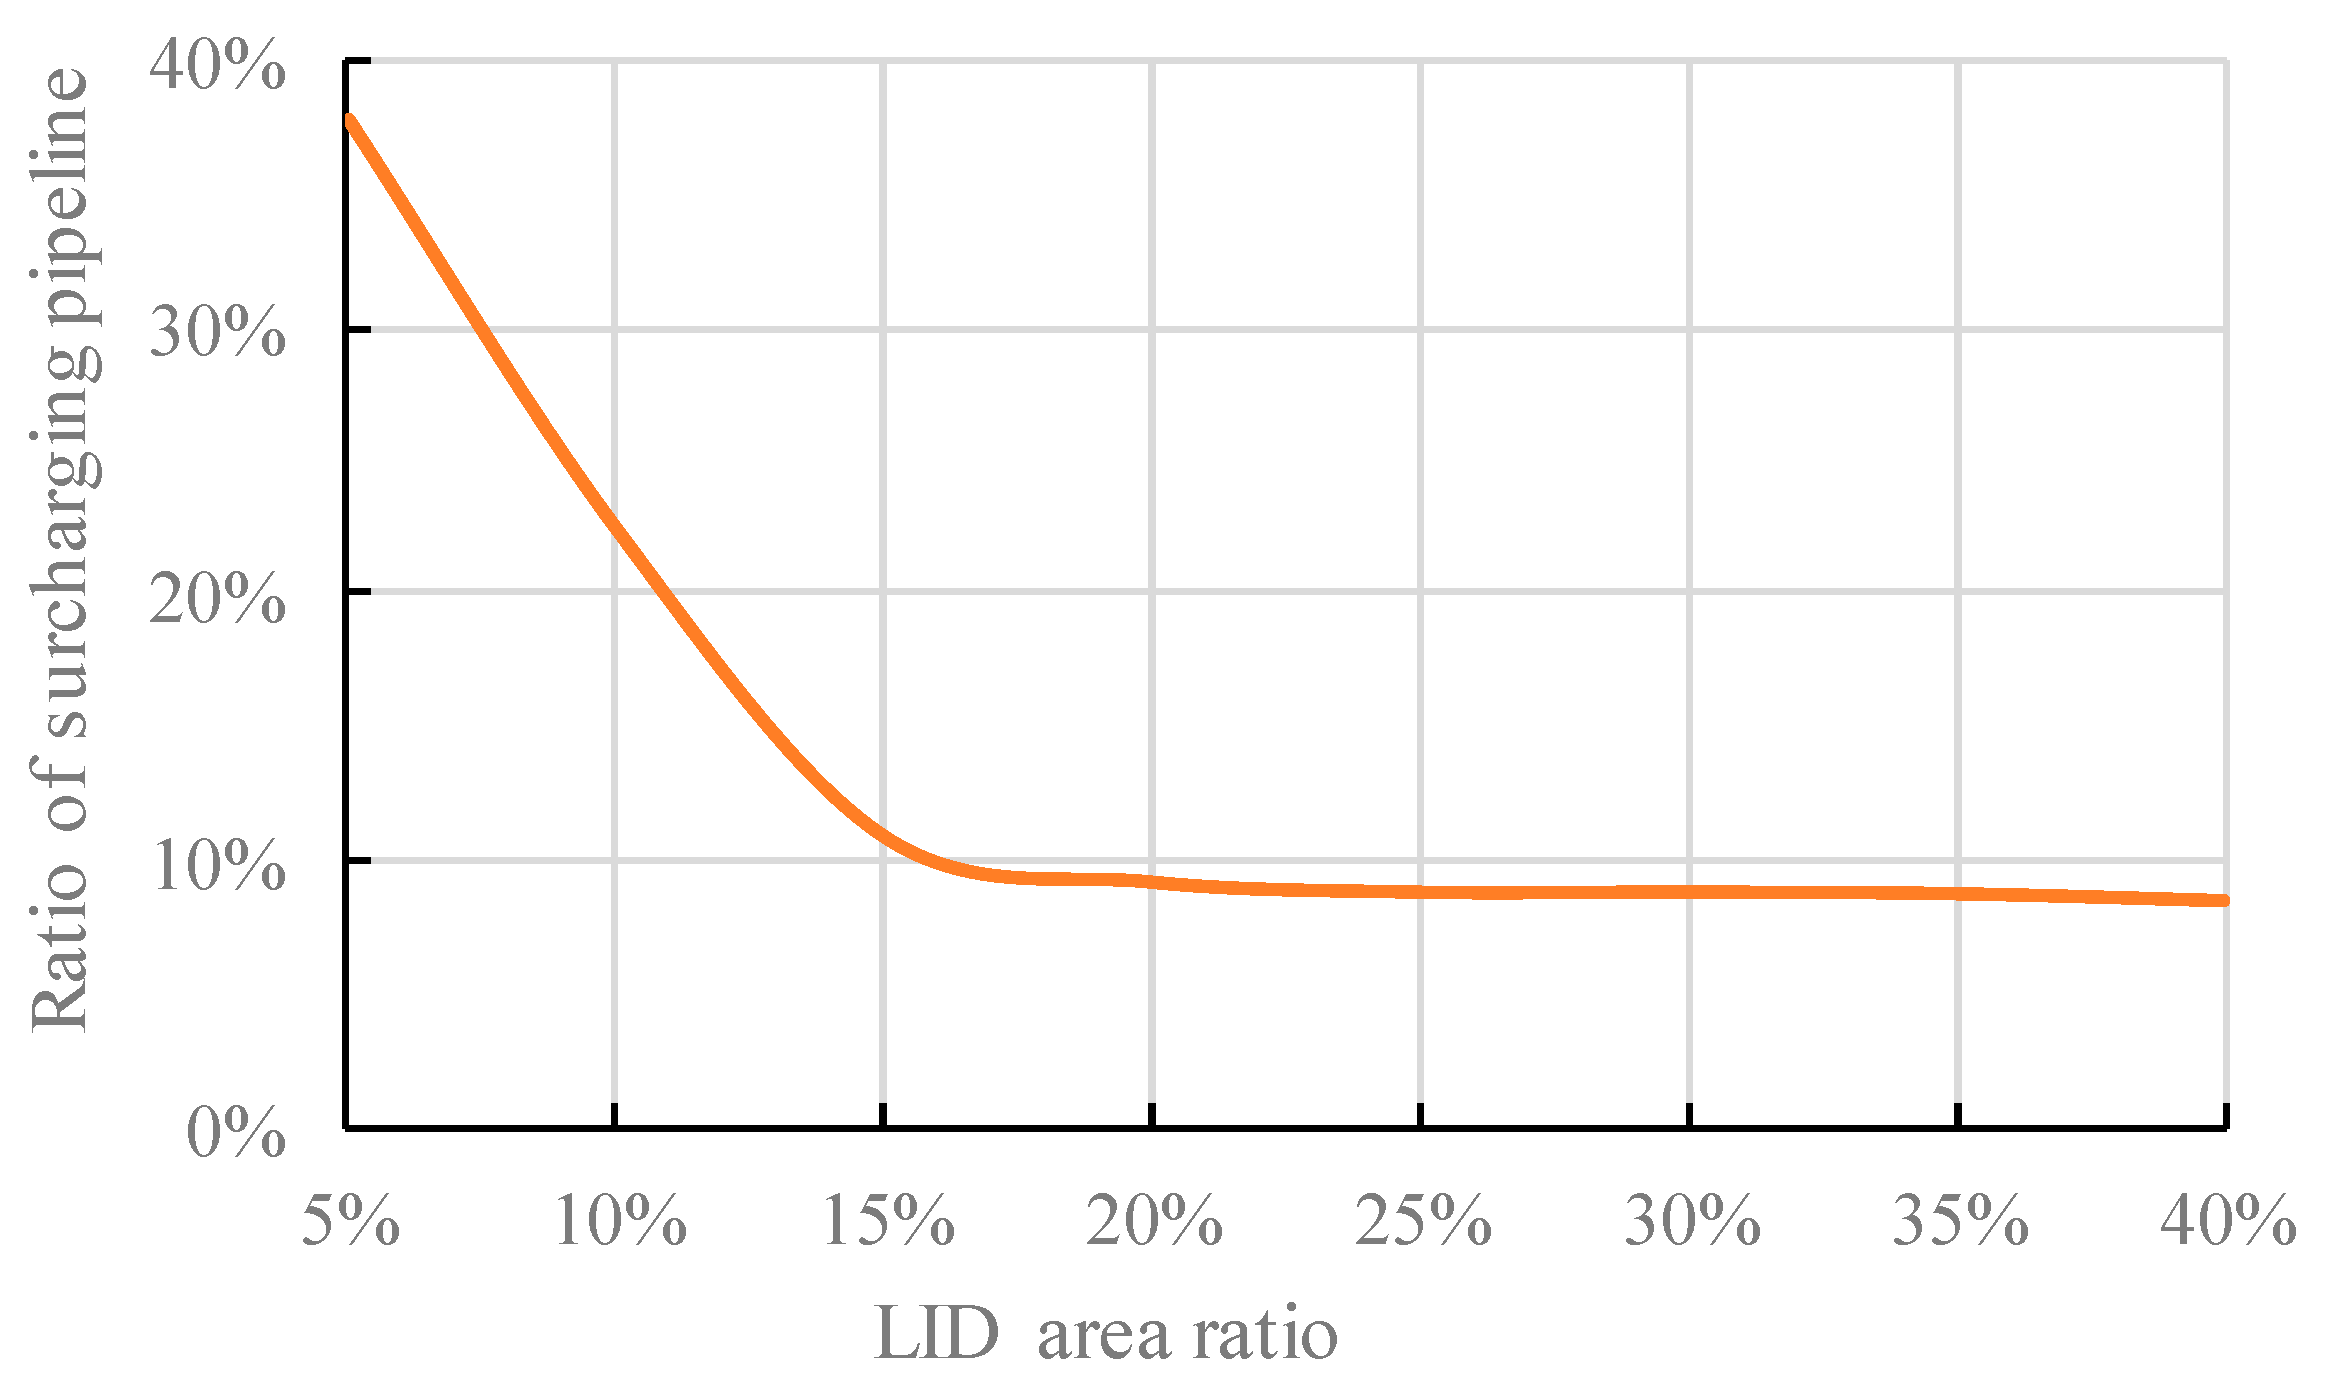
The LID area of the rain garden was evaluated. If the LID area is between 5% and 15%, the rain garden has good performance on reducing the surcharging pipelines. However, when the LID area ratio exceeds 15%, increasing LID area is not much help for reducing the surcharging pipelines (Figure 9).
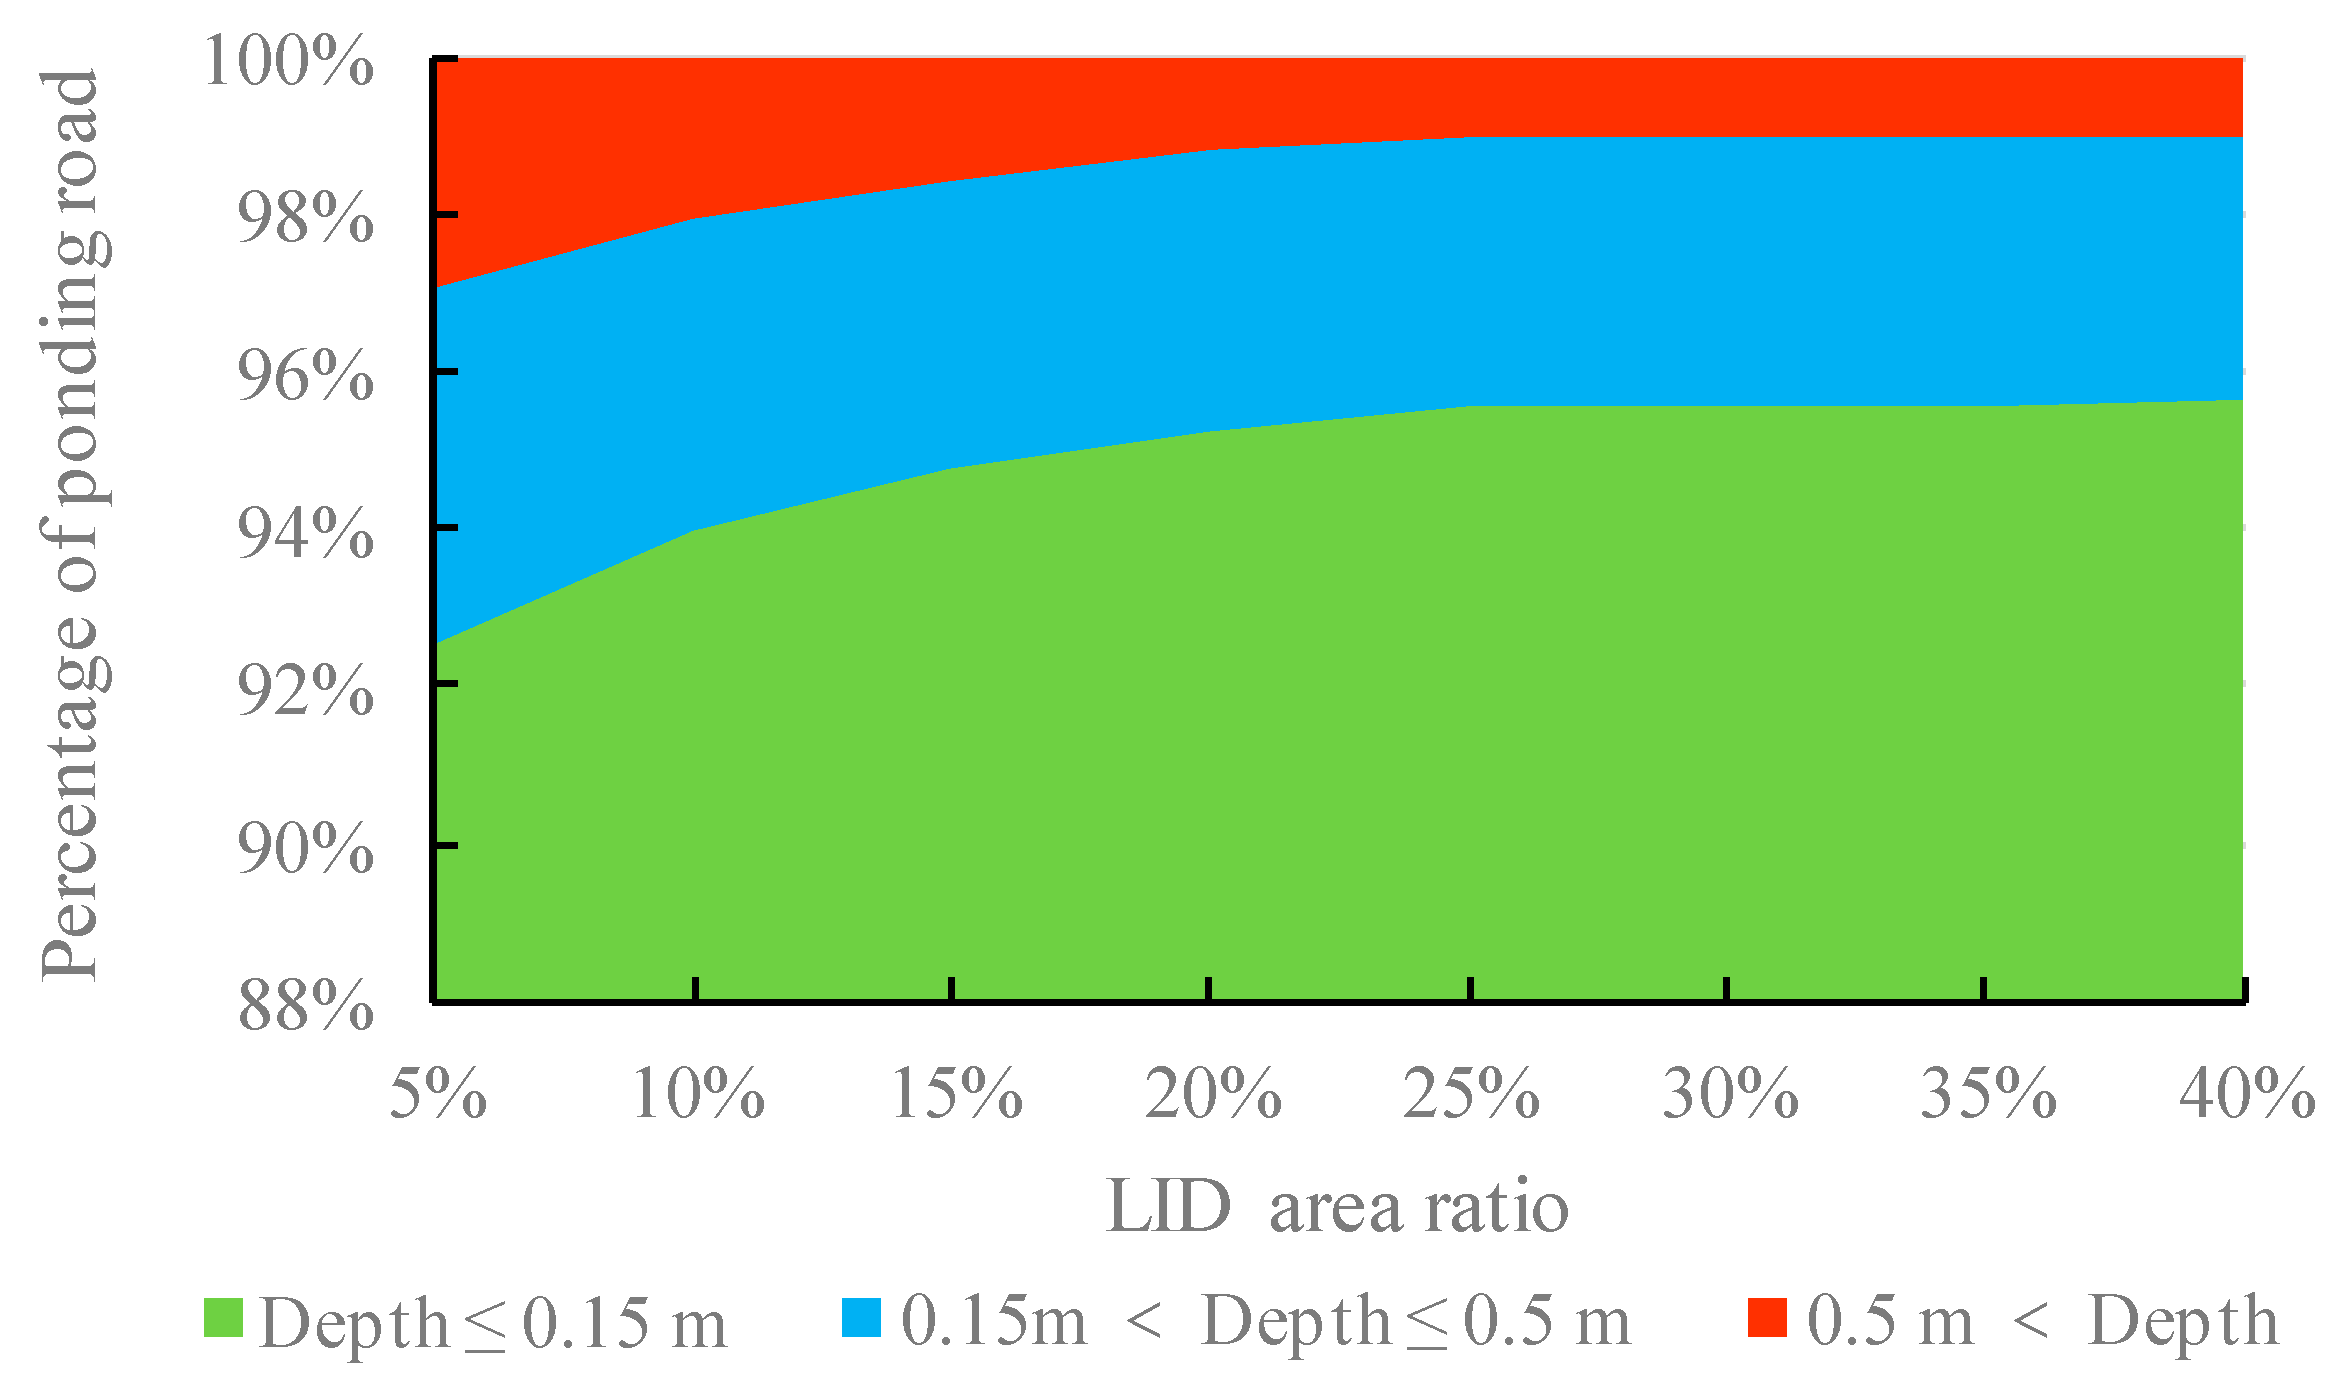
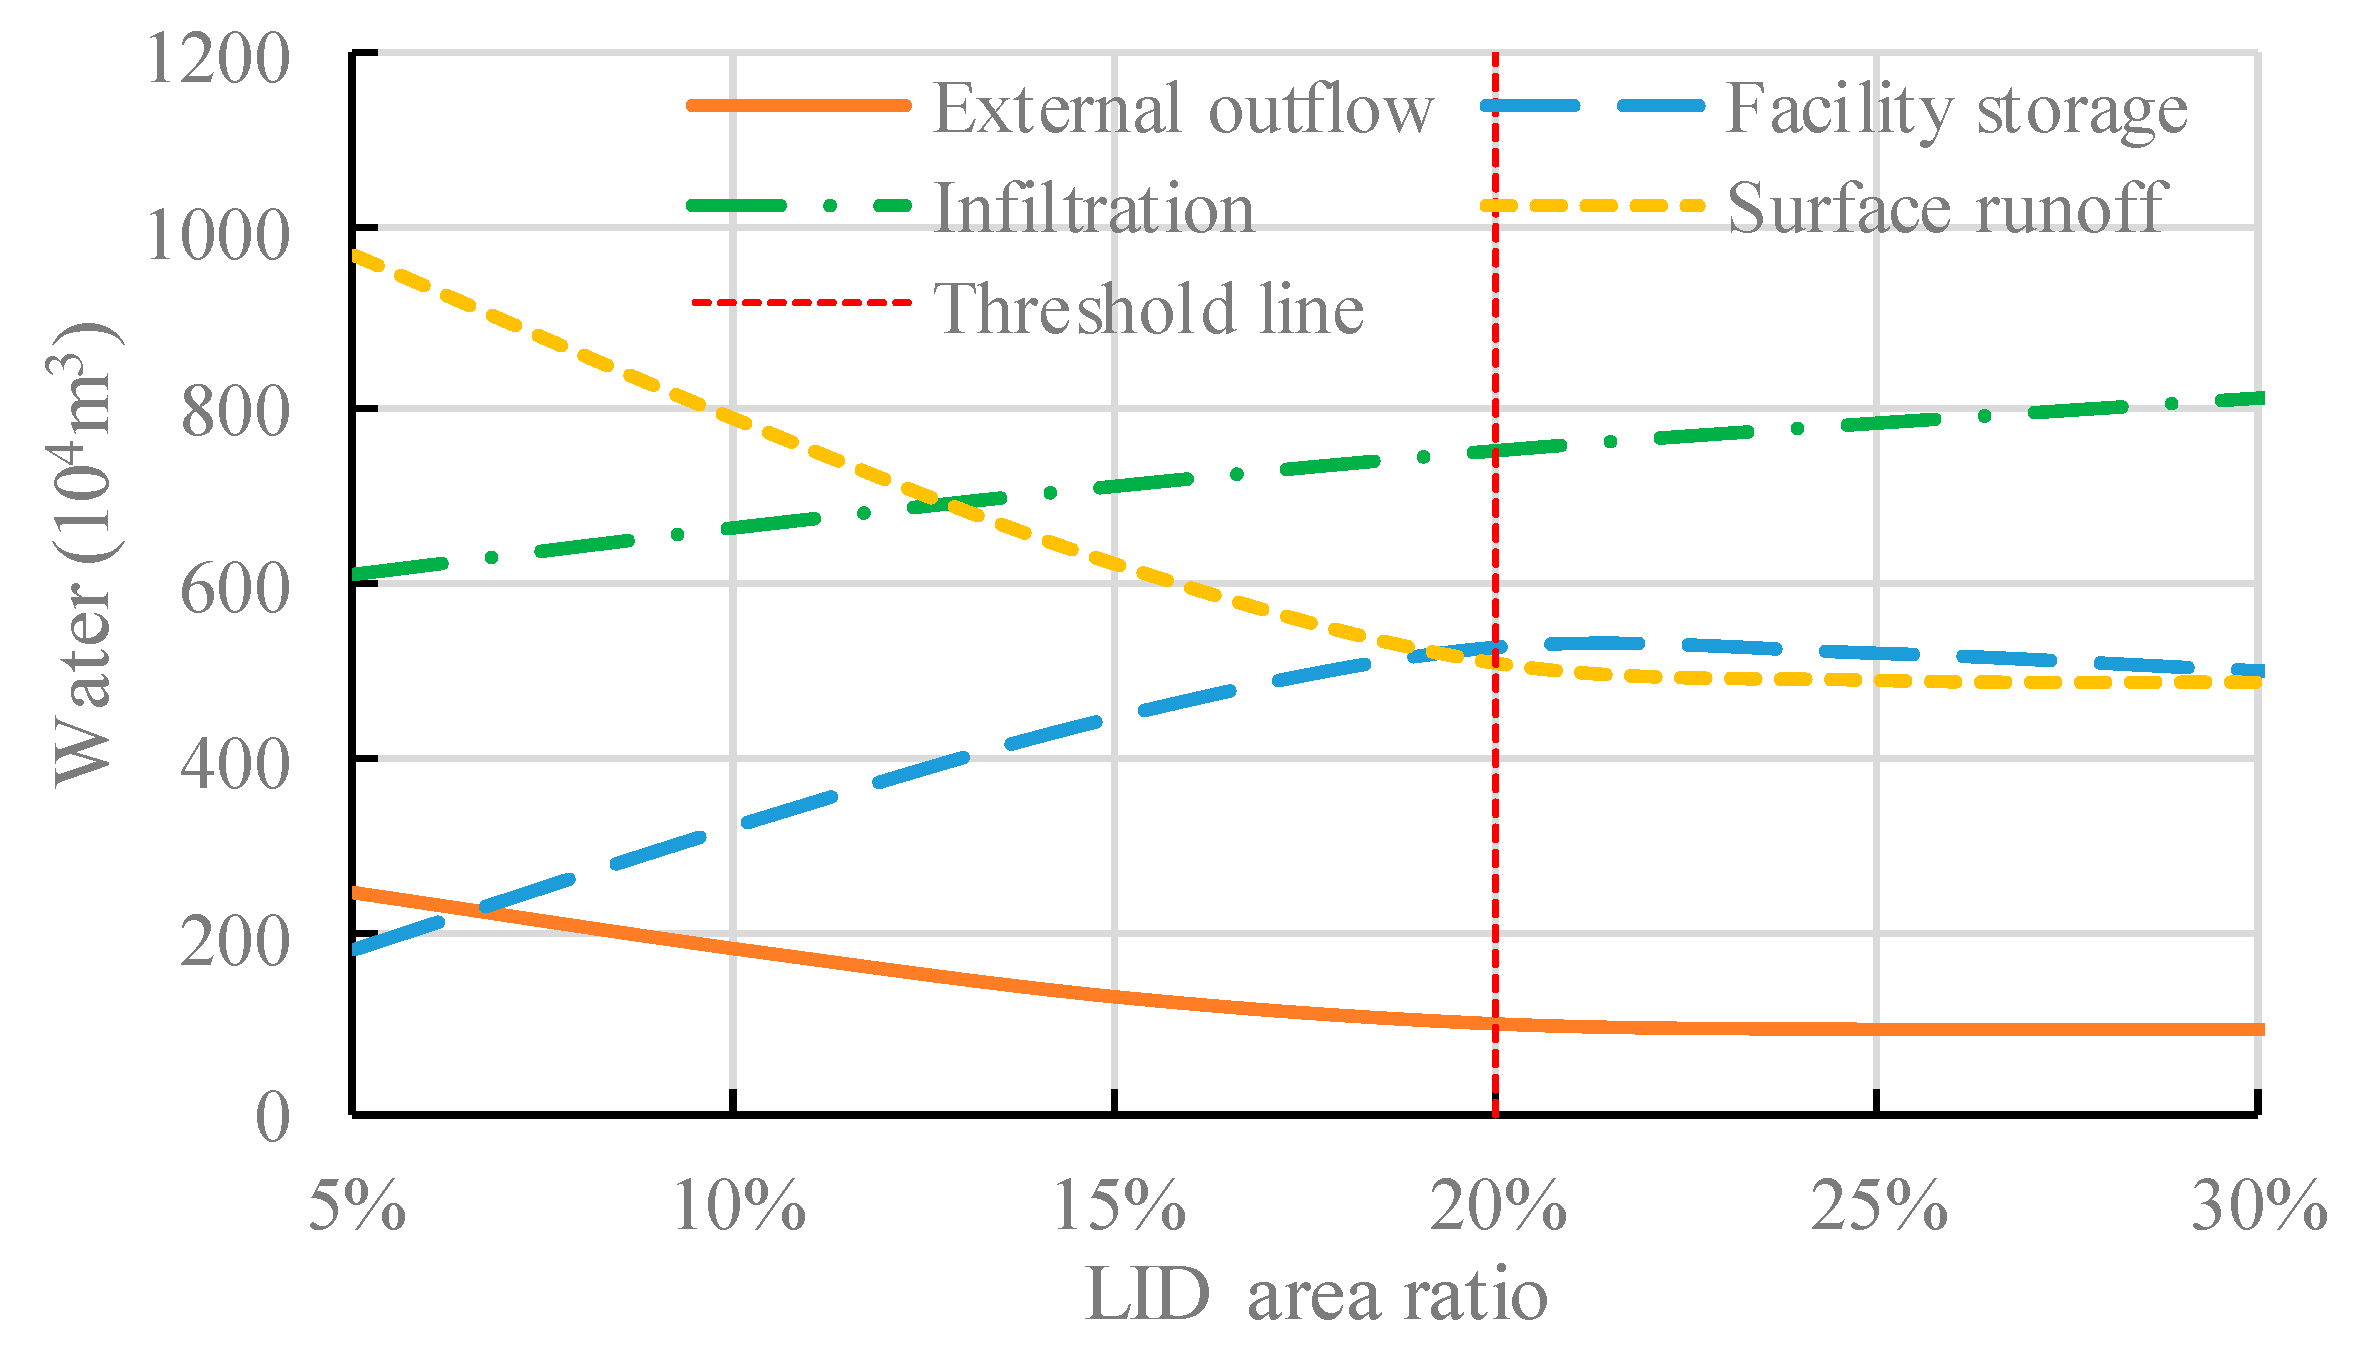
With the increase of the LID area, the rain garden could reduce more ponding area, external outflow, and surface flow, and increase more storage and infiltration. But if the LID area ratio exceeds 20%, all these performances of the rain garden tend to stabilize (Figure 10 and Figure 11). It is suggested that the maximum LID area ratio of the rain garden be 20%. At that ratio, the storm water control could be effective and efficient, and more precious land could be used for residential and commercial purposes.
Figure 9, Figure 10 and Figure 11 show that the rain garden might have an optimum area ratio. The optimum area ratio might relate to the maximum water processed by the rain garden and the total rainfall needed to be treated. The building area is about 133 km2. Without the rain garden, the runoff needed to be treated from the building area is about 6.58 million m3. When the LID area ratio of the rain garden is 20%, the maximum water processed by the rain garden approaches the runoff needed to be treated. Thus, when the LID area ratio exceeds 20%, the performances of the rain garden tend to stabilize. A few researches show that the LID area ratio is about 50% [48,49]. In the cities with wetter climates, the ratio could increase with the rainfall needed to be treated. The ratio could reach 50% of the impervious area in Xi’an city [48], whose mean annual precipitation is about 719 mm. The drainage system could reduce the water treated by the LIDs, so the capacity of the drainage system also affects the LID area ratio. Changzhou city, with a mean annual precipitation of about 1150 mm, is located in eastern China. With a better drainage system, the proportion of maximum LID area of the Changzhou city approximates 50% [48]. The ratio of 20% is just suitable for the south of Taiyuan in the city planning scenarios. For different cities, the LID area ratio should be analyzed on the basis of corresponding climate and city planning.
3.3. Performance of Rain Garden
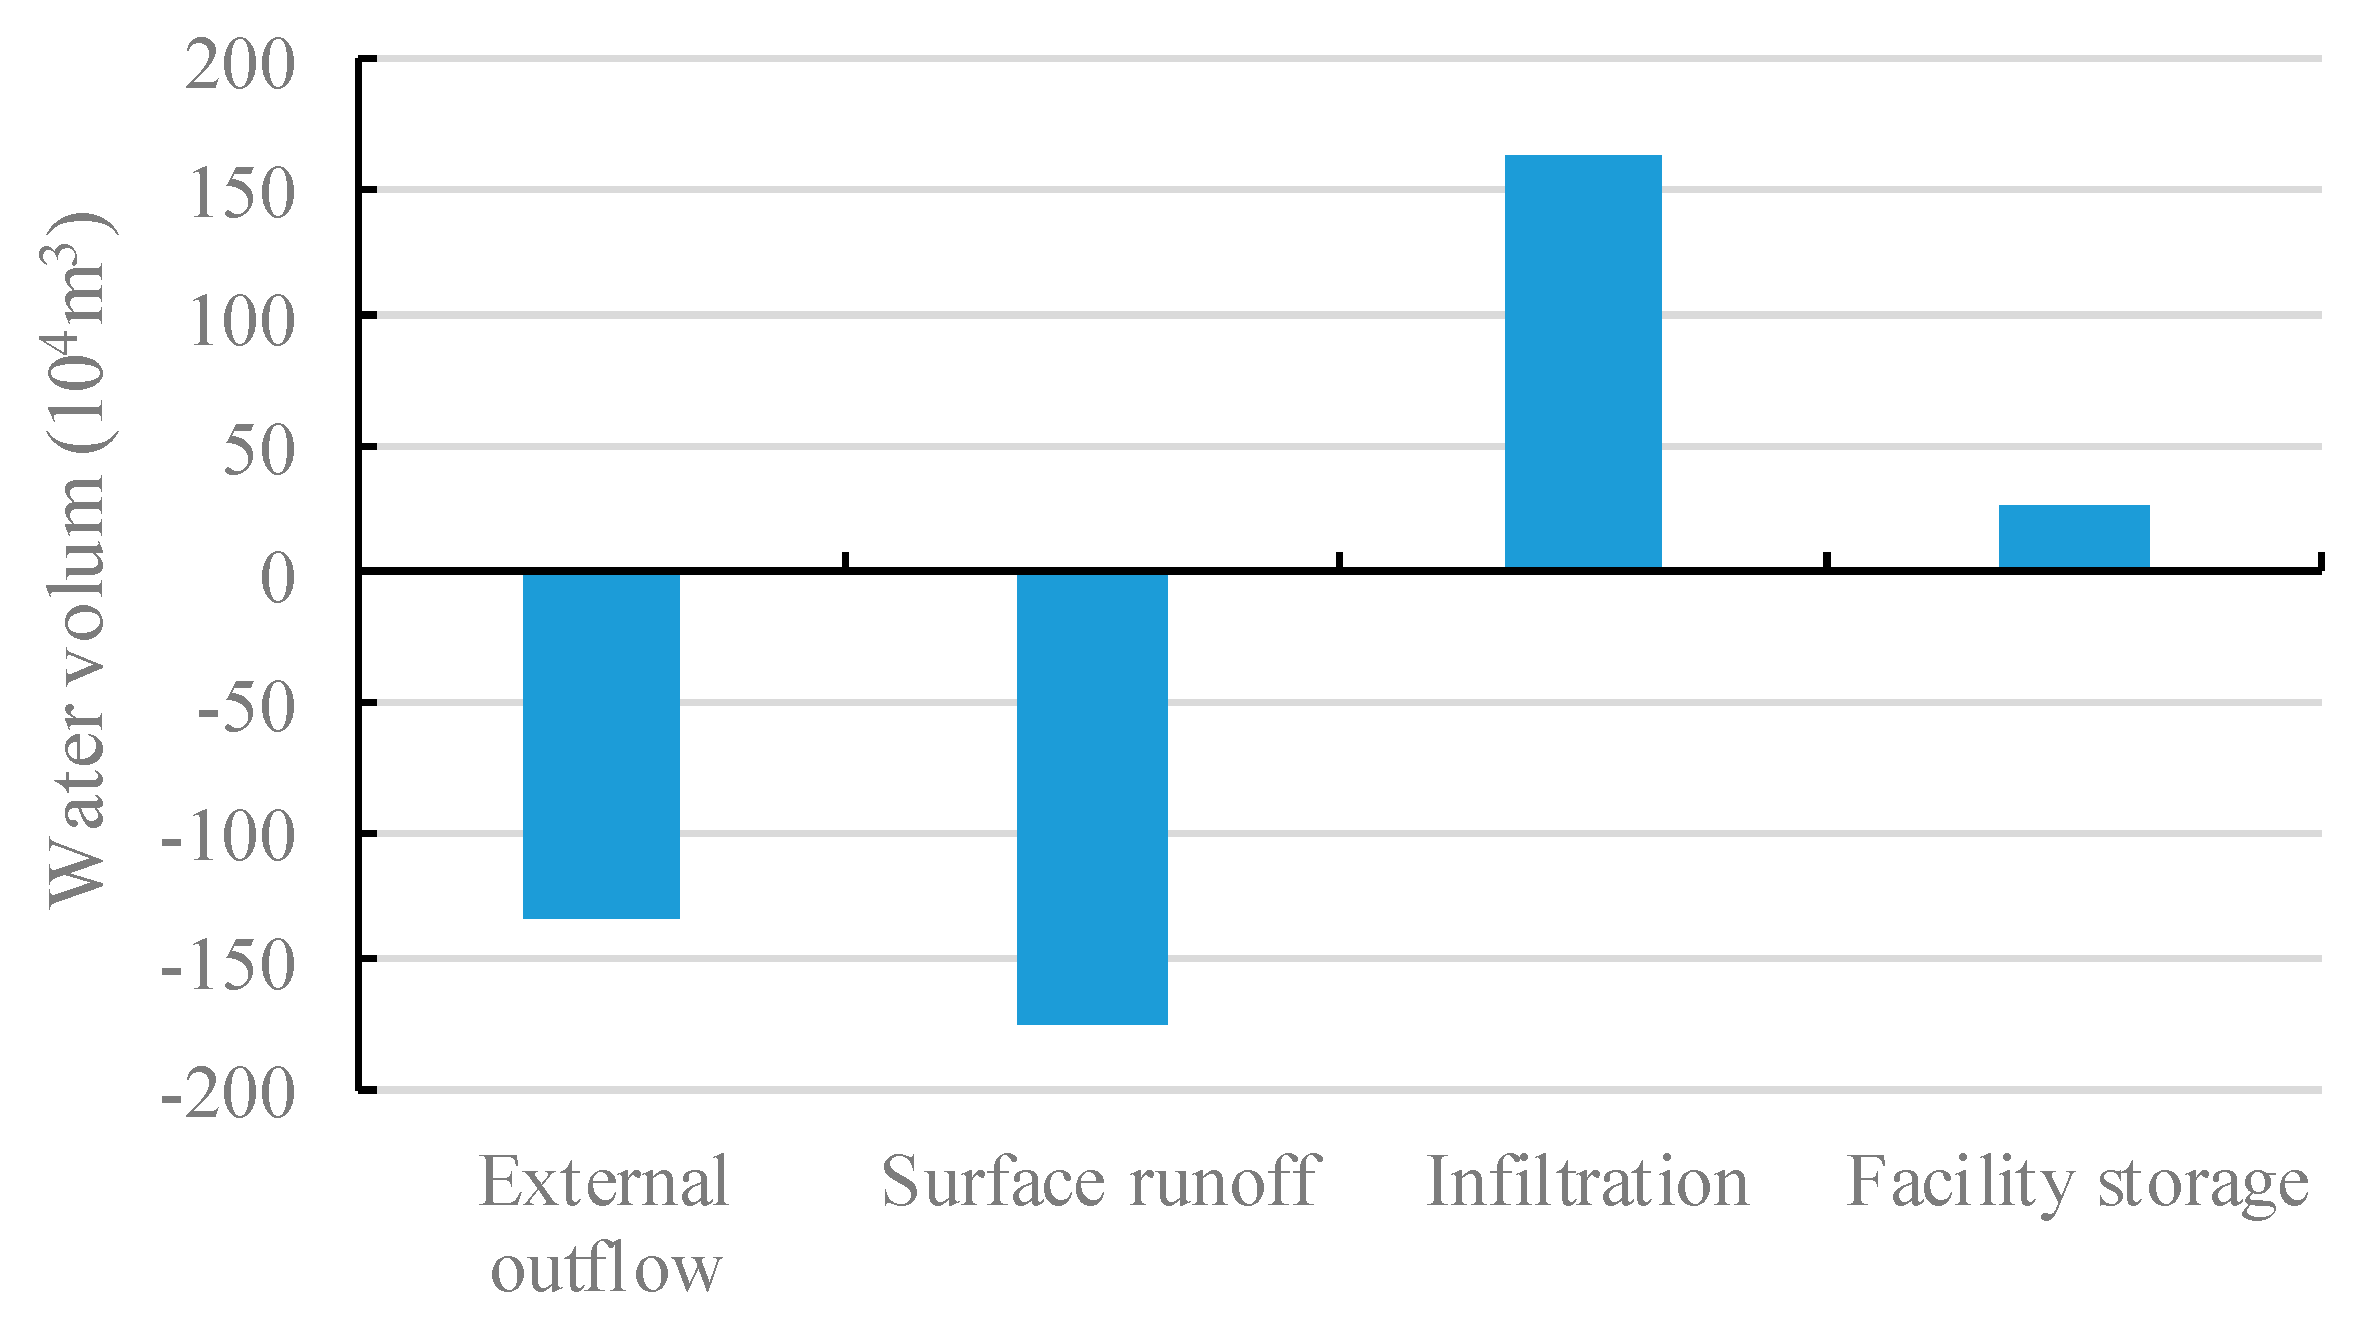
To analyze the performance of the rain garden, we made the assumption that the LID area ratio was 20%. The model was run with the heavy rainfall in July 2016 (Figure 2b), which caused the most serious damage to the city in the recent decades. We compared the rain garden scenario with the no LID scenario. The indexes mentioned above were used to evaluate the performance of the rain garden.
Without LID, the ratio of surcharging pipeline is 37.75%. When the rain garden is applied, the ratio of surcharging pipeline decreases to 11.81%. Both scenarios have the same pipeline system, so it means less water gets into the pipelines. It could be proofed by the variation of the external outflow, surface flow, infiltration, and storage.
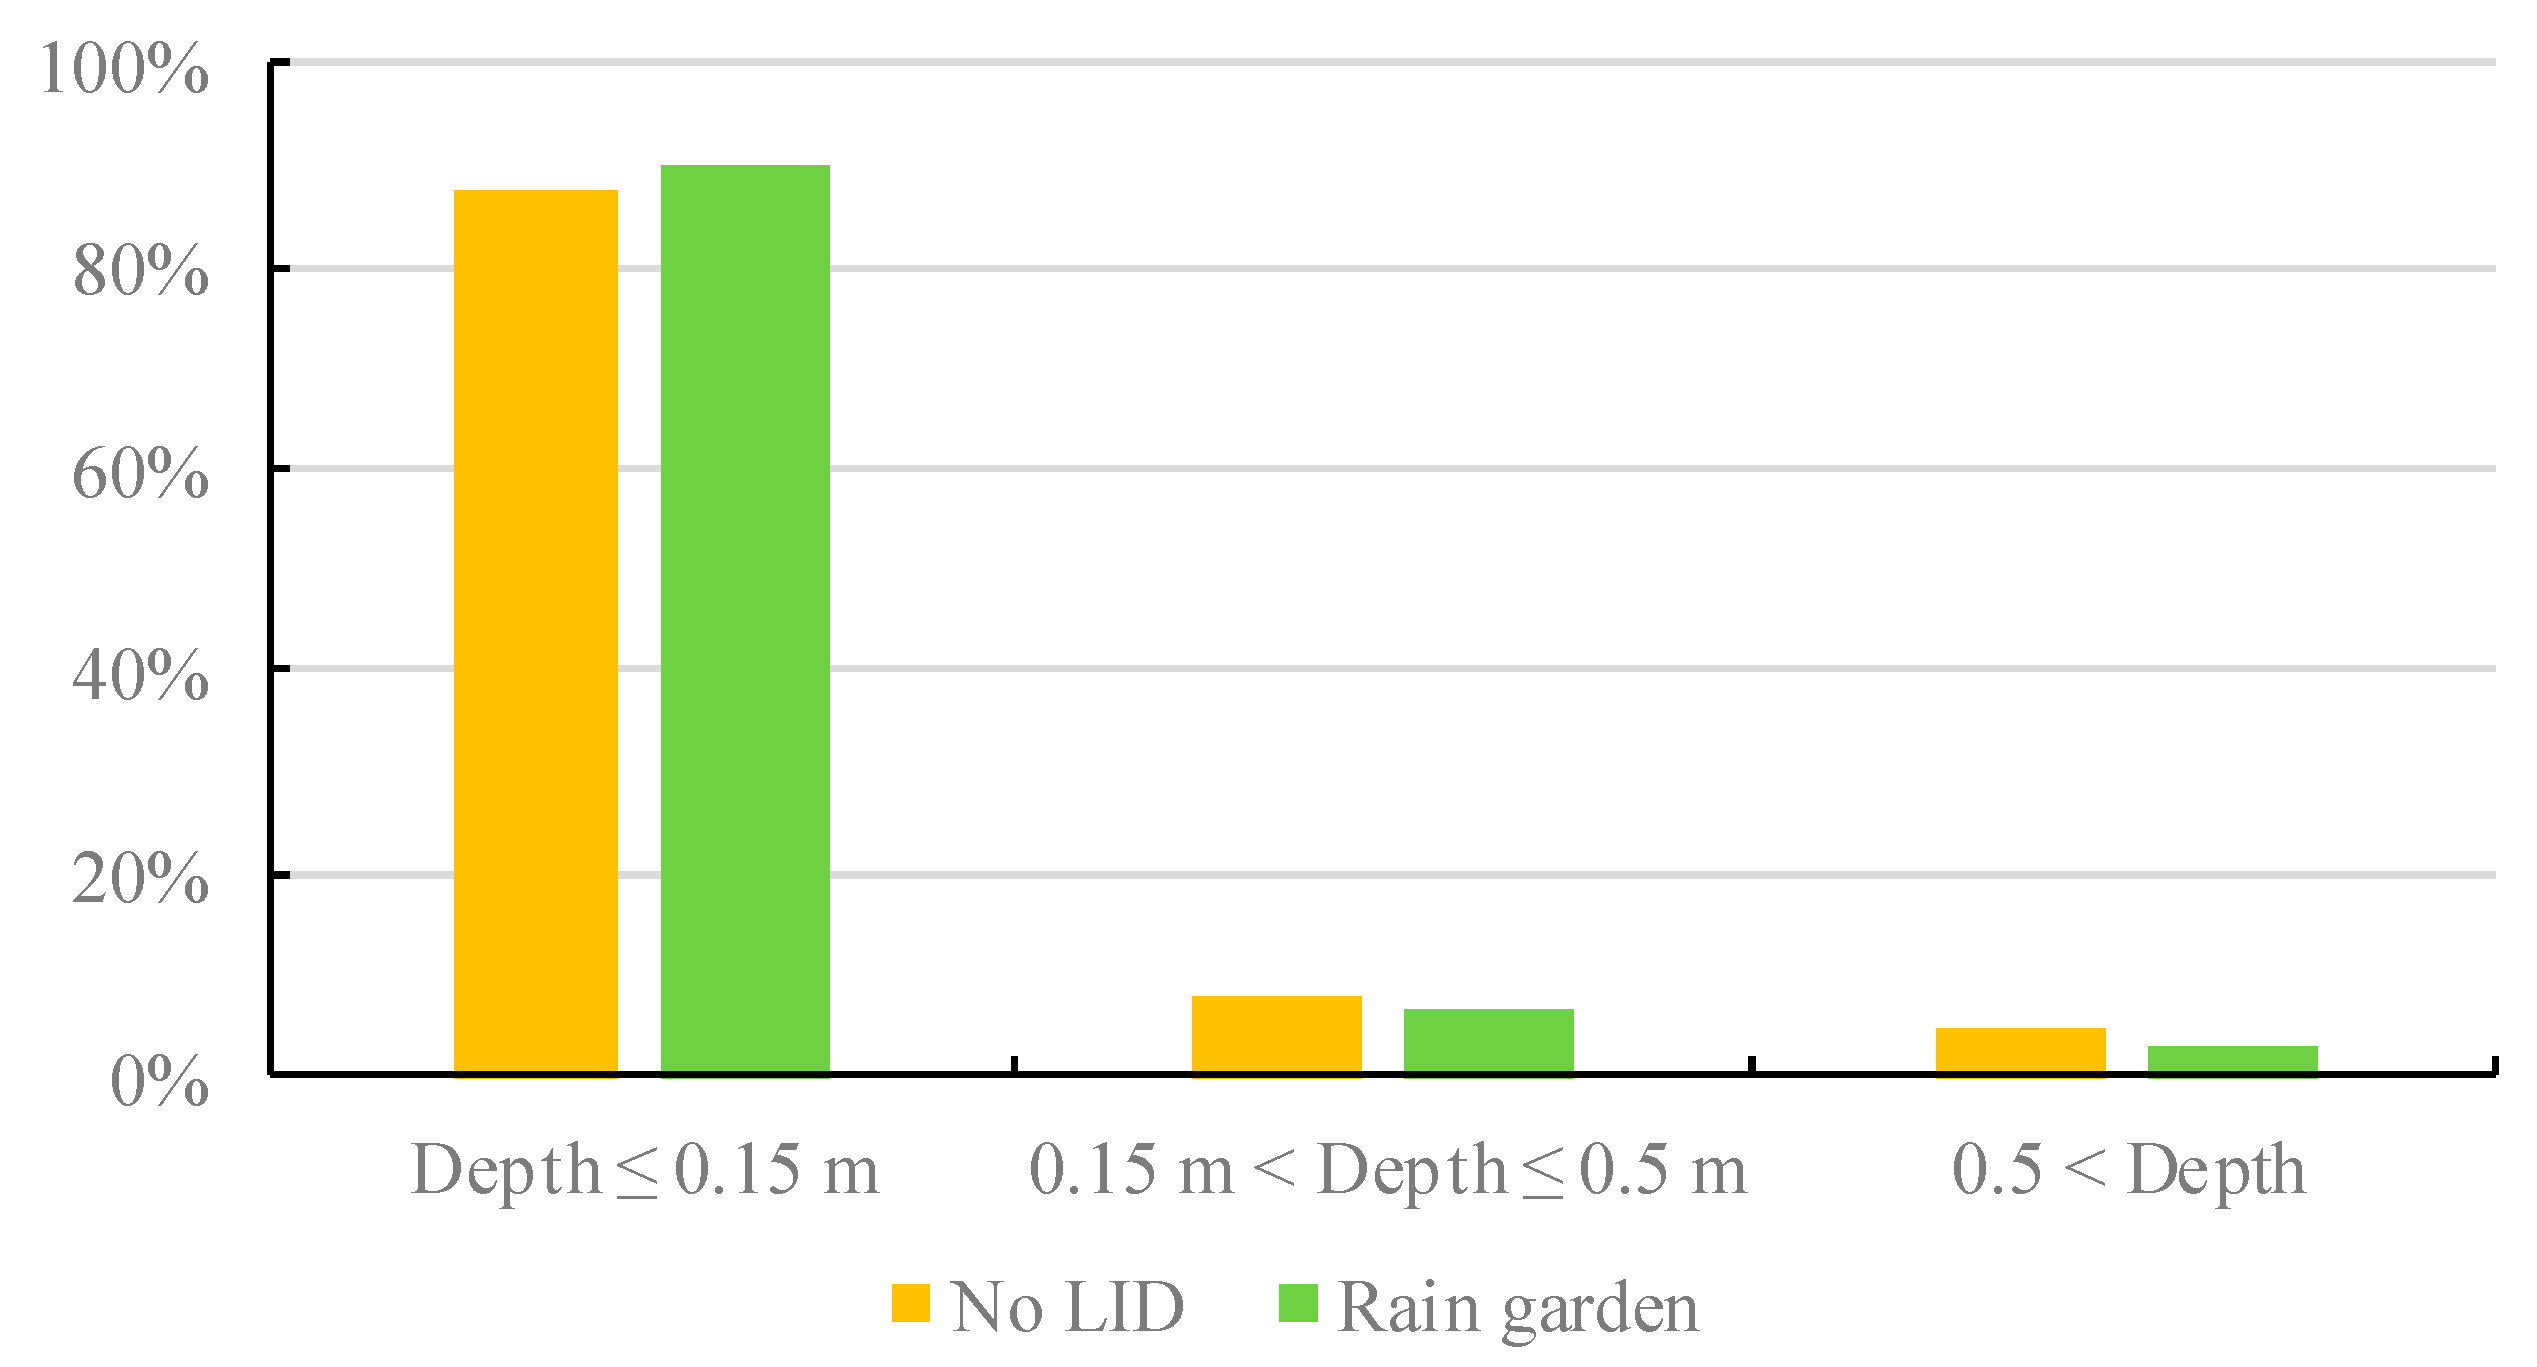
With help of the rain garden, the ponding road, the external outflow, and the surface flow decrease, and the infiltration and storage increase (Figure 12 and Figure 13). The ponding roads decrease about 3%. The rain garden could store the rainfall, it reduces the water that gets into the pipeline, and it also leads to the reduction of runoff and external outflow. As the duration increases, the stored water infiltrates into the soil, so the infiltration increases more than the stored water.
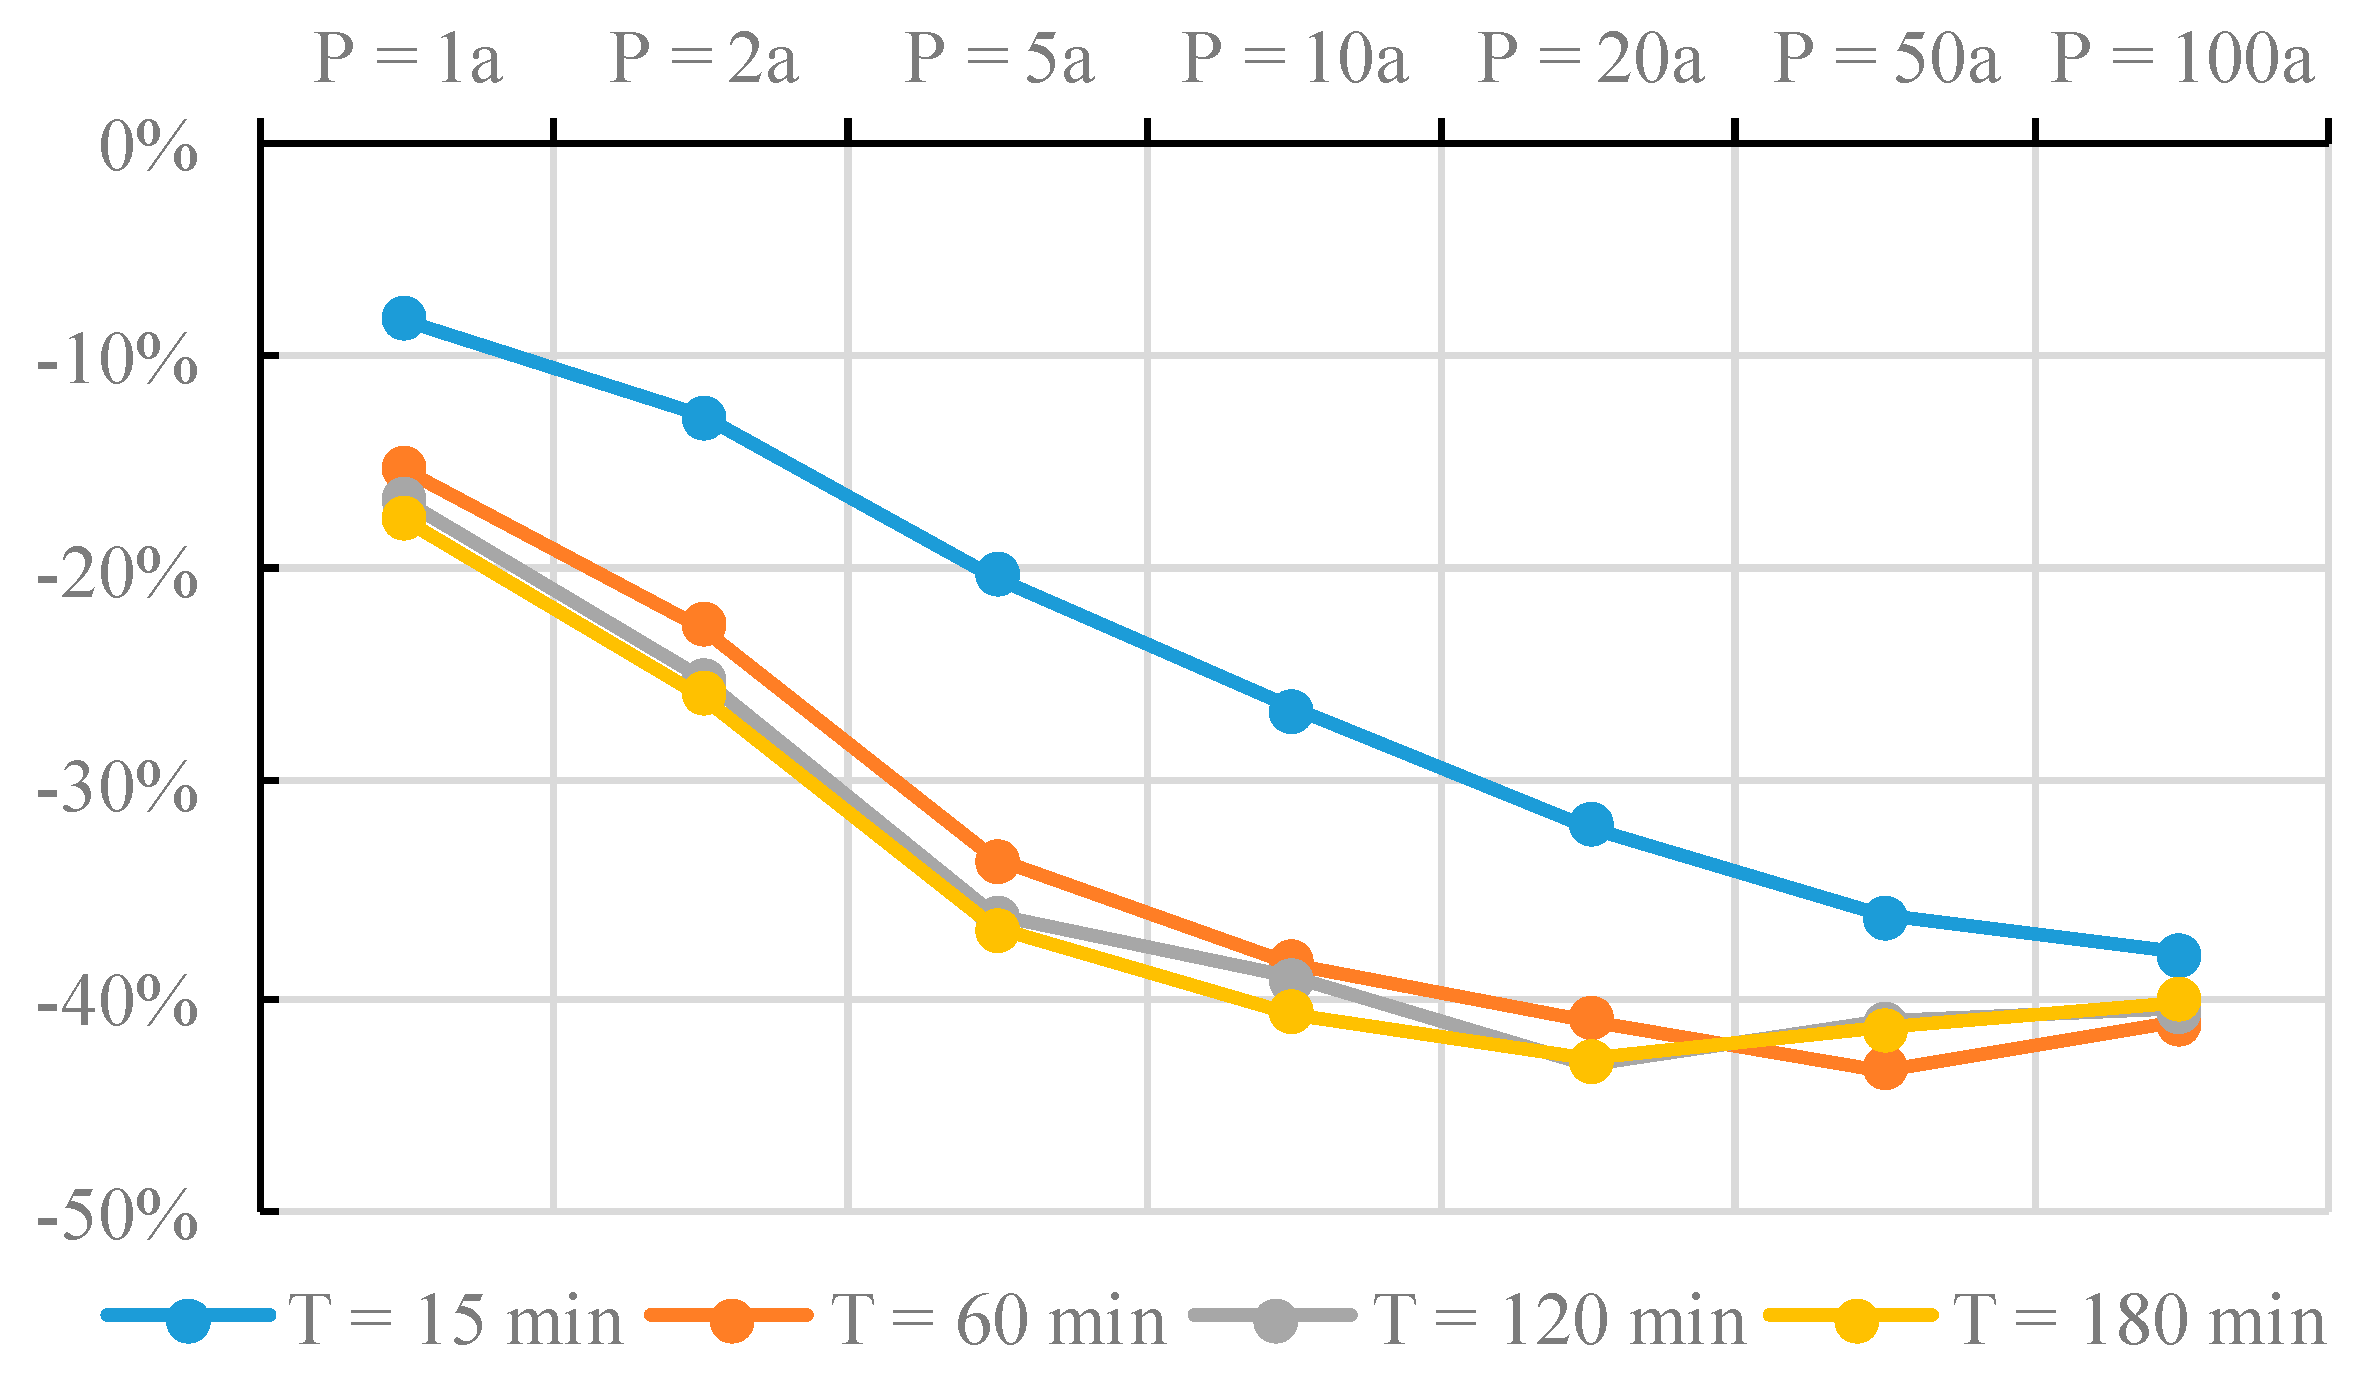
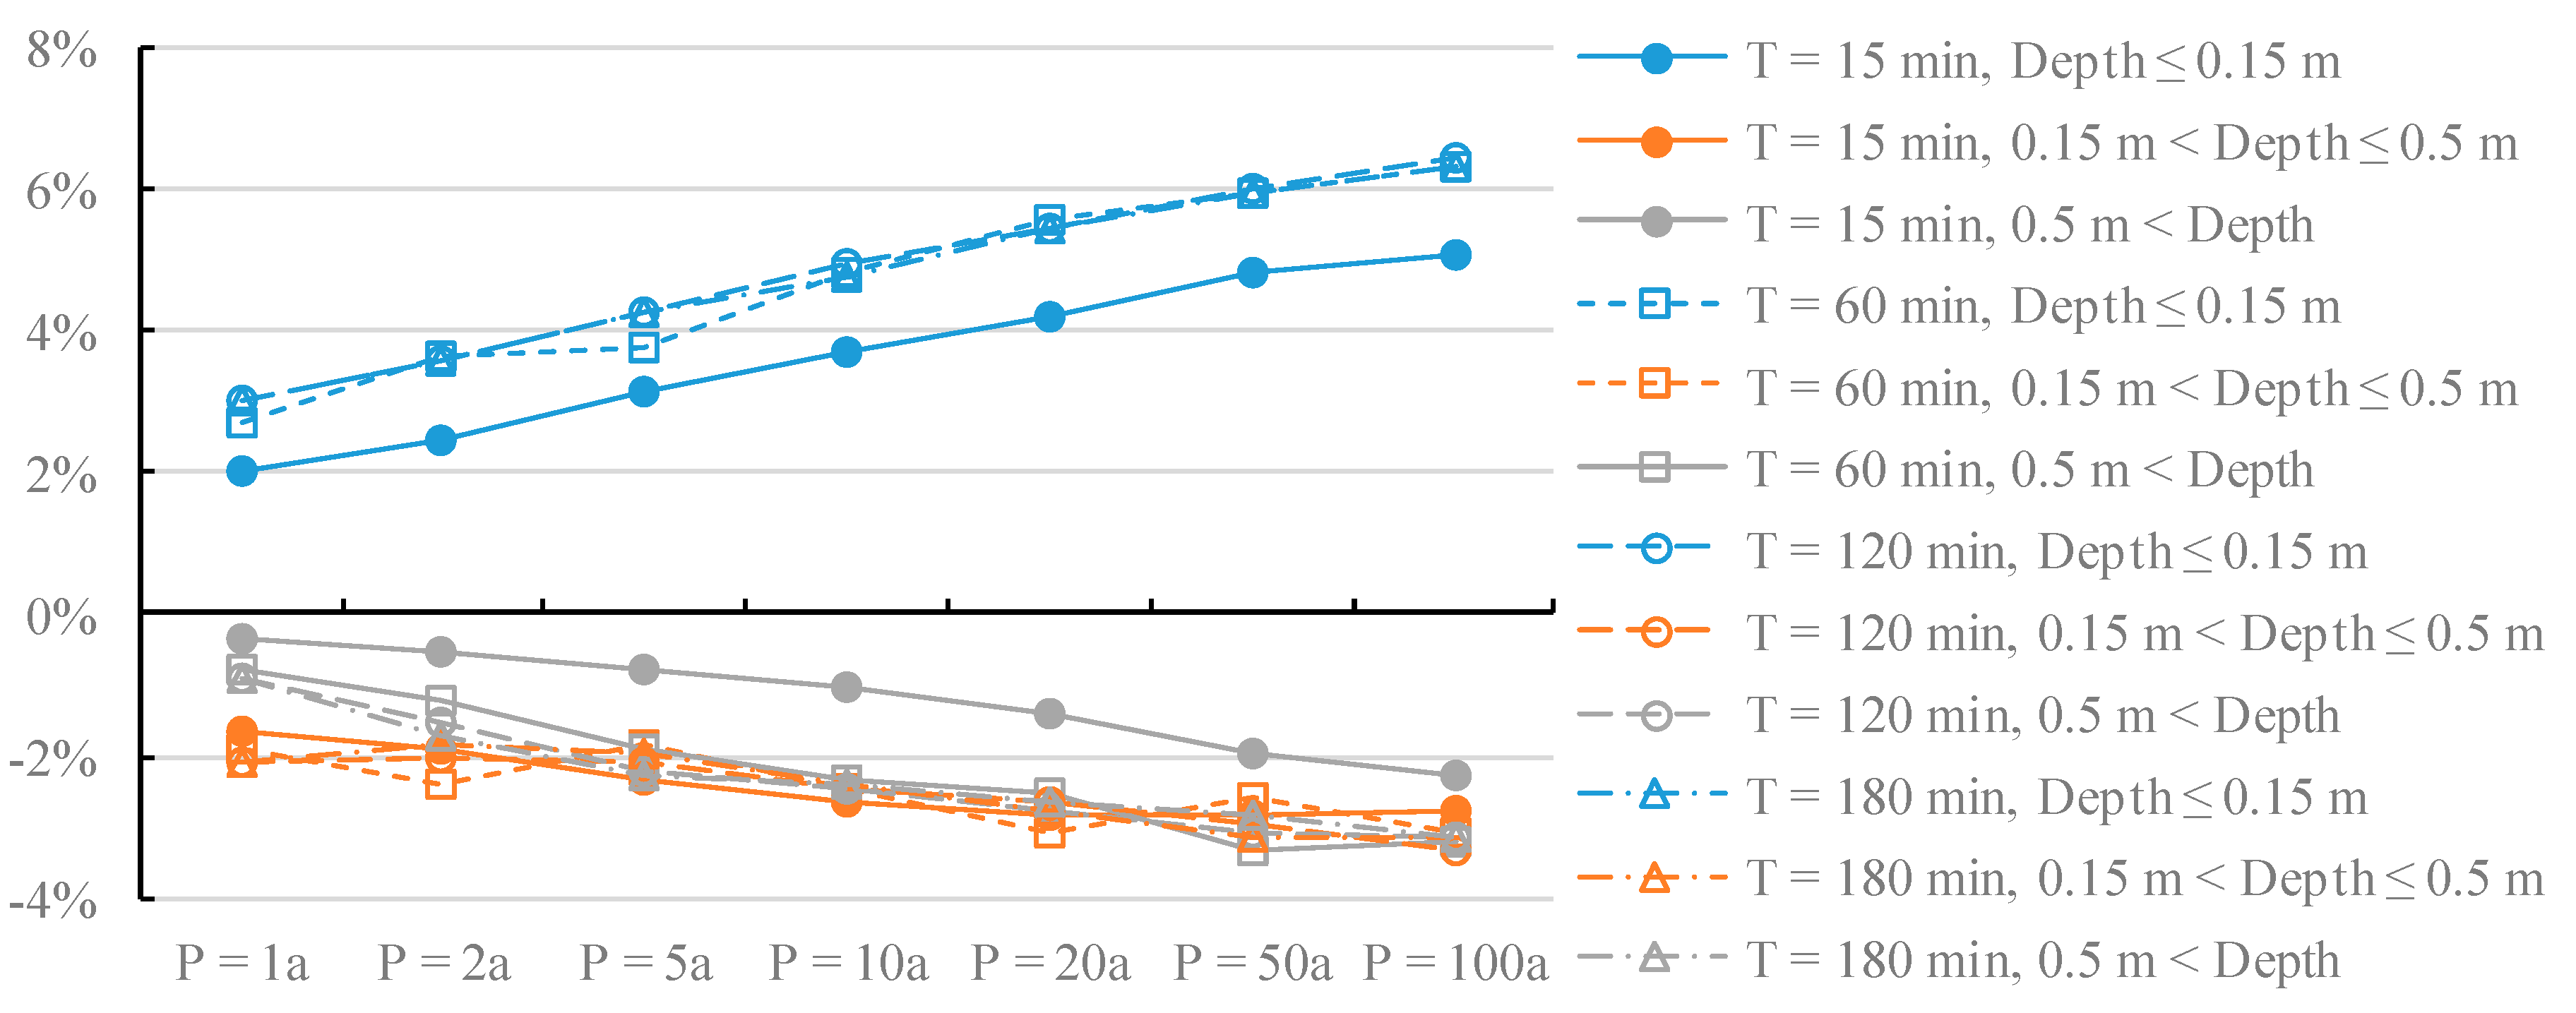
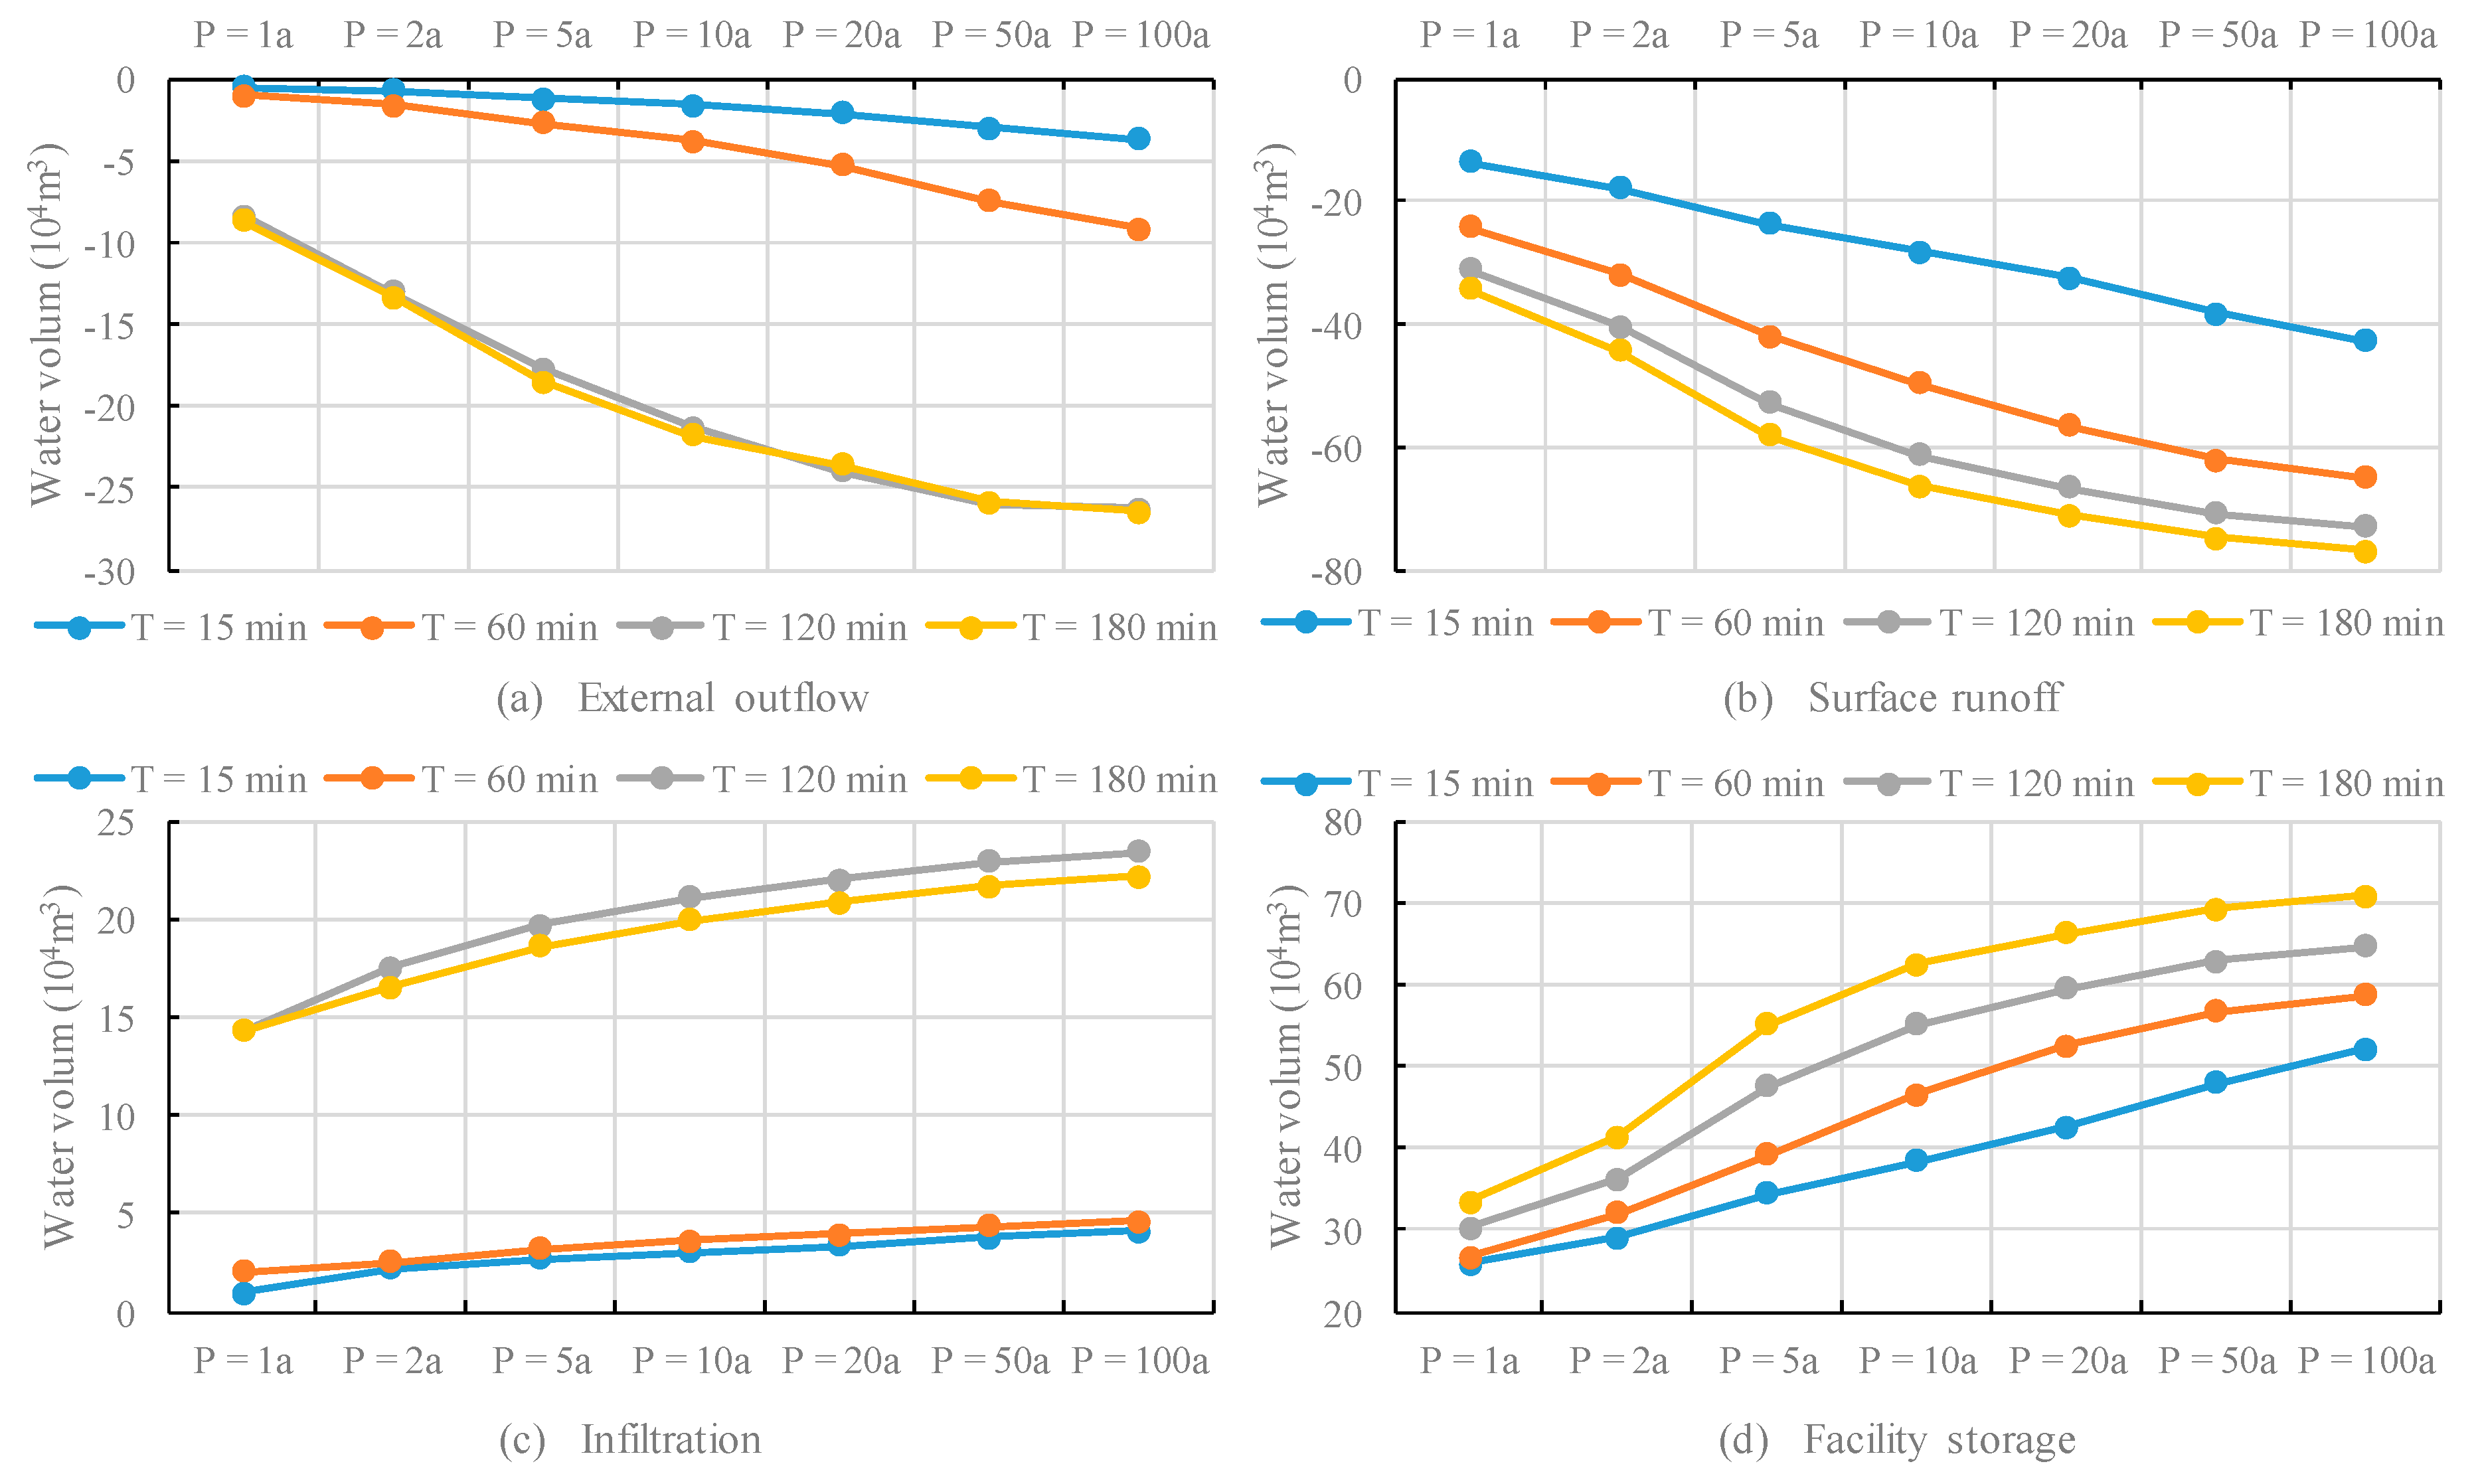
The model is also run with the design storms of durations 15, 60, 120, and 180 min and return periods (Ps) 1, 2, 5, 10, 20, 50, and 100 years. When the rain garden is applied, the ratio of surcharging pipeline, the ponding area, the external outflow, and the surface flow decrease, and the infiltration and storage increase (Figure 14, Figure 15 and Figure 16). The rainfall with small return period and short duration could cause less surface runoff. The rain garden could gather and store the surface runoff, then infiltrate them into the soil. Because most of the runoff is stored, the external flow and infiltration are relatively small and their variation are not apparent. The external flow curves/infiltration with small return period and short duration are close. The bigger the return period is, the more the rainfall is. But the rain garden could not process all the rainfall of the big return period, so all the curves in these figures show a trend of being stable as the return period increases. As the rainfall duration increases, the curves in Figure 14, Figure 15 and Figure 16 get closer to each other. It means the rain garden could not process the rainfall with long duration. Similarly, other researches [27,50] found a similar result. Wang et al. [27] found that there is an obvious decrease in effectiveness under longer return period (e.g., 100 years) events compared to the simulated runoff reduction for 1 year, 1 h storms. The research of Wang et al. [50] also shows that when the intensity of climate increased, LIDs were not very helpful. It should be noticed that the LIDs are very much ineffective for less frequent, heavier, and longer duration storms, and the LIDs could not replace conventional runoff management practices and drainage systems.
4. Conclusions
This paper focus on choosing the best LID for urban storm management by comparing the efficiency in the south urban district in the Taiyuan Basin. Firstly, we simulate the hydrological and hydraulic process of the area using a 1D–2D model. Then the effect and efficiency of different LID scenarios are analyzed by the indexes, such as ratio of surcharging pipeline, percentage of ponding road, external outflow, infiltration, surface runoff, facility storage, and LID area ratio. We conclude this work as below:
- The continuous porous pavement scenario could increase more infiltration than the rain garden, but the rain garden could be more effective at reducing surcharging pipeline, ponding road, external outflow, and surface flow, especially at increasing facility storage.
- With the same LID area and design storm, the rain garden could mitigate the pipeline surcharging and road ponding more efficiently than the continuous porous pavement.
- When the LID area of the rain garden is between 15% and 20%, the rain garden has good performance on reducing the surcharging pipelines.
- It is worth noticing that the LIDs are very much ineffective for less frequent, heavier, and longer duration storms, and the LIDs could not replace conventional runoff management practices and drainage systems.
- We focused on the city flood control of the LID facilities in this paper, so we have not discussed the efficiency related to the environmental function and cost-effectiveness. These issues should be further studied, if they are of concern—nonpoint source pollution reduction, water quality improvement, and cost-effectiveness.
Author Contributions
Conceptualization, T.C. and Y.L.; methodology, T.C.; software, T.C.; data curation, T.C.; writing—original draft preparation, T.C.; project administration, Y.L.; supervision, Y.W.
Funding
This research was funded by the National Key Research and Development Program of China (2017YFC1502705, 2018YFC1508204) and the Technical Demonstration Project of Ministry of Water Resources (SF-201706).
Conflicts of Interest
The authors declare no conflicts of interest.
References
- Comprehensive Water Resources Planning in China; Ministry of Water Resources of the People’s Republic of China: Beijing, China, 2010. (In Chinese)
- BAI, Y.; Zhao, N.; Zhang, R.; Zeng, X. Storm Water Management of Low Impact Development in Urban Areas Based on SWMM. Water 2019, 11, 33. [Google Scholar] [CrossRef] [Green Version]
- Zhou, Q.; Leng, G.; Su, J.; Ren, Y. Comparison of urbanization and climate change impacts on urban flood volumes: Importance of urban planning and drainage adaptation. Sci. Total Environ. 2019, 658, 24–33. [Google Scholar] [CrossRef] [PubMed]
- Arnone, E.; Pumo, D.; Francipane, A.; La Loggia, G.; Noto, L.V. The role of urban growth, climate change, and their interplay in altering runoff extremes. Hydrol. Process. 2018, 32, 1755–1770. [Google Scholar] [CrossRef]
- Mahmoud, S.H.; Gan, T.Y. Urbanization and climate change implications in flood risk management: Developing an efficient decision support system for flood susceptibility mapping. Sci. Total Environ. 2018, 636, 152–167. [Google Scholar] [CrossRef] [PubMed]
- Moghadas, S.; Leonhardt, G.; Marsalek, J.; Viklander, M. Modeling urban runoff from rain-on-snow events with the US EPA SWMM model for current and future climate scenarios. J. Cold Reg. Eng. 2018, 32, 04017021. [Google Scholar] [CrossRef]
- Ren, G.; Ren, Y.; Zhan, Y.; Sun, X.; Liu, Y.; Chen, Y.; Wang, T. Spatial and temporal patterns of precipitation variability over mainland China: II: Recent trends. Adv. Water Sci. 2015, 26, 451–465. (In Chinese) [Google Scholar]
- Miller, J.D.; Hutchins, M. The impacts of urbanisation and climate change on urban flooding and urban water quality: A review of the evidence concerning the United Kingdom. J. Hydrol. Reg. Stud. 2017, 12, 345–362. [Google Scholar] [CrossRef] [Green Version]
- Akter, T.; Quevauviller, P.; Eisenreich, S.J.; Vaes, G. Impacts of climate and land use changes on flood risk management for the Schijn River, Belgium. Environ. Sci. Policy 2018, 89, 163–175. [Google Scholar] [CrossRef]
- Todd, C.D.; Goss, A.M.; Tripathy, D.; Harbor, J.M. The effects of landscape transformation in a changing climate on local water resources. Phys. Geogr. 2007, 28, 21–36. [Google Scholar] [CrossRef]
- Huong, H.L.; Pathirana, A. Urbanization and climate change impacts on future urban flooding in Can Tho city, Vietnam. Hydrol. Earth Syst. Sci. 2013, 17, 379–394. [Google Scholar] [CrossRef] [Green Version]
- Ye, B.; Sheng, D.; Men, X. Causes and countermeasures of urban water logging. J. Econ. Water Res. 2011, 28, 62–78. [Google Scholar]
- Long, Y.; Cui, T. Simulating the storm water runoff and drainage of the south urban district in the Taiyuan Basin with a 1D–2D model. In IOP Conference Series Earth and Environmental Science, Changsha, China, 18–20 May 2018; Hsu, C.H., Liu, Z.Q., Wang, H., Qin, M.Z., Eds.; IOP Publishing: Bristol, UK, 2019. [Google Scholar]
- Himanshu, S.K.; Pandey, A.; Yadav, B.; Gupta, A. Evaluation of best management practices for sediment and nutrient loss control using SWAT model. Soil Tillage Res. 2019, 192, 42–58. [Google Scholar] [CrossRef]
- United States Environmental Protection Agency. Low Impact Development (LID) A Literature Review; EPA-841-B-00-005; EPA: Washington, DC, USA, 2000; p. 10.
- Meng, T.; Hsu, D. Stated preferences for smart green infrastructure in stormwater management. Landsc. Urban Plan. 2019, 187, 1–10. [Google Scholar] [CrossRef]
- Johnson, D.; Geisendorf, S. Are Neighborhood-level SUDS Worth it? An Assessment of the Economic Value of Sustainable Urban Drainage System Scenarios Using Cost-Benefit Analyses. Ecol. Econ. 2019, 158, 194–205. [Google Scholar] [CrossRef]
- Radcliffe, J.C. History of Water Sensitive Urban Design/Low Impact Development Adoption in Australia and Internationally. Approaches to Water Sensitive Urban Design; Sharma, A.K., Gardner, T., Begbie, D., Eds.; Elsevier: Amsterdam, The Netherlands, 2019; pp. 1–24. [Google Scholar]
- Ding, N.; Hu, A.; Ren, X. Application and prospect of low impact development model in Shenzhen. Water Wast. Eng. 2012, 38, 141–144. [Google Scholar]
- Long, Y.; Gai, Y.; Guan, X.; Hu, X.; Cui, T. Advance of the Method estimating the Benefit of Storm Water Usage in Urban Area. In IOP Conference Series Earth and Environmental Science, Qingdao, China, 23–25 August 2018; Nield, D.A., Ed.; IOP Publishing: Bristol, UK, 2019. [Google Scholar]
- Guidance on Promoting the Construction of the Sponge City; General Office of the State Council of the People’s Republic of China: Beijing, China, 2015. (In Chinese)
- Li, G.; Suo, N.; Han, S. Make rational use of water resources and vigorously develop rain and flood resources. Mod. Sci. 2012, 12, 121. (In Chinese) [Google Scholar]
- Guo, W.; Liu, W.; Wang, H. Study and Application of Ecological Management of Urban Rain and Flood Resources; China Water Power Press: Beijing, China, 2015. [Google Scholar]
- Freni, G.; Mannina, G.; Viviani, G. Urban storm-water quality management: Centralized versus source control. J. Water Resour. Plan. Manag. 2010, 136, 268–278. [Google Scholar] [CrossRef] [Green Version]
- Whitehead, P.G.; Jin, L.; Macadam, I.; Janes, T.; Sarkar, S.; Rodda, H.J.E.; Sinha, R.; Nicholls, R. Modelling impacts of climate change and socio-economic change on the Ganga, Brahmaputra, Meghna, Hooghly and Mahanadi river systems in India and Bangladesh. Sci. Total Environ. 2018, 636, 1362–1372. [Google Scholar] [CrossRef] [Green Version]
- Wang, X.; Kingsland, G.; Poudel, D.; Fenech, A. Urban flood prediction under heavy precipitation. J. Hydrol. 2019, 577, 123984. [Google Scholar] [CrossRef]
- Wang, M.; Zhang, D.; Lou, S.; Hou, Q.; Liu, Y.; Cheng, Y.; Qi, J.; Tan, S.K. Assessing Hydrological Effects of Bioretention Cells for Urban Stormwater Runoff in Response to Climatic Changes. Water 2019, 11, 997. [Google Scholar] [CrossRef] [Green Version]
- Bosley, E.K. Hydrologic Evaluation of Low Impact Development Using a Continuous, Spatially-Distributed Model. Master’s Thesis, Virginia Polytechnic Institute and State University, Blacksburg, Virginia, 2008. [Google Scholar]
- Eckart, K.; McPhee, Z.; Bolisetti, T. Performance and implementation of low impact development—A review. Sci. Total Environ. 2017, 607–608, 413–432. [Google Scholar] [CrossRef] [PubMed]
- Cipolla, S.S.; Maglionico, M.; Stojkov, I. A long-term hydrological modelling of an extensive green roof by means of SWMM. Ecol. Eng. 2016, 95, 876–887. [Google Scholar] [CrossRef]
- Zheng, Y.; Chen, S.; Qin, H.; Jiao, J.J. Modeling the Spatial and Seasonal Variations of Groundwater Head in an Urbanized Area under Low Impact Development. Water 2019, 10, 803. [Google Scholar] [CrossRef] [Green Version]
- Liu, Y.; Ahiablame, L.M.; Bralts, V.F.; Engel, B.A. Enhancing a rainfall-runoff model to assess the impacts of BMPs and LID practices on storm runoff. J. Environ. Manag. 2015, 147, 12–23. [Google Scholar] [CrossRef]
- Bai, Y.; Li, Y.; Zhang, R.; Zhao, N.; Zeng, X. Comprehensive Performance Evaluation System Based on Environmental and Economic Benefits for Optimal Allocation of LID Facilities. Water 2019, 11, 341. [Google Scholar] [CrossRef] [Green Version]
- Mao, X.; Jia, H.; Yu, S.L. Assessing the ecological benefits of aggregate LID-BMPs through modelling. Ecol. Model. 2017, 353, 139–149. [Google Scholar] [CrossRef]
- Helmi, N.R.; Verbeiren, B.; Mijic, A.; Griensven, A.; Bauwens, W. Developing a modeling tool to allocate Low Impact Development practices in a cost-optimized method. J. Hydrol. 2019, 573, 98–108. [Google Scholar] [CrossRef]
- Urban Master Planning of Taiyuan (2011–2020); People’s government of Taiyuan: Taiyuan, China, 2015. (In Chinese)
- Special Planning for Sponge City of Taiyuan (2016–2020); China Academy of Urban Planning & Design, Taiyuan Urban & Rural Planning and Design Research Institute: Taiyuan, China, 2014. (In Chinese)
- PCSWMM Features. Available online: https://www.pcswmm.com/Features (accessed on 6 June 2019).
- Taiyuan Drainage and Waterlogging Construction Plan (2014–2020); Taiyuan Urban & Rural Planning and Design Research Institute: Taiyuan, China, 2015. (In Chinese)
- Special Planning for Urban Flood Control and Drainage of Taiyuan City (2013–2020); Taiyuan Urban Planning and Design Institute, Taiyuan Municipal Construction Group Co., LTD., Taiyuan Water Conservancy Survey and Design Institute: Taiyuan, China, 2015. (In Chinese)
- Horton, R.E. An approach toward a physical interpretation of infiltration capacity. Soil Sci. Soc. Am. J. 1940, 5, 399–417. [Google Scholar] [CrossRef]
- Avoiding Double Accounting of Channel Volume. Available online: https://support.chiwater.com/78047/avoiding-double-accounting-of-channel-volume (accessed on 6 June 2019).
- Dietz, M.E. Low impact development practices: A review of current research and recommendations for future directions. Water Air Soil Pollut. 2007, 186, 351–363. [Google Scholar] [CrossRef]
- LID Controls. Available online: https://support.chiwater.com/77701/lid-controls (accessed on 6 June 2019).
- Technical Specification for Pavement of Water Permeable Brick; Ministry of Housing and Urban Rural Development of the People’s Republic of China: Beijing, China, 2012. (In Chinese)
- William, M. Landscape Planning: Environmental Application, 5th ed.; John Wiley & Sons, Inc.: New York, NY, USA, 2010. [Google Scholar]
- Technical Code for Rainwater Collection, Storage and Utilization; Ministry of Housing and Urban Rural Development of the People’s Republic of China, General Administration of Quality Supervision, Inspection and Quarantine of the People’s Republic of China: Beijing, China, 2010. (In Chinese)
- Li, J.; Zhang, B.; Li, Y.; Li, H. Simulation of Rain Garden Effects in Urbanized Area Based on Mike Flood. Water 2018, 10, 860. [Google Scholar] [CrossRef] [Green Version]
- Zhang, S.S.; Pan, Y. SWMM model-based study on optimal allocation of LID facilities in urbanized region. Water Res. Hydrol. Eng. 2018, 49, 10–15. (In Chinese) [Google Scholar]
- Wang, M.; Zhang, D.; Adhityan, A.; Ng, W.J.; Dong, J.; Tan, S.K. Assessing cost-effectiveness of bioretention on stormwater in response to climate change and urbanization for future scenarios. J. Hydrol. 2016, 543, 423–432. [Google Scholar] [CrossRef]
Figure 1.
The location of the study area.

Figure 2.
Rainfall series in (a) July 2012 and (b) July 2016.

Figure 3.
Design hyetographs of different return period (P).

Figure 4.
The 1D–2D model of the study area.

Figure 5.
Continuous porous pavement and rain garden [44].
Figure 5.
Continuous porous pavement and rain garden [44].

Figure 6.
The ratio of surcharging pipeline of different LID scenarios with different LID area ratios.
Figure 6.
The ratio of surcharging pipeline of different LID scenarios with different LID area ratios.

Figure 7.
The percentage of ponding road of different LID scenarios with different LID area ratios.

Figure 8.
The external outflow, facility storage, infiltration, and surface runoff of different LID scenarios with different LID area ratios.
Figure 8.
The external outflow, facility storage, infiltration, and surface runoff of different LID scenarios with different LID area ratios.

Figure 9.
The ratio of the surcharging pipeline of the rain garden with different LID area ratios.

Figure 10.
The percentage of ponding road of the rain garden with different LID area ratios.

Figure 11.
The external outflow, facility storage, infiltration, and surface runoff of the rain garden with different LID area ratios.
Figure 11.
The external outflow, facility storage, infiltration, and surface runoff of the rain garden with different LID area ratios.

Figure 12.
The variation of the percentage of ponding road of the rain garden.

Figure 13.
The variation of the external outflow, surface runoff, infiltration, and facility storage of the rain garden.
Figure 13.
The variation of the external outflow, surface runoff, infiltration, and facility storage of the rain garden.

Figure 14.
The variation of the ratio of the surcharging pipeline of the rain garden in different return periods.
Figure 14.
The variation of the ratio of the surcharging pipeline of the rain garden in different return periods.

Figure 15.
The variation of the percentage of ponding road of the rain garden in different return periods.
Figure 15.
The variation of the percentage of ponding road of the rain garden in different return periods.

Figure 16.
The variation of the external outflow, surface runoff, infiltration, and facility storage of the rain garden in different return periods.
Figure 16.
The variation of the external outflow, surface runoff, infiltration, and facility storage of the rain garden in different return periods.


Table 1.
Land use percent and the comprehensive runoff coefficient (CRC) of the study area.
| Land Use | Percent of the Study Area | Empirical CRC | Simulated CRC |
|---|---|---|---|
| Building | 56% | 0.85~0.95 | 0.94 |
| Green land (including park, embankment, and grass land) | 12% | 0.10~0.20 | 0.11 |
| Historical protection area (HPA) | 11% | 0.35~0.40 | 0.37 |
| Road | 9% | 0.85~0.95 | 0.95 |
| Farmland | 9% | 0.10~0.20 | 0.17 |
| Water area | 3% | 1.00 | 1.00 |
Table 2.
The Horton equation parameters of different land use.
| Land Use | Max. Infiltration (mm/h) | Min. Infiltration (mm/h) | Decay Coefficient (1/h) | Drying Time (day) |
|---|---|---|---|---|
| Building | 10 | 4 | 4 | 7 |
| Green land | 12 | 6 | 4 | 7 |
| HPA | 10 | 4 | 4 | 7 |
| Road | 10 | 4 | 4 | 7 |
| Farmland | 12 | 6 | 4 | 7 |
Table 3.
The Manning’s roughness coefficient of conduits.
| Conduits | Manning’s Roughness Coefficient |
|---|---|
| Fen River | 0.03 |
| Fengyu River | 0.03 |
| Kaihua River | 0.03 |
| Mingxian River | 0.03 |
| Mafang River | 0.03 |
| Channels | 0.02 |
| 1D Pipelines | 0.014 |
| 2D Conduits | 0.011 |
Table 4.
Parameters of the 1D–2D model.
| Parameters | Building | Greenland | HPA | Road | Farmland |
|---|---|---|---|---|---|
| Percent of impervious area (%) | 90 | 2~12 | 15 | 95 | 1 |
| Manning’s n for impervious area | 0.011 | 0.011 | 0.011 | 0.011 | 0.011 |
| Manning’s n for pervious area | 0.15 | 0.15 | 0.15 | 0.15 | 0.06 |
| Depth of depression storage on impervious area (mm) | 0.05 | 0.05 | 0.05 | 0.05 | 0.05 |
| Depth of depression storage on pervious area (mm) | 2 | 2 | 2 | 1 | 6 |
Table 5.
Parameters of the continuous porous pavement.
| Layer | Parameter | Value |
|---|---|---|
| Surface layer | Manning’s n | 0.1 |
| Slope | 1.0 | |
| Pavement layer | Thickness (mm) | 100.0 |
| Void ratio | 0.2 | |
| Impervious surface | 0.0 | |
| Permeability (mm/h) | 100.0 | |
| Storage layer | Thickness (mm) | 100.0 |
| Void ratio | 0.75 | |
| Seepage rate (mm/h) | 20.0 |
Table 6.
Parameters of the rain garden.
| Layer | Parameter | Value |
|---|---|---|
| Surface layer | Berm height (mm) | 150.0 |
| Vegetation volume | 0.05 | |
| Manning’s n | 0.16 | |
| Slope | 1.0 | |
| Soil layer | Thickness (mm) | 500.0 |
| Porosity | 0.3 | |
| Field capacity | 0.2 | |
| Wilting point | 0.1 | |
| Conductivity (mm/h) | 20.0 | |
| Conductivity slope | 10.0 | |
| Suction head (mm) | 3.5 |
© 2019 by the authors. Licensee MDPI, Basel, Switzerland. This article is an open access article distributed under the terms and conditions of the Creative Commons Attribution (CC BY) license (http://creativecommons.org/licenses/by/4.0/).
Share and Cite
MDPI and ACS Style
Cui, T.; Long, Y.; Wang, Y. Choosing the LID for Urban Storm Management in the South of Taiyuan Basin by Comparing the Storm Water Reduction Efficiency. Water 2019, 11, 2583. https://doi.org/10.3390/w11122583
AMA Style
Cui T, Long Y, Wang Y. Choosing the LID for Urban Storm Management in the South of Taiyuan Basin by Comparing the Storm Water Reduction Efficiency. Water. 2019; 11(12):2583. https://doi.org/10.3390/w11122583
Chicago/Turabian StyleCui, Tingting, Yuqiao Long, and Yintang Wang. 2019. "Choosing the LID for Urban Storm Management in the South of Taiyuan Basin by Comparing the Storm Water Reduction Efficiency" Water 11, no. 12: 2583. https://doi.org/10.3390/w11122583
Note that from the first issue of 2016, this journal uses article numbers instead of page numbers. See further details here.