The Role of Debris Cover in Catchment Runoff: A Case Study of the Hailuogou Catchment, South-Eastern Tibetan Plateau


1
School of Resource, Environment and Safety Engineering, Hunan University of Science and Technology, Xiangtan 411201, China
2
Institute of International Rivers and Eco-Security, Yunnan University, Kunming 650500, China
3
Institute of Mountain Hazards and Environment, Chinese Academy of Sciences, Chengdu 610041, China
*
Author to whom correspondence should be addressed.
Water 2019, 11(12), 2601; https://doi.org/10.3390/w11122601
Submission received: 25 September 2019
/
Revised: 4 December 2019
/
Accepted: 7 December 2019
/
Published: 10 December 2019
(This article belongs to the Special Issue Impacts of Climate Change on Water Resources in Glacierized Regions)
Abstract
:Runoff from high-elevation, debris-covered glaciers is a crucial water supply in the Tibetan Plateau (TP) and its surroundings, where insufficient debris thickness data make it difficult to analyze its influence. Here, we investigated the role of debris cover in runoff formation of the Hailuogou catchment in the south-eastern Tibetan Plateau for the 1988–2017 period, based on long-term observations combined with a physically based glacio-hydrological model. The catchment is characterized by extensive thin debris on the ablation zones of three debris-covered glaciers. An increasing trend in catchment runoff has been observed in the past three decades, more than 50% of which is attributed to glacier runoff in the last decade. With the exception of the influence of temperature rising and precipitation decreasing, our results underline the importance of debris cover and its spatial features in the glaciological and hydrological processes of the catchment, in which the acceleration effect of debris cover is dominant in the catchment. An experimental analysis indicated that the extraordinary excess meltwater in the catchment is generated from the debris-covered surface, especially the lower elevation region below 3600 m a.s.l.
1. Introduction
Glaciers exert an important role in runoff formation in the glacier-fed catchments of the Tibetan Plateau and its surroundings [1,2,3,4], which is known as the “Asian Water Tower”. Across the Tibetan Plateau and its surroundings, the responses of glaciers to climate change vary considerably, with heterogeneous mass-loss rates [2,5,6,7,8]. In the context of climate warming and glacier wastage [9], key socioeconomic issues arise regarding the sustainability of the glacier-fed river runoff and resulting implications for downstream water resource management in one of the most populated areas of the world. Therefore, precisely quantifying variations in river runoff and its components in glacier-fed catchments of the Tibetan Plateau and its surroundings, especially the contributions from glacier runoff, is a crucial issue for assessing regional water resource availability, planning the future use of water, and associated decision-making in the catchment and its downstream regions.
The importance of these glaciers for regional water resources via temporarily storing and releasing water at various time scales has long been recognized [1,2,3,4,9]. In particular, the Tibetan Plateau and its surroundings host a large number of debris-covered glaciers [10,11,12,13] on which the ablation zone is extensively covered by supraglacial debris with different thicknesses. It is well known that debris cover can enhance or attenuate ice melt rates compared to bare ice, depending on its thickness [14,15], called the debris-cover effect [13]. The spatial distribution of debris cover can largely influence the structure of the glacier’s hydrological system and its evolution by controlling melt rate and its spatial pattern [16,17,18,19], with important implications for the catchment runoff [16,18,20]. Note that the extent of supraglacial debris cover is likely to increase with glacier shrinkage [11,21]. Analysis of one basin of the Nepal Himalayas found that the debris-covered ice provides much more meltwater to the total runoff [20]. Therefore, debris cover and its spatial distribution on debris-covered glaciers have a crucial influence on catchment glaciological and hydrological processes via changing the spatial patterns of meltwater generation, largely increasing the complexity of glaciological and hydrological simulations in the catchment. Although the extent of supraglacial debris cover can be derived from satellite imagery [11,22], the thickness of debris cover is difficult to determine at a large scale. Consequently, the debris-cover effect is generally considered simply in current glacio-hydrological models through using a multiplicative reduction factor or different melt factors for debris-covered surfaces [3,23,24,25,26].
In this study, we systematically assessed the role of debris cover in runoff formation in a glacierized catchment in the south-eastern Tibetan Plateau, based on long-term glaciological, meteorological, and hydrological observations with a physically based glacio-hydrological model. With the exception of accounting for all relevant components of the catchment runoff, our model considered the spatial characteristics of debris thickness and its impact on ice melt rate and its spatial pattern on glaciers. The main goal of this study was to enable a detailed assessment of the impacts of debris cover with different thicknesses and its role in runoff formation of the catchment in the past three decades (1988–2017). Furthermore, we investigated the impact of climate change on the total runoff and its individual components in the catchment in the past three decades.
2. Materials and Methods
2.1. Study Area
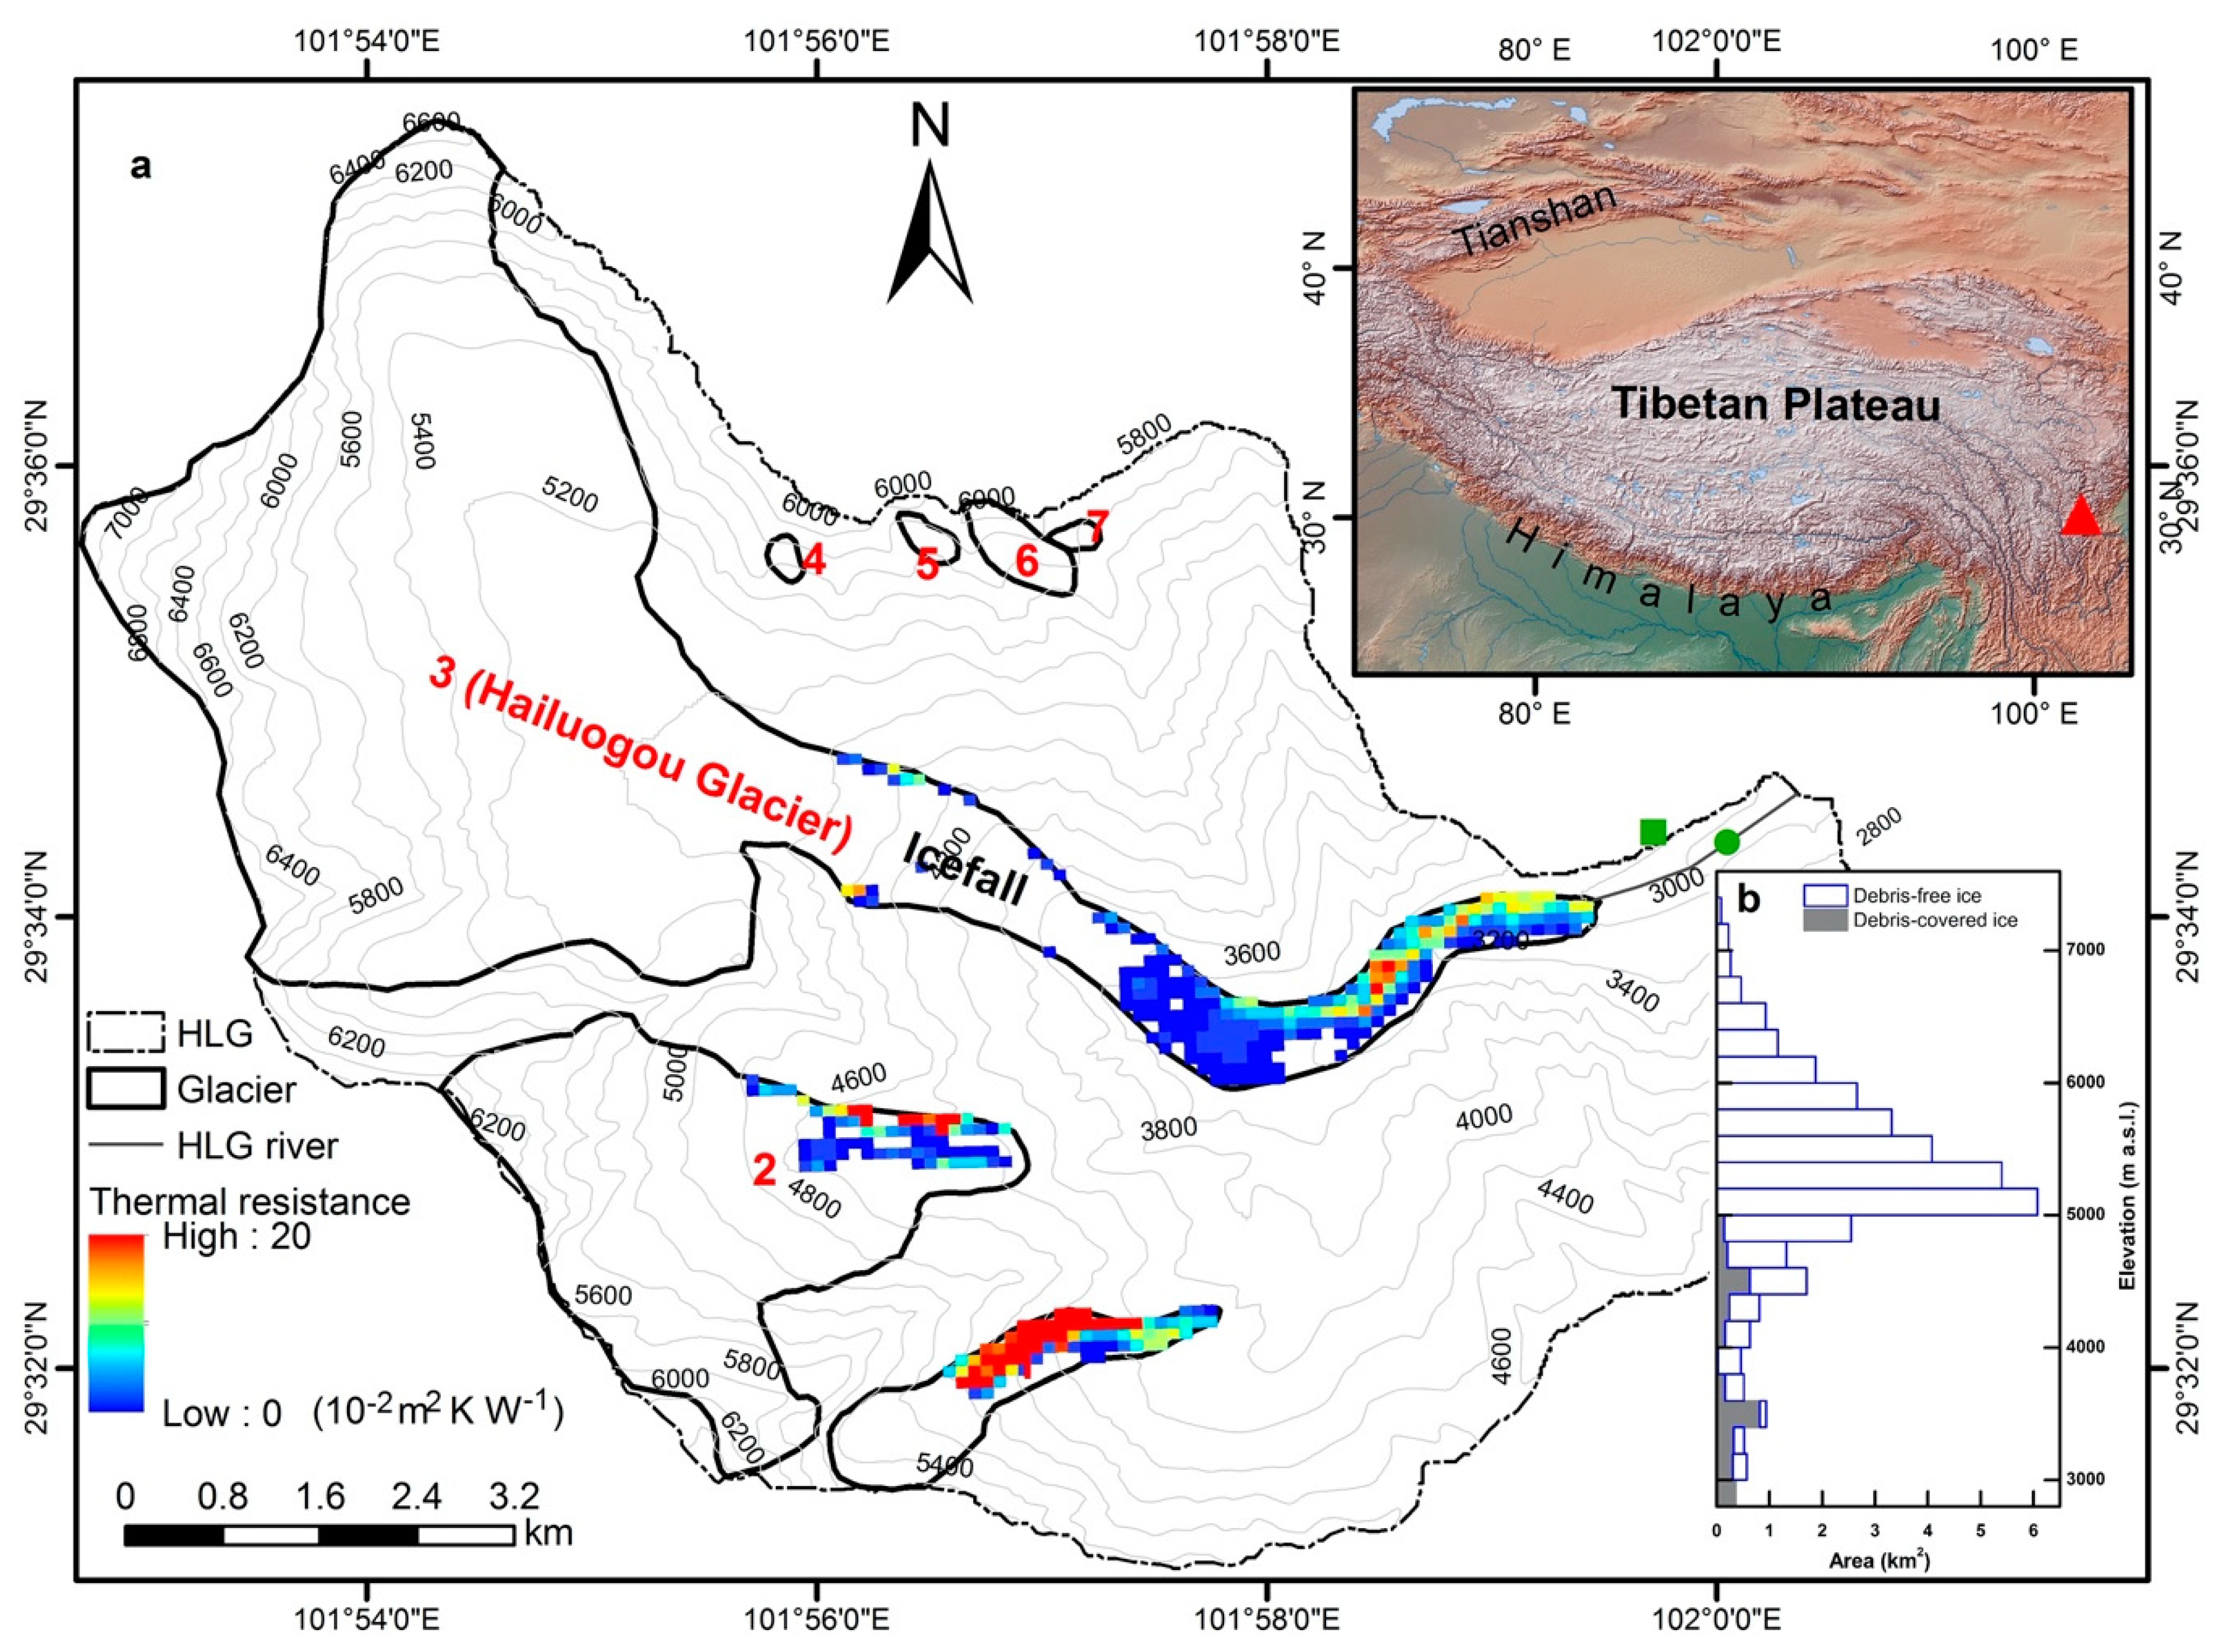
Hailuogou catchment (29.6° N, 101.9° E; Figure 1) is situated on the eastern slope of Mount Gongga on the south-eastern Tibetan Plateau. The catchment extends from 2755.0 to 7556.0 m a.s.l., and covers a surface area of approximately 80.5 km2. Seven glaciers exist in the catchment with a total area of 36.44 km2 [27], including three debris-covered and four debris-free glaciers (Figure 1 and Table 1). Of these glaciers, Hailuogou Glacier is the largest debris-covered glacier in the catchment (Figure 1), extending 13.1 km in length and 25.7 km2 in area, with an altitude range of 2990.0–7556.0 m a.s.l.
The catchment is characterized by extensive debris cover on the three larger glaciers (Figure 1 and Table 1). Of the three debris-covered glaciers, Hailuogou Glacier contains the largest debris-covered area (Table 1), where debris covers about 41.0% of the total area of the ablation zone (Figure 1). The thermal resistance of the debris layer derived from satellite data (Figure 1), which is defined as debris thickness divided by the thermal conductivity of the debris layer [28,29] and can be a proxy of debris thickness on a large scale [13], indicates a highly heterogeneous distribution of debris thickness in the catchment. Extensive field surveys on the Hailuogou Glacier have indicated that debris thickness increases further down the glacier and varies from several millimeters of patchy cover below the icefall to more than 1.0 m at the terminus [30].
The catchment is under the influence of two wind systems: the south-east monsoon in summer and westerly circulation in winter [31,32]. Meteorological observations for the 1988–2017 period from the Gongga Alpine Ecosystem Observation and Research Station (hereafter GAEORS; 3000 m a.s.l.; Figure 1) indicate that the mean annual air temperature and precipitation are, respectively, 4.5 °C and 1884 mm. Most of the precipitation falls during the melt season (April–October), representing about 87% of the annual precipitation. Precipitation increases with increasing altitude in the catchment [33,34]. In response to temperature rise, accelerated mass loss of catchment glaciers has been observed in recent years [34,35,36,37,38], comparable to that of glaciers in other regions of the Tibetan Plateau [2,39].
2.2. Data Description
Various datasets were used in this study, including meteorological and hydrological observations, thermal resistances and thicknesses of debris layers, glacier information, and a digital elevation model (DEM) with a resolution of 30 m. We briefly describe these datasets below.
Daily meteorological data were taken from the GAEORS near the terminus of Hailuogou Glacier (Figure 1a), including precipitation, air temperature, relative humidity, wind speed, and solar radiation. These meteorological variables were required as input variables for our model and were available for the 1988–2017 period, except for the solar radiation; the solar radiation data were available for the 2005–2017 period in the catchment, while the dataset for the 1988–2004 period was derived from Zhang et al. [40], in which the solar radiation was calculated from the incoming shortwave radiation at the top of the atmosphere and the transmissivity, and the approach performed well [40]. River runoff was monitored from a GAEORS gauging station located in the river outlet of the catchment (Figure 1a). Records were available for the 1990–2007 period, during which observation equipment problems resulted in runoff data loss during some months of the observation period. Ablation data on the Hailuogou Glacier were derived from previous studies [30,31,41,42], which were conducted in 1982/1983 [31], 1990/1991–1993/1994 [41,42], and 2008 [30], respectively. Herein, ablation data were used to verify the performance of the model.
Glacier outlines of the catchment in 1994 were derived from Liu et al. [34], where they were produced based on remotely sensed data and topographic maps. The dataset of the thickness and thermal resistance of the debris layer was used to analyze the spatial distribution of the debris layer and its effects in the catchment. Debris thicknesses were extensively surveyed over the whole ablation zone of the Hailuogou Glacier in the elevation range of 2900 to 3600 m a.s.l. [30]. The dataset of the thermal resistance of the debris layer with a 90 m resolution was derived from Zhang et al. [43], where it was estimated from satellite images and was used herein to map the spatial distribution of debris thickness of the catchment and force the model.
In addition, a DEM with a resolution of 30 m was generated using aerial photographs acquired in 1989 [35]. In this study, the DEM was used to calculate the area and elevation of each part of the catchment.
2.3. Glacio-Hydrological Model
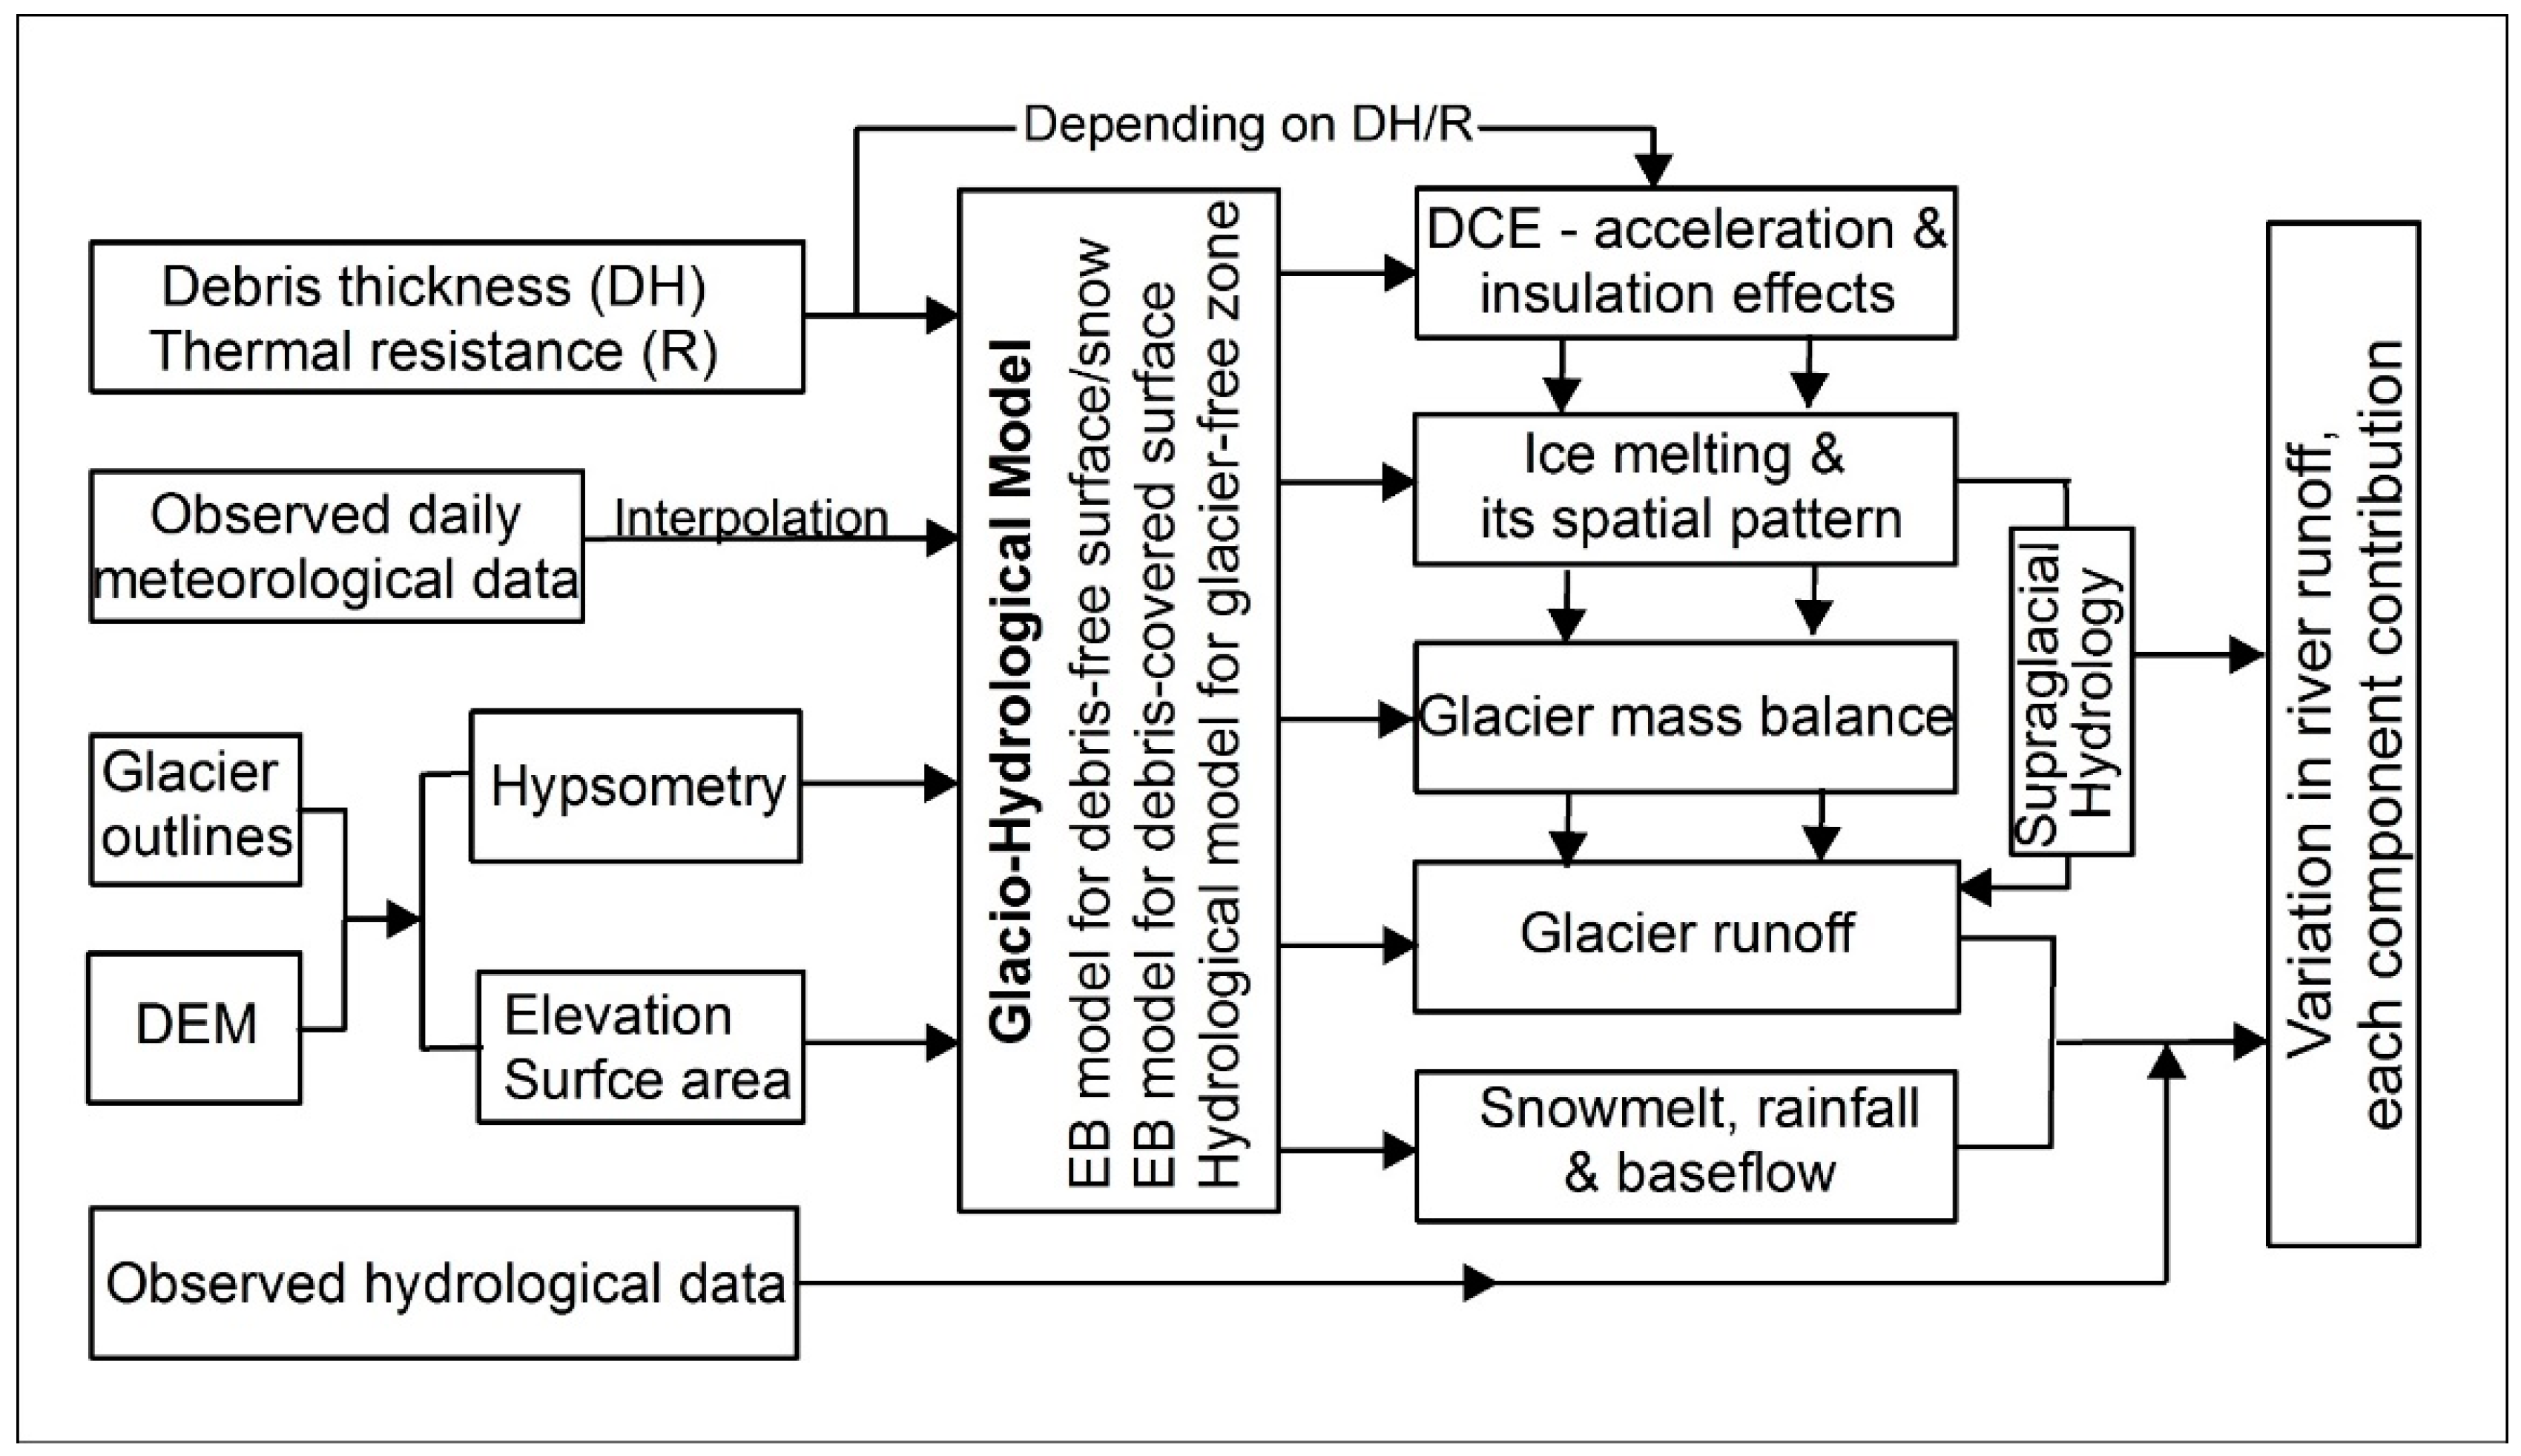
A physically based glacio-hydrological model developed by Zhang et al. [40] was applied to simulate the total runoff in the Hailuogou catchment. The model was used to calculate full energy–water–mass budgets of the catchment and ran at each elevation band with a time-step of 1 day. The overall methodological framework is shown in Figure 2. In the catchment, the total runoff consists of four possible contributing factors: glacier runoff, rainfall runoff, snowmelt, and baseflow. Therefore, the total catchment runoff generated per time step (QR) for each elevation band was calculated as
where QGR is glacier runoff, which consisted of all melt- and rainwater running off the glacierized area, QSM, QRR, and QBF are snowmelt, rainfall runoff, and baseflow, respectively, which were from the glacier-free zone of the catchment. The unit for all terms mentioned above is m3 s−1.
2.3.1. Data Preprocessing
To determine each component of the total runoff in the catchment, we first carried out discretization and classification of the catchment. In this process, we divided the catchment into glacier and glacier-free zones based on glacier outlines. The former was subdivided into two surface types based on the spatial distribution of the thermal resistance (R) of the debris layer (Figure 1a): debris-covered (R > 0.0) and debris-free (R ≤ 0.0) surfaces. Each part of the catchment was subdivided into 50 m elevation bands, and the areas of categorized surface features at each elevation band were obtained from the DEM. The area–altitude profile for each surface feature based on the DEM is shown in Figure 1b.
For each elevation band, we interpolated the air temperature and precipitation time series according to its average elevation using the temperature lapse rate and precipitation gradient, respectively. Meteorological observations in Mount Gongga indicated that the air temperature decreases with altitude [44], while precipitation increases linearly [33,34,44]. Thus, the temperature (Tiband) and precipitation (Piband) at ith elevation band were calculated according to the following algorithm:
where TGAEORS and PGAEORS are the daily air temperature (°C) and precipitation (mm) observed at the GAEORS, respectively; dtemp and dprec are the respective temperature lapse rate (−0.43 °C (100 m)−1) and precipitation gradient (18% (100 m)−1) [40]; and hiband and hGAEORS are the mean elevations (m a.s.l.) at ith elevation band and the GAEORS, respectively.
As meteorological observations revealed, precipitation across our study area mainly occurs during the summer monsoon season [33,36]. Consequently, the precipitation phase (snowfall or rainfall) had to be considered and was determined using air temperature for each elevation band. Precipitation falls as snow (PS) below a temperature of 2 °C, while it falls in rain (PL) above it. A mixture of snow and rain was assumed within a transition zone varying from 1 K above to 1 K below the temperature threshold. Within this temperature range, the percentage contribution of snow and rain to the total percentage could be linearly interpolated. We did not interpolate wind speed for each elevation band, which was assumed to be representative for the entire catchment.
2.3.2. Model Description
We simulated glacier runoff (QGR) by applying a surface energy–mass balance model coupled with volume–area/–length scaling, and then the runoff was routed through the glacier to the catchment outlet using a linear reservoir model [40]. In addition to the energy exchange between the atmosphere and the underlying surface (debris or ice), the model accounted for various processes in the subsurface after meltwater percolating into the underlying layers. In particular, the model used the thermal resistance (R) of the debris layer to map the spatial distribution of debris thickness and took into account the heterogeneous distribution of debris cover and its role in glaciological and hydrological processes of the catchment.
In the model, glacier runoff (QGR) for each elevation band was estimated as
where QM is the energy available for melting (W m−2), lf is the latent heat of fusion of ice (3.34 × 10⁵ J kg−1), PL is the rainfall (mm), QL is the latent heat flux (W m−2), le is the latent heat of the evaporation of water (2.50 × 10⁶ J kg−1), and RF is the refreezing amount. The energy available for melting (QM) at the debris-free (R ≤ 0.0) and debris-covered (R > 0.0) surfaces was respectively calculated as
where RS is the downward short-wave radiation flux; RLD and RLU are the downward and upward long-wave radiation fluxes, respectively; QS is the sensible heat flux; QG and Q′G are the conductive heat fluxes into the ice and through the debris layer; α and α’ are albedos of the debris-free and debris-covered surfaces; TI is the surface temperature of the debris–ice interface (°C); and TS is the debris surface temperature (°C).
All components of the energy balance in Equations. (5) and (6) were taken to be positive when the fluxes were directed toward the ground using units of W m−2. The upward long-wave radiation flux (RLU) was estimated using the Stefan–Boltzmann equation and the surface temperature, assuming a black body for the snow/ice surface, while the downward long-wave radiation flux (RLD) was calculated using an empirical equation [45,46] based on air temperature, relative humidity, and the ratio of solar radiation to the theoretical top-of-atmosphere radiation. The turbulent heat fluxes (QS and QL) were determined using the bulk formulae. The albedos of debris-covered and debris-free surfaces were, respectively, set to 0.2 and 0.3, whereas that of the initial fresh snow was assumed to be 0.8 [36]. The surface snow albedo over the underlying ice or debris surface was calculated from the scheme of Fujita [47], in which the albedo is the net result of multiple reflections of broadband shortwave radiation under the assumption that snowpack consists of an ice plate and air layer in the vertical dimension. The albedo was calculated using this simplified concept of multiple scattering in an ice plate of which the thickness is related to the surface snow density, which changes with snow compaction. The debris-free surface temperature was determined by iterative calculations, in which the conductive heat flux into the glacier ice (QG) was estimated by changing the ice temperature profile, while the debris-covered surface temperature was determined numerically by an iterative approach, in which we assumed no heat storage in the debris layer, no heat conduction into temperate glacier ice, and a linear temperature profile within the debris layer to calculate the conductive heat flux through the debris layer (Q′G). These schemes mentioned above have been validated against observations on different glaciers of the Tibetan Plateau and its surroundings [5,36,40,48].
The refreezing amount (RF) was calculated using the scheme of Fujita and Ageta [48], which considers the conduction of heat into glacier ice, the snow layer, and the presence of water at the interface between the snow layer and glacier ice, and takes into account refreezing during winter and during shorter cooling events by assuming a maximum water content of 5% by volume [36]. After calculating each components of glacier runoff, we used a linear reservoir approach [49] to route the runoff to the catchment outlet, in which the glaciers were subdivided into three reservoirs: an ice reservoir, defined as the area below the mean equilibrium [36]; a firn reservoir, defined as the area above 6000 m a.s.l. [31]; and a snow reservoir, defined as the snow-covered area outside the firn reservoir. To take account of the feedback between glacier mass change and changing glacier hypsometry, we applied volume–area/–length scaling [50,51] to adjust glacier length and the area–altitude distribution at the end of each mass balance year (defined as the period from 1 October to 30 September of the following year). The volume (V) of a glacier is related to its surface area (A) and its length (L) via a power law:
where ca, ci, γ, and q are scaling parameters, the values of which are 0.2055 m3−2γ [52], 1.7026 m3−2γ [53,54], 1.375 [51], and 2.0 [53], respectively. In the approach, glacier area was updated using Equation (7) after the computation of glacier mass change, and then the volume changes after each time step. After the volume changes, we adjusted glacier length using Equation (8), which determines the elevation range of the glacier at the end of the mass balance year by removing or adding area along the entire length of the glacier. This change is associated with the area–altitude distribution of the catchment.
To simulate the runoff from the glacier-free zone, we used a physically based hydrological model, which mainly incorporated five specific modules [40]. The five modules can be briefly described as follows. Snowmelt (QSM) was calculated using the surface energy–mass balance model over the snow surface, which is similar to Equation (5). The initial snowpack was assumed to be zero at the end of the melt season in the first year of the simulation, and then to increase with additional snowfall or decrease with snowmelt or evaporation. Rainfall runoff (QRR) was simulated by applying the US Soil Conservation System (SCS) curve number approach [55]. The actual evaporation was derived from the potential evaporation, which was calculated using the Penman–Monteith equation [56]. The baseflow (QBF) was estimated by applying the two-reservoir approach, which consists of the slow- and quick-reacting linear reservoirs of baseflow generation developed by Luo et al. [57]. Finally, we used a recession function [58] to rout the runoff from each elevation band, which was calculated as the sum of snowmelt, rainfall runoff, and base flow through the channel systems to the catchment outlet.
2.3.3. Model Initialization
At the start of the modeling period, the initial glacier volume of the catchment was estimated from glacier area in 1994. According to glacier surface characteristics obtained from field surveys [31], we set snow above the equilibrium line altitude [36] to initialize the surface type at the end of the melt season in the first year of the simulation. The surface type was then updated in every elevation band of the catchment based on the simulation of daily snowfall and melt.
2.3.4. Model Performance
The glacio-hydrological model used in this study was calibrated and validated by comparing runoff and melt rate simulations to observations in the Hailuogou catchment over different periods [40]. According to the good performance of the model, the same model configuration and model parameters were are used directly in the catchment for the 1988–2017 period.
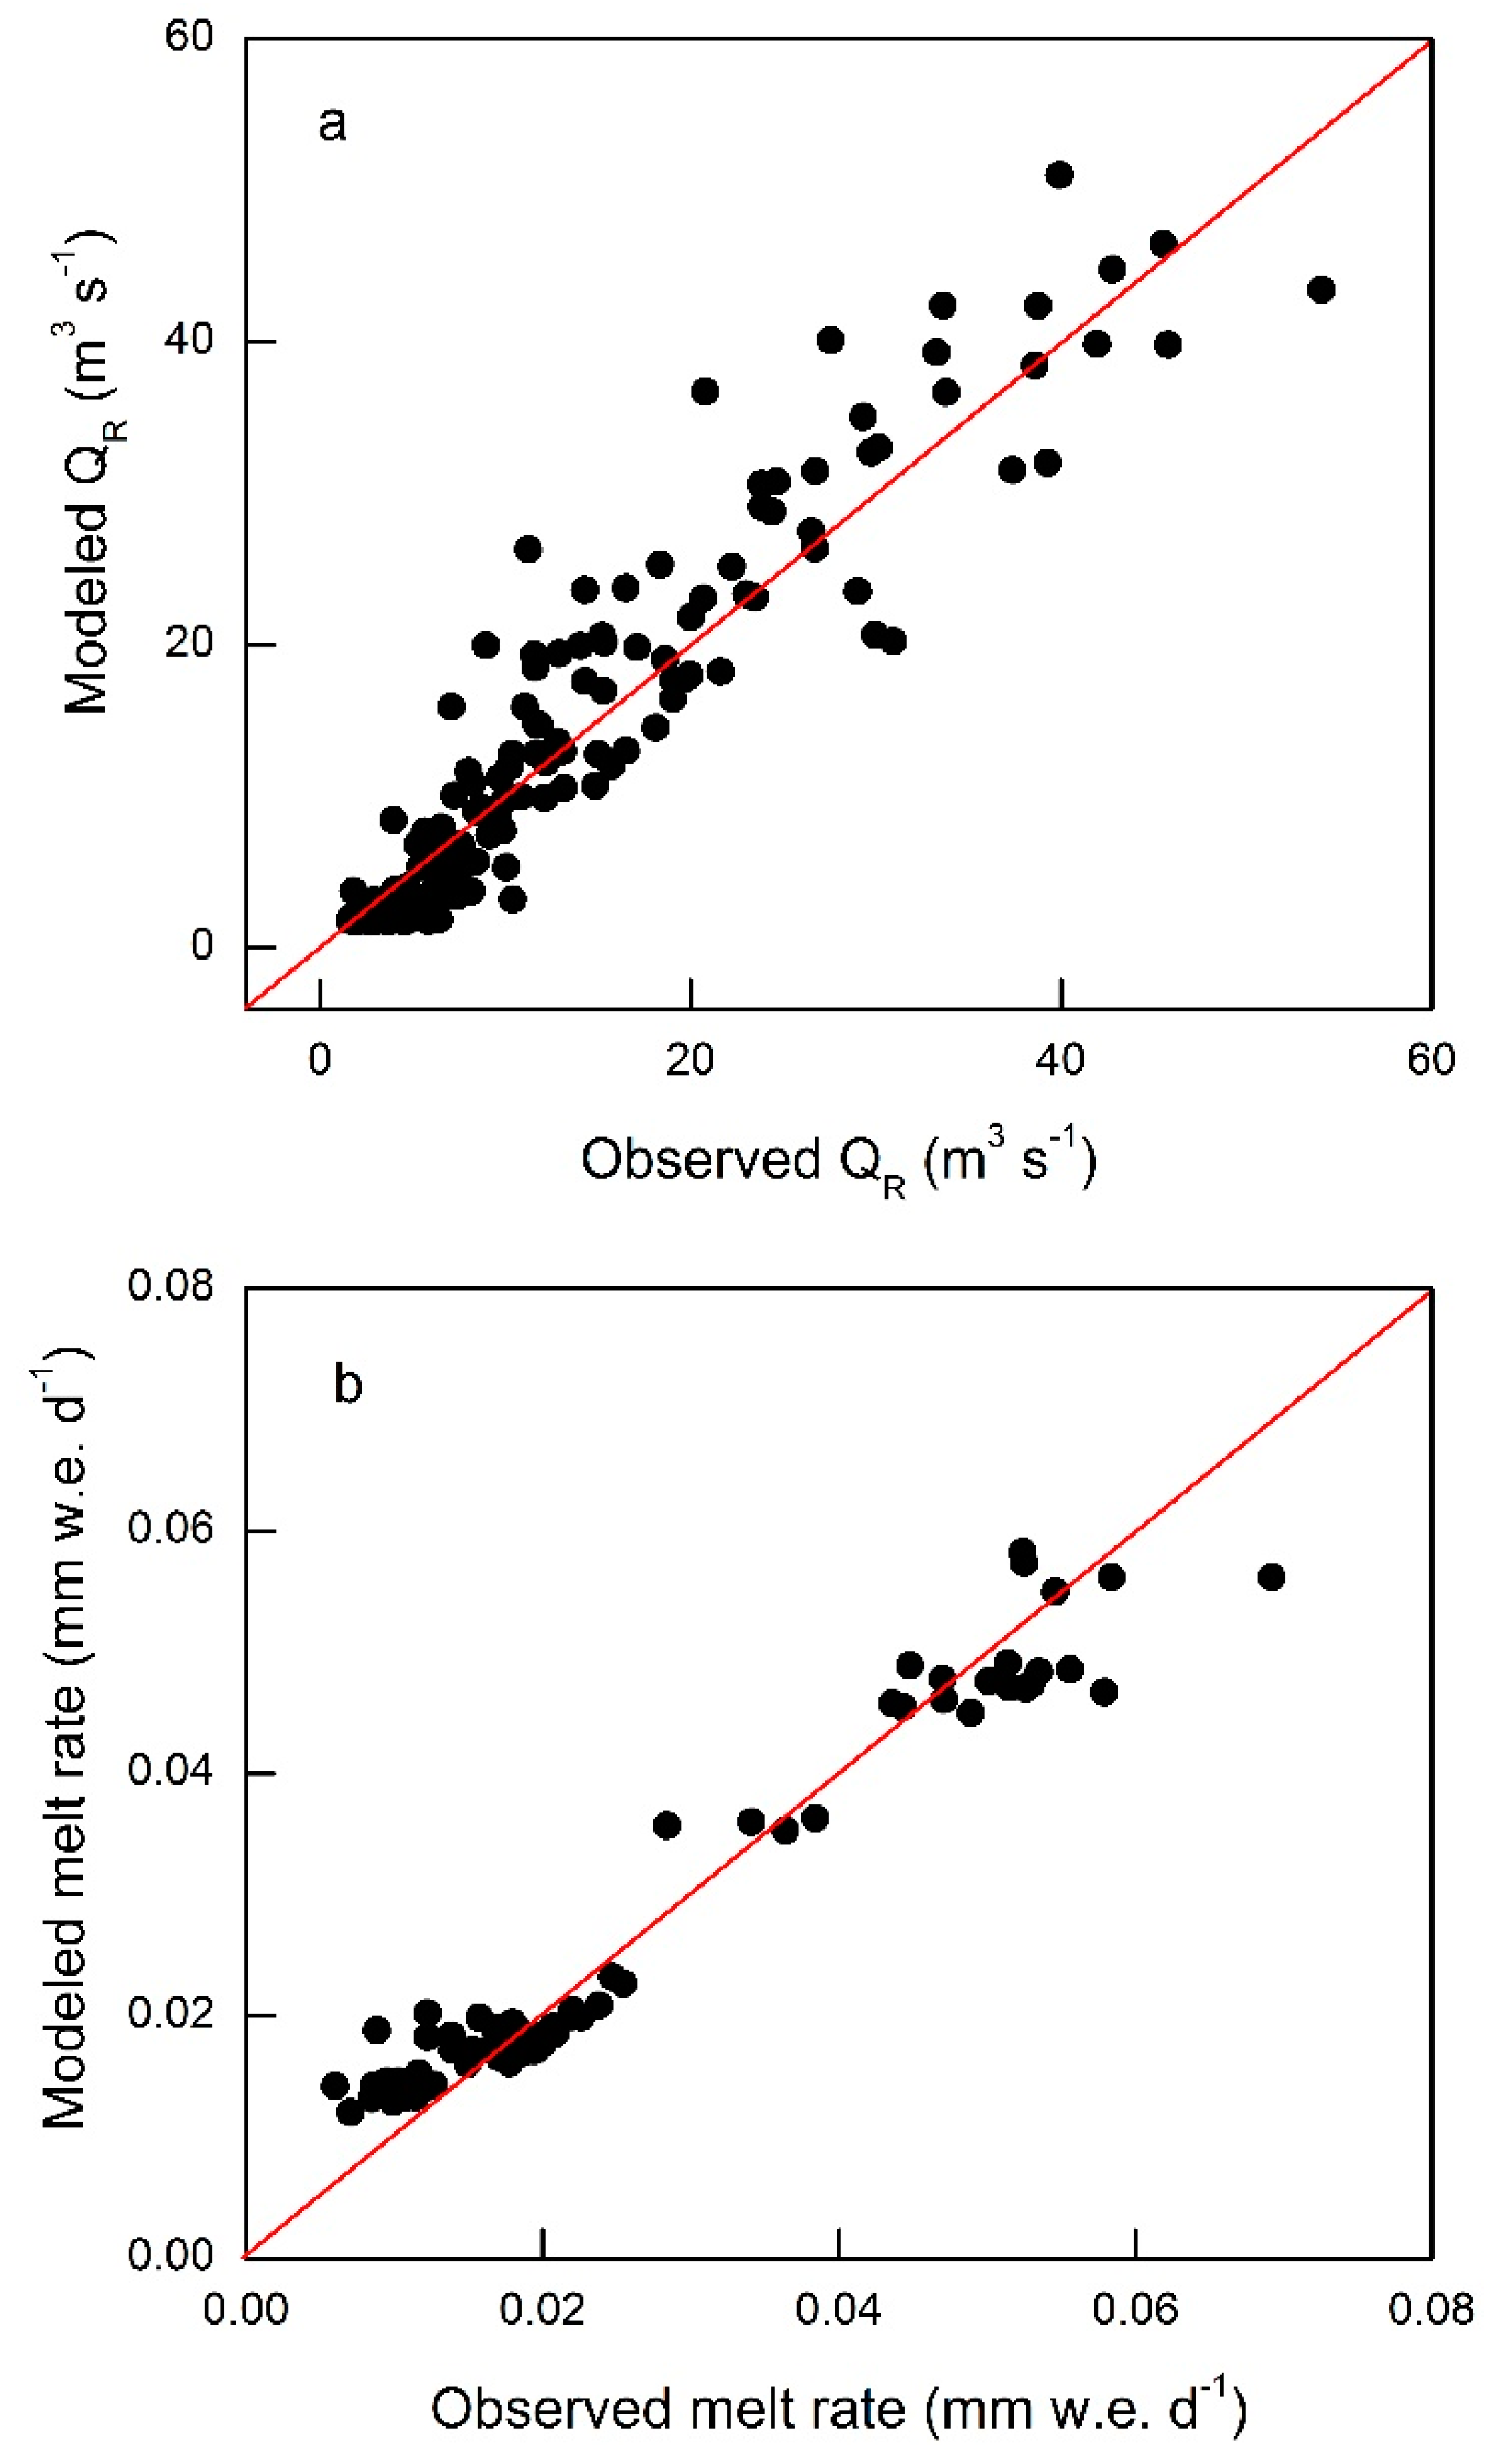
Two criteria were used to evaluate the model performance, including the Nash–Sutcliffe efficiency (NSE) [59] and the percent bias (PBIAS) [60]. According to the NSE and PIBAS values, Moriasi et al. [60] classified model performance into four types: “very good”, “good”, “satisfactory”, or “unsatisfactory”, where 0.75 < NSE ≤ 1.0, 0.65 < NSE ≤ 0.75, 0.50 < NSE ≤ 0.65, or NSE ≤ 0.50, respectively, and where PBIAS < ±10.0%, ±10.0% ≤ PBIAS < ±15.0%, ±15.0% ≤ PBIAS < ±25.0%, or PBIAS ≥ ±25.0%, respectively. As shown in Table 2, model results during the calibration and validation periods demonstrated a close agreement between observed and modeled runoff in terms of NSE and PBIAS values. A scatter plot of modeled versus observed monthly runoff is shown in Figure 3a, which indicates that the model generally reproduced runoff observations well during the study period. Furthermore, a comparison of simulated glacier area changes and satellite-based observations over different periods indicated that the two independent approaches showed good agreement, yielding a NSE value of 0.85 and a PBIAS value of −7.0% [40], implying that our model was able to capture the feedback between glacier mass balance and changes in glacier area. Therefore, it was certain that the model was well able to reproduce all key glaciological and hydrological processes of the catchment (Table 2 and Figure 3), with a rating of “very good” on the Moriasi et al. scale [60].
Importantly, the modules of the model considering the spatial feature of debris cover and its influence, had previously been thoroughly tested and evaluated by a comparison of observed and modeled melt rates over different periods and at different thicknesses of debris layers on the Hailuogou Glacier [36,40]. Figure 3b shows a scatter plot of modeled versus observed melt rates beneath different debris thicknesses over different periods, which indicates that the model successfully reproduced melt rates over different periods and at different debris thicknesses with a small root-mean-square error (RMSE).
2.4. Assessment of Debris-Cover Effect
To systematically assess the debris-cover effect on the ice-melting pattern, a melt ratio (MR) was proposed, which was defined as the sub-debris melt rate divided by the melt rate under an assumption of no debris in the same pixel. Ice melt rates at these two conditions for each pixel were calculated using Equations (5) and (6), respectively, and averaged over the 1988–2017 period. Here, the pixel resolution for ice melt calculation was the same as the dataset of thermal resistances of debris layers. The value of MR was larger than 1.0, meaning that the ice melting beneath the debris layer was accelerated compared to bare ice (hereafter “acceleration effect”), while the MR of less than 1.0 means that the presence of the supraglacial debris attenuated the ice melting (hereafter “insulation effect”). In addition, the value of MR was equal to 1.0, which indicates that the sub-debris melt rate equaled that of bare ice.
To evaluate the influence of accelerated/inhibited melt due to the heterogeneous distribution of debris thickness on the total runoff of the catchment, a sensitivity calculation was performed. In this experiment, we recalculated the total runoff using the same model as the control simulation by assuming no debris cover on three debris-covered glaciers in the catchment and no change in other model parameters.
3. Results
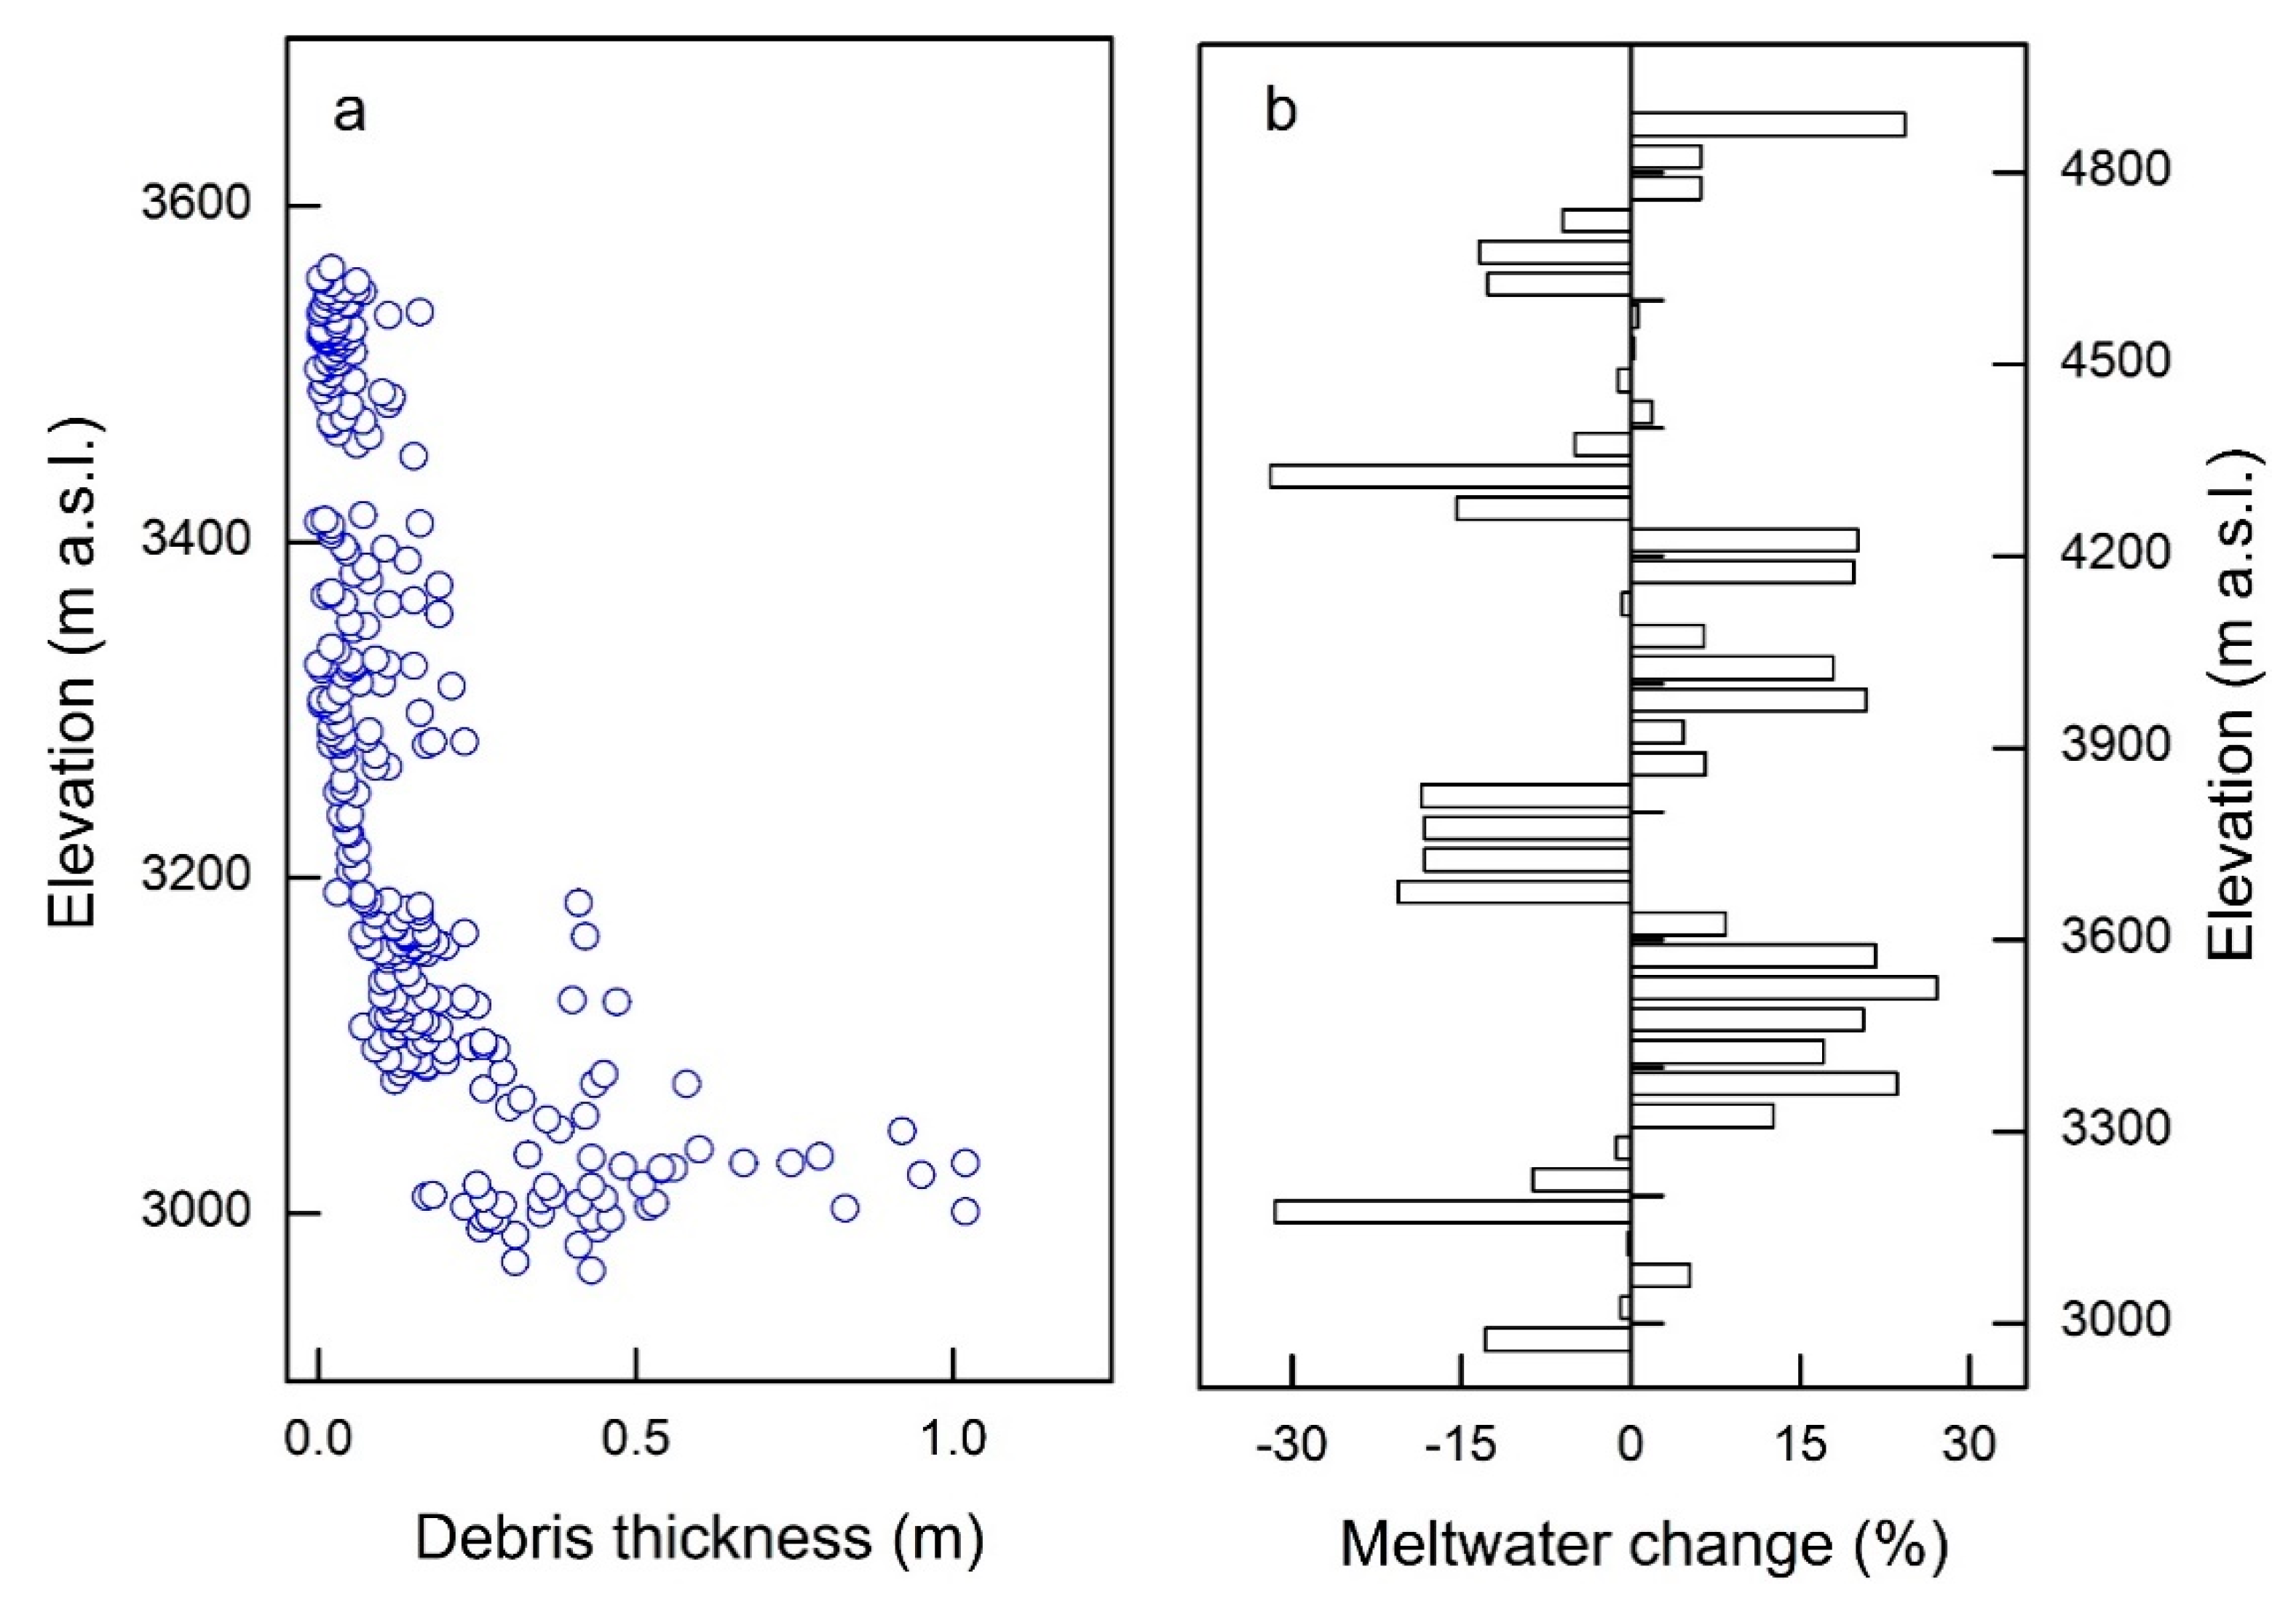
In the Hailuogou catchment, the debris-covered glacier is dominant (Table 1 and Figure 1). Debris-covered surface accounts for ~8.2% of the total glacier area in the catchment (Figure 1), which is mainly concentrated between 2990 and 4900 m a.s.l. (Figure 1b). Of the three debris-covered glaciers, the mean thermal resistance of the debris layer was the smallest for Glacier No. 2, whereas the mean value was the largest for Glacier No. 1. High-resolution field surveys of debris thickness on the Hailuogou Glacier showed a down-glacier increase in debris thickness and considerable variability at the same elevation (Figure 4a), of which more than half had a thickness of less than 0.1 m.
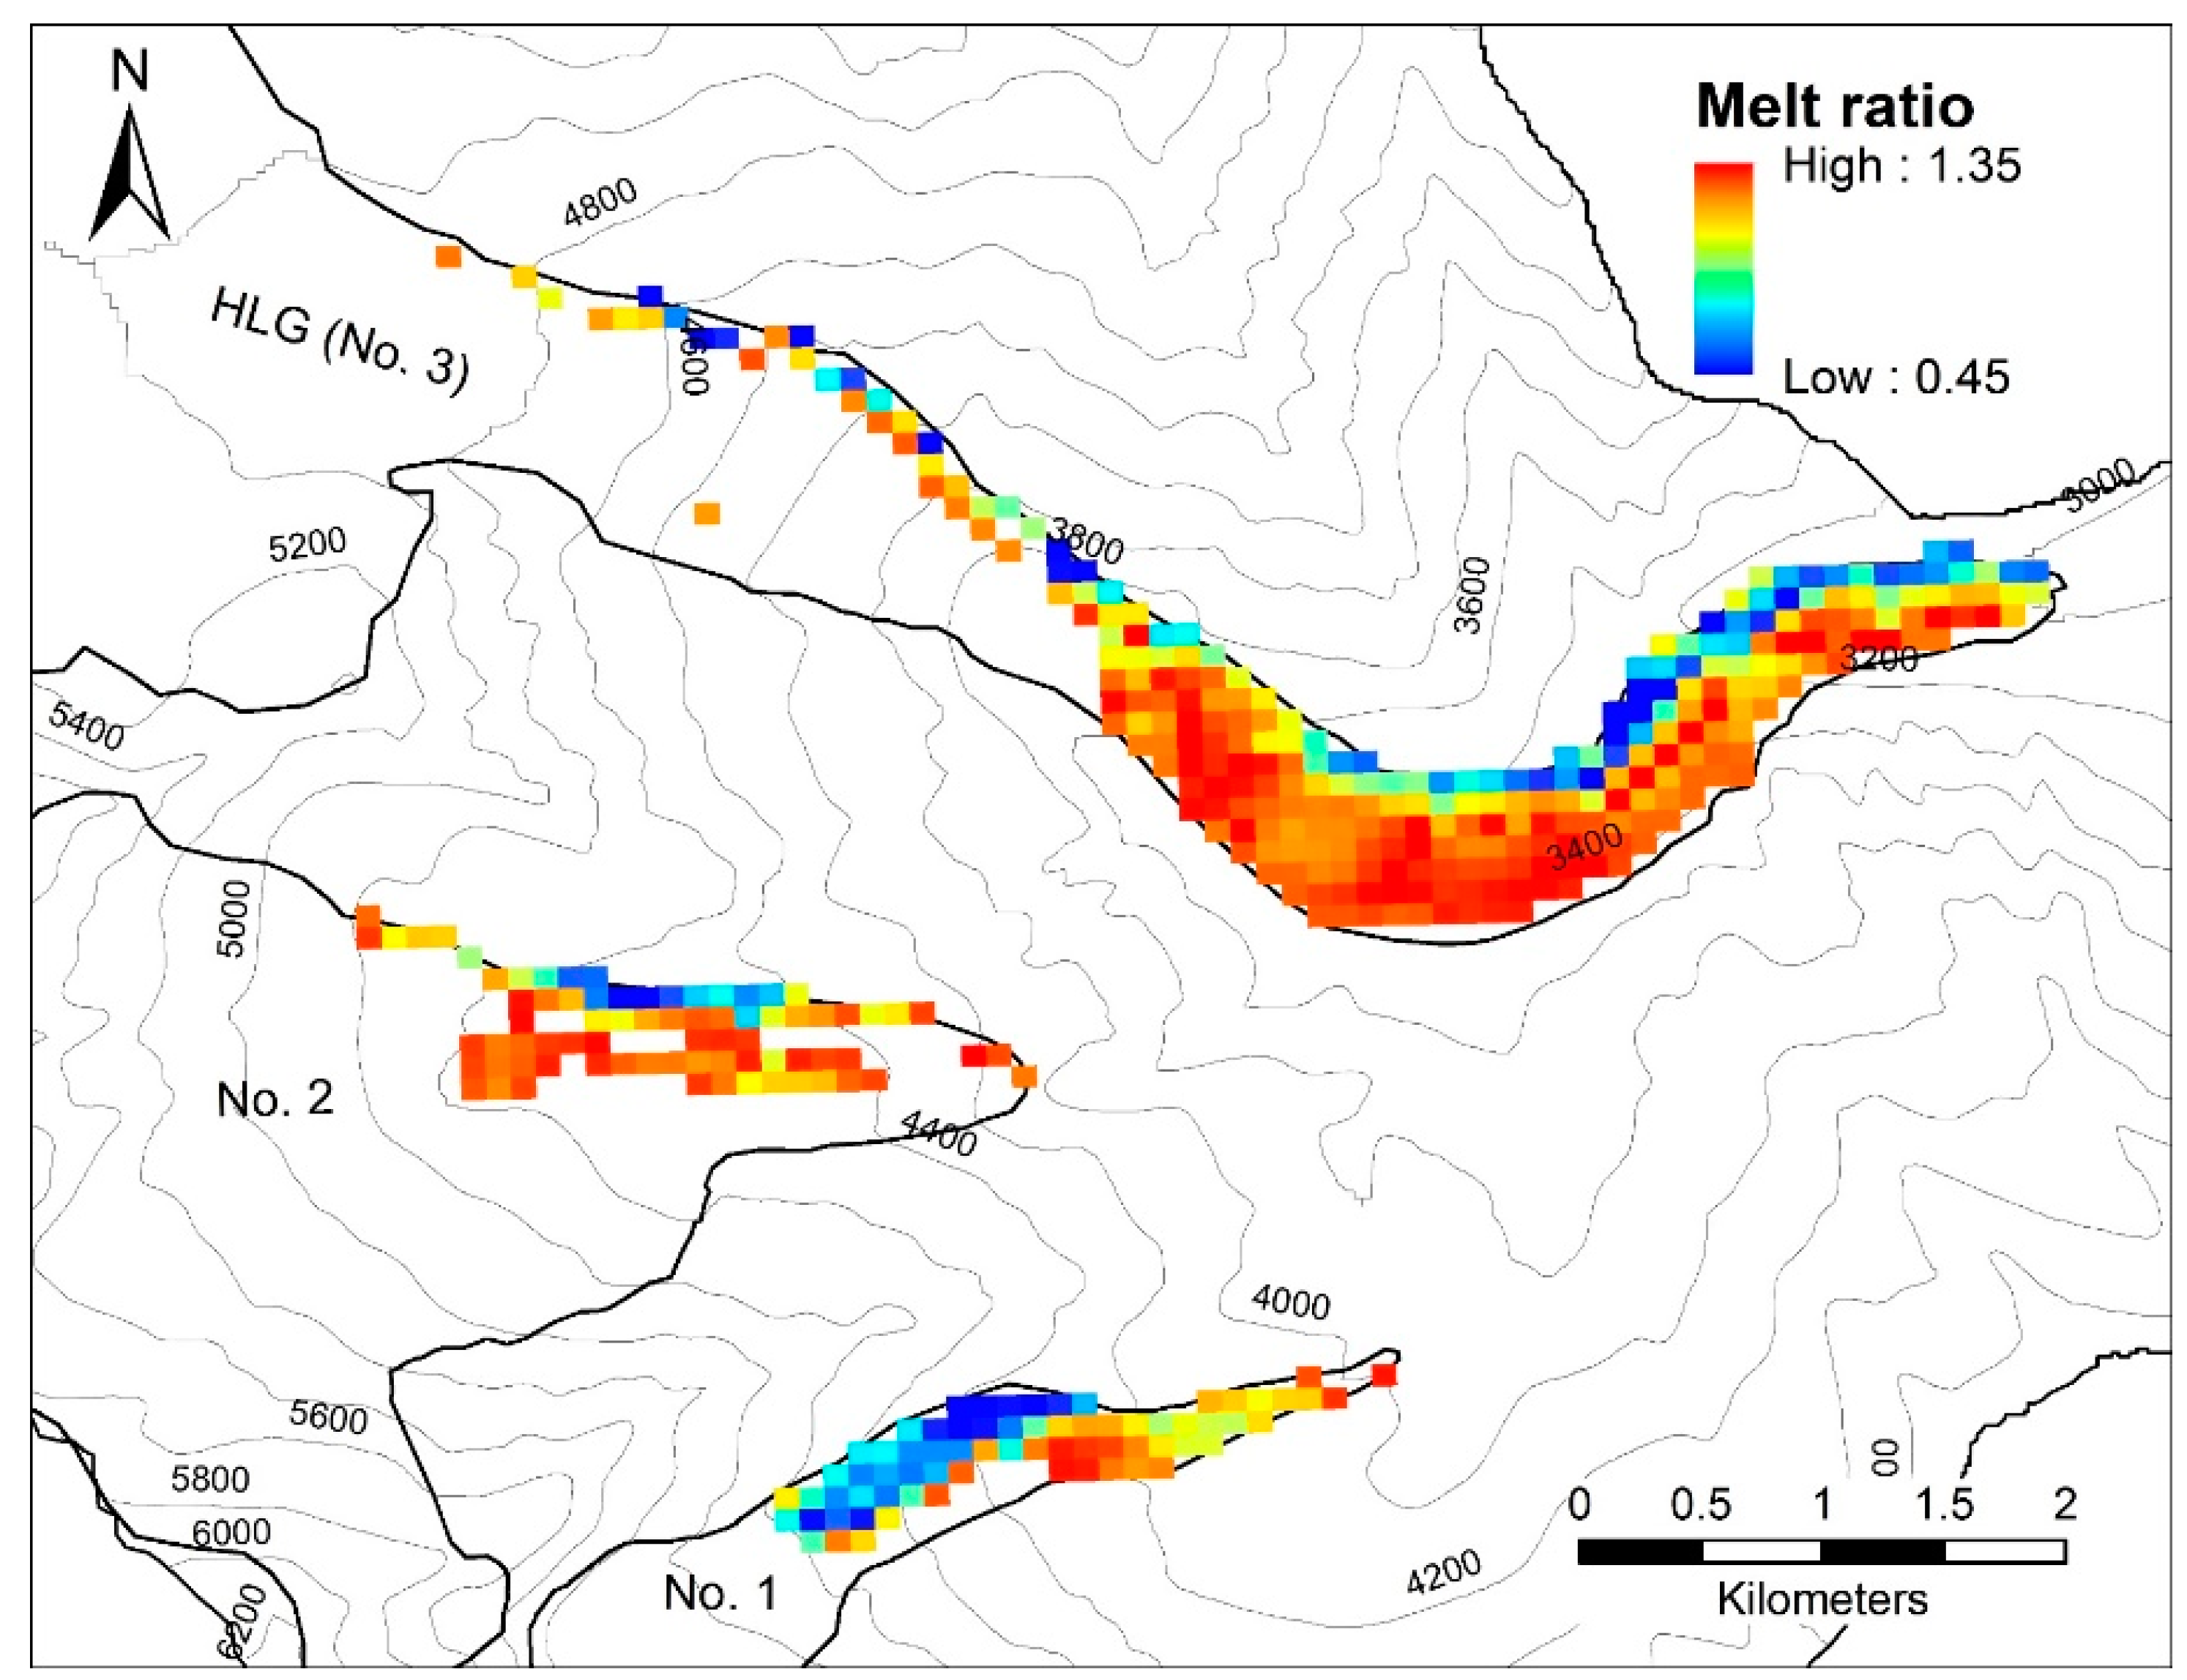
Figure 5 shows the spatial distribution of the melt ratio (MR) on the three debris-covered glaciers of the catchment, in which we found different debris-cover effects on the three debris-covered glaciers over the period 1988–2017. The acceleration effect of debris cover was dominant on the Hailuogou Glacier and Glacier No. 2, while the insulation effect is dominant on Glacier No. 1 (Figure 5). For the Hailuogou Glacier and Glacier No. 2, about 40.0% and 27.0% of the ablation zones, where the MR > 1.0, have undergone accelerated melting over the past three decades, while about 16.0% and 7.0% of the ablation zones, where the MR < 1.0, have experienced inhibited melting (Figure 5). For Glacier No. 1, in contrast, about 44.0% of the ablation zone has experienced inhibited melting, while 36.0% shows accelerated melting (Figure 5). Although the supraglacial debris on Glacier No.1 shows a significant insulation effect, the Hailuogou catchment is overall characterized by the acceleration effect of debris cover. For the entire catchment, about 36.1% of the ablation zone has experienced accelerated melting and 16.2% showed inhibited melting. This implies that significant excess meltwater is supplied from the debris-covered surface.
To systematically assess the influence of the excess meltwater generated by the acceleration effect of debris cover on the total runoff, we performed a sensitivity experiment, in which the total runoff was recalculated with the assumption of no debris covering the ablation zones of three debris-covered glaciers, using the same model as the control run in the real surface condition. A comparison between the control run and the calculation with the no-debris assumption indicated that the mean annual meltwater generated from the real surface condition increased by approximately 24.0% over the past three decades compared to that in the assumed no-debris surface (Figure 4b). As shown in Figure 4b, the debris-covered area below 4000 m a.s.l. generates significant excess meltwater compared to the assumed no-debris surface, contributing about 70.0% of the total increased meltwater caused by the acceleration effect of debris cover. In particular, much more meltwater was attributed to the debris-covered area below 3600 m a.s.l. (Figure 4b), which supplies more than half of the total increased meltwater in the catchment. As a consequence of the significant excess meltwater generated from the debris-covered surface, the total runoff increases by approximately 11.0% for the 1988–2017 period compared to that under the assumed no-debris surface.
4. Discussion
4.1. Runoff Components and Their Contributions
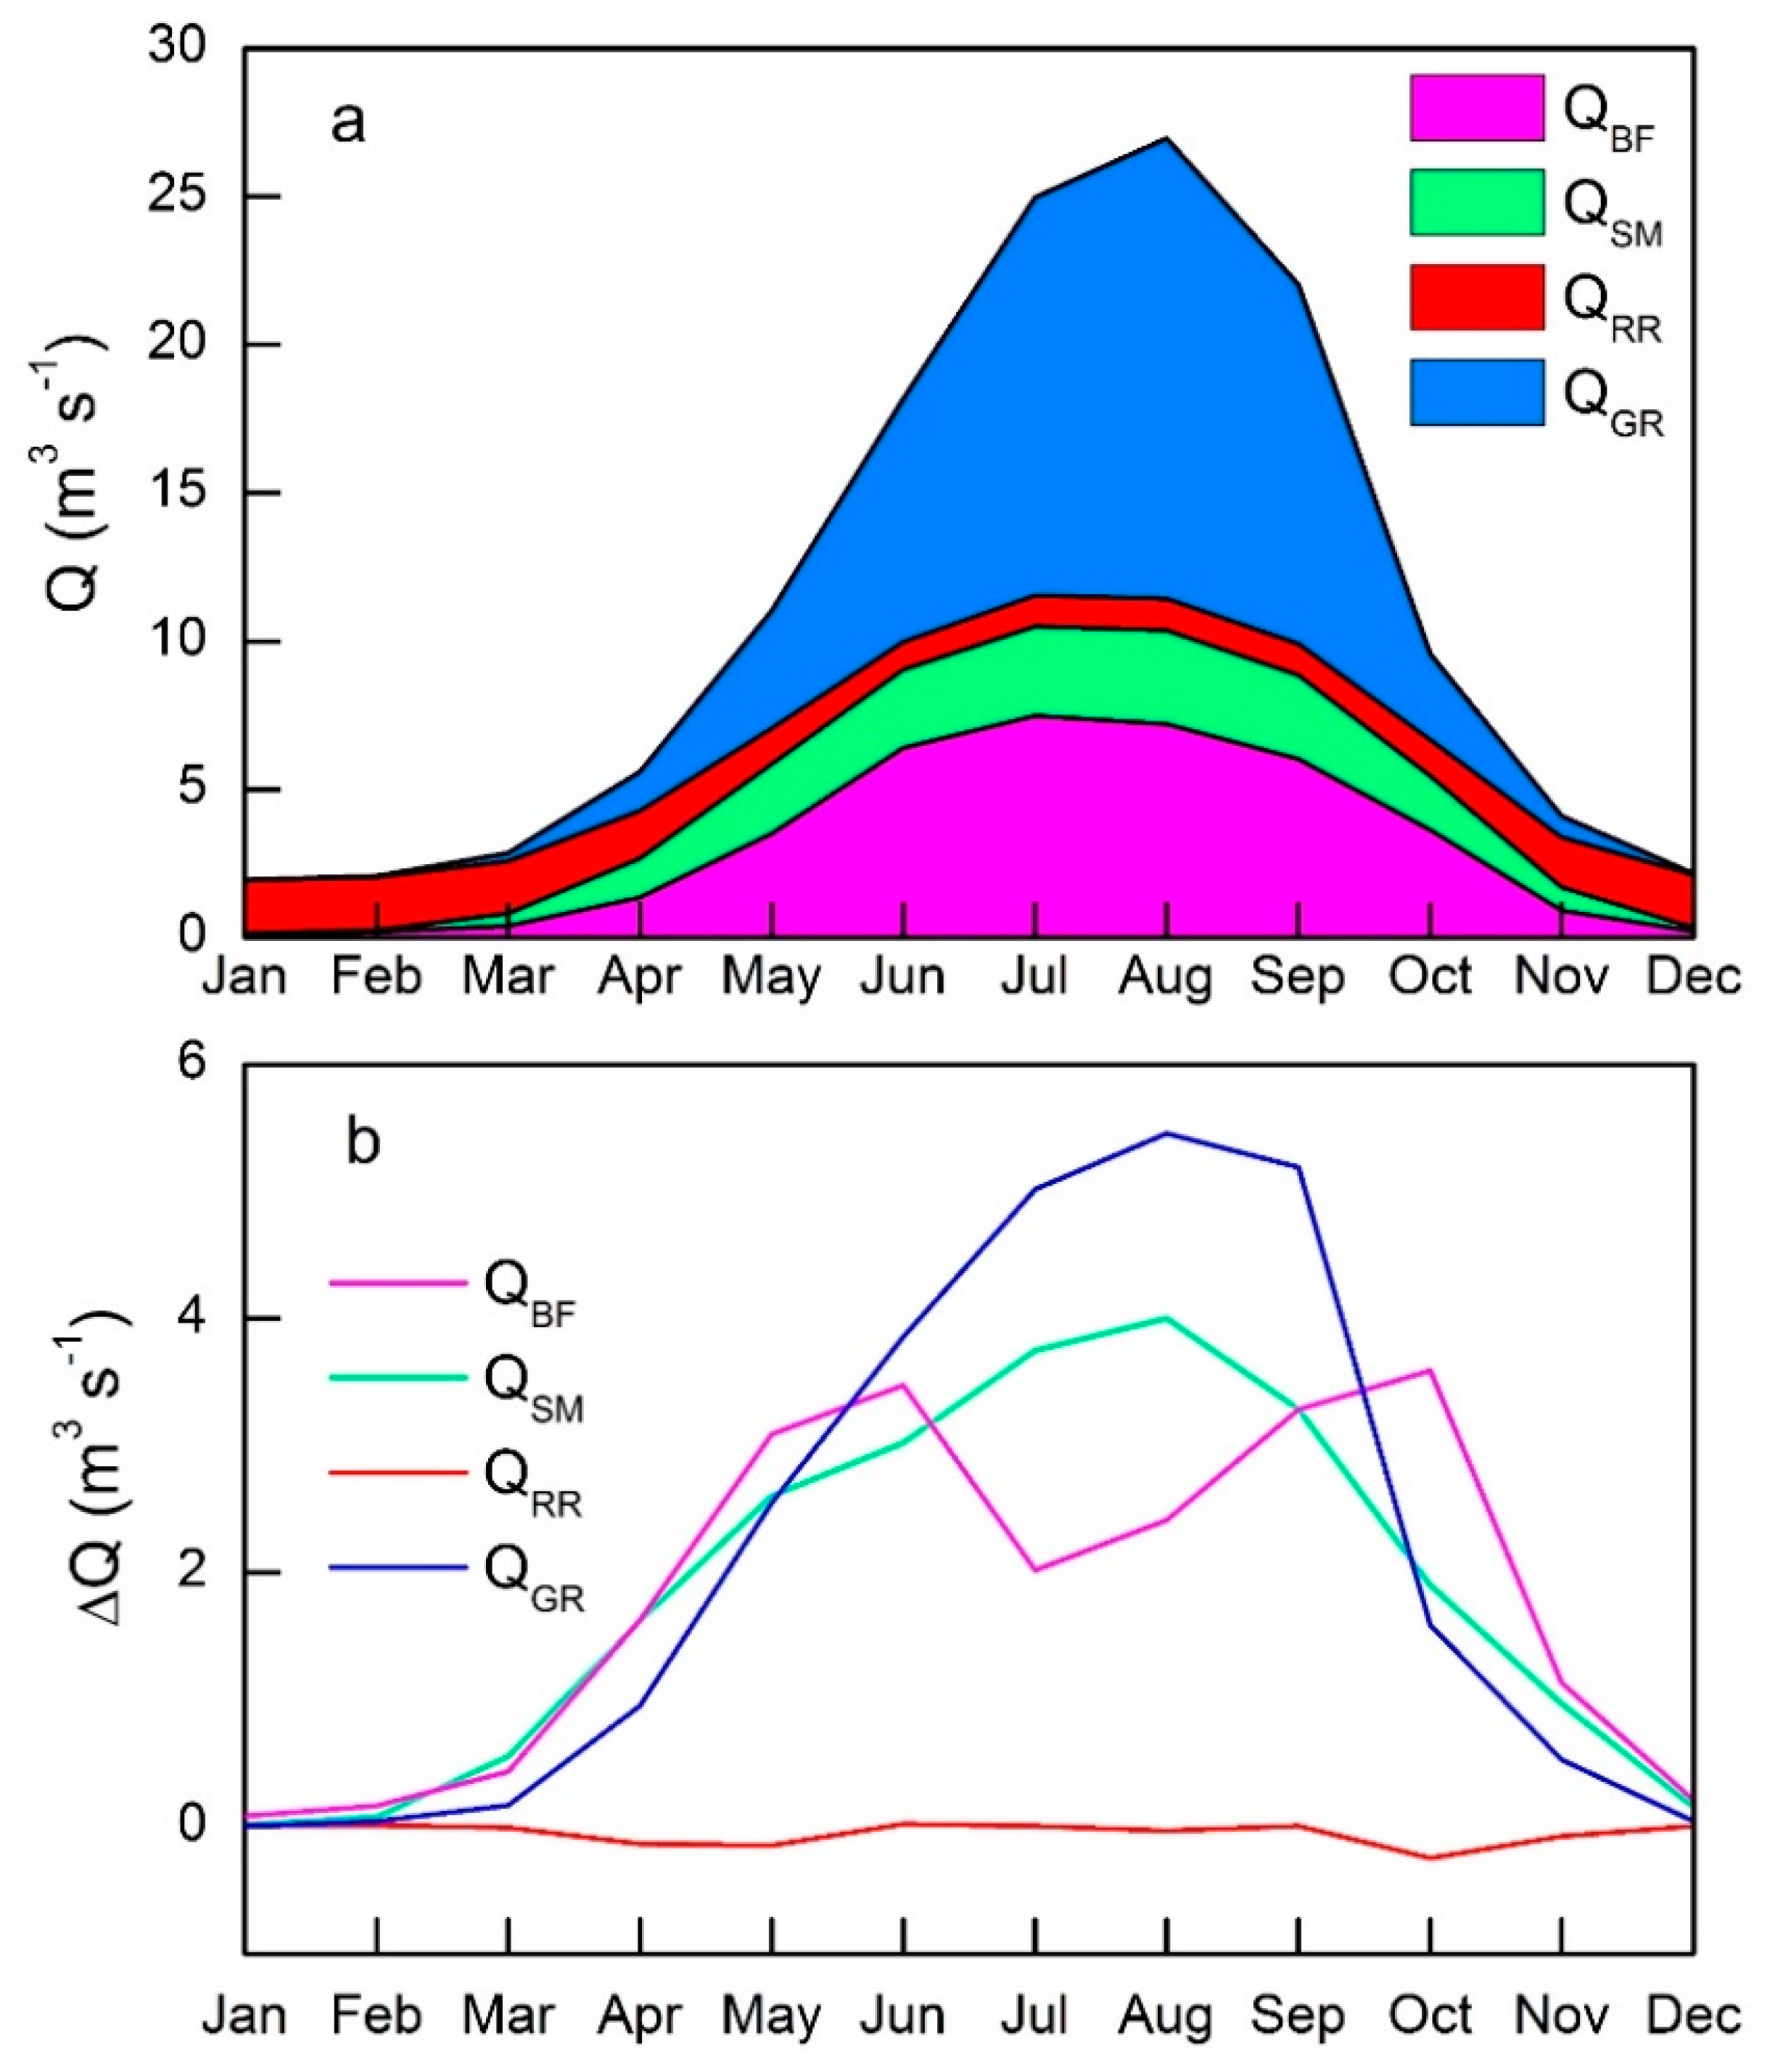
Variation in the total runoff and its components was estimated in the Hailuogou catchment using observed meteorological data for the 1988–2017 period. According to our simulation, we found that glacier runoff has been the dominant contributor to the total runoff in the Hailuogou catchment over the past three decades (Figure 6a), accounting for about 45.1% of the total runoff. Besides glacier runoff, the baseflow, snowmelt, and rainfall runoff have contributed about 28.5%, 13.4% and 13.0%, respectively, in the past three decades. In particular, with significant increases in glacier runoff (Figure 7a), the contribution of glacier runoff increased dramatically in the past decade, exceeding 50% of the total runoff; meanwhile, the contribution of the rainfall runoff decreased and the rest of runoff components remained relatively stable.
Model simulation indicates that all runoff components fluctuated with an insignificant change trend prior to 1997. In contrast, except the rainfall runoff, which decreased slightly, glacier runoff, snowmelt and baseflow increased markedly after 1997. As a result, the total runoff increased by 83.0% after 1997, of which near 40.0% was attributed to increased glacier runoff. In the past decade, increased glacier runoff contributed ~54.0% to the increased river runoff, while the rainfall runoff contributed less to the increased runoff.
As shown in Figure 6a, the contribution from glacier runoff reached a maximum in August (58.0%) and varied from 31.0% to 55.4% during other months of the melt season. About 96% of the average annual glacier runoff is observed during the melt season, and the peak occurs in August (Figure 6a), which is consistent with catchment runoff observations. During the winter months, the rainfall runoff is a large component of the total runoff (Figure 6a); the contribution from snowmelt reaches a maximum in April (~24%) and is also significant in the months of October and November. The contribution from baseflow remains relatively stable in the catchment.
Monthly changes in each of the runoff components indicates that glacier runoff, baseflow, and snowmelt increased across all months for the 1998–2017 period in comparison with the measurements prior to 1997 (Figure 6b). In contrast, the rainfall runoff has decreased during most spring and autumn months. In the past decade, the rainfall runoff has decreased significantly in all months except the winter months, where it has increased slightly (Figure 6b).
4.2. The Role of Debris Cover in the Catchment Hydrology
In the Hailuogou catchment, we found that debris cover along the northern lateral margin of all three debris-covered glaciers was relatively thicker compared to the southern lateral margin (Figure 1b). This distribution is primarily controlled by the topographic settings of the three debris-covered glaciers [40]. In the catchment, debris on these glaciers is derived mainly from avalanches and rockfalls on mountain slopes [31]. Recent findings by Nagai et al. [61] suggest that the steeper the local relief around the glacier, the more developed the debris-covered area will be, and the most active debris production occurs on south-west-facing slopes (defined as 90–270° clockwise from north). As shown in Figure 1a, most of the slopes at the northern lateral margin of the three debris-covered glaciers are south-west-facing slopes as defined by Nagai et al. [61], and are steeper than those at the southern lateral margin.
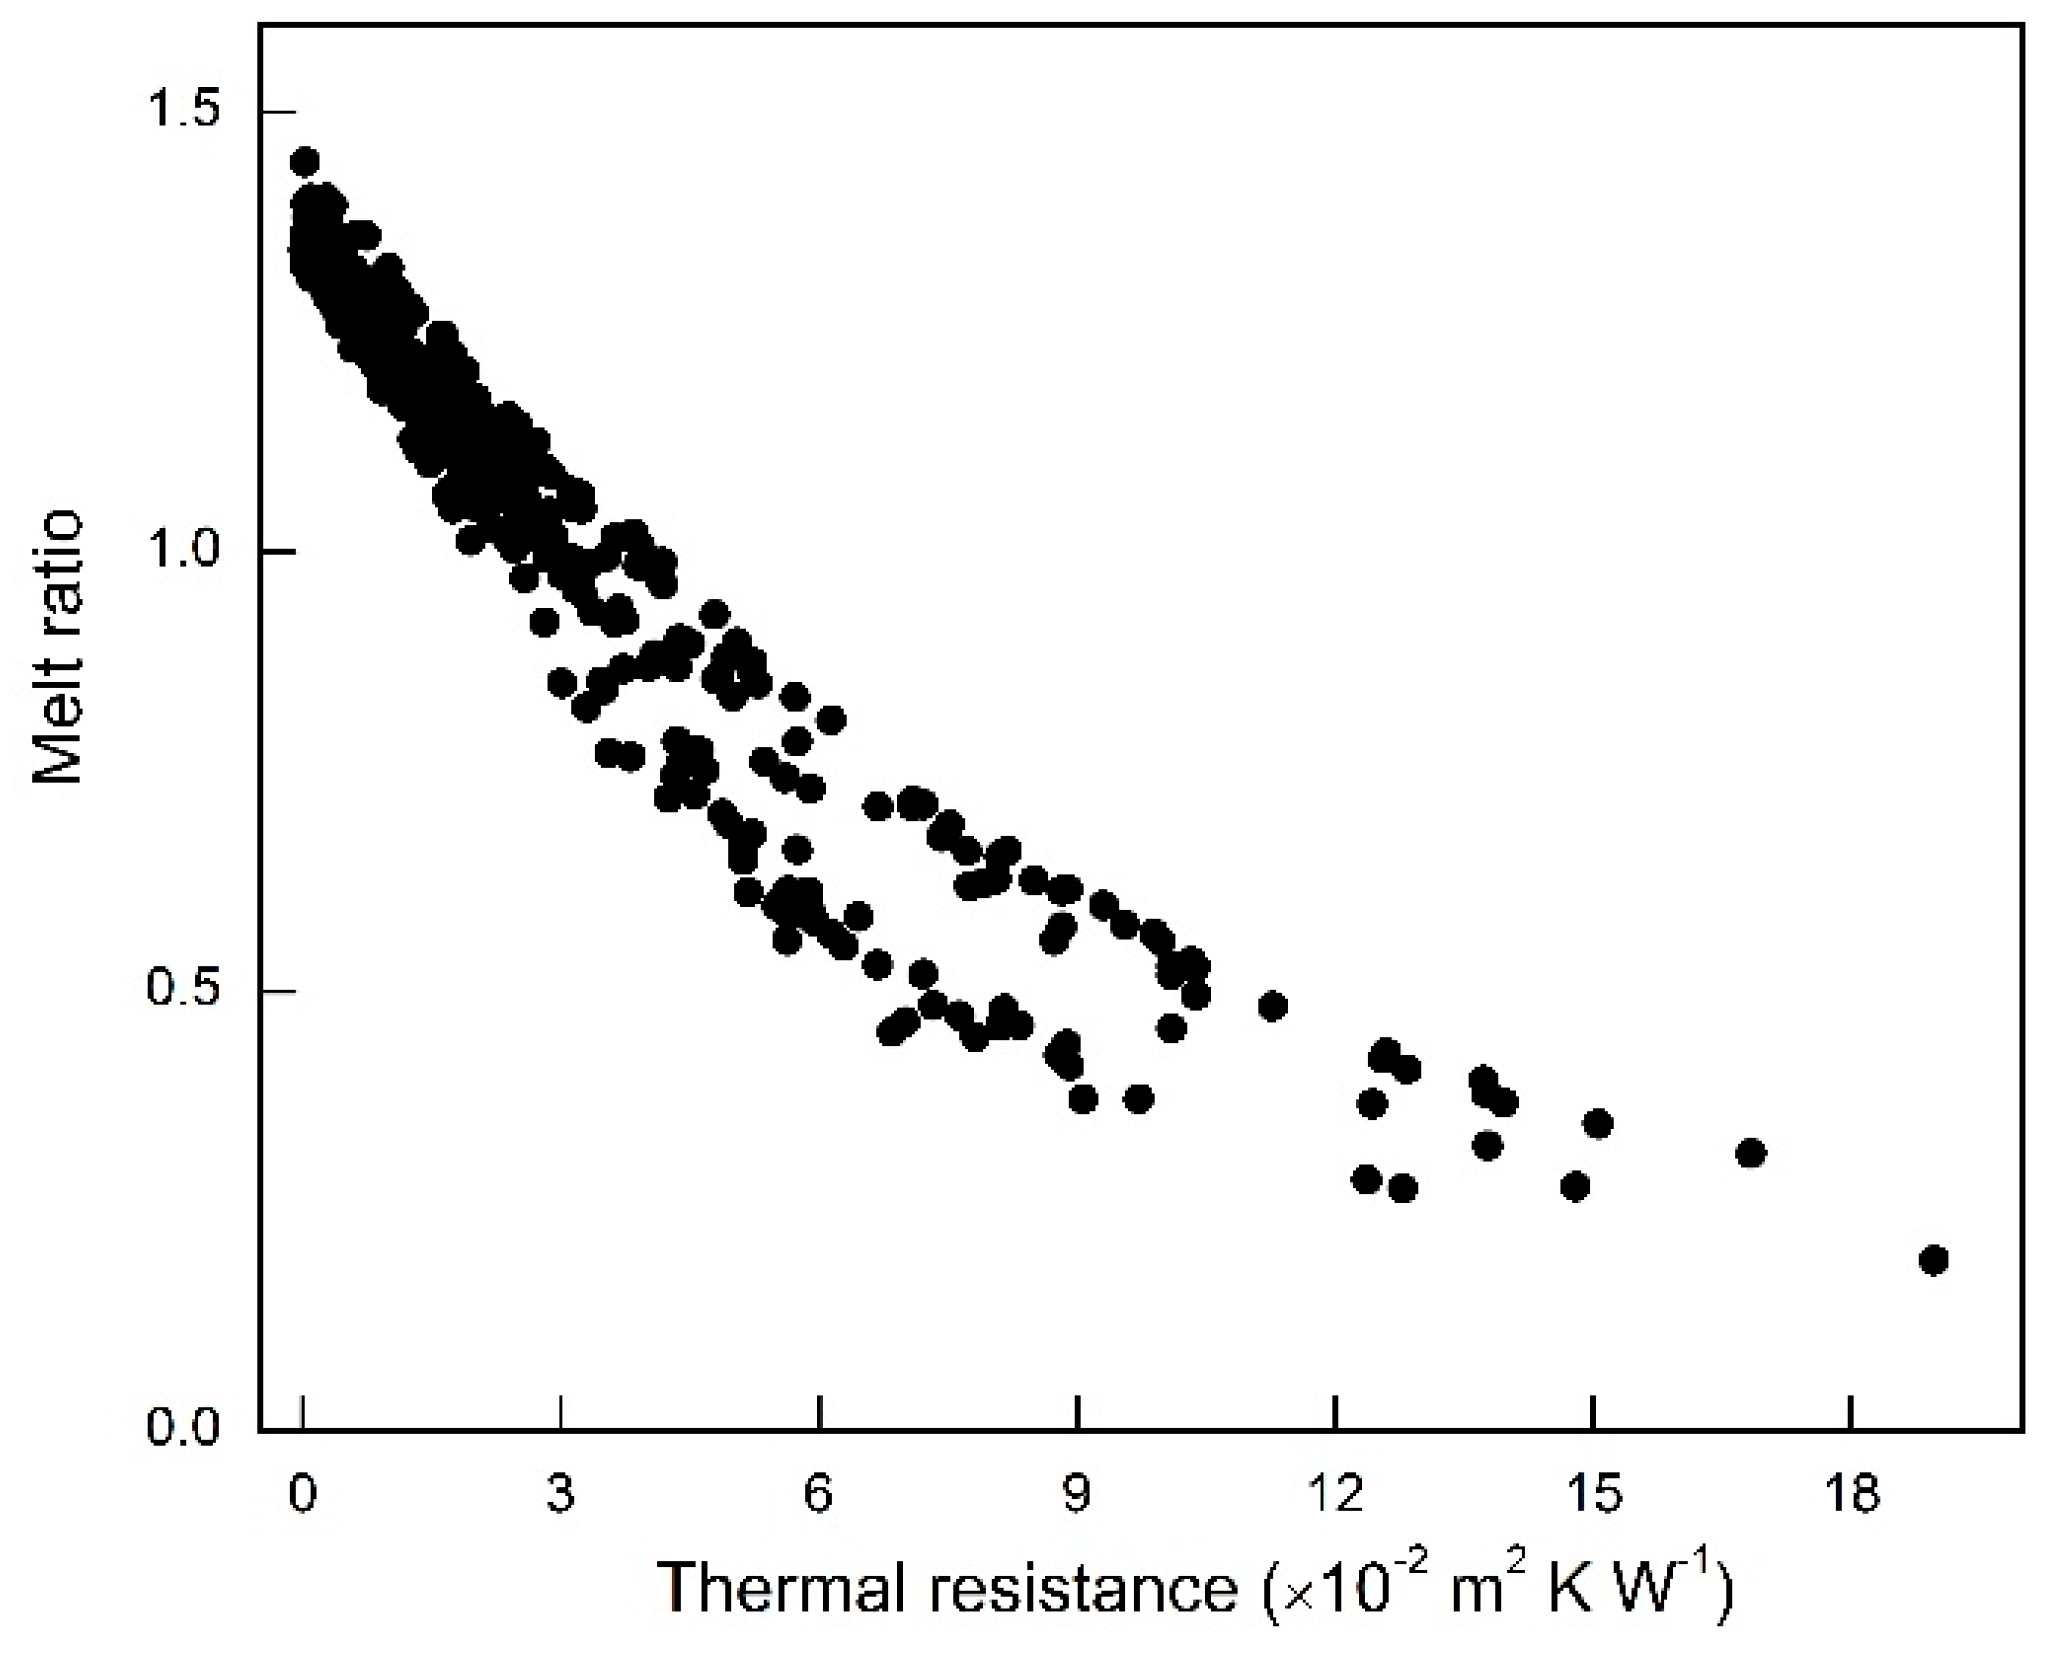
Experimental field studies [14,15] have revealed that beneath thin debris (~0.02–0.03 m), the melt rate is accelerated relative to that of bare ice, while debris layers thicker than a few centimeters attenuate ice melting. However, there has been no such experiment on the glaciers of the Hailuogou catchment. Although we could not find the critical debris thickness of ~0.02–0.03 m according to field surveys of ice melt rates in the catchment, the spatial distribution of the melt ratio calculated in the study revealed a critical value of thermal resistance of the debris layer (Figure 8), which is 3.1 × 10⁻² m2 K W−1. As shown in Figure 8, the melt ratio equaled 1.0 at this value of the debris layer thermal resistance. This implies that beneath the critical value of the thermal resistance, the melt ratio is larger than 1.0 (Figure 8), which an acceleration effect of the debris cover, while above the critical value, the melt ratio is less than 1.0, which means an insulation effect of the debris cover.
Heterogeneous distribution of debris thickness leads to strong contrasting ablation and reversed ablation gradients in the ablation zone [18,30,62], and then affects the morphology and evolution of the hydrological system of a glacier [16,18,63], with important consequences for the formation of catchment runoff. It is well known that debris-covered glaciers are prevalent in the Tibetan Plateau and its surroundings [10,12,13], as well as in many other high mountain ranges of the world [11,21]. These glaciers show a distinct response to climate change compared to debris-free glaciers [10,18]. According to the second Chinese Glacier Inventory [64], China contains more than 1700 debris-covered glaciers, on which debris-covered surface accounts for 11.5% of the total area. In the Himalayas, about 30.0% of glaciers are covered by supraglacial debris [65], whereas approximately 68.0% of glaciers of Mount Gongga in the south-eastern Tibetan Plateau have extensive debris cover [13]. These debris-covered glaciers contain a particularly large ice volume [10,18,64]. Current evidence confirms that the debris extent is likely to increase globally [11,21], and its spatial distribution significantly influences the formation and evolution of glacial drainage systems [16,18,19,63]. Furthermore, the debris-cover effect, i.e., the acceleration/insulation effect, shows apparent regional differences in the Tibetan Plateau and its surroundings due to different debris-covered proportions [13,20,66,67]. Our finding mentioned above was in agreement with the study of Fujita and Sakai [20], in which they found that the debris-covered surface supplies significant excess meltwater to the total runoff due to the acceleration effect of debris thickness in a basin of the Nepal Himalayas. In contrast, the insulation effect of debris layer was found to be dominant on the Keqicar Glacier in south-western Tien Shan [67], where, compared to the real surface condition, the total runoff largely increased under the assumed no debris cover surface. Therefore, changes in the extent and thickness of debris cover in the Tibetan Plateau and surroundings strongly influence the formation of the total runoff in glacier-fed catchment by altering ice melt and its spatial patterns, with important implications for regional water resources.
As discussed above, our results highlight the importance of debris cover for better understanding of regional water resource change in the Tibetan Plateau and surroundings. Therefore, the debris-cover effect, which only a few studies have so far considered in glacio-hydrological models through physically-based approaches, should be taken into account in sufficient detail in order to realistically estimate water availability and improve management of water resources.
4.3. The Relationship Between Runoff, Glacier, and Meteorological Variables in 1988–2017
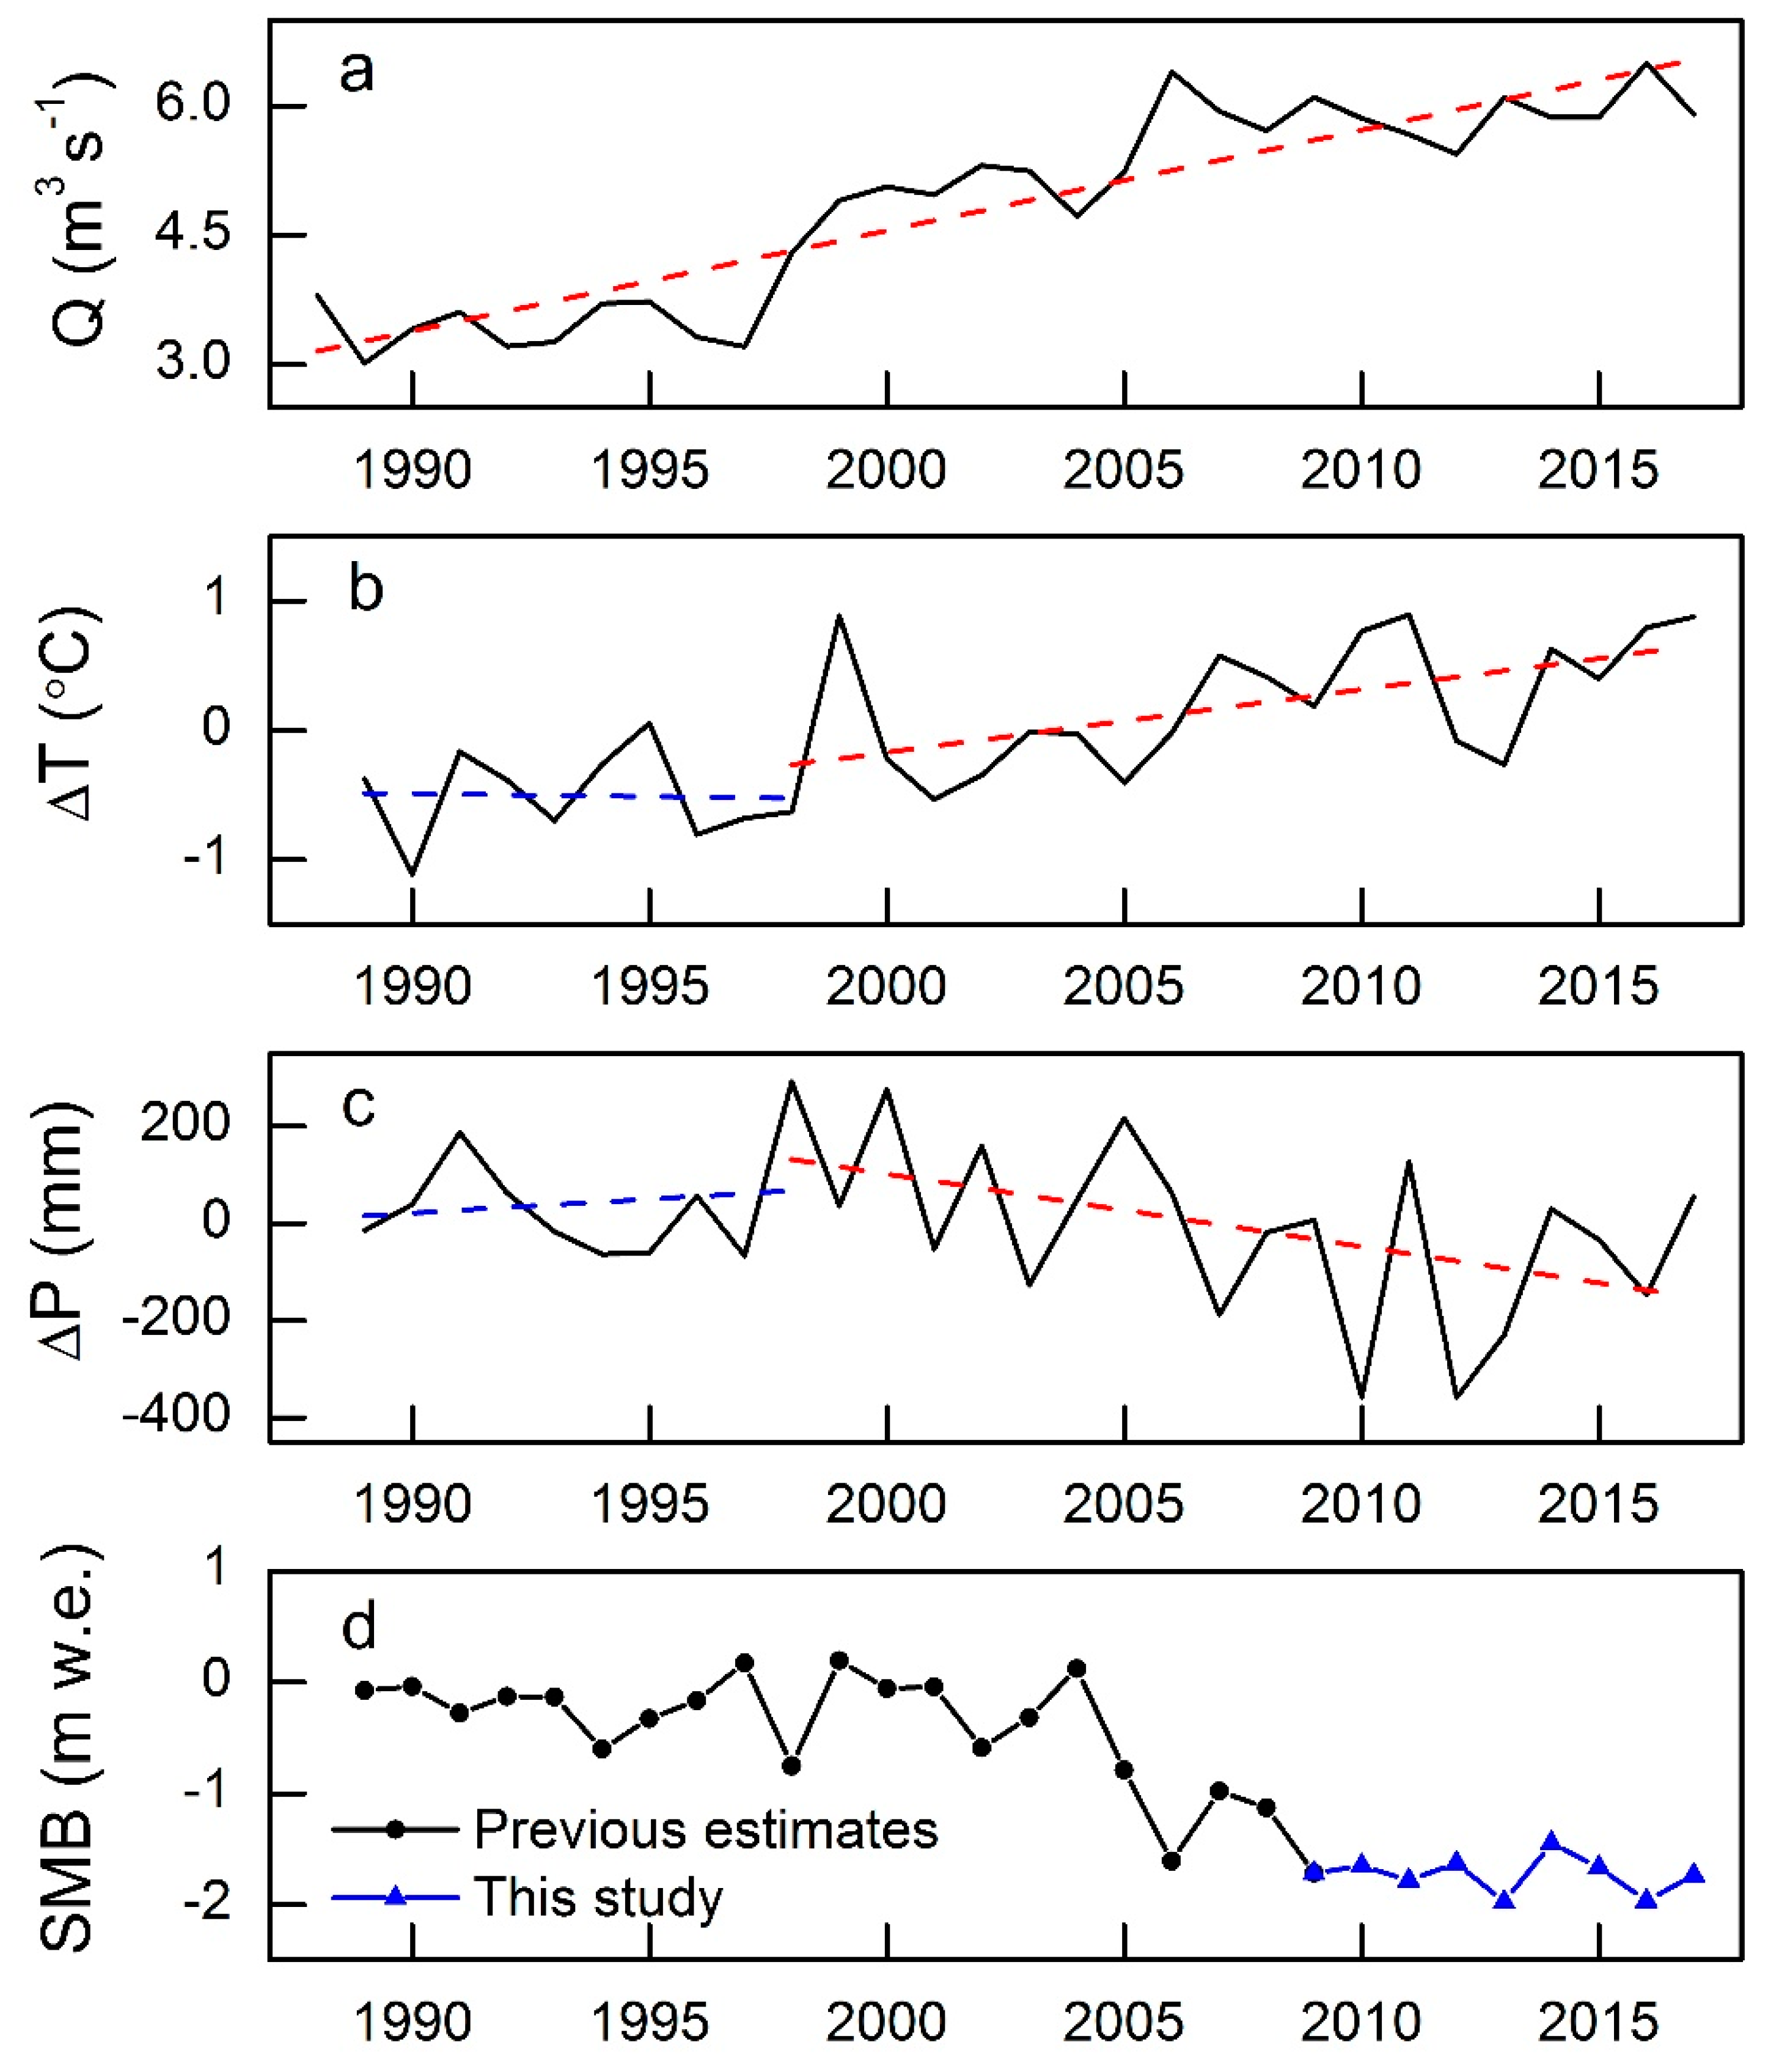
In the Hailuogou catchment, it is certain that air temperature has risen since the 1950s [36,40], and that this warming has been particularly marked in the past decade (Figure 7b). As revealed by the GAEORS meteorological records, each of the past three decades has been successively warmer than all previous decades, and the past decade has been the warmest (Figure 7b). Air temperature as calculated by a linear trend showed a warming rate of 0.5 °C per decade over the 1988–2017 period. After 2010, the rate of warming grew to 0.15 °C per year in the catchment. In addition, air temperature has increased in all months except December, and has risen most strongly during the winter months, with changes of 0.5–2.0 °C over the 2008–2017 period compared with 1988–1997.
Annual precipitation, in contrast, has overall shown a decrease at a rate of 54 mm per decade in the past three decades (Figure 7c). Prior to 1997, the precipitation showed a slight increasing trend of 5.8 mm year−1, while it began decreasing at a rate of 9.1 mm year−1 after that year. In comparison with 1988–1997, annual precipitation decreased by 3.4% between 1998 and 2017, especially in the past decade, when it reduced by 6.5%. Monthly precipitation has decreased in most months; the summer months decreased by 14.0% between 2008 and 2017 compared to 1988–1997.
As discussed above, the temporal distribution of river runoff in the Hailuogou catchment has been dominated by glacier runoff in the past three decades (Figure 6a). Therefore, glacier runoff plays a crucial role in the magnitude and timing of the annual hydrography and the seasonal redistribution of river runoff in the catchment. Note that glacier runoff trends principally rely on changes in the glaciers and associated responses to ongoing climate warming [68]. The glaciers of the Hailuogou catchment are maritime temperature glaciers that are more sensitive to temperature rise [36]. It has been confirmed that increasing temperature, especially summer temperature rise, is the main cause of rapid glacier wastage in the Hailuogou catchment [36,37,38]. In response to continued warming (Figure 7b), glaciers of the catchment have experienced marked mass loss in the past decades [34,35,36,37,38]. The mean annual mass loss of the whole glaciers in the catchment was about −0.42 m w.e. for the period 1952–2009 [36], and the surface elevation change of the Hailuogou Glaciers, the largest glacier in the catchment, was approximately −1.15 m per year for the 1989–2010 period [38]. Our estimates confirmed an accelerated trend in glacier mass loss for the 1998–2017 period, with an average rate of −1.1 m w.e. (Figure 7d), which is much more negative than that in 1988–1997 (−0.18 m w.e.). This implies that these glaciers are out of equilibrium under the current climate of the catchment, which has been characterized by high temperatures (Figure 7b) and low precipitation (Figure 7c) in the 1998–2017 period. As wastage of catchment glaciers accelerates (Figure 7d), they release much more water from long-term storage, thereby contributing to an increase in the total runoff of the catchment.
Precipitation decrease in the catchment (Figure 7c) leads to a slight decrease in the rainfall runoff from the glacier-free zone (Figure 6b), thereby contributing less than other components to the increase in the total runoff. A snowpack-depth reconstruction (previous October to current May) for Mount Gongga based on the subalpine fir ring-width and δ13C chronologies at the timberlines indicated that the period around 1990 showed extremely higher snow-pack depth in recent decades, and it slightly decreased in the following years [69]. As discussed above, the Hailuogou catchment experienced lower temperatures and higher precipitation prior to 1997 (Figure 7a,b), facilitating higher snowpack accumulation in late autumn, winter, and early spring in the high-altitude region of the catchment. However, a marked contrast has been found in the catchment since 1998 (Figure 7a,b). With catchment warming, snowfall could fall as rain, and the decrease in fresh snow would then affect the formation of the snowpack. Meanwhile, excess water is generated from snowpack melting as a result of temperature rise in the high-altitude region of the catchment (Figure 6b), thereby contributing to an increase in the total runoff. The contribution proportion of snowmelt changed from 3.1% before 1997 to 16.2% in 1998–2017, but its contribution has decreased with snowpack shrinkage in the past decade.
4.4. Model Uncertainty
4.4.1. Uncertainty from Thermal Resistance
Our model performance was validated using extensive glaciological and hydrological datasets surveyed in the Hailuogou catchment [30,36,40]. The good agreement between simulations and observations confirmed the capability to accurately reproduce key glaciological and hydrological processes in the catchment. Our model took into account the heterogeneous distribution of debris thickness and its associated impacts in detail, in which a parameter, the thermal resistance of the debris layer, was adopted. This parameter has been widely used on different debris-covered glaciers in the Tibetan Plateau and its surroundings [13,20,30,66,70], and can be used as a proxy of debris thickness at a large scale [13,30]. To estimate this parameter, we made some assumptions, which may have resulted in uncertainty in the thermal resistance, and then translated into the runoff uncertainty. However, an earlier work estimated the thermal resistance using the same method and datasets as our study and suggested that uncertainty in the thermal resistance of the debris layer, together with the albedo, could lead to a runoff uncertainty within approximately 8% [20], in which the runoff uncertainty caused by albedo is much larger than that due to the thermal resistance. This implies that the runoff uncertainty caused by the thermal resistance was less than 8% overall. Furthermore, a comparison of simulations and observations at ablation stakes in different periods on the Hailuogou Glacier indicated an RMSE value of 0.003 m w.e. d−1 relative to the mean melt rate of 0.03 m w.e. day−1 [36].
Note that the wetness of the debris layer may exert an influence on the sub-debris melt by affecting its thermal properties. An earlier study in the Bhutan Himalayas revealed that the debris surface becomes exponentially drier with increasing thermal resistance [70]. For this reason, we considered the wetness of the debris layer in the calculation of the latent heat flux following the approach of Fujita and Sakai [20]. Here the latent heat flux at the debris-covered surface (QL) was calculated as
where ρa is the density of air (kg m−3), C is the bulk coefficient for debris-covered surface (0.005), U is the wind speed (m s−1), q is the saturated specific humidity (kg kg−1), RH is the relative humidity, TS is the surface temperature (°C), and Ta is the air temperature (°C). τw is the wetness parameter for the debris surface, which was assumed to change with the thermal resistance (R) and was calculated as
To evaluate the influence of the wetness of the debris layer on glacier runoff, two extreme cases for the wetness of the debris-covered surface were assumed: no water (τw = 0) and water surface (τw = 1). We then recalculated glacier runoff with the two extreme assumed settings for the wetness of the debris layer, using the same model as the control run. A comparison between the control run and the calculations with two extreme cases indicated that uncertainty in glacier runoff caused by the wetness of the debris layer among these two extreme cases was less than 1.5% over the past three decades compared to the control run.
4.4.2. Uncertainty from Coexistence Surfaces
A coexisting surface is widely detected on debris-covered glaciers, which are mainly composed of debris-covered ice, bare ice, ice cliffs, and supraglacial ponds. Such coexistence surfaces generally act as melt hotspots in these glacier termini, and can make a disproportionately significant contribution to ice melting [17,71,72,73]. Previous studies have estimated on different glaciers that the total melt around ice cliffs and supraglacial ponds is many times higher than the sub-debris melt [71,72,74]. This may be responsible for the debris-cover anomaly on debris-covered tongues [73]. Due to a lack of detailed observations for coexistence surfaces on the debris-covered glaciers in the Hailuogou catchment, our module for the debris-cover effect could not fully incorporate these ice melting processes, which require further study in future research.
4.4.3. Uncertainty from the Estimation of Precipitation Types
With climate warming, the proportion of snowfall versus rainfall can decrease in a glacierized catchment; that is, snowfall could fall as rain. The decrease of fresh snow would then reduce the glacier surface albedo, enhancing ablation from the glacier, while the effect becomes opposite with decreasing rainfall [75]. The discrimination of precipitation types is therefore crucial to glaciological and hydrological processes. In this study, we discriminated rain and snow using a temperature threshold.
As discussed above, the Hailuogou catchment has experienced significant temperature rise since the 1990s (Figure 7b). With continued temperature rise, our method, which used a spatially uniform temperature threshold to discriminate precipitation types, may have led to uncertainty in glaciological and hydrological processes. To evaluate the uncertainty resulting from our method for portioning rain and snow, we used a binary logistic regression model developed by Jennings et al. [75]. They found that precipitation phase methods incorporating relative humidity perform better than air temperature-only methods. The model could predict the probability of snow occurring (p(snow)) as a function of the air temperature (Ta) and relative humidity (RH), which was expressed as
where α, β, and γ are model coefficients, which were −10.04, 1.41, and 0.09 [75], respectively. Here, we classed an event as snow when p(snow) was greater than or equal to 50% and as rain when it was less than 50%.
We recalculated glacier mass change and the total runoff using the same model as the control run, with the exception of the discrimination of precipitation types, which was calculated by using the binary logistic regression model shown in Equation (11). A comparison between the control run and the calculation using Equation (11) indicated that all runoff components in the catchment showed decreasing trends compared to the control run except rainfall runoff. In particular, glacier mass loss of the whole catchment decreased slightly by 6.0% compared to the control run. Overall, the total runoff of the catchment estimated using Equation (11) decreased by 1.3% compared to the control run.
5. Conclusions
We applied a physically based glacio-hydrological model to a highly glacierized catchment (45.3% glacierized) in the south-eastern Tibetan Plateau, where three debris-covered and four debris-free glaciers exist. Our model especially accounted for the spatial characteristics of debris cover and its impact on glaciological and hydrological processes by calculating energy–water–mass balance over different surfaces in the catchment. Our field-data rich modeling analysis provided insights into the importance of glacier processes for catchment runoff generation in the past three decades, especially the role of debris cover in the catchment hydrology.
Among runoff components, glacier runoff contributed about 45.1% of the total runoff over the past three decades, followed by baseflow, snowmelt, and rainfall. Especially in the past decade, the contribution of glacier runoff has exceeded 50% of the total runoff, while rainfall runoff has slightly decreased and the rest has remained relatively stable. The spatial distribution of the melt ratio calculated in the study revealed a critical value of the thermal resistance of the debris layer (3.1 × 10⁻² m2 K W−1) above which the melt rate is accelerated relative to that of bare ice and below which debris cover attenuates ice melting. Overall, the catchment was overall characterized by the acceleration effect of debris cover for the 1988–2017 period, although debris-cover effects were different on the three debris-covered glaciers. An experimental analysis, in which we assumed no debris covering the glaciers in the catchment, indicated that the total runoff increased by approximately 11.0% over the past three decades compared to that under the assumed no-debris surface, due to the significant excess meltwater generated from the debris-covered surface, especially the lower elevation region of less than 3600 m a.s.l.
Our results highlighted the importance of debris cover in the glaciological and hydrological processes in a glacierized catchment, although our calculations were influenced by the model limitations discussed above. Further investigations are therefore needed to improve our understanding of the processes related to debris cover and prediction of runoff production from debris-covered glaciers, which are a prominent characteristic in the Tibetan Plateau and its surroundings. Such information is essential to the sustainability of water supplies and climate adaptation in glacier-fed catchments and their downstream regions of the Tibetan Plateau and its surroundings.
Author Contributions
Conceptualization, Y.Z., and S.L.; methodology, Y.Z.; software, Y.Z. and Z.J.; validation, Y.Z., J.W. and X.W.; formal analysis, Y.Z.; resources, Y.Z. and Q.L.; data curation, Y.Z. and Q.L.; writing—original draft preparation, Y.Z.; writing—review and editing, Q.L., X.W. and S.L.; visualization, Y.Z.; supervision, Y.Z. and X.W.; project administration, Y.Z., X.W. and S.L.; funding acquisition, Y.Z., X.W., and S.L.
Funding
This research was funded by the NSFC (Grant No. 41671057, 41761144075, and 41771075), the CAS Major Project (Grant No. KZZD-EW-12-1), and the Research Funds for New Talents of Yunnan University (YJRC3201702).
Acknowledgments
We would like to thank the Gongga Alpine Ecosystem Observation and Research Station (GAEORS) of the Chinese Ecological Research Network for providing hydro-meteorological data.
Conflicts of Interest
The authors declare no conflict of interest.
References
- Kaser, G.; Großhauser, M.; Marzeion, B. Contribution potential of glaciers to water availability in different climate regimes. Proc. Natl. Acad. Sci. USA 2010, 107, 20223–20227. [Google Scholar] [CrossRef] [Green Version]
- Yao, T.; Thompson, L.; Yang, W.; Yu, W.; Gao, Y.; Guo, X.; Yang, X.; Duan, K.; Zhao, H.; Xu, B.; et al. Different glacier status with atmospheric circulations in Tibetan Plateau and surroundings. Nat. Clim. Chang. 2012, 2, 663–667. [Google Scholar] [CrossRef]
- Immerzeel, W.W.; Pellicciotti, F.; Bierkens, M.F.P. Rising river flows throughout the twenty-first century in two Himalayan glacierized watersheds. Nat. Geosci. 2013, 6, 742–745. [Google Scholar] [CrossRef]
- Bolch, T. Asian glaciers are a reliable water source. Nature 2017, 545, 161–162. [Google Scholar] [CrossRef] [PubMed] [Green Version]
- Fujita, K.; Nuimura, T. Spatially heterogeneous wastage of Himalayan glaciers. Proc. Natl. Acad. Sci. USA 2011, 108, 14011–14014. [Google Scholar] [CrossRef] [Green Version]
- Brun, F.; Berthier, E.; Wagnon, P.; Kääb, A.; Treichler, D. A spatially resolved estimate of High Mountain Asia glacier mass balances from 2000 to 2016. Nat. Geosci. 2017, 10, 668–673. [Google Scholar] [CrossRef]
- Zhang, Y.; Enomoto, H.; Ohata, T.; Kitabata, H.; Kadota, T.; Hirabayashi, Y. Glacier mass balance and its potential impacts in the Altai Mountains over the period 1990–2011. J. Hydrol. 2017, 553, 662–677. [Google Scholar] [CrossRef]
- Bolch, T.; Shea, J.M.; Liu, S.; Azam, F.M.; Gao, Y.; Gruber, S.; Immerzeel, W.W.; Kulkarni, A.; Li, H.; Tahir, A.A.; et al. Status and Change of the Cryosphere in the Extended Hindu Kush Himalaya Region. In The Hindu Kush Himalaya Assessment —Mountains, Climate Change, Sustainability and People; Wester, P., Mishra, A., Mukherji, A., Shrestha, A.B., Eds.; Springer International Publishing: Cham, Switzerland, 2019. [Google Scholar]
- Yao, T.; Xue, Y.; Chen, D.; Chen, F.; Thompson, L.; Cui, P.; Koike, T.; Lau, W.K.M.; Lettenmaier, D.; Mosbrugger, V.; et al. Recent Third Pole’s rapid warming accompanies cryospheric melt and water cycle intensification and interactions between monsoon and environment: Multi-disciplinary approach with observation, modeling and analysis. BAMS 2019, 3, 423–444. [Google Scholar] [CrossRef]
- Scherler, D.; Bookhagen, B.; Strecker, M.R. Spatially variable response of Himalayan glaciers to climate change affected by debris cover. Nat. Geosci. 2011, 4, 156–159. [Google Scholar] [CrossRef]
- Scherler, D.; Wulf, H.; Gorelick, N. Global Assessment of Supraglacial Debris-Cover Extents. Geophys. Res. Lett. 2018, 45, 11,798–11,805. [Google Scholar] [CrossRef] [Green Version]
- Bolch, T.; Kulkarni, A.; Kääb, A.; Huggel, C.; Paul, F.; Cogley, J.G.; Frey, H.; Kargel, J.S.; Fujita, K.; Scheel, M.; et al. The State and Fate of Himalayan Glaciers. Science 2012, 336, 310–314. [Google Scholar] [CrossRef] [PubMed] [Green Version]
- Zhang, Y.; Hirabayashi, Y.; Fujita, K.; Liu, S.; Liu, Q. Heterogeneity in supraglacial debris thickness and its role in glacier mass changes of Mount Gongga. Sci. China Earth Sci. 2016, 59, 170–184. [Google Scholar] [CrossRef]
- Mattson, L.E.; Gardner, J.S.; Young, G.J. Ablation on debris covered glaciers: An example from the Rakhiot Glacier, Punjab, Himalaya. IAHS Publ. 1993, 218, 289–296. [Google Scholar]
- Østrem, G. Ice melting under a thin layer of moraine and the existence of ice cores in moraine ridges. Geogr. Ann. 1959, 41, 228–230. [Google Scholar] [CrossRef]
- Mair, D.; Nienow, P.; Sharp, M.J.; Wohlleben, T.; Willis, I. Influence of subglacial drainage system evolution on glacial surface motion: Haut Glacier d’Arolla, Switzerland. J. Geophys. Res. 2002, 107, EPM 8-1–EPM 8-13. [Google Scholar] [CrossRef] [Green Version]
- Miles, E.S.; Willis, I.; Buri, P.; Steiner, J.F.; Arnold, N.S.; Pellicciotti, F. Surface Pond Energy Absorption Across Four Himalayan Glaciers Accounts for 1/8 of Total Catchment Ice Loss. Geophys. Res. Lett. 2018, 45, 10464–10473. [Google Scholar] [CrossRef] [Green Version]
- Benn, D.I.; Bolch, T.; Hands, K.; Gulley, J.; Luckman, A.; Nicholson, L.I.; Quincey, D.; Thompson, S.; Toumi, R.; Wiseman, S. Response of debris-covered glaciers in the Mount Everest region to recent warming, and implications for outburst flood hazards. Earth-Sci. Rev. 2012, 114, 156–174. [Google Scholar] [CrossRef] [Green Version]
- Benn, D.I.; Thompson, S.; Gulley, J.; Mertes, J.; Luckman, A.; Nicholson, L.I. Structure and evolution of the drainage system of a Himalayan debris-covered glacier, and its relationship with patterns of mass loss. Cryosphere 2017, 11, 2247–2264. [Google Scholar] [CrossRef] [Green Version]
- Fujita, K.; Sakai, A. Modelling runoff from a Himalayan debris-covered glacier. Hydrol. Earth Syst. Sci. 2014, 18, 2679–2694. [Google Scholar] [CrossRef] [Green Version]
- Kirkbride, M.P.; Deline, P. The formation of supraglacial debris covers by primary dispersal from transverse englacial debris bands. Earth Surf. Proc. Land. 2013, 38, 1779–1792. [Google Scholar] [CrossRef]
- Mölg, N.; Bolch, T.; Rastner, P.; Strozzi, T.; Paul, F. A consistent glacier inventory for the Karakoram and Pamir regions derived from Landsat data: Distribution of debris cover and mapping challenges. ESSD 2018, 10, 1807–1827. [Google Scholar]
- Bliss, A.; Hock, R.; Radić, V. Global response of glacier runoff to twenty-first century climate change. J. Geophys. Res. 2014, 119, 717–730. [Google Scholar] [CrossRef]
- Hagg, W.; Mayr, E.; Mannig, B.; Reyers, M.; Schubert, D.; Pinto, J.; Peter, J.; Pieczonka, T.; Bolch, T.; Paeth, H.; et al. Future Climate Change and Its Impact on Runoff Generation from the Debris-Covered Inylchek Glaciers, Central Tian Shan, Kyrgyzstan. Water 2018, 10, 1513. [Google Scholar] [CrossRef] [Green Version]
- Lutz, A.F.; Immerzeel, W.W.; Kraaijenbrink, P.D.; Shrestha, A.B.; Bierkens, M.F. Climate Change Impacts on the Upper Indus Hydrology: Sources, Shifts and Extremes. PLoS ONE 2016, 11, e0165630. [Google Scholar] [CrossRef] [PubMed] [Green Version]
- Luo, Y.; Wang, X.; Piao, S.; Sun, L.; Ciais, P.; Zhang, Y.; Ma, C.; Gan, R.; He, C. Contrasting streamflow regimes induced by melting glaciers across the Tien Shan-Pamir-North Karakoram. Sci. Rep. 2018, 8, 16470. [Google Scholar] [CrossRef] [PubMed]
- Pu, J. Glacier Inventory of China VIII (The Changjiang River Drainage Basin); Gansu Culture Press: Lanzhou, China, 1994; pp. 117–129. [Google Scholar]
- Nakawo, M.; Young, G.J. Field experiments to determine the effect of a debris layer on ablation of glacier ice. Ann. Glaciol. 1981, 2, 85–91. [Google Scholar] [CrossRef] [Green Version]
- Nakawo, M.; Young, G.J. Estimate of glacier ablation under a debris layer from surface temperature and meteorological variables. J. Glaciol. 1982, 28, 29–34. [Google Scholar] [CrossRef] [Green Version]
- Zhang, Y.; Fujita, K.; Liu, S.; Liu, Q.; Nuimura, T. Distribution of debris thickness and its effect on ice melt at Hailuogou Glacier, southeastern Tibetan Plateau, using in situ surveys and ASTER imagery. J. Glaciol. 2011, 57, 1147–1157. [Google Scholar] [CrossRef] [Green Version]
- Li, J.; Su, Z. Glaciers in the Hengduan Mountains; Science Press: Beijing, China, 1996. [Google Scholar]
- Su, Z.; Shi, Y. Response of monsoonal temperate glaciers to global warming since the Little Ice Age. Quatern. Int. 2002, 97–98, 123–131. [Google Scholar] [CrossRef]
- Cheng, G. Exploration of precipitation features on extra-high zone of Mt Gongga. Mt. Res. 1996, 14, 177–182. [Google Scholar]
- Liu, Q.; Liu, S.; Zhang, Y.; Wang, X.; Zhang, Y.; Guo, W.; Xu, J. Recent shrinkage and hydrological response of Hailuogou glacier, a monsoon temperate glacier on the east slope of Mount Gongga, China. J. Glaciol. 2010, 56, 215–224. [Google Scholar] [CrossRef] [Green Version]
- Zhang, Y.; Fujita, K.; Liu, S.; Liu, Q.; Wang, X. Multi-decadal ice-velocity and elevation changes of a monsoonal maritime glacier: Hailuogou glacier, China. J. Glaciol. 2010, 56, 65–74. [Google Scholar] [CrossRef] [Green Version]
- Zhang, Y.; Hirabayashi, Y.; Liu, S. Catchment-scale reconstruction of glacier mass balance using observations and global climate data: Case study of the Hailuogou catchment, south-eastern Tibetan Plateau. J. Hydrol. 2012, 444–445, 146–160. [Google Scholar] [CrossRef]
- Pan, B.; Zhang, G.; Wang, J.; Cao, B.; Wang, J.; Zhang, C.; Geng, H.; Ji, Y. Glacier changes from 1966–2009 in the Gongga Mountains, on the south-eastern margin of the Qinghai–Tibetan Plateau and their climatic forcing. Cryosphere 2012, 6, 1087–1101. [Google Scholar] [CrossRef] [Green Version]
- Zhang, G.; Pan, B.; Cao, B.; Wang, J.; Cui, H.; Cao, X. Elevation changes measured during 1966–2010 on the monsoonal temperate glaciers’ ablation region, Gongga Mountains, China. Quatern. Int. 2015, 371, 49–57. [Google Scholar] [CrossRef]
- Gardelle, J.; Berthier, E.; Arnaud, Y.; Kääb, A. Region-wide glacier mass balances over the Pamir-Karakoram-Himalaya during 1999–2011. Cryosphere 2013, 7, 1263–1286. [Google Scholar] [CrossRef] [Green Version]
- Zhang, Y.; Hirabayashi, Y.; Liu, Q.; Liu, S. Glacier runoff and its impact in a highly glacierized catchment in the southeastern Tibetan Plateau: Past and future trends. J. Glaciol. 2015, 61, 713–730. [Google Scholar] [CrossRef] [Green Version]
- Liu, S.; Xie, Z.; Su, Z.; Song, G.; Wang, N. Accumulation, ablation and ice formation of Hailuogou Glacier in the Gongga Mountain. In Glaciers and Environment in the Qinhai-Xizang (Tibet) Plateau (I)–The Gongga Mountain; Xie, Z., Kotlyakov, V.M.K., Eds.; Science Press: Beijing, China; New York, NY, USA, 2014; pp. 65–80. [Google Scholar]
- Su, Z.; Song, G.; Cao, Z. Maritime characteristics of Hailuogou Glacier in the Gongga Mountains. J. Glaciol. Geocryol. 1996, 18, 51–59. [Google Scholar]
- Zhang, Y.; Liu, S.; Wang, X. A dataset of spatial distribution of debris cover on Hailuogou Glacier of Mount Gongga in 2009. Sci. Data Bank 2018. [Google Scholar] [CrossRef]
- Cao, Z.; Cheng, G. Preliminary analyses of hydrological characteristics of Hailuogou Glacier on the eastern slope of the Gongga Mountain. In Glaciers and Environment in the Qinhai-Xizang (Tibet) Plateau (I)–The Gongga Mountain; Xie, Z., Kotlyakov, V.M., Eds.; Science Press: Beijing, China, 1994; pp. 143–156. [Google Scholar]
- Glover, J.; McCulloch, G. The empirical relation between solar radiation and hours of sunshine. Q. J. R. Meteorol. Soc. 1958, 84, 172–175. [Google Scholar] [CrossRef]
- Kondo, J. Meteorology of Water Environment; Asakura: Tokyo, Japan, 1994. [Google Scholar]
- Fujita, K. Effect of dust event timing on glacier runoff: Sensitivity analysis for a Tibetan glacier. Hydrol. Process. 2007, 21, 2892–2896. [Google Scholar] [CrossRef]
- Fujita, K.; Ageta, Y. Effect of summer accumulation on glacier mass balance on the Tibetan Plateau revealed by mass–balance model. J. Glaciol. 2000, 46, 244–252. [Google Scholar] [CrossRef] [Green Version]
- Baker, D.; Escher-Vetter, H.; Moser, H.; Oerter, H.; Reinwarth, O. A glacier discharge model based on results from field studies of energy balance, water storage and flow. IAHS Publ. 1982, 138, 103–112. [Google Scholar]
- Bahr, D.B. Global distributions of glacier properties: A stochastic scaling paradigm. Water Resour. Res. 1997, 33, 1669–1679. [Google Scholar] [CrossRef]
- Bahr, D.B.; Meier, M.F.; Peckham, S.D. The physical basis of glacier volume-area scaling. J. Geophys. Res. 1997, 102, 20355–20362. [Google Scholar] [CrossRef]
- Chen, J.; Ohmura, A. Estimation of Alpine glacier water resources and their change since the 1870s. IAHS Publ. 1990, 193, 127–135. [Google Scholar]
- Hirabayashi, Y.; Zhang, Y.; Watanabe, S.; Koirala, S.; Kanae, S. Projection of glacier mass changes under a high-emission climate scenario using the global glacier model HYOGA2. Hydrol. Res. Lett. 2013, 7, 6–11. [Google Scholar] [CrossRef]
- Radić, V.; Hock, R. Regional and global volumes of glaciers derived from statistical upscaling of glacier inventory data. J. Geophys. Res. 2010, 115, F01010. [Google Scholar] [CrossRef]
- SCS. Hydrology. In National Engineering Handbook; USDA, Ed.; SCS: Washington, DC, USA, 1972. [Google Scholar]
- Allen, R.G.; Pereira, L.S.; Raes, D.; Smith, M. Crop Evapotranspiration Guidelines for Computing Crop Water Requirements; (Irrigation and Drainage Paper No. 56); Food and Agriculture Organization of the United Nations: Rome, Italy, 1998. [Google Scholar]
- Luo, Y.; Arnold, J.; Allen, P.; Chen, X. Baseflow simulation using SWAT model in an inland river basin in Tianshan Mountains, Northwest China. Hydrol. Earth Syst. Sci. 2012, 16, 1259–1267. [Google Scholar] [CrossRef] [Green Version]
- Martinec, J. Snowmelt-runoff model for stream flow forecasts. Nordic Hydrol. 1975, 6, 145–154. [Google Scholar] [CrossRef]
- Nash, J.E.; Sutcliffe, J.V. River flow forecasting through conceptual models. Part 1. A discussion of principles. J. Hydrol. 1970, 10, 282–290. [Google Scholar] [CrossRef]
- Moriasi, D.N.; Arnold, J.; Liew, M.W.; Bingner, R.L.; Harmel, R.D.; Veith, T.L. Model evaluation guidelines for systematic quantification of accuracy in watershed simulations. Trans. Am. Soc. Agric. Biol. Eng. 2007, 50, 885–900. [Google Scholar]
- Nagai, H.; Fujita, K.; Nuimura, T.; Sakai, A. Southwest-facing slopes control the formation of debris-covered glaciers in the Bhutan Himalaya. Cryosphere 2013, 7, 1303–1314. [Google Scholar] [CrossRef] [Green Version]
- Nicholson, L.; Benn, D.I. Properties of natural supraglacial debris in relation to modelling sub-debris ice ablation. Earth Surf. Proc. Land. 2013, 38, 490–501. [Google Scholar] [CrossRef]
- Miles, K.E.; Hubbard, B.; Quincey, D.J.; Miles, E.S.; Irvine-Fynn, T.D.L.; Rowan, A.V. Surface and subsurface hydrology of debris-covered Khumbu Glacier, Nepal, revealed by dye tracing. Earth Planet. Sci. Lett. 2019, 513, 176–186. [Google Scholar] [CrossRef]
- Liu, S.; Yao, X.; Guo, W.; Xu, J.; Shangguan, D.; Wei, J.; Bao, W.; Wu, L. The contemporary glaciers in China based on the Second Chinese Glacier Inventory. Acta Geogr. Sin. 2015, 70, 3–16. [Google Scholar]
- Thakuri, S.; Salerno, F.; Smiraglia, C.; Bolch, T.; D’Agata, C.; Viviano, G.; Tartari, G. Tracing glacier changes since the 1960s on the south slope of Mt. Everest (central Southern Himalaya) using optical satellite imagery. Cryosphere 2014, 8, 1297–1315. [Google Scholar] [CrossRef] [Green Version]
- Nakawo, M.; Rana, B. Estimate of ablation rate of glacier ice under a supraglacial debris layer. Geogr. Ann. 1999, 81A, 695–701. [Google Scholar] [CrossRef]
- Zhang, Y.; Liu, S.; Ding, Y. Glacier meltwater and runoff modelling, Keqicar Baqi glacier, southwestern Tien Shan, China. J. Glaciol. 2007, 53, 91–98. [Google Scholar] [CrossRef] [Green Version]
- Cuffey, K.M.; Paterson, W.S.B. The Physics of Glaciers; Butterworth-Heinemann: Oxford, UK, 2010. [Google Scholar]
- Liu, X.; Zhao, L.; Chen, T.; Shao, X.; Liu, Q.; Hou, S.; Qin, D.; An, W. Combined tree-ring width and δ13C to reconstruct snowpack depth: A pilot study in the Gongga Mountain, west China. Theor. Appl. Climatol. 2011, 103, 133–144. [Google Scholar] [CrossRef]
- Suzuki, R.; Fujita, K.; Ageta, Y. Spatial distribution of the thermal properties on debris–covered glaciers in the Himalayas derived from ASTER data. Bull. Glaciol. Res. 2007, 24, 13–22. [Google Scholar]
- Sakai, A.; Nakawo, M.; Fujita, K. Distribution characteristics and energy balance of Ice cliffs on debris-covered glaciers, Nepal Himalaya. AAAR 2002, 34, 12–19. [Google Scholar]
- Sakai, A.; Takeuchi, N.; Fujita, K.; Nakawo, M. Role of supraglacial ponds in the ablation process of a debris-covered glacier in the Nepal Himalayas. IAHS Publ. 2000, 264, 119–130. [Google Scholar]
- Buri, P.; Pellicciotti, F. Aspect controls the survival of ice cliffs on debris-covered glaciers. Proc. Natl. Acad. Sci. USA 2018, 115, 4369–4374. [Google Scholar] [CrossRef] [PubMed] [Green Version]
- Buri, P.; Miles, E.S.; Steiner, J.F.; Immerzeel, W.W.; Wagnon, P.; Pellicciotti, F. A physically based 3-D model of ice cliff evolution over debris-covered glaciers. J. Geophys. Res. 2016, 121, 2471–2493. [Google Scholar] [CrossRef] [Green Version]
- Jennings, K.S.; Winchell, T.S.; Livneh, B.; Molotch, N.P. Spatial variation of the rain–snow temperature threshold across the Northern Hemisphere. Nat. Comm. 2018, 9, 1148. [Google Scholar] [CrossRef] [Green Version]
Figure 1.
Location of the Hailuogou catchment (HLG) in the south-eastern Tibetan Plateau with the spatial distribution of the thermal resistance of the debris layer on three debris-covered glaciers (a), and area–altitude distributions of the debris-covered and debris-free surfaces (b). Seven glaciers in the catchment are labeled Glacier No. 1 to No. 7, the largest of which is the Hailuogou Glacier (No. 3). GAEORS (green square): Gongga Alpine Ecosystem Observation and Research Station. The green circle in (a) marks the hydrological station for runoff observation.

Figure 2.
Overview of the methodological framework used in this study. DCE and EM model denote the debris-cover effect and the energy balance model, respectively.
Figure 2.
Overview of the methodological framework used in this study. DCE and EM model denote the debris-cover effect and the energy balance model, respectively.

Figure 3.
Scatter diagrams of observed versus modeled monthly runoff (QR) for the 1994–2007 period (a) and the melt rates beneath different debris thicknesses (b). Monthly runoff data were observed from the gauging station of the GAEORS located in the river outlet of the catchment, while melt rate data were observed over different periods on the Hailuogou Glacier, and were derived from previous studies [30,31,41,42].

Figure 4.
Debris thickness–altitude distribution on the Hailuogou Glacier of the catchment (a), and meltwater change with altitude (b), which is caused by the debris-cover effect in the catchment.
Figure 4.
Debris thickness–altitude distribution on the Hailuogou Glacier of the catchment (a), and meltwater change with altitude (b), which is caused by the debris-cover effect in the catchment.

Figure 5.
Spatial distribution of the melt ratio (MR) in the ablation zones of the three debris-covered glaciers in the catchment. HLG denotes the Hailuogou Glacier.
Figure 5.
Spatial distribution of the melt ratio (MR) in the ablation zones of the three debris-covered glaciers in the catchment. HLG denotes the Hailuogou Glacier.

Figure 6.
Seasonal variation in each of runoff components in the catchment over the past three decades (a), and changes in each of runoff components for the 1998–2017 period compared to those for the 1988–1997 period (b).
Figure 6.
Seasonal variation in each of runoff components in the catchment over the past three decades (a), and changes in each of runoff components for the 1998–2017 period compared to those for the 1988–1997 period (b).

Figure 7.
Variations in glacier runoff (QGR) (a), temperature (b), and precipitation (c) in the catchment observed at the GAEORS, and surface mass balance (SMB) of the catchment estimated using our model (d).
Figure 7.
Variations in glacier runoff (QGR) (a), temperature (b), and precipitation (c) in the catchment observed at the GAEORS, and surface mass balance (SMB) of the catchment estimated using our model (d).

Figure 8.
Relationship between the thermal resistance of the debris layer and the melt ratio of the three debris-covered glaciers in the catchment.
Figure 8.
Relationship between the thermal resistance of the debris layer and the melt ratio of the three debris-covered glaciers in the catchment.


Table 1.
Summary of seven glaciers in the Hailuogou catchment. Glacier area, length, and elevation are derived from the Chinese Glacier Inventory [27], the units of which are km2, km, and m a.s.l., respectively. DC area denotes the debris-covered area.
Table 1.
Summary of seven glaciers in the Hailuogou catchment. Glacier area, length, and elevation are derived from the Chinese Glacier Inventory [27], the units of which are km2, km, and m a.s.l., respectively. DC area denotes the debris-covered area.
| No. 1 | No. 2 | No. 3 | No. 4 | No. 5 | No. 6 | No. 7 | |
|---|---|---|---|---|---|---|---|
| Elevation | 3740–5400 | 3600–6368 | 2990–7556 | 5120–5840 | 5080–6000 | 4720–6136 | 5280–5800 |
| Area | 1.47 | 7.67 | 25.7 | 0.33 | 0.37 | 0.66 | 0.26 |
| DC area | 0.58 | 0.56 | 1.65 | – | – | – | – |
| Length | 4.3 | 5.6 | 13.1 | 0.9 | 1.1 | 2.0 | 0.8 |
Table 2.
Calibration and validation results of the model used in the Hailuogou catchment. Data are derived from Zhang et al. [40]. NSE and PBIAS are the Nash–Sutcliffe efficiency and the percent bias, respectively.
Table 2.
Calibration and validation results of the model used in the Hailuogou catchment. Data are derived from Zhang et al. [40]. NSE and PBIAS are the Nash–Sutcliffe efficiency and the percent bias, respectively.
| Time Period | NSE | PBIAS (%) |
|---|---|---|
| Calibration (1994–2000) | 0.86 | 5.0 |
| Validation (2001–2007) | 0.83 | −7.0 |
| Entire period (1994–2007) | 0.85 | −4.5 |
© 2019 by the authors. Licensee MDPI, Basel, Switzerland. This article is an open access article distributed under the terms and conditions of the Creative Commons Attribution (CC BY) license (http://creativecommons.org/licenses/by/4.0/).
Share and Cite
MDPI and ACS Style
Zhang, Y.; Liu, S.; Liu, Q.; Wang, X.; Jiang, Z.; Wei, J. The Role of Debris Cover in Catchment Runoff: A Case Study of the Hailuogou Catchment, South-Eastern Tibetan Plateau. Water 2019, 11, 2601. https://doi.org/10.3390/w11122601
AMA Style
Zhang Y, Liu S, Liu Q, Wang X, Jiang Z, Wei J. The Role of Debris Cover in Catchment Runoff: A Case Study of the Hailuogou Catchment, South-Eastern Tibetan Plateau. Water. 2019; 11(12):2601. https://doi.org/10.3390/w11122601
Chicago/Turabian StyleZhang, Yong, Shiyin Liu, Qiao Liu, Xin Wang, Zongli Jiang, and Junfeng Wei. 2019. "The Role of Debris Cover in Catchment Runoff: A Case Study of the Hailuogou Catchment, South-Eastern Tibetan Plateau" Water 11, no. 12: 2601. https://doi.org/10.3390/w11122601
Note that from the first issue of 2016, this journal uses article numbers instead of page numbers. See further details here.