Spatial Variation Pattern Analysis of Hydrologic Processes and Water Quality in Three Gorges Reservoir Area
by
 , and
, and
Xiaomin Chen
1, 
Gaohong Xu
2,
Wanshun Zhang
1,3,4,*,
Hong Peng
3,
Han Xia
1,
Xiao Zhang
1,
Qian Ke
5 and
Jing Wan
1 1
School of Resource and Environmental Sciences, Wuhan University, Wuhan 430079, China
2
Bureau of Hydrology, Changjiang Water Resources Commission, Wuhan 430010, China
3
School of Water Resources and Hydropower Engineering, State Key Laboratory of Water Resources and Hydropower Engineering Science, Wuhan University, Wuhan 430072, China
4
China Institute of Development Strategy and Planning, Wuhan University, Wuhan 430072, China
5
Section of Hydraulic Structure and Flood Risk, Department of Hydraulic Engineering, Faculty of Civil Engineering and Geoscience, Delft University of Technology, Delft 2628 CN, The Netherlands
*
Author to whom correspondence should be addressed.
Water 2019, 11(12), 2608; https://doi.org/10.3390/w11122608
Submission received: 16 October 2019
/
Revised: 3 December 2019
/
Accepted: 7 December 2019
/
Published: 11 December 2019
(This article belongs to the Section Hydrology)
Abstract
:The Three Gorges Project (TGP) has greatly enhanced the heterogeneity of the underlying surface in the Three Gorges Reservoir Area (TGRA), thereby affecting the hydrologic processes and water quality. However, the influence of the differences of underlying surfaces on the hydrologic processes and water quality in the TGRA has not been studied thoroughly. In this research, the influence of the heterogeneity of landscape pattern and geographical characteristics on the spatial distribution difference of hydrologic processes and water quality in the different tributary basins of the TGRA was identified. The TGRA was divided into 23 tributary basins with 1840 sub-basins. The spatial differentiation of the hydrologic processes and water quality of the 23 tributary basins was examined by the Soil and Water Assessment Tool (SWAT). The observed data between 1 January 2010 and 31 December 2013 were used to calibrate and validate the model, after which the SWAT model was applied to further predict the runoff and water quality in the TGRA. There are 25 main model parameters, including CN2, CH_K2 and SOL_AWC, which were calibrated and validated with SWAT-Calibration and Uncertainty Procedures (SWAT-CUP). The landscape patterns and geomorphologic characteristics in 23 tributary basins were investigated and spatially visualized to correlate with surface runoff and nutrient losses. Due to geographical difference, the average total runoff depth (2010–2013) in the left bank area (538.6 mm) was 1.4 times higher than that in the right bank area (384.5 mm), total nitrogen (TN) loads in the left bank area (6.23 kg/ha) were 1.9 times higher than in the right bank area (3.27 kg/ha), and total phosphorus (TP) loads in the left bank area (1.27 kg/ha) were 2.2 times higher than in the right bank area (0.58 kg/ha). The total runoff depth decreased from the head region (553.3 mm) to the tail region (383.2 mm), while the loads of TN and TP were the highest in the middle region (5.51 kg/ha for TN, 1.15 kg/ha for TP), followed by the tail region (5.15 kg/ha for TN, 1.12 kg/ha for TP) and head region (3.92 kg/ha for TN, 0.56 kg/ha for TP). Owing to the different spatial distributions of land use, soil and geographical features in the TGRA, correlations between elevation, slope gradient, slope length and total runoff depth, TN and TP, were not clear and no consistency was observed in each tributary basin. Therefore, the management and control schemes of the water security of the TGRA should be adapted to local conditions.
1. Introduction
As one of the greatest hydro-junction engineerings in the world, the Three Gorges Project (TGP) plays a crucial role in the development and governs the hydrological regime in the Yangtze River basin, and has produced remarkable economic and social benefits [1,2]. However, after the operation of the TGP since 2012, the natural regime, in terms of the hydrology and water environment characteristics in the Three Gorges Reservoir Area (TGRA), has been vastly changed, resulting in a series of water environmental problems which could have arisen due to the following reasons: (1) After its 175 m experimental impoundment, the water flow rate is reduced (the residence time is prolonged), the turbulent diffusion capacity is diminished and the self-purification capacity is reduced [1,3]. (2) Due to the high-density urban agglomeration along the TGRA, unreasonable livestock and poultry breeding and agricultural production activities result in a large amount of non-point source (NPS) pollution that has not been effectively disposed of [4]. Overall, water quality in the tributaries (in the TGRA) has showed a downward trend. The degree of eutrophication of tributaries has intensified, changing from the mesotrophic to eutrophic. The frequency, scope and duration of algal blooms in several tributaries are increasing year by year [5]. As a typical channel reservoir, the water system, with numerous tributaries, is complex; the influence of local inflow of the hydrologic processes and water quality on the main stream is not negligible [6,7,8]. Therefore, it is necessary to gain insights into the refined spatial differentiation of local inflow hydrologic processes and water quality to guarantee the water security of the TGRA.
There are many studies on the hydrologic processes and water quality of the TGRA by the modelling approach, but most of them focus either on the local typical tributaries or their surrounding regions [2,9,10,11,12]. Due to the huge spatial heterogeneity of TGRA, these findings cannot represent the spatial differences of land surface processes. The difficulties in obtaining sufficient meteorological data and point source pollution information, and the collection of hydrology and water quality data, has hindered research on large scale watersheds, for instance, TGRA [13]. There are still a few studies on the simulation of the entire TGRA. Based on the Easy Distributed Hydrological Model, the formation and migration mechanism and features of NPS pollution in the TGRA were clarified during 2007–2008 by Ding et al. (2012) [14]. In order to remedy the difficulty of model verification due to an insufficient amount of measured data, the small-scale watershed extended method was proposed and applied to the entire TGRA by Shen et al. (2014), based on a SWAT model [15]. Subsequently, based on results obtained from SWAT, vertical variations of pollution loading of TGRA were also explored [16]. Nevertheless, these researches mainly focused on the NPS pollution and their loads, while few studies examined factors showing the manifestation of spatial heterogeneity of hydrologic processes and water quality, by considering the heterogeneity of large-scale watershed in river networks in the entire TGRA.
Extensive studies suggest that land use, soil, and topography are the key factors affecting runoff and generation of nitrogen and phosphorus [17,18,19,20], but these processes are characterized by a high spatial–temporal variability and are influenced by many variables, especially in large-scale watersheds [21]. Land cover alleviates soil erosion by reducing the impact of rain-drops on the soil surface [22]. Moreover, land cover will change the soil structure to some extent, and then soil texture and structure will affect surface runoff generation, as well as its infiltration, lateral flow and nutrient losses [18]. Meanwhile, topographic terrain (including elevation, slope gradient, and slope length) are also important influential factors [20,23]. However, factors in different studies showed different correlations with runoff and nutrient loss processes. For instance, the impact of slope gradient on the runoff generation and soil erosion is not always linearly positive [24]. Therefore, in regions with a large spatial heterogeneity, the correlation between runoff and nutrients and environmental factors cannot be generalized, and thus needs to be studied in detail.
The Soil and Water Assessment Tool (SWAT) has been considered a useful and effective model to simulate the hydrologic processes and water quality in large watersheds with complex underlying surfaces during a relatively long period [25,26,27]. The ability of SWAT to simulate a drainage system is determined by how well the watershed process and watershed systems are described by the model input parameters [28]. Our previous research indicated that localized database and rational parameterizations of specific basins are required to improve the application of SWAT [2], and the finer the subdivision scheme and hydrologic response unit (HRU) definition, the better the model performance [29]. Obtaining more detailed precipitation data, based on the precipitation interpolation method, will improve the hydrological simulation performance of SWAT [30]. However, adapting SWAT in a large-scale region faced a trade-off involving the time used for the simulation and the description accuracy of natural characteristics [31,32,33]. Thus, a method of dividing large regions into parts, which are then simulated separately, was proposed. In this way, the main stream of Yangtze River was subtracted, to separate the left and right banksides of the TGRA, and the sub-basin division and parameter calibration and verification of each part were carried out independently by constructing 23 models simultaneously, so as to accurately describe the spatial heterogeneity of land surfaces in the TGRA.
The objective of the present study was to support water environment security management of the TGRA by ascertaining the spatial variation of hydrologic processes and water quality and to explore the key geographical factors that can affect the hydrologic processes and water quality in each tributary. The consequent tasks are: (1) apply the SWAT model to the entire TGRA, based on the refined hydrologic processes and water quality; (2) demonstrate the landscape patterns and geomorphologic characteristics of different tributaries, and their spatial variation on the hydrologic processes and water quality of the TGRA; and (3) identify the driving factors that affect the spatial differentiation of total runoff and water quality.
2. Materials and Methods
2.1. Study Area
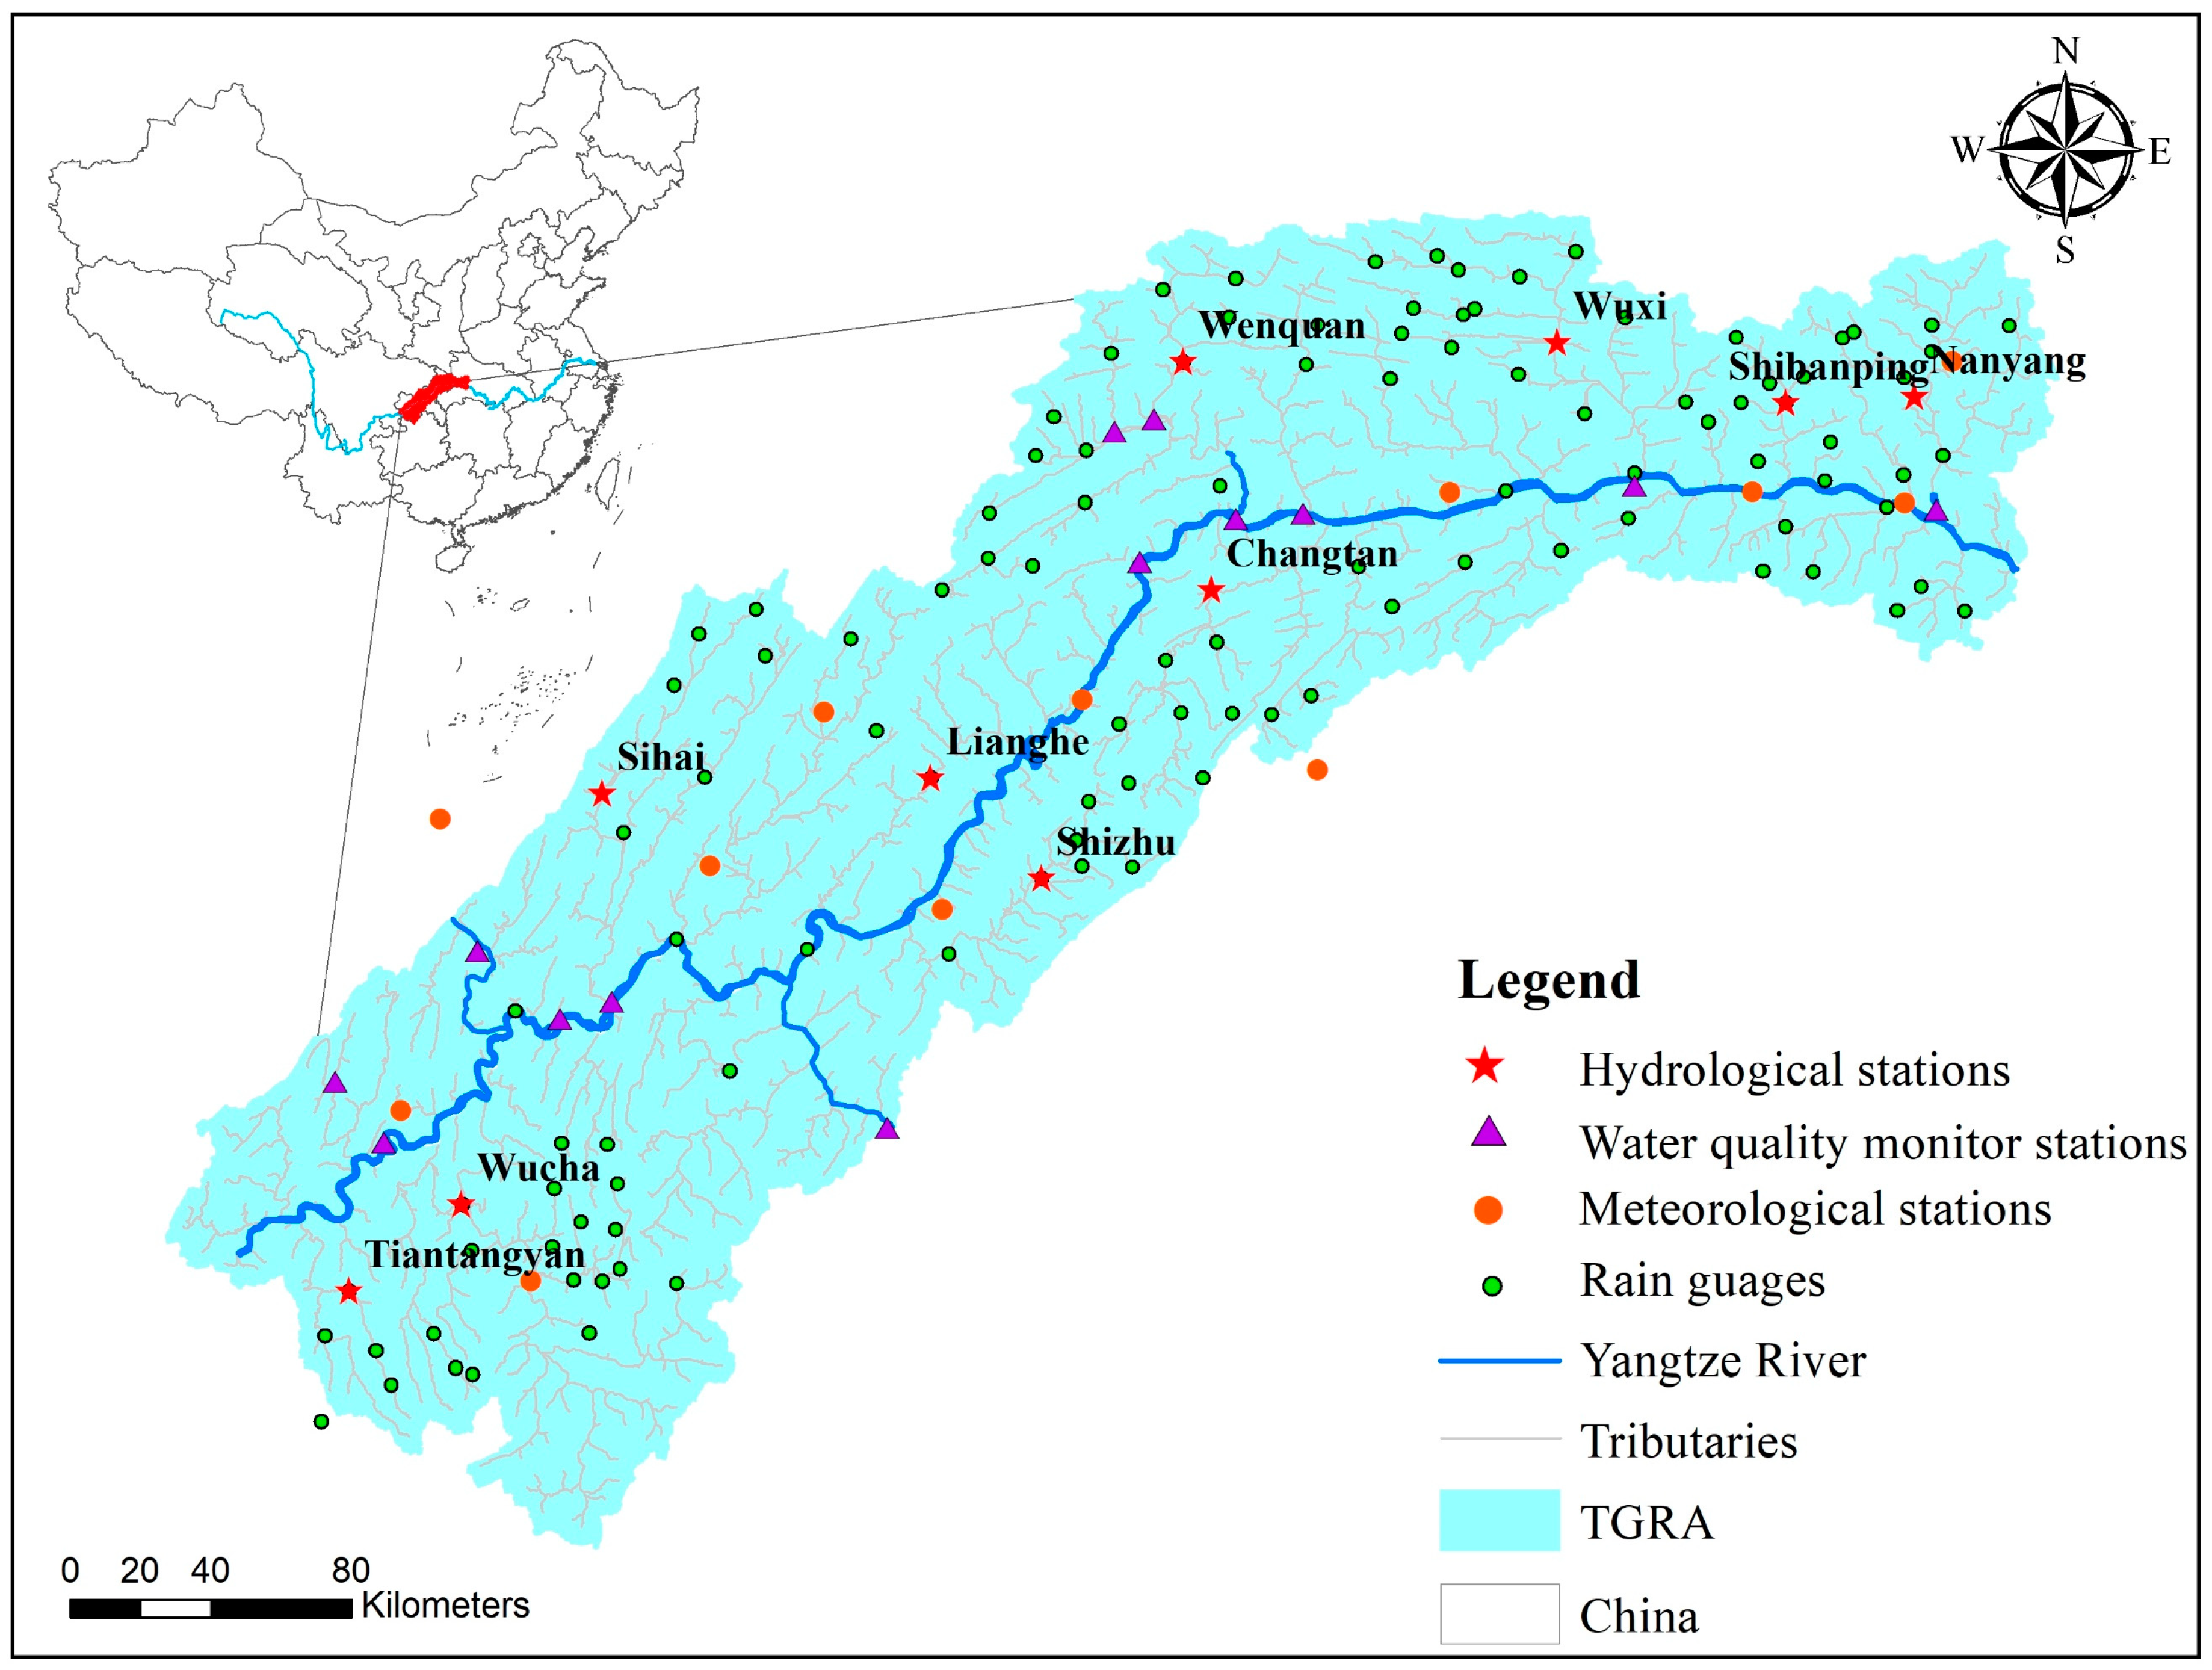
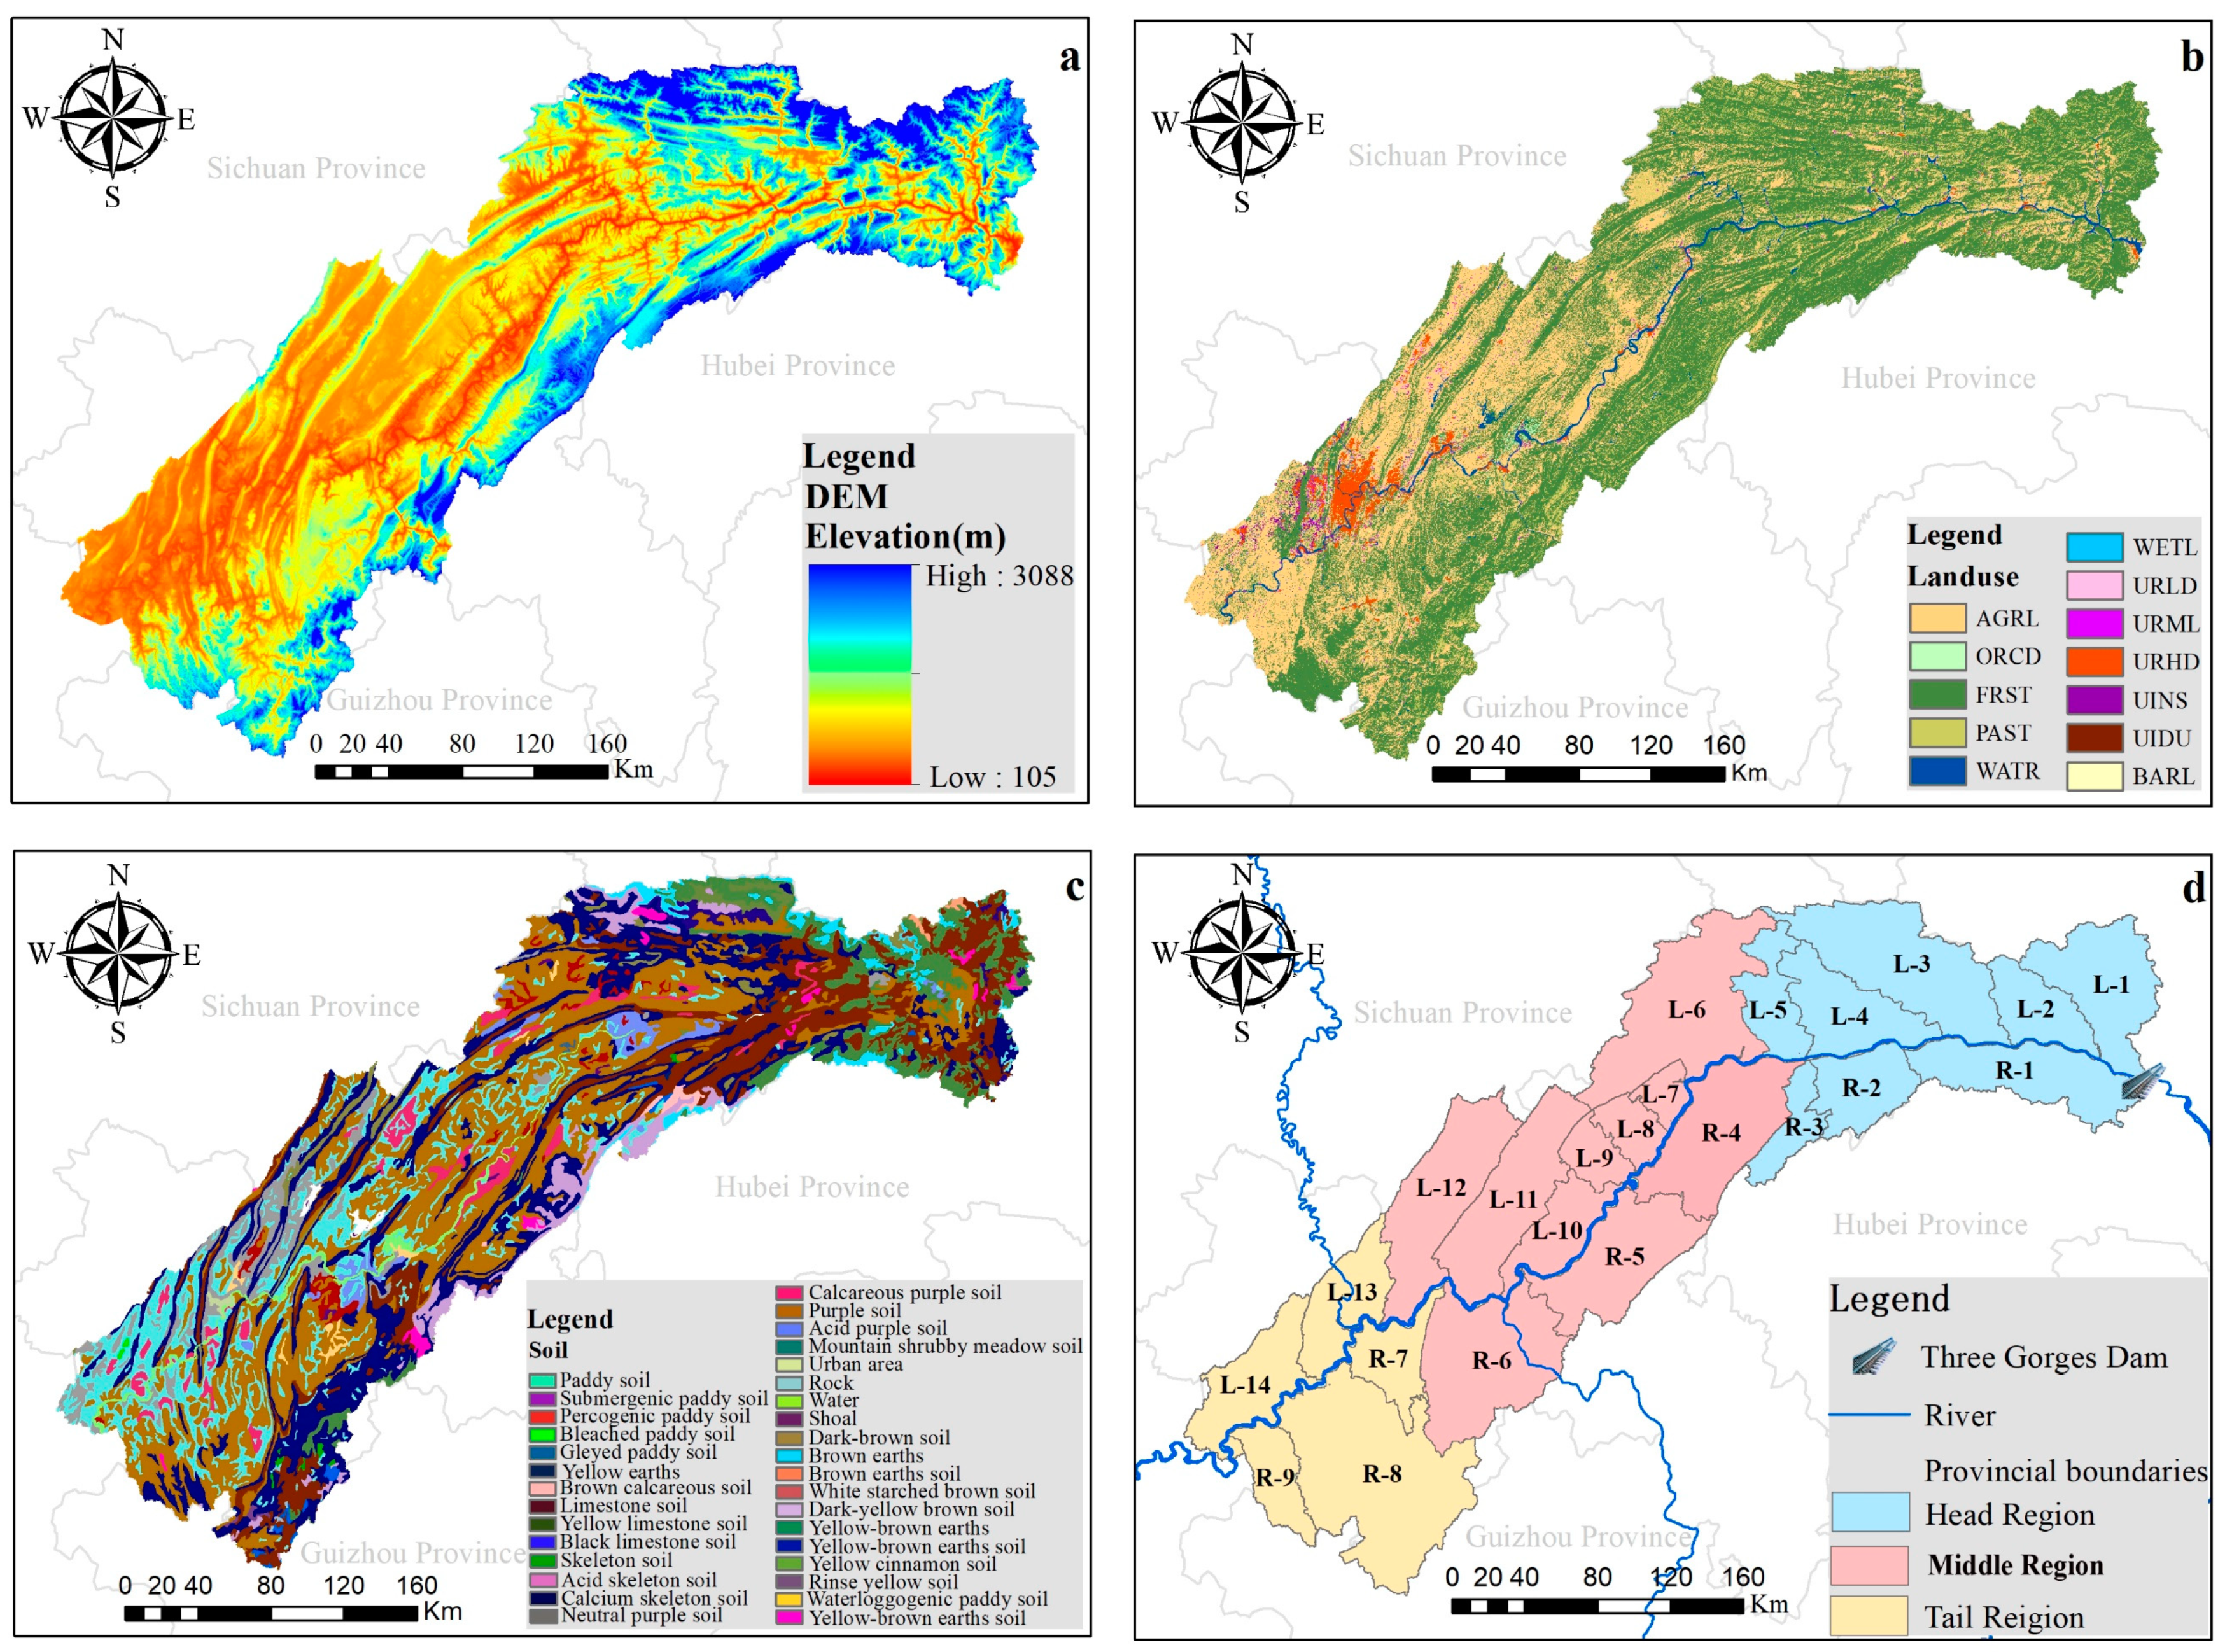
The TGRA (28°28′–31°44′ N,105°49′–111°39′ E), situated in the middle of the Yangtze River, covers a total area of 64,000 square kilometers and has a total length of about 660 km from east to west (see Figure 1). The river system of the TGRA is well-developed and complicated, and it stretches from east to west in a long strip shape. The climate in the TGRA is characterized by a subtropical monsoon. The altitude of TGRA varies from 73 m to 3105 m above mean sea level (Figure 2a). Cropland and forest are the two-principle land-use types (Figure 2b), and agriculture is the main economic activity in this area. The percentage of agricultural land is 28%, 76% of which is on sloped land (slope > 10°). The soil of the TGRA consists of purple soil, limestone and yellow earths et al. (Figure 2c), most of which are highly permeable and susceptible to weathering erosion.
2.2. Data Collection
The format and sources of all the model input data are presented in Table 1. The geospatial data include Digital Elevation Model (DEM) data, land–use type and soil type data. The DEM data with a resolution of 30 × 30 m was utilized to extract the geomorphologic parameters required for hydrologic simulation (Figure 2a). A land use/cover map (Figure 2b) from 2013 with a resolution of 1:250,000 was categorized into 13 types: agriculture land (AGRL), orchard (ORCD), forest (FRST), pasture (PAST), water (WATR), wetland (WETL), low, medium and high density residential area (URLD, URMD and URHD, respectively), institutional land (UINS), industrial land (UIDU), commercial land (UCOM), and bare land (BARL). The soil types map was interpreted from Chinese national soil map with a resolution of 1:1,000,000. The soil types were categorized into 36 categories including paddy soil, yellow earths, brown earths, and acid purple soil (see Figure 2c). The construction of the soil property database of the SWAT model requires soil chemical and physical property information, which were updated in our previous published work [2]. The map resolution of DEM, land use and soil type were considered reasonable, compared to similar researches [2,34].
There are 22 meteorological stations and 113 rain gauges located (see Figure 1) in or close to the TGRA, which were acquired from the National Meteorological Information Center and Hydrologic Statistical Yearbooks. Since the rain gauges only have rainfall data, other meteorological factors, including solar radiation, air temperature (maximum and minimum), relative humidity, and wind speed were interpolated from 22 meteorological stations to the 113 rain gauges by the Inverse Distance Weighted method introduced in our previous work [30]. The meteorological data were collected from 2009 to 2013. The industrial point sources of TGRA mainly include municipal sewage outlets, industrial pollution sources and large sewage treatment plants, and the emission data of 3710 industrial point sources were provided by the Chongqing Academy of Environmental Science. Observed data regarding daily steam flow from 2010 to 2013, at 10 hydrologic stations (see Figure 1); daily sediment data from 2010 to 2013, at four hydrologic stations (Nanyang, Wuxi, Wenquan and Wucha at Figure 1); and monthly water quality monitoring data from 2010 to 2013, at eight water quality monitoring stations (Figure 1), were collected from the Bureau of Hydrology, Changjiang Water Resources Commission. Sewage from scattered livestock, poultry farming and rural areas were estimated for calculations, based on the social and economic data collected from field investigations and statistics yearbooks. The transformation coefficients provided by China’s First Census of Pollution Sources in 2010 were used for calculations [35]. Agricultural management practices in the study area were obtained from the local statistics bureau and experimental field surveys. The grain crop varieties in the TGRA are mainly rice, maize and wheat. The planting model in this study adopts rice and maize rotations.
2.3. Model Description
SWAT model is capable of predicting runoff and water quality in basins at different scales due to different land use, soil types, and agricultural management practices [26]. The simulation of the hydrologic cycle is based on the water balance and contains two principals: the land phase at the HRU scale and the channel phase at the sub-basin scale. The land phase determines the loading of water, sediment and nutrients into the main channels of each sub-basin, while the channel phase determines the transportation of water, sediment etc., through the river networks to the outlets of the watershed. There are eight major components of SWAT, including climate, hydrology, erosion, nutrients/pesticides, land cover/plant, land management, main channel processes, and water bodies [27]. The details of all the components can be found in previous studies [26]. The calculation of the surface runoff was done with the improved soil conservation service (SCS) curve number technique [36], whereas the Modified Universal Soil Loss Equation (MUSLE) was employed to predict the sediment [37].
During the model parameterization, the whole study area is partitioned into sub-basins, on the basis of the elevation information from the DEM. Then, the sub-basins are further divided into homogeneous spatial units, which are distinct land use/soil/slope combinations named Hydrologic Response Units (HRUs). Considering the huge spatial heterogeneity of the underlying surface of the TGRA, sub-basin division needs to be fine enough to capture the characteristics of drainage and obtain accurate simulation results. After DEM setup, a mask of Yangtze River’s main stream was prepared and applied on the source DEM, and, thus, streams and outlets were created along the Yangtze River banks. Based on the main tributaries’ locations on the Yangtze River, the main outlet and nearby outlets of the tributary were selected to generate the specific tributary basins. The division scheme is shown in Figure 2d. The left bank was divided into 14 tributary basins, coded by L, and the right bank was divided into nine tributary basins, coded by R. The 1st to the 5th tributary basins of the left bank, and the 1st to the 3rd tributary basins of the right bank, belong to the head region of the TGRA; the 6th to the 12th tributary basins of the left bank, and the 4th to the 6th tributary basins of the right bank belong to the middle region of the TGRA; the 13th and 14th tributary basins of the left bank and the 7th to the 9th tributary basins of the right bank belong to the tail region of the TGRA. In this study, we specify the minimum sub-basin area of 2000 ha during the watershed delineation procedure to delineate the whole TGRA to 1740 sub-basins, which proved to be suitable for the TGRA in our previous study [38]. During the HRU analysis procedure, the combinations of land use/soil/slope class and distributions for each respective sub-basin were determined. Three slope classes were defined in the TGRA, namely, >40°, <20° and 20°–40°. Select multiple HRUs per sub-basin, and thresholds of land use, soil, and slope were specified to be 10%. In total, there were 8137 HRUs generated in the TGRA.
2.4. Evaluation Criteria for Model Performance
The model parameters were calibrated and validated by the SWAT-Calibration and Uncertainty Procedures (SWAT-CUP) [37,39]. Considering the uncertainties of the input data, model structure and parameters, the sensitivity analysis, and the calibration and validation of runoff, total nitrogen (TN) and total phosphorus (TP) were carried out by the GLUE method. Model uncertainty analysis based on GLUE method can reflect all kinds of uncertainty on the model performance, by considering the covariance of the parameter values [40]. More details regarding model evaluation are presented by Shi et al. (2017) [2]. The Nash–Sutcliffe coefficient of efficiency (ENS) [38] and coefficient of determination (R2) were chosen to calculate the goodness-of-fit between the simulated values and observations (runoff, sediment and water quality), which are shown as follows:
where is the observed data; is the model simulated data; is the average value of the observed data; and is the mean of the simulated data.
ENS, ranging from minus infinity to 1, indicates the matching degree of the simulated values and observed data along the 1:1 line. Generally, values fall in between 0 and 1 are considered to be tolerable, whereas values less than 0 denote an unacceptable model performance [41]. R2, ranging from 0 to 1, represents the collinearity strength between the model’s simulated values and observed data. Typically, a higher value of R2 indicates a better simulation result.
The observed data of daily total runoff at 10 stations from 2010 to 2011 were applied to calibrate the runoff simulation performance of the model, and the data from 2012 to 2013 were used for the validation. Daily observed sediment load data at four stations from 2010 to 2011 were applied to calibrate the sediment simulation performance of the model, and the data from 2012 to 2013 were employed for validation. Monthly observed water quality data at eight stations from 2010 to 2011 were applied to calibrate the water quality simulation performance of the model, and the data from 2012 to 2013 were employed for the validation. One year (2009) was set as the model warm-up period.
2.5. Data Analysis
Following calibration and validation, a 4-year (2010–2013) simulation was carried out to analyze the impacts of land-use, soil and elevation variation on the hydrologic processes and water quality of 23 tributaries in the TGRA. In order to reveal the geographic spatial heterogeneity, landscape pattern and geomorphologic characteristics in the TGRA including land use, soil, elevation, slope gradient, and slope length, were analyzed. There are 36 soil subtypes in the TGRA, which can be classified into 10 categories, namely paddy soil, limestone soil, skeleton soil, purple soil, mountain meadow soil, dark brown forest soil, brown soil, yellow brown soil, yellow soil, and yellow cinnamon soil. Based on the spatial analysis tool of ArcGIS 10.0, the area proportion of different land-use types and soil types, and the average elevation in each sub-basin of each tributary basin were calculated. The total runoff depth (Q) and nutrient yield per unit area in each sub-basin of each tributary basin was calculated in SWAT model. All these data were subjected to Pearson correlation analysis (two-tailed test) using IBM SPSS 21.0 software. In the correlation analysis of this study, the independent variables are proportions of various land use types; proportions of various soil types; and geographical factors such as elevation, the slope gradient and slope length of sub-basins; and the dependent variables are the total runoff depth, TN and TP loads of each sub-basin. Positive correlation is described as the dependent variable increases when the independent variable increases, and negative correlation is defined as the dependent variable decreases when the independent variable increases.
3. Results
3.1. Model Calibration and Validation
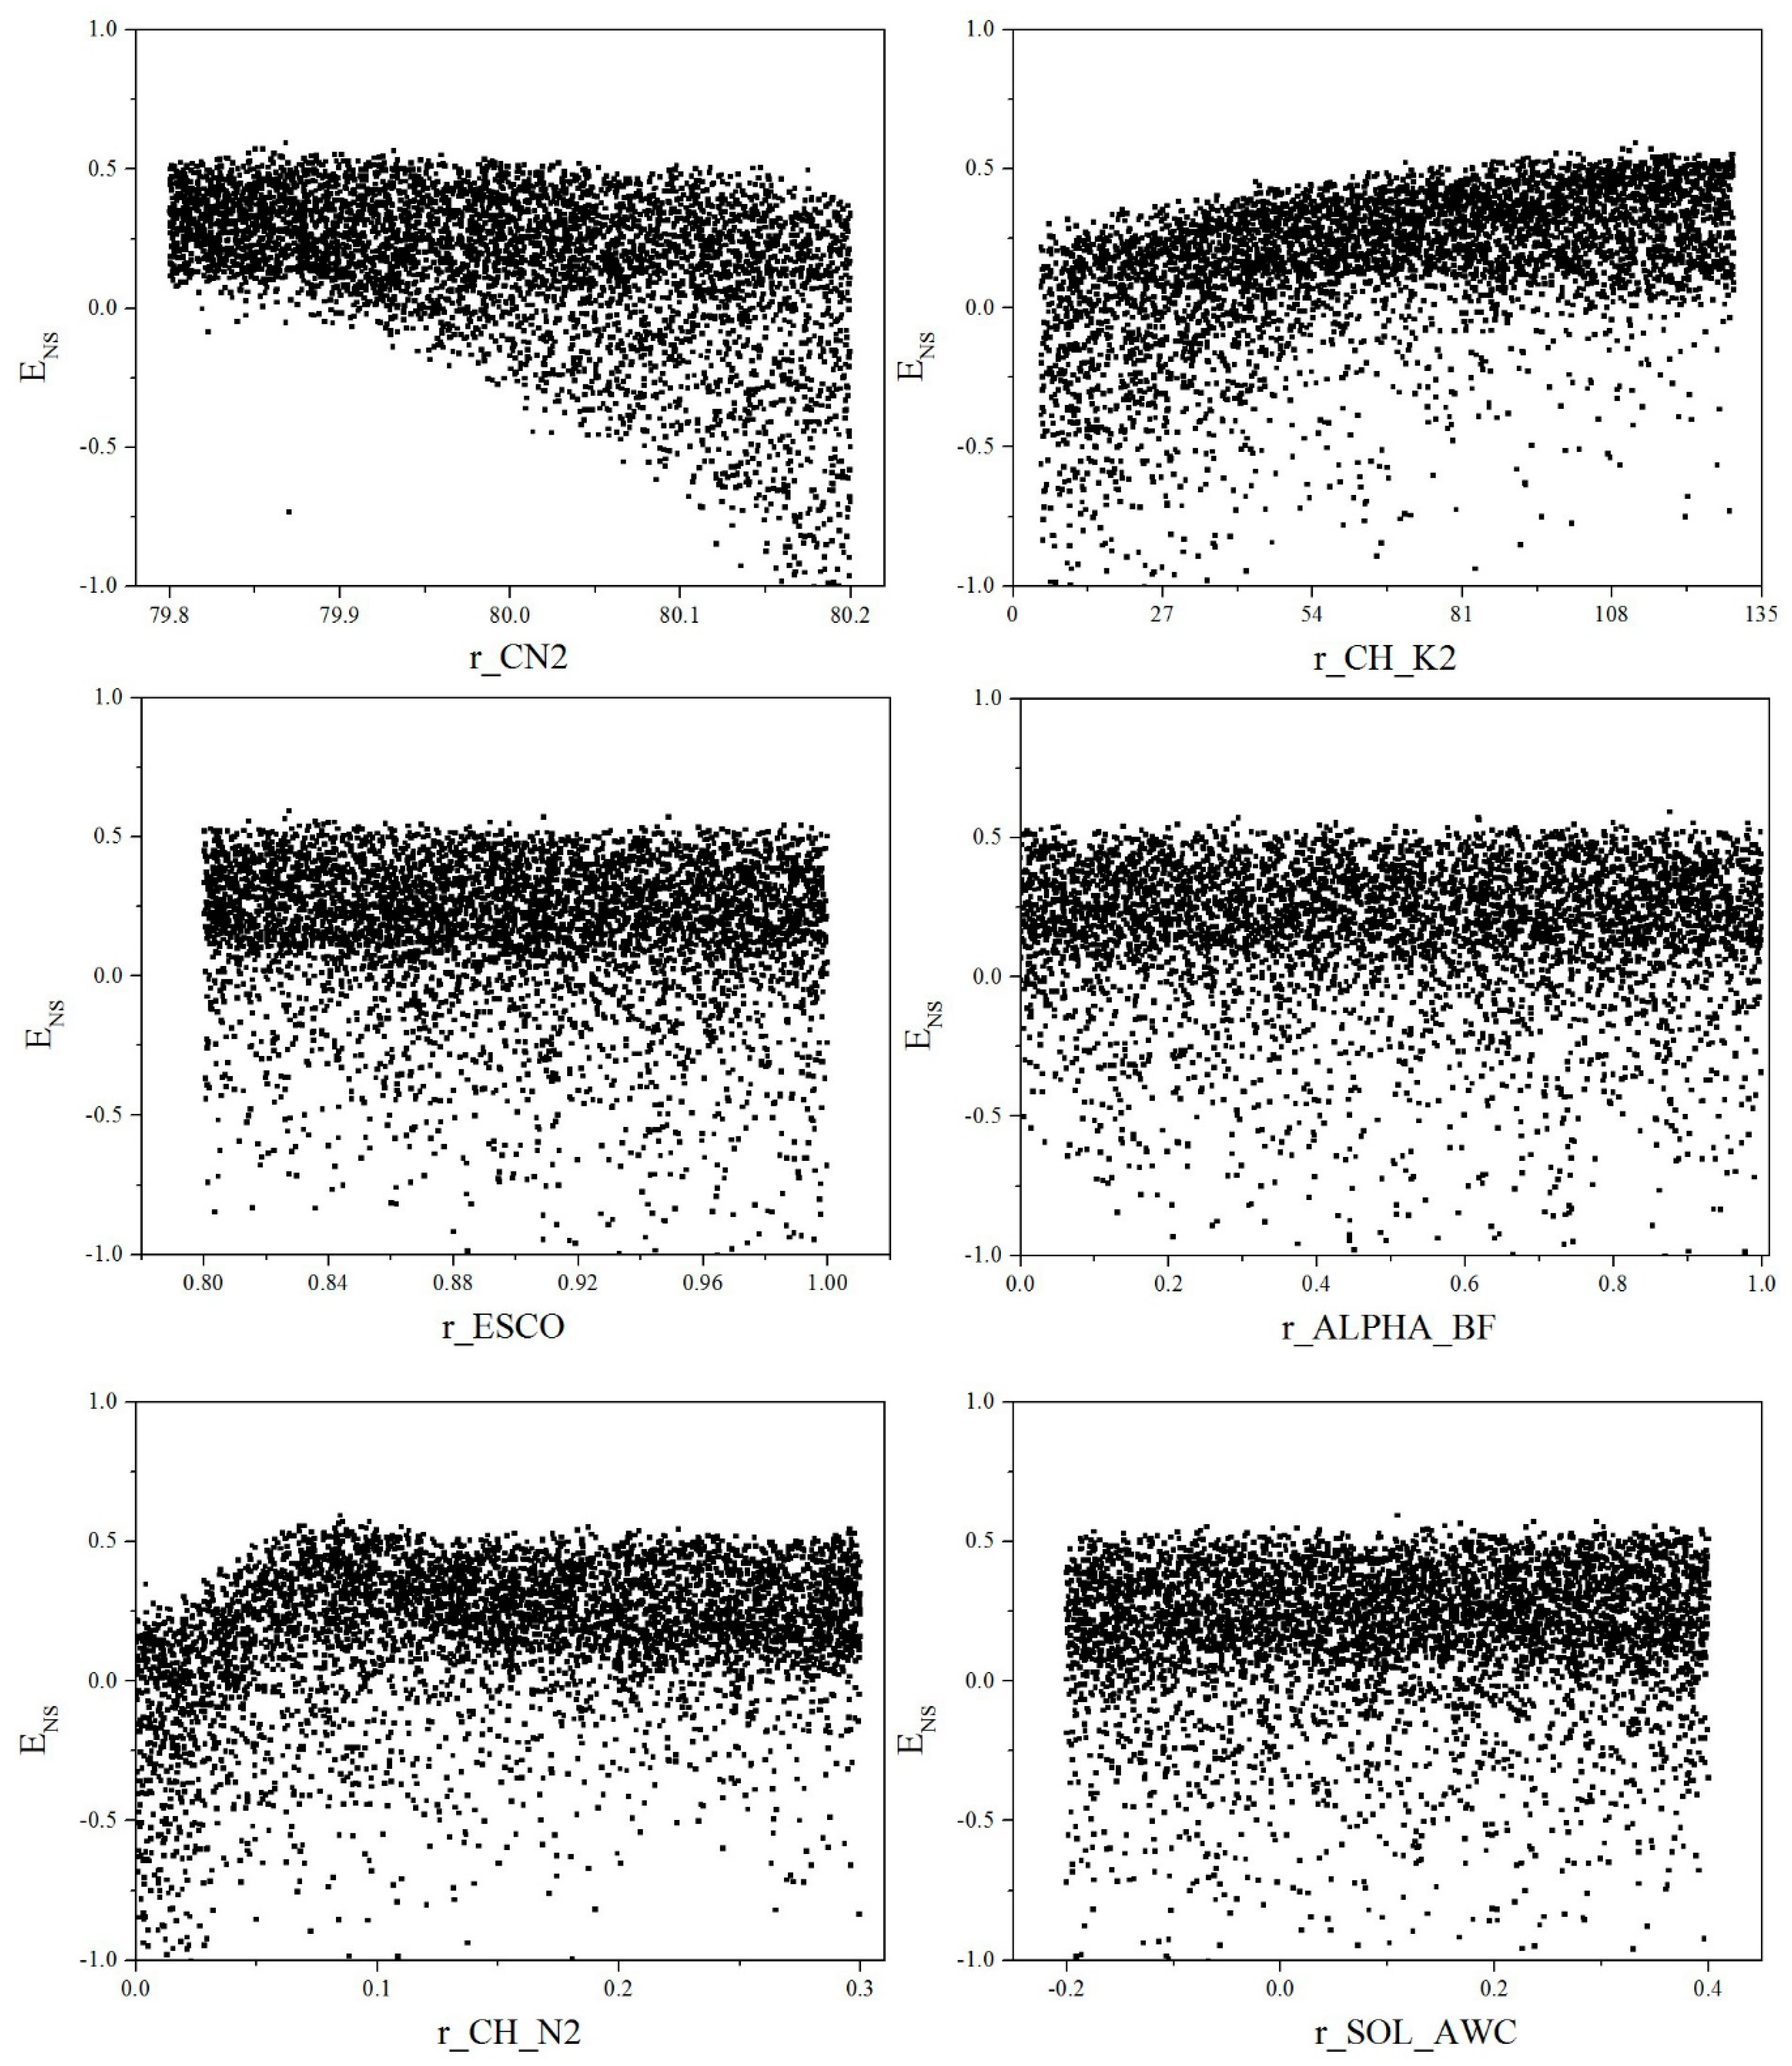
In Total, 25 major parameters (see Table 2) were employed for calibration purpose in this study. These parameters were considered sensitive to hydrologic processes, nitrogen and phosphorus nutrients simulation in SWAT in previous studies [2,33,34]. The description and sensitivity rankings, and ranges of the principal 25 parameters in relation to runoff, TN and TP are presented in Table 2. According to the results of the parameters’ sensitivity analysis, CN2 (moisture condition II curve number), CH_K2 (hydraulic conductivity of main channel), SOL_AWC (available water capacity), ALPHA_BF (baseflow recession constant), and ESCO (soil evaporation compensation) were most sensitive to hydrology modelling. In terms of nitrogen simulation, RCN (concentration of nitrogen in the rain) and SOL_ORGN (initial humic organic nitrogen in soil layer) were considered to be the most sensitive parameters. In terms of phosphorus simulation, FILTERW (width of the edge of the field filter strip) and SOL_ORGP (initial humic organic phosphorus in soil layer) are the most sensitive in the phosphorus modelling. CN2 is an empirical parameter, used to estimate direct runoff under water conditions, which varies with HRUs, depending on soil properties and land-use types. The value of CN2 in the TGRA is between 60 and 96, mainly because the dominant soil in the TGRA is clay, with a low permeability, which easily generates runoff. CH_K2 ranges from 0.1 to 0.5 in the TGRA and is mainly controlled by land-use and soil type. SOL_AWC regards the soil’s capacity to retain water and is the determinant of the field-carrying capacity of soil parameters, which depends on soil type. Therefore, soil water saturation, as well as the related evaporation and osmosis processes, are strongly influenced by this factor, with values ranging from 0.004 to 0.18 in the TGRA. ESCO is a compensatory factor for soil evaporation, and its value represents the distribution of soil evaporation depth, which varies between 0 and 1. Increasing the ESCO value will reduce soil evapotranspiration. As the TGRA has a humid climate, with abundant precipitation and high soil vegetation coverage, this parameter has a high value in the TGRA (0.33–0.83). ALPHA_BF fluctuates within the range of 0.01–0.048 and is the alpha factor of base flow, which affects the base flow simulation in the SWAT model. RCN shows the nitrogen concentration in rainwater, and the higher the N deposition caused by rainfall, the higher N’s input to the body of water. The value of FILTERW in the TGRA is between 3 and 5, indicating that a narrow buffer zone is suitable for the TGRA.
The dotted plots of posterior likelihood for the most sensitive parameters are demonstrated in Figure 3. With an increase of CN2, the likelihood value decreases and is subsequently dispersed. As the value of CH_K2 increases, the likelihood value increases, presenting a centralized distribution. The likelihood values of SOL_AWC, ALPHA_BF and ESCO, as a whole, showed a high likelihood aggregation. As the value of the CH_N2 parameter increases, the likelihood value tends to be uniformly distributed, with 0.07 as the inflection point. The comprehensive results showed a clear aggregation of the parameters with the highest sensitivity, indicating that the most sensitive parameters have a great influence on the uncertainty of the simulation results. A more detailed discussion of the parametric uncertainty of the TGRA is available in our previous work [2].
The calibration and validation results of runoff, sediment and water quality in the TGRA are presented in Table 3. Generally, for the hydrologic process, the values of R2 were above 0.50 (between 0.51 and 0.92 for the runoff, and between 0.61 and 0.79 for the sediment), and the values of ENS were above 0.50 (between 0.50 and 0.70 for the runoff, and between 0.52 and 0.74 for the sediment) which showed an acceptable matching degree between the observations and simulations. TN and TP were designated as indicators, to evaluate the model performance regarding the prediction of water quality. During the calibration period, the R2 values of TN were in the range 0.53–0.96, while the ENS values ranged from 0.42 to 0.84; the R2 values of TP were in the range 0.61–0.86, while the ENS values ranged from 0.51 to 0.65. For the validation period, the R2 values of TN were in the range 0.50–0.84, while the ENS values ranged from 0.44 to 0.80; the R2 values of TP were in the range 0.52–0.82, while the ENS values ranged from 0.49 to 0.64.
There are numerous possible reasons for the deviations between the simulations and observations, such as uncertainties during model parameterization, uncertainties in the observed data, and errors or oversimplifications in the model structure and the operation and management of the TGR, for the mismatch between observed and simulated values [42,43]. This is especially true regarding the water quality verification, since monthly observed data of water quality indicators were applied due to a paucity of data, and monitoring frequency once or twice a month may not be a good representation of the monthly average, especially when rainfall varies significantly. These deviations can be partially interpreted by the complexity of the migration and transformation of water pollutants. The variations in the land features and hydraulic conditions have prominent effects on the simulation results [2,44]. The uncertainty of the water quality was mostly affected by the runoff process [34]. The performance of the model in this study is acceptable compared with similar studies [2,27,33,44].
3.2. Landscape Pattern and Geomorphologic Characteristics
Forest, farmland and water are the three principal land-use types in the TGRA, accounting for 56.46%, 30.29% and 9.09% of land use, respectively. In each tributary, the proportion of farmland, forest and water varies greatly (see Figure 4). The proportion of agriculture land is more than 50% in L-10, L-11, L-12, L-14, and R-9, and less than 10% in L-1 and R-2. Agricultural land tends to be concentrated in the left bank of Yangtze River and distributed from the middle to the tail region of the TGRA. Forest is the main land-use type in most tributary basins (16 out of 23). These regions are mainly distributed in the reservoir head and the right bank of the Yangtze River. The tributary basins near the TGD have a large proportion of water area (L-1 to L-6 in the left bank; R-1 to R-5 in the right bank). The artificial construction land in the TGRA (including URLD, URMD, URHD, UINS, UIDU, and UCOM) is mainly distributed in L-12, L-13, L-14, and R-7 (see Figure 2d). This is largely because the main districts of Chongqing aggregate almost 60% of the large and medium-sized industrial enterprises and chemical terminals of the city, which are distributed along the river. Thus, industry is the major contributor to environmental pollution in these regions.
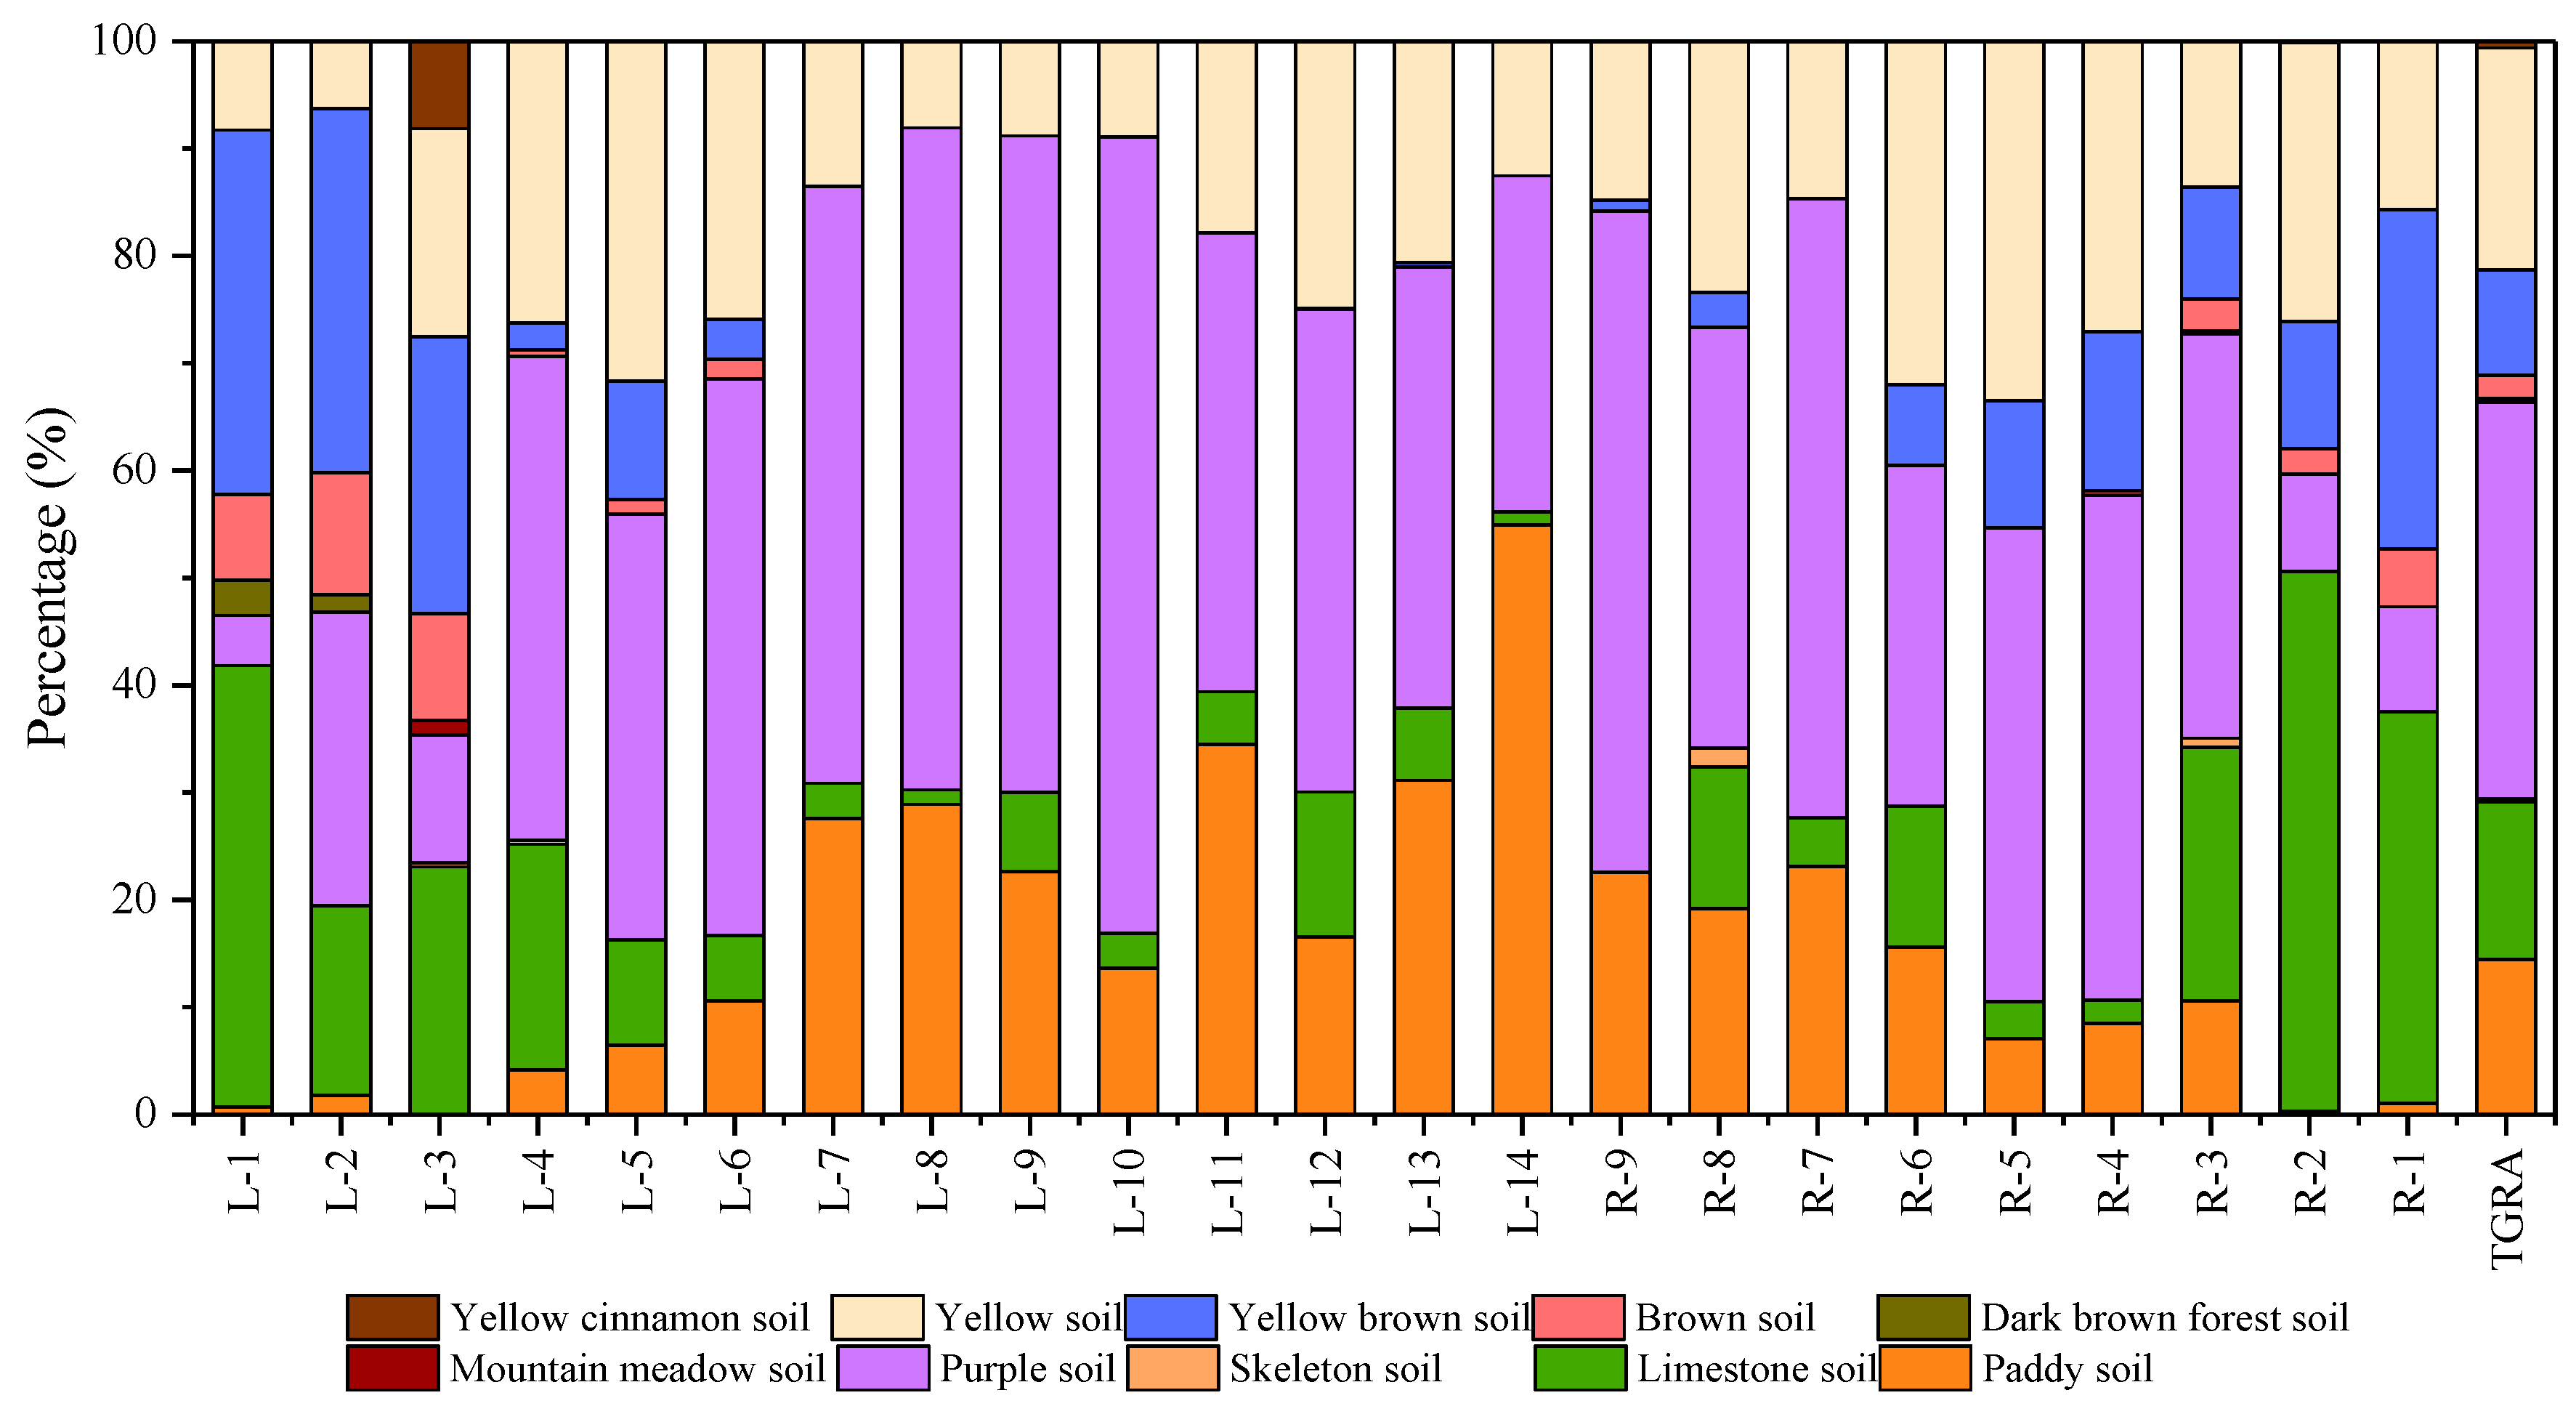
The proportion of each soil type in each tributary is shown in Figure 5. Among them, purple soil, yellow soil, limestone soil, and paddy soil account for the highest proportions—36.95%, 20.71%, 14.66%, and 14.47% respectively. There are seven river basins, namely, L-6 to L-10, R-9, and R-7, where purple soil accounts for more than 50% of the total basin area. The yellow soil in R-8, R-6, L-6, and L-12 accounts for a high proportion of the yellow soil present in the whole TGRA, while the yellow soil in R-5, R-6, L-5, R-7, L-4, and L-6 accounts for more than a quarter of the area of each basin. Limestone soil is mainly distributed in the head region of the TGRA, including L-1, L-2, L-3, R-1, and R-2. Paddy soil is chiefly distributed in the middle region of TGRA. The paddy soil of L-14, R-8, L-11, L-13, and L-12 accounts for more than half of the total paddy soil in the TGRA—54.92%, 19.20%, 34.65%, 31.13%, and 16.57% respectively. In addition, limestone soil proportions in L-7, L-8, L-9, R-9, and R-7 are relatively high, constituting more than 1/5 of their basin areas.
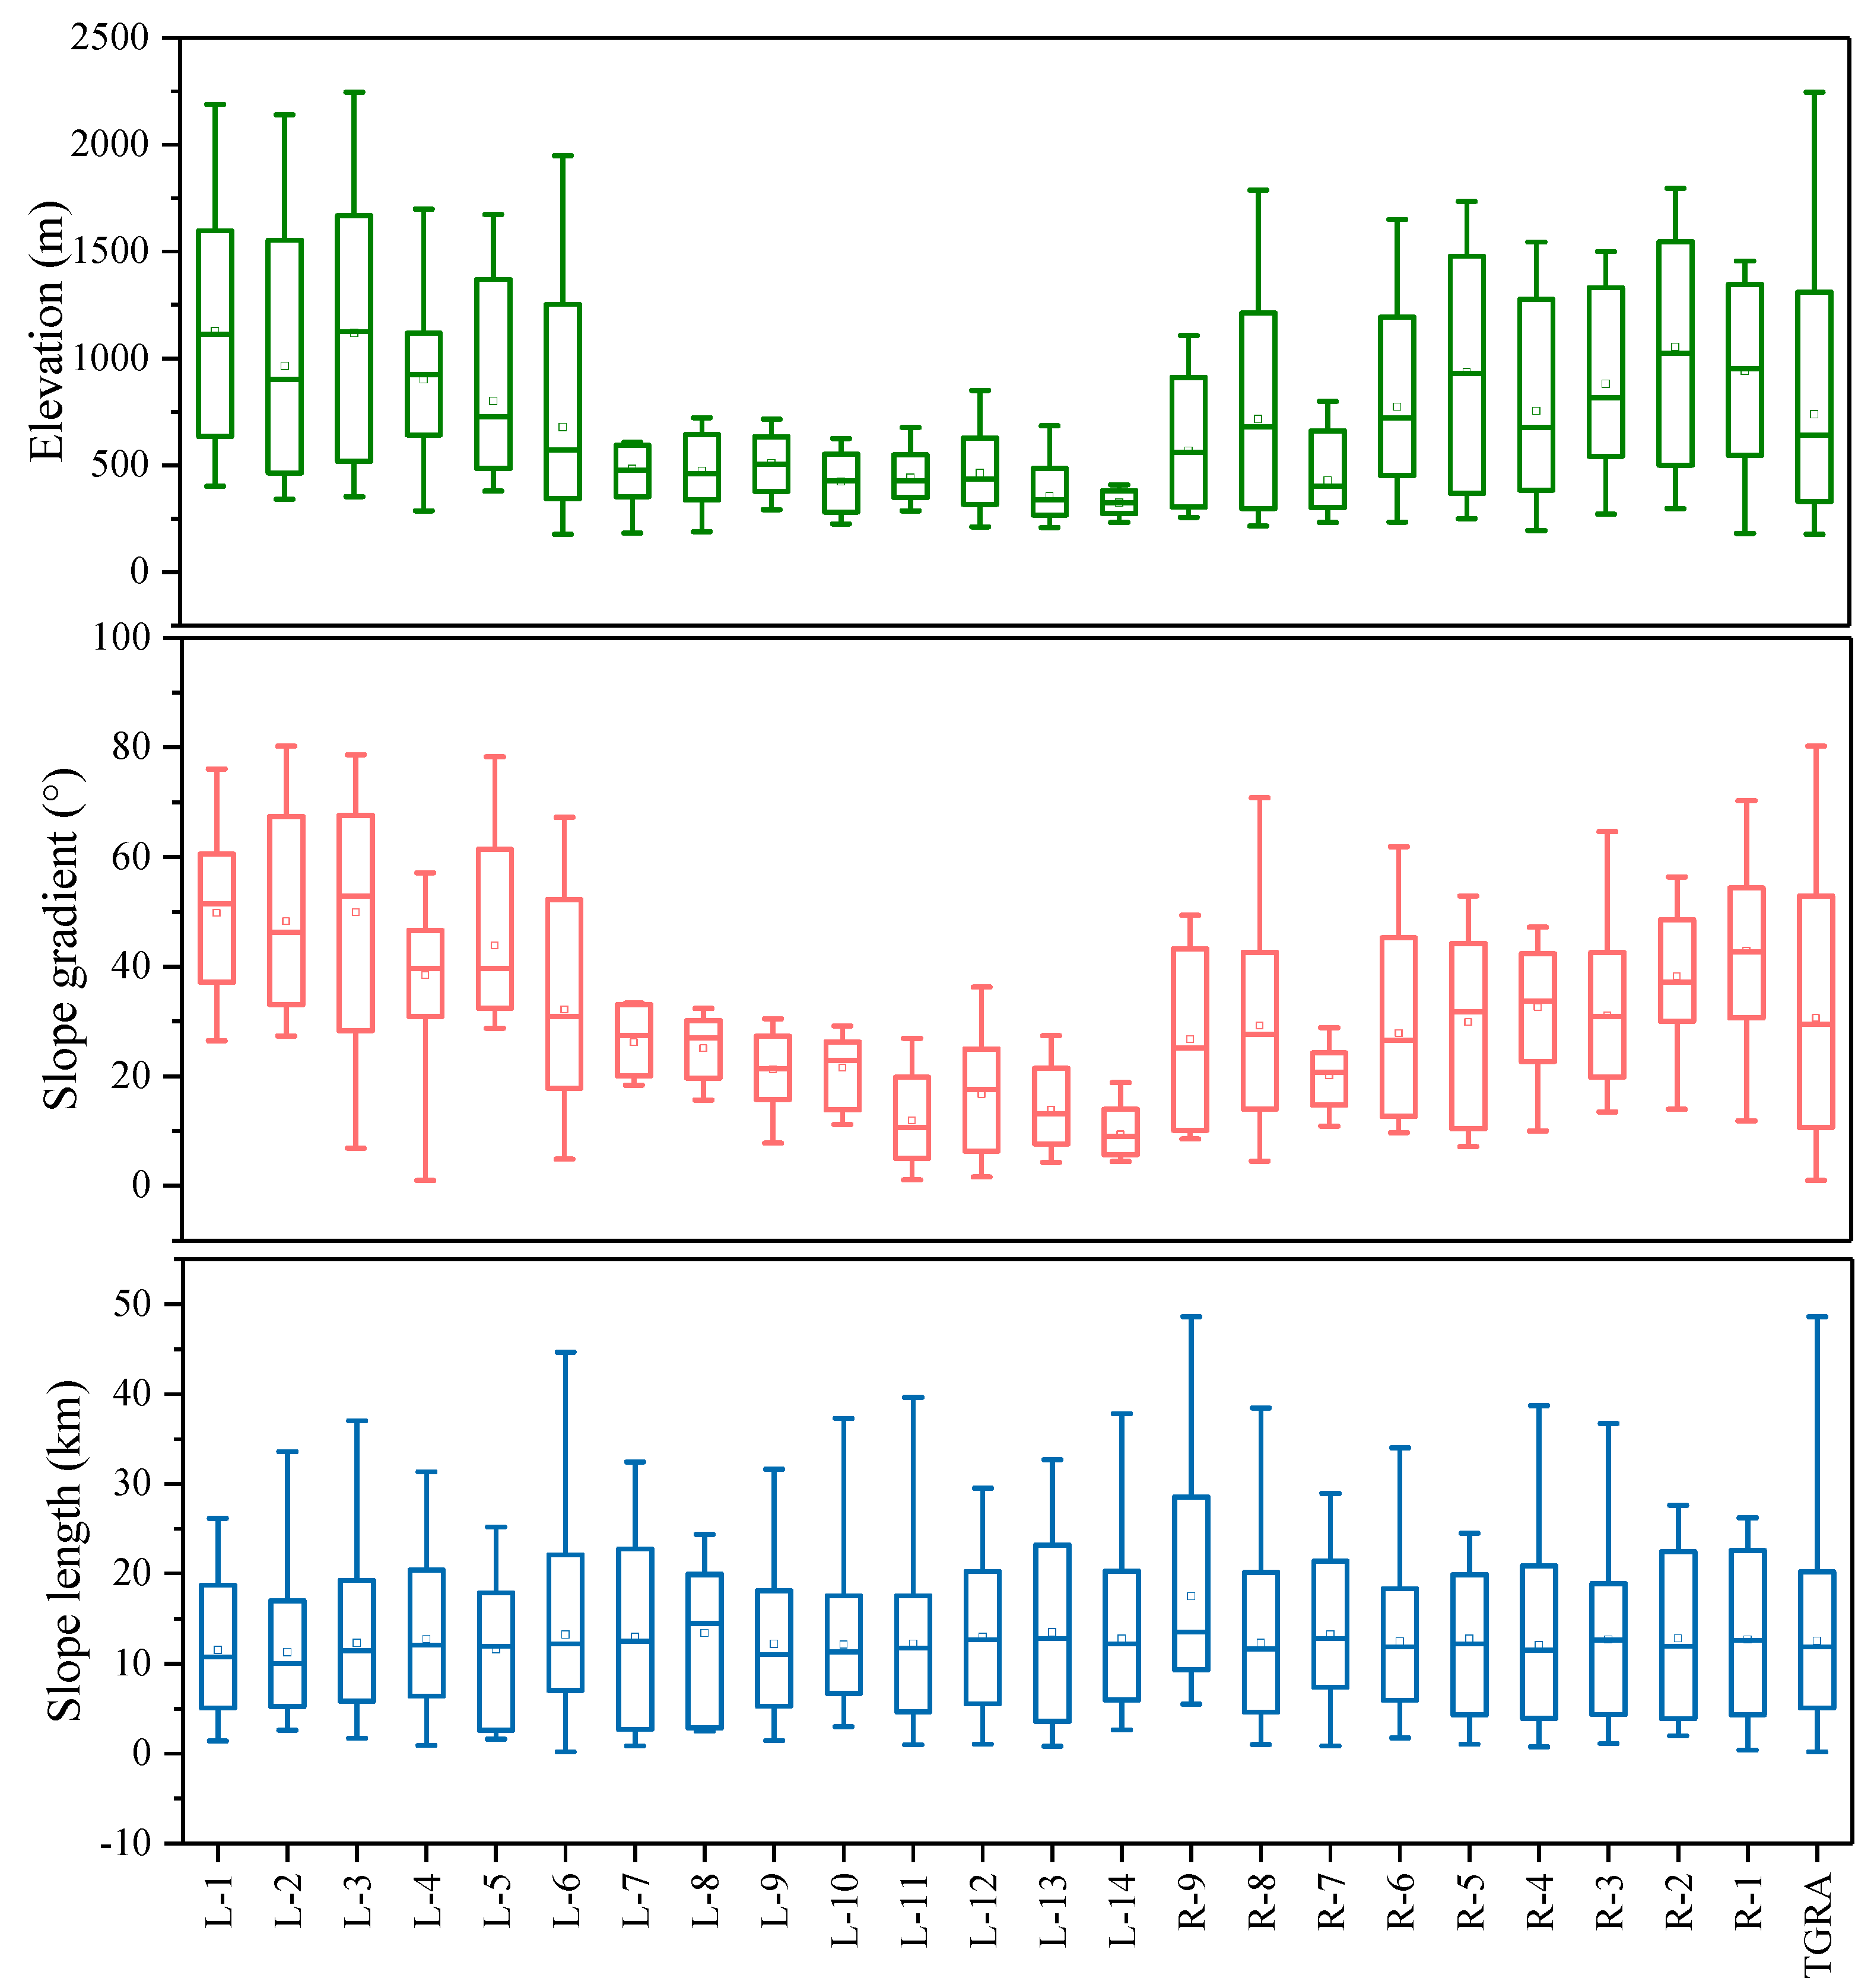
Figure 6 illustrates the differences in the elevation, slope gradient and slope length distribution of the TGRA and its 23 tributaries. According to Figure 6, the basins with an obvious elevation drop include L-1 to L-5 in the left bank of the head region of TGRA, and R-1 to R-5 in the right bank of the head region of TGRA. However, the middle and tail region of TGRA are generally flat and have a convergent terrain. The distribution pattern of the slope gradient in each tributary of TGRA is similar to that of elevation, whereas the slope length varies little among tributaries.
3.3. Spatial Distributions of Total Runoff and Water Quality
The spatial variations of the mean annual total runoff from 2010 to 2013 are demonstrated in Figure 7a, and the calculated total runoff contribution rate and ranking of each tributary are listed in Table S1. The simulation results for total runoff showed a significant variation between the left bank and the right bank, upstream and downstream, along the Yangtze River of TGRA. In general, the average total runoff depth during the period 2010–2013 in the left bank area was 538.6 mm, and 384.5 mm in the right bank, and the total runoff depth in the head region (553.3 mm) was higher than in the middle (458.7 mm) and tail region (383.2 mm).
The spatial distributions of the annual average values of TN and TP loads in the TGRA are illustrated in Figure 7b and 7c, respectively. The TN load was in the range 0–320 kg/ha. The regions with a high TN load were generally distributed in the high-density population areas of Chongqing, including L-10, L-11, L-12, L-14, and R7. The heavily and seriously polluted tributary basins cumulatively contributed 47.7% of the total TN load, but only accounted for 21.8% of the total area. TN loads in the left bank area (6.23 kg/ha) were 1.9 times higher than in the right bank area (3.27 kg/ha). The middle region had the highest amounts (5.51 kg/ha), followed by the tail region (5.15 kg/ha) and head region (3.92 kg/ha). The TP load was in the range 0–30 kg/ha, and the heavily polluted tributary basins were also the high-density areas of Chongqing City, which accounted for 21.8% of the total area but cumulatively contributed 45.8% of the total TP load. TP loads in the left bank area (1.27 kg/ha) were 2.2 times higher than in the right bank area (0.58 kg/ha), and those in the middle region (1.15 kg/ha) were highest, followed by the tail region (1.12 kg/ha) and head region (0.56 kg/ha).
3.4. Driving Factors of Spatial Differentiation of Total Runoff and Water Quality
3.4.1. The Effect of Land Use
Tables S2–S4 demonstrate the Pearson correlation between land use and runoff, TN and TP in the tributaries. The correlation degree of different tributaries with land use differs in terms of total runoff. The total runoff depth in most of the tributaries showed a significant negative correlation with agricultural land proportion, while only L-2 had a positive correlation. Total runoff depth was positively correlated with FRST proportion in tributaries at the head and middle regions of the TGRA (L-4, L-5, L-7, L-8, and R2) and negatively correlated with forestland in tributaries at the middle and tail regions of the TGRA (L-10, L-13 and R-8). However, the proportion of the WATR of tributaries in the head region of the TGRA was negatively correlated with the total runoff depth, while positively correlated in the middle and tail regions. Generally, the proportion of artificial construction land (URLD, URML, URHD, UNIS, DIDU, and UCOM) is negatively correlated with total runoff depth in the TGRA.
As for TN and TP, the proportion of AGRL and ORCD generally had a positive correlation with them, while FRST proportion was negatively correlated, except for L-10, whose ORCD proportion was negatively correlated with TP load. The correlation between proportions of WATR and TN load is less than that of TP. There was a positive correlation between artificial construction land proportion and TN load, and artificial construction land proportion also has a positive correlation with the TP load in the tributaries of the head region, but a negative correlation in the tail regions of the TGRA.
3.4.2. The Effect of Soil
Pearson correlations between soil type and total runoff depth and water quality indicators in tributaries are presented in Tables S5–S7. Compared with other soil types, purple soil had the most obvious correlation with total runoff depth and showed a significant negative correlation in most tributaries and significant positive correlation in other tributaries (including L-11, L-12 and L-13). The yellow soil was positively correlated with total runoff in five tributaries and negatively correlated with total runoff in three tributaries. Paddy soil was negatively correlated with total runoff in six tributaries and positively correlated with total runoff in two tributaries. The correlation between limestone soil and total runoff was also different between tributaries, showing a positive correlation in L-2, L-6, L-9, and R-3, and a negative correlation in L-3, L-4 and L-7.
The purple soil of four tributaries was negatively correlated with the TN load, while purple soil in seven tributaries was significantly correlated with TP load; L-1, L-13, L-14, and R-1 were positively correlated, and L-6, L-7 and L-12 were negatively correlated. Among the tributaries with significant correlations, the yellow soil of most tributaries was positively correlated with the TN and TP load, except for the yellow soil of L-1, which showed a negative relationship with the TP load. Limestone soil was positively correlated with TN load in four tributaries and TP load in six tributaries. A significant correlation between paddy soil and TN load was only found in three tributaries (namely L-5, L-13 and R-9), while a significant correlation between paddy soil and TP load was found in six tributaries, among which three tributaries were positively correlated with TP load, and three tributaries were negatively correlated with TP load.
3.4.3. The Effect of Topology
Table S8 shows the Pearson correlation between the average elevation (ELEV), slope gradient (SLO), slope length (SLL) and total runoff depth, TN and TP. There was a significant correlation between total runoff depth and ELEV in 13 tributaries; L-10 and L-14 were negatively correlated, and the remaining eleven tributaries were positively correlated. Combined with the elevation distribution of the tributaries (Figure 6), it can be inferred that the runoff depth of the tributaries with a low average elevation and small elevation fluctuation in the TGRA was negatively correlated with the ELVE, while correlations were contrary in tributaries with large elevation differences. SLO and total runoff depth were significantly correlated in eight tributaries, half of which were positively correlated (L-1, L-5, L-6, and R-3) and half negatively correlated (L-10, L-11, R-5, and R-2). SLL was significantly correlated with total runoff depth in only three tributaries, namely, L-1, R-8 and R-1.
TN and ELEV showed a significant negative correlation in eight tributaries and a significant positive correlation in three tributaries. This is similar to the distribution rule of the correlations between total runoff depth and ELEV in TGRA, showing negative correlation in tributaries with a small elevation fluctuation and positive correlation in tributaries with a large elevation fluctuation. SLO and TN were positively correlated in L-8, L-13 and L-14, but negatively correlated in L-2, L-3, R-8, R-3, and R-4. The SLL of five tributaries was positively correlated with TN, while the SLL of three tributaries was negatively correlated.
The correlation between TP and ELEV was more obvious than that of TN, with a significant correlation in all 16 tributaries, among which there were significant positive correlations in five tributaries including L-10 to L-14, and significant negative correlations in the other 11 tributaries. The correlation between TP and SLO showed obvious regional differences, with a positive correlation in tributaries located in the middle and tail region of TGRA (L-2, L-3, R-9, R-4, R-1), and a negative correlation in tributaries at the head region of TGRA (L-11 to L-14). The correlation between TP and SLL also showed obvious regional differences, but the rule was contrary to that of TP and SLO.
4. Discussion
Land use is identified as a vital factor affecting the runoff generation, soil erosion and nitrogen and phosphorus loads in a watershed [21,45]. Forests have a great ability to intercept precipitation and increase infiltration, because of their mature canopy, rich litter humus layer and complex root system [46]. Grassland has been proven to have the ability to intercept the force of raindrops and accelerate penetration [47]. Agricultural activities, however, have been perceived as an important cause of high surface runoff and soil erosion [48,49]. The yield capacity of groundwater and lateral flow in forest and grasslands are higher than that in agricultural land and artificial construction land, while the yield capacity of the surface runoff of agricultural land and artificial construction land is stronger than that of forest and grasslands, and the amount of base flow depends on the WATR. Based on the research results presented in this paper, it could be inferred that the lateral flow and groundwater of the tributaries played a dominant role in the head region of TGRA, with better vegetation cover, while the surface runoff and base flow played a leading role in the tributaries of middle and tail regions, with a large proportion of AGRL. Agricultural land proved to be more prone to water loss and soil erosion than natural forest land [21,50], resulting in greater nutrient loads. In built-up areas, due to the influence of industrial activities, point source discharge had a greater impact on water quality. In this paper, N load was mainly considered in point source discharge, while P was mainly derived from soil erosion. Although the surface runoff generation from the construction land could be substantial depending on the rainfall and the impervious nature (less infiltration of rainfall on artificial construction land) of the surface, a higher proportion of TN and TP loads was not found in the simulations. Therefore, in the tributary basin, where the construction land areas occupy a large proportion of total land, the total phosphorus load was negatively correlated with the construction land.
The main soil types in the TGRA are purple soil, paddy soil and yellow soil. Purple soil is rich in calcium (calcium carbonate) and phosphorus, potassium and other nutrients, but the soil layer is thin, resulting in a poor ability to resist erosion and preserve water and fertilizer. Paddy soil contains abundant organic matter, with a sticky texture. Yellow soil is a light-textured soil with an abundance of organic matter and nutrients (nitrogen, phosphorus and potassium). Studies have shown that purple soil is the least erosion-resistant soil type, while paddy soil and yellow soil are more erosion-resistant under the same intensity of rainfall; this usually leads to higher ratios of overland flow [18]. Ground water is the main source of total runoff with low-intensity rainfall events in purple soil regions [51]. However, as the most common land-use type in purple soil distribution regions is FRST, the total runoff in these regions is relatively reduced, due to the water conservation effect of FRST. The change in soil surface structure caused by their roots explains why the proportion of purple soil in most tributaries of the TGRA in this paper was negatively correlated with total runoff depth. In general, correlations between soil types and total runoff depth in tributaries of TGRA were not obviously consistent, this indicated that soil types played a different role in the total runoff production process of various tributaries. The loss of N and P in ARGL was closely related to the formation environment, structure, and physical and chemical properties of the soil [52]. Agricultural land usually has low levels of organic matter and poor soil structure, which easily causes a loss of nitrogen and phosphorus. Purple soil accounted for the largest proportion of 36.95% in the TGRA, with a high content of phosphorus, potassium and other nutrient elements and low level of organic matter. Nitrogen loss is mainly controlled by hydrologic processes, especially groundwater in the purple soil region [51]. The amount of purple soil nitrogen is low, and the land-use type is mainly FRST, which is why the proportion of purple soil in most tributaries was not significantly correlated with the load per unit area of TN, and a few tributaries were negatively correlated. The amount of organic matter in yellow soil and limestone soil is higher than in purple soil, and the distribution areas of yellow soil and limestone soil are mostly agricultural land, leading to more N and P erosion. Previous studies have also shown that nitrogen loss per unit area of yellow soil and limestone soil was higher than in purple soil under the same rainfall conditions [52]. As phosphorus binds tightly to soil particles, it is easily transported downwards during erosion. Therefore, the correlation between soil type and TP was more significant in each tributary compared to correlations with TN, since the phosphorus transport mechanisms are largely associated with surface runoff, while TN, especially nitrate–nitrogen, is associated with groundwater levels. However, as with the nitrogen load, the phosphorus load in tributaries and soil types did not show a completely consistent trend in the present study. This could be because soil texture was not the only factor affecting nitrogen and phosphorus erosion, and soil structure and soil surface mulching were also important factors, as has been reflected in many studies [53].
Previous studies found that topography had a considerable impact on runoff generation, soil erosion and subsequent nutrient loss [24,53]. The differences in correlation between ELEV and total runoff depth, TN and TP can be mainly attributed to land use and soil vertical zone differentiation in the TGRA. Slope gradient and length proved to be the main topographic factors affecting soil erosion [23,54,55]. As for SLO, some studies have demonstrated that infiltration and, consequently, runoff, is independent of SLO [56], or may even decrease with rising SLO levels, because the larger erosion on steeper slopes can reduce surface sealing [57]. However, some studies have also shown that runoff increased with SLO [22,58]. Rainfall intensity [59,60], soil texture and structure, and land use contribute to the correlation differences between SLO and total runoff depth. It has been found that there is no distinction or little distinction between the different SLOs in FRST, while PAST showed higher differences, and the greatest differences were observed in AGRL [54]. The contribution rates of rainfall intensity and SLO towards soil erosion varied with rainfall intensity. The slope gradient plays the leading role when rainfall intensity is low, while at a high rainfall intensity, rainfall intensity plays a dominant role [58]. Studies have shown that, under different land-use types, high intensity and a short duration of rainfall events tend to lead to more surface runoff and soil loss [50]. All these findings explain different correlations of SLO and total runoff depth, TP and TN, in different tributaries of the TGRA. The formation and spatial distributions of surface runoff are affected by the differences in SLL, and the relationship between SLL and total runoff depth is nonlinear [24]. With increasing SLL, soil erosion is on the rise in many studies [24]. In this study, correlations between SLL and total runoff depth, TN and TP in different tributary basins were inconsistent.
5. Conclusions
The present geographical situations in different tributaries of the TGRA, including land use patterns, soil patterns, elevation maps, and the spatial distribution of slope gradients and slope lengths were studied in this paper. The TGRA was divided into 23 tributary basins with 1840 sub-basins. The calibration and validation results indicated that the SWAT model can be successfully utilized in characterizing the hydrologic processes and associated water quality in the TGRA. The main conclusions are summarized as follows:
- (1)
- The landscape pattern and geographical features of the TGRA show obvious spatial distribution differences. Specifically, agricultural land is mainly concentrated in the flat area in the middle and tail regions of the TGRA. In most of the tributaries, the forest coverage rate is more than 50%. Water area occupies a relatively high proportion of the tributaries at the backwater area of the head region, while artificial construction land occupies a large proportion of the tail region. Purple soil, yellow soil, lime soil and paddy soil are the major soil types in the TGRA, and they are distributed significantly differently amongst the tributaries. In the head region of the TGRA, the topographic factors, in term of elevation, slope gradient and slope length in tributaries, are largely different, while relatively small differences are noticed within the middle region. The physical characteristics of purple soil, yellow soil, lime soil, and paddy soil are different. Under the influence of different slope gradients, slope lengths and rainfall intensities, these physical characteristics would affect the runoff generation and TN and TP loads.
- (2)
- The simulation results based on the calibrated SWAT model revealed that both total runoff and water quality exhibited apparent spatial heterogeneity. The total runoff depth on the left bank of the Yangtze River was 1.4 times greater than on the right bank, and total runoff depth on the head region was 1.44 times greater than on the tail region. Human activities have a significant impact on total runoff, for instance, serious rainfall erosion occurs in agricultural land. The TN and TP loads were 1.9 and 2.2 times higher in the left bank than the right, and those on the tail region were 1.31 and 1.99 times greater than on the head region, respectively.
- (3)
- No consistent patterns were observed in the correlations between land use, soil and topography and runoff, TN and TP levels of different tributaries. According to the correlation results of land use and total runoff depth in various tributaries, it was concluded that the lateral flow and groundwater level of the tributaries played the dominant role in the head region of the TGRA, with better vegetation cover, while the surface runoff and base flow took a leading role in the tributaries of the middle and tail regions, with a large proportion of AGRL. In terms of the effects of land-use type, AGRL and ORCD played a positive role in nutrient-loading, whereas FRST played a negative role. Soil types played different roles in the total runoff and nutrient production processes of various tributaries and could not be overgeneralized, since soil texture is not the only factor affecting nitrogen and phosphorus erosion, and soil structure and soil mulching were also important factors. On account of the different spatial distributions of land use, soil type and geographical features in the tributaries, correlations between ELVE, SLO, SLL and total runoff depth, TN, TP were discrepant, and no consistent trends were observed in each tributary basin. Therefore, the management of water environment safety in the TGRA needs to be differentiated and targeted based on the spatial characteristics of different regions.
Supplementary Materials
The following are available online at https://www.mdpi.com/2073-4441/11/12/2608/s1, Table S1: Area, annual average total runoff depth and unit area water pollution loads of 23 parts in the TGRA. Table S2: Correlation between total runoff depth and land use types in tributaries. Table S3: Correlation between unit area load of TN and land use types in tributaries. Table S4: Correlation between unit area load of TP and land use types in each tributary. Table S5: Correlation between total runoff depth and soil types in tributaries. Table S6: Correlation between unit area load of TN and soil type in tributaries. Table S7: Correlation between unit area load of TP and soil type in tributaries. Table S8: Correlation between total runoff, TN, TP and ELEV, SLO and SLL in tributaries.
Author Contributions
This research was carried out in collaboration among all authors. X.C. performed the model calculations, analyzed the results and original draft writing; G.X. collected and processed the data, supervised the study and contributed to the paper writing; W.Z. and H.P. provided the general idea of this research, supervised the study and contributed to the paper writing; H.X. and X.Z. performed the model calculation, and assisted in revising the manuscript; Q.K. and J.W. provided many language improvements on the manuscript.
Funding
This research was funded by the Major Science and Technology Program for Water Pollution Control and Treatment of China (2013ZX07503–001), National Key Research and Development Program of China (No. 2017YFC1502504 and No. 2016YFC0402201), the National Natural Science Foundation of China (Grant No. 41877531) and the International Exchange Funding Project of Wuhan University, China.
Acknowledgments
This research was subsidized by the Major Science and Technology Program for Water Pollution Control and Treatment of China (2013ZX07503–001), National Key Research and Development Program of China (No. 2017YFC1502504 and No. 2016YFC0402201), the National Natural Science Foundation of China (Grant No. 41877531) and the International Exchange Funding Project of Wuhan University, China. The authors are very grateful to the Bureau of Hydrology, Changjiang Water Resources Commission and Chongqing Academy of Environmental Science, for sharing the hydrology data, water quality data and the other data. The authors also appreciate the anonymous reviewers for their valuable comments on the study.
Conflicts of Interest
The authors declare no conflict of interest.
References
- Zheng, B.; Qin, Y.; Liu, D.; Norra, S.; Wang, S. Thematic issue: Water environment of the Three Gorges Reservoir. Environ. Earth Sci. 2017, 76, 819. [Google Scholar] [CrossRef] [Green Version]
- Shi, Y.; Xu, G.; Wang, Y.; Engel, B.A.; Peng, H.; Zhang, W.; Cheng, M.; Dai, M. Modelling hydrology and water quality processes in the Pengxi River basin of the Three Gorges Reservoir using the soil and water assessment tool. Agric. Water Manag. 2017, 182, 24–38. [Google Scholar] [CrossRef]
- Chen, J.; Finlayson, B.L.; Wei, T.; Sun, Q.; Webber, M.; Li, M.; Chen, Z. Changes in monthly flows in the Yangtze River, China—With special reference to the Three Gorges Dam. J. Hydrol. 2016, 536, 293–301. [Google Scholar] [CrossRef]
- Zhang, T.; Ni, J.; Xie, D. Severe situation of rural nonpoint source pollution and efficient utilization of agricultural wastes in the Three Gorges Reservoir Area. Environ. Sci. Pollut. Res. 2015, 22, 16453–16462. [Google Scholar] [CrossRef] [PubMed]
- Xia, J.; Xu, G.; Guo, P.; Peng, H.; Zhang, X.; Wang, Y.; Zhang, W. Tempo-Spatial Analysis of Water Quality in the Three Gorges Reservoir, China, after its 175-m Experimental Impoundment. Water Resour. Manag. 2018, 32, 2937–2954. [Google Scholar] [CrossRef]
- Wang, X.; Wang, Q.; Wu, C.; Liang, T.; Zheng, D.; Wei, X. A method coupled with remote sensing data to evaluate non-point source pollution in the Xin’anjiang catchment of China. Sci. Total Environ. 2012, 430, 132–143. [Google Scholar] [CrossRef]
- Zhang, W.; Wang, Y.; Peng, H.; Li, Y.; Tang, J.; Wu, K.B. A coupled water quantity-quality model for water allocation analysis. Water Resour. Manag. 2010, 24, 485–511. [Google Scholar] [CrossRef]
- Chang, C.; Sun, D.; Feng, P.; Zhang, M.; Ge, N. Impacts of Nonpoint Source Pollution on Water Quality in the Yuqiao Reservoir. Environ. Eng. Sci. 2017, 34, 418–432. [Google Scholar] [CrossRef]
- Tian, Y.; Huang, Z.; Xiao, W. Reductions in non-point source pollution through different management practices for an agricultural watershed in the Three Gorges Reservoir Area. J. Environ. Sci. 2010, 22, 184–191. [Google Scholar] [CrossRef]
- Wu, L.; Long, T.Y.; Liu, X.; Ma, X. yi Modeling impacts of sediment delivery ratio and land management on adsorbed non-point source nitrogen and phosphorus load in a mountainous basin of the Three Gorges reservoir area, China. Environ. Earth Sci. 2013, 70, 1405–1422. [Google Scholar] [CrossRef]
- Shen, Z.; Zhong, Y.; Huang, Q.; Chen, L. Identifying non-point source priority management areas in watersheds with multiple functional zones. Water Res. 2015, 68, 563–571. [Google Scholar] [CrossRef] [PubMed]
- Ouyang, W.; Yang, W.; Tysklind, M.; Xu, Y.; Lin, C.; Gao, X.; Hao, Z. Using river sediments to analyze the driving force difference for non-point source pollution dynamics between two scales of watersheds. Water Res. 2018, 139, 311–320. [Google Scholar] [CrossRef] [PubMed]
- Wang, Y.; Zhang, W.; Engel, B.A.; Peng, H.; Theller, L.; Shi, Y.; Hu, S. A fast mobile early warning system for water quality emergency risk in ungauged river basins. Environ. Model. Softw. 2015, 73, 76–89. [Google Scholar] [CrossRef]
- Ding, X.; Zhou, H.; Lei, X.; Liao, W.; Wang, Y. Hydrological and associated pollution load simulation and estimation for the Three Gorges Reservoir of China. Stoch. Environ. Res. Risk Assess. 2013, 27, 617–628. [Google Scholar] [CrossRef]
- Shen, Z.; Qiu, J.; Hong, Q.; Chen, L. Simulation of spatial and temporal distributions of non-point source pollution load in the Three Gorges Reservoir Region. Sci. Total Environ. 2014, 493, 138–146. [Google Scholar] [CrossRef] [PubMed]
- Shen, Z.; Chen, L.; Hong, Q.; Xie, H.; Qiu, J.; Liu, R. Vertical Variation of Nonpoint Source Pollutants in the Three Gorges Reservoir Region. PLoS ONE 2013, 8, e71194. [Google Scholar] [CrossRef] [Green Version]
- Ouyang, W.; Hao, F.; Skidmore, A.K.; Toxopeus, A.G. Soil erosion and sediment yield and their relationships with vegetation cover in upper stream of the Yellow River. Sci. Total Environ. 2010, 409, 396–403. [Google Scholar] [CrossRef]
- Wang, L.; Liang, T.; Chong, Z.; Zhang, C. Effects of soil type on leaching and runoff transport of rare earth elements and phosphorous in laboratory experiments. Environ. Sci. Pollut. Res. 2011, 18, 38–45. [Google Scholar] [CrossRef] [Green Version]
- Naslas, G.D.; Miller, W.W.; Gifford, G.F.; Fernandez, G.C.J. Effects of soil type, plot condition, and slope on runoff and interrill erosion of two soils in the Lake Tahoe Basin. Water Resour. Bull. 1994, 30, 319–328. [Google Scholar] [CrossRef]
- Palis, R.G.; Rose, C.W.; Saffigna, P.G. Soil erosion and nutrient loss. IV. Effect of slope length on runoff, sediment yield, and total nitrogen loss from steep slopes in pineapple cultivation. Aust. J. Soil Res. 1997, 35, 907–923. [Google Scholar] [CrossRef]
- Recanatesi, F.; Ripa, M.N.; Leone, A.; Luigi, P.; Salvati, L. Land use, climate and transport of nutrients: Evidence emerging from the lake vicocase study. Environ. Manag. 2013, 52, 503–513. [Google Scholar] [CrossRef] [PubMed]
- Vaezi, A.R.; Zarrinabadi, E.; Auerswald, K. Interaction of land use, slope gradient and rain sequence on runoff and soil loss from weakly aggregated semi-arid soils. Soil Tillage Res. 2017, 172, 22–31. [Google Scholar] [CrossRef]
- Zhang, H.; Wei, J.; Yang, Q.; Baartman, J.E.M.; Gai, L.; Yang, X.; Li, S.Q.; Yu, J.; Ritsema, C.J.; Geissen, V. An improved method for calculating slope length (λ) and the LS parameters of the Revised Universal Soil Loss Equation for large watersheds. Geoderma 2017, 308, 36–45. [Google Scholar] [CrossRef]
- Zhang, X.; Hu, M.; Guo, X.; Yang, H.; Zhang, Z.; Zhang, K. Effects of topographic factors on runoff and soil loss in Southwest China. Catena 2018, 160, 394–402. [Google Scholar] [CrossRef]
- Nazari-Sharabian, M.; Taheriyoun, M.; Ahmad, S.; Karakouzian, M.; Ahmadi, A. Water quality modeling of Mahabad Dam watershed-reservoir system under climate change conditions, using SWAT and system dynamics. Water (Switzerland) 2019, 11, 394. [Google Scholar] [CrossRef] [Green Version]
- Arnold, J.G.; Srinivasan, R.; Muttiah, R.S.; Williams, J.R. Large area hydrologic modeling and assesment Part I: Model development. JAWRA J. Am. Water Resour. Assoc. 1998, 34, 73–89. [Google Scholar] [CrossRef]
- Gassman, P.W.; Reyes, M.R.; Green, C.H.; Arnold, J.G. the Soil and Water Assessment Tool: Historical Development, Applications, and Future Research Directions. Trans. ASABE 2007, 50, 1211–1250. [Google Scholar] [CrossRef] [Green Version]
- Tripathi, M.P.; Raghuwanshi, N.S.; Rao, G.P. Effect of watershed subdivision on simulation of water balance components. Hydrol. Process. 2006, 20, 1137–1156. [Google Scholar] [CrossRef]
- Chen, X.; Guo, P.; Peng, H.; Wang, Y.; Cai, F. Influence of different sub-watershed division schemes on simulation results of SWAT model. Yangtze River 2016, 47, 44–49. [Google Scholar]
- Cheng, M.; Wang, Y.; Engel, B.; Zhang, W.; Peng, H.; Chen, X.; Xia, H. Performance assessment of spatial interpolation of precipitation for hydrological process simulation in the Three Gorges Basin. Water (Switzerland) 2017, 9, 838. [Google Scholar] [CrossRef] [Green Version]
- Heathman, G.C.; Larose, M. Influence of Scale on SWAT Model Calibration for Streamflow. In Proceedings of the MODSIM 2007 International Congress on Modelling and Simulation, Christchurch, New Zealand, 10–13 December 2007; pp. 2747–2753. [Google Scholar]
- Yalew, S.; van Griensven, A.; Ray, N.; Kokoszkiewicz, L.; Betrie, G.D. Distributed computation of large scale SWAT models on the Grid. Environ. Model. Softw. 2013, 41, 223–230. [Google Scholar] [CrossRef]
- Abbaspour, K.C.; Rouholahnejad, E.; Vaghefi, S.; Srinivasan, R.; Yang, H.; Kløve, B. A continental-scale hydrology and water quality model for Europe: Calibration and uncertainty of a high-resolution large-scale SWAT model. J. Hydrol. 2015, 524, 733–752. [Google Scholar] [CrossRef] [Green Version]
- Shen, Z.; Hong, Q.; Yu, H.; Liu, R. Parameter uncertainty analysis of the non-point source pollution in the Daning River watershed of the Three Gorges Reservoir Region, China. Sci. Total Environ. 2008, 405, 195–205. [Google Scholar] [CrossRef]
- Wang, Y.; Zhang, W.; Zhao, Y.; Peng, H.; Shi, Y. Modelling water quality and quantity with the influence of inter-basin water diversion projects and cascade reservoirs in the Middle-lower Hanjiang River. J. Hydrol. 2016, 541, 1348–1362. [Google Scholar] [CrossRef]
- The United States Department of Agriculture. USDA-SCS Section 4: Hydrology. In SCS National Engineering Handbook; USDA Soil Conservation Service: Washington, DC, USA, 1972. [Google Scholar]
- Williams, J.R. Sediment Yield Prediction with Universal Equation using Runoff Energy Factor. In Present and Prospective Technology for Predicting Sediment Yield and Sources; US Department of Agriculture, Agriculture Research Service: Washington, DC, USA, 1975. [Google Scholar]
- Shi, Y. Refinement Modelling of the Non-Point Source Pollution in the Three Gorges Reservoir. Ph.D Thesis, Wuhan University, Wuhan, China, 2017. (In Chinese). [Google Scholar]
- Babaei, H.; Nazari-Sharabian, M.; Karakouzian, M.; Ahmad, S. Identification of Critical Source Areas (CSAs) and Evaluation of Best Management Practices (BMPs) in Controlling Eutrophication in the Dez River Basin. Environments 2019, 6, 20. [Google Scholar] [CrossRef] [Green Version]
- Yang, J.; Reichert, P.; Abbaspour, K.C.; Xia, J.; Yang, H. Comparing uncertainty analysis techniques for a SWAT application to the Chaohe Basin in China. J. Hydrol. 2008, 358, 1–23. [Google Scholar] [CrossRef]
- Moriasi, D.N.; Arnold, J.G.; Liew, M.W.; Van Bingner, R.L.; Harmel, R.D.; Veith, T.L. Model Evaluation Guidelines for Systematic Quantification of Accuracy in Watershed Simulations. Trans. ASABE 2007, 50, 885–900. [Google Scholar] [CrossRef]
- Bieger, K.; Hörmann, G.; Fohrer, N. Simulation of streamflow and sediment with the soil and water assessment tool in a data scarce catchment in the three Gorges region, China. J. Environ. Qual. 2014, 43, 37–45. [Google Scholar] [CrossRef]
- Zhao, G.J.; Hörmann, G.; Fohrer, N.; Li, H.P.; Gao, J.F.; Tian, K. Development and application of a nitrogen simulation model in a data scarce catchment in South China. Agric. Water Manag. 2011, 98, 619–631. [Google Scholar] [CrossRef]
- Shen, Z.; Chen, L.; Hong, Q.; Qiu, J.; Xie, H.; Liu, R. Assessment of nitrogen and phosphorus loads and causal factors from different land use and soil types in the Three Gorges Reservoir Area. Sci. Total Environ. 2013, 454–455, 383–392. [Google Scholar] [CrossRef]
- Nazari-Sharabian, M.; Taheriyoun, M.; Karakouzian, M. Surface runoff and pollutant load response to urbanization, climate variability, and low impact developments—A case study. Water Supply 2019, 1–12. [Google Scholar] [CrossRef]
- Neary, D.G.; Ice, G.G.; Jackson, C.R. Linkages between forest soils and water quality and quantity. For. Ecol. Manag. 2009, 258, 2269–2281. [Google Scholar] [CrossRef]
- Fullen, M.A. Effects of grass ley set-aside on runoff, erosion and organic matter levels in sandy soils in east Shropshire, UK. Soil Tillage Res. 1998, 46, 41–49. [Google Scholar] [CrossRef]
- Uri, N.D.; Lewis, J.A. The dynamics of soil erosion in US agriculture. Sci. Total Environ. 1998, 218, 45–58. [Google Scholar] [CrossRef]
- Bakker, M.M.; Govers, G.; Rounsevell, M.D.A. The crop productivity-erosion relationship: An analysis based on experimental work. Catena 2004, 57, 55–76. [Google Scholar] [CrossRef]
- Chen, H.; Zhang, X.; Abla, M.; Lü, D.; Yan, R.; Ren, Q.; Ren, Z.; Yang, Y.; Zhao, W.; Lin, P.; et al. Effects of vegetation and rainfall types on surface runoff and soil erosion on steep slopes on the Loess Plateau, China. Catena 2018, 170, 141–149. [Google Scholar] [CrossRef]
- Jia, H.; Lei, A.; Lei, J.; Ye, M.; Zhao, J. Effects of hydrological processes on nitrogen loss in purple soil. Agric. Water Manag. 2007, 89, 89–97. [Google Scholar] [CrossRef]
- Ma, X.; Li, Y.; Li, B.; Han, W.; Liu, D.; Gan, X. Nitrogen and phosphorus losses by runoff erosion: Field data monitored under natural rainfall in Three Gorges Reservoir Area, China. Catena 2016, 147, 797–808. [Google Scholar] [CrossRef]
- Liu, Y.; Tao, Y.; Wan, K.Y.; Zhang, G.S.; Liu, D.B.; Xiong, G.Y.; Chen, F. Runoff and nutrient losses in citrus orchards on sloping land subjected to different surface mulching practices in the Danjiangkou Reservoir area of China. Agric. Water Manag. 2012, 110, 34–40. [Google Scholar] [CrossRef]
- El Kateb, H.; Zhang, H.; Zhang, P.; Mosandl, R. Soil erosion and surface runoff on different vegetation covers and slope gradients: A field experiment in Southern Shaanxi Province, China. Catena 2013, 105, 1–10. [Google Scholar] [CrossRef]
- Nord, G.; Esteves, M. The effect of soil type, meteorological forcing and slope gradient on the simulation of internal erosion processes at the local scale. Hydrol. Process. 2010, 24, 1766–1780. [Google Scholar] [CrossRef]
- United States Department of Agriculture (USDA). Urban Hydrology for Small Watersheds; Technical; United States Department of Agriculture, Natural Resources Conservation Service, Engineering Division: Washington, DC, USA, 1986.
- Poesen, J. Surface sealing as influenced by slope angle and position of simulated stones in the top layer of loose sediments. Earth Surf. Process. Landforms 1986, 11, 1–10. [Google Scholar] [CrossRef]
- Wang, L.; Liang, T.; Zhang, Q. Laboratory experiments of phosphorus loss with surface runoff during simulated rainfall. Environ. Earth Sci. 2013, 70, 2839–2846. [Google Scholar] [CrossRef]
- Nazari-Sharabian, M.; Ahmad, S.; Karakouzian, M. Climate Change and Eutrophication: A Short Review. Eng. Technol. Appl. Sci. Res. 2018, 8, 3668–3672. [Google Scholar]
- Rejman, J.; Brodowski, R. Rill characteristics and sediment transport as a function of slope length during a storm event on loess soil. Earth Surf. Process. Landforms 2005, 30, 231–239. [Google Scholar] [CrossRef]
Figure 1.
Location of the TGRA with the hydrologic stations (red solid star), water quality monitoring stations (violet solid triangle), meteorological stations (red solid circle), and rain gauges (green solid circle).
Figure 1.
Location of the TGRA with the hydrologic stations (red solid star), water quality monitoring stations (violet solid triangle), meteorological stations (red solid circle), and rain gauges (green solid circle).

Figure 2.
DEM (a), land-use types (b), soil types (c) and tributary basins (d) of the TGRA, in which the letter ‘L’ and ‘R’ denote left bank and right bank of Yangtze River, respectively (d).
Figure 2.
DEM (a), land-use types (b), soil types (c) and tributary basins (d) of the TGRA, in which the letter ‘L’ and ‘R’ denote left bank and right bank of Yangtze River, respectively (d).

Figure 3.
Dotted plots of posterior likelihood for the most sensitive parameters.

Figure 4.
Percentage of land use type in each tributary basin and the whole TGRA.

Figure 5.
Percentage of soil type in each tributary basin and the whole TGRA.

Figure 6.
Variations of the elevation, slope gradient and slope length in each tributary basin and the whole TGRA.
Figure 6.
Variations of the elevation, slope gradient and slope length in each tributary basin and the whole TGRA.

Figure 7.
Spatial distribution of annual average total runoff depth (a), TN (b) and TP (c) in TGRA (2010–2013).
Figure 7.
Spatial distribution of annual average total runoff depth (a), TN (b) and TP (c) in TGRA (2010–2013).


Table 1.
Data format and sources for TGRA.
| Data Category | Resolution | Description | Source |
|---|---|---|---|
| Digital elevation model | 30 × 30 m | Elevation, slope gradient and slope lengths | Geospatial Data Cloud |
| Land-use types | 1:250,000 | Land use classifications | National Earth System Science Data Sharing Infrastructure |
| Soil | 1:500,000 | Physical and chemical properties of soil; soil types | Nanjing Institute of Soil Science (OFNISS), Chinese Academy of Science |
| Weather data | daily | Precipitation, wind speed, daily maximum air temperature, daily minimum air temperature, relative humidity and solar radiation | National Meteorological Information Center; Hydrographic statistical yearbooks |
| Point source pollution data | yearly | Load of total nitrogen, total phosphorus and ammonia nitrogen | Chongqing Academy of Environmental Science |
| Hydrology and water quality data | Daily runoff and monthly water quality indexes | Hydrographical station and water quality monitoring station | |
| Social and economic data | Population, livestock and poultry, fertilizer application | Spot investigation; statistics yearbooks |
Table 2.
The description, sensitivity rankings and ranges of principal parameters in relation to runoff, nitrogen and phosphorus.
Table 2.
The description, sensitivity rankings and ranges of principal parameters in relation to runoff, nitrogen and phosphorus.
| Type | Parameters | Definition | Sensitivity Rank | Calibrated Value |
|---|---|---|---|---|
| runoff | CN2 | Moisture condition II curve number | 1 | 36–92 |
| CH_K2 | Effective hydraulic conductivity, (mm/h) | 2 | 0.1–0.5 | |
| SOL_AWC | Soil’s available moisture content | 3 | 0.14–0.18 | |
| ALPHA_BF | Baseflow alpha factor, (days) | 4 | 0.01–0.048 | |
| ESCO | Soil evaporation compensation factor | 5 | 0.33–0.83 | |
| CH_N2 | Manning’s value for main channel | 6 | 0.014–0.16 | |
| GW_DELAY | Groundwater delay, (days) | 7 | 5–15 | |
| GWQMN | Threshold depth of water in the shallow aquifer required for return flow to occur | 8 | 0–0.014 | |
| REVAPMN | Threshold depth of water in the shallow aquifer for revaporization to occur | 9 | 400–460 | |
| SOL_BD | Soil moisture bulk density, (mm) | 10 | 1.27–1.49 | |
| SOL_K | Soil-saturated infiltration coefficient | 11 | 2.15–37.59 | |
| SURLAG | Surface runoff lag time, (days) | 12 | 3.0–8.2 | |
| nitrogen | RCN | Concentration of nitrogen in rainfall, (mg/kg) | 1 | 0.5–4.0 |
| SOL_ORGN | Initial organic N concentration in the soil layer, (mg/kg) | 2 | 5–10 | |
| SDNCO | Denitrification threshold water content | 3 | 0.5–0.8 | |
| BC1 | Rate constant for biological oxidation of NH3 | 4 | 0.3–0.5 | |
| BC2 | Rate constant for biological oxidation of NO2 to NO3 | 5 | 1.1–1.3 | |
| BC3 | Rate constant for hydrolysis of organic nitrogen to ammonia | 6 | 0.21–0.7 | |
| phosphorus | FILTERW | Width of the edge of field filter strip, (m) | 1 | 3–5 |
| SOL_ORGP | Initial humic organic phosphorus in soil layer, (mg/kg) | 2 | 5–10 | |
| PHOSKD | Phosphorus soil partitioning coefficient | 3 | 101–175 | |
| BC4 | Rate constant for decay of organic phosphorus to dissolved phosphorus | 4 | 0.35–0.80 | |
| PSP | Phosphorus sorption coefficient | 5 | 0.7 | |
| GWSOLP | Concentration of soluble phosphorus in groundwater contributing to streamflow from sub-basin | 6 | 0.01–0.08 | |
| RS5 | Organic phosphorus settling rate in the reach at 20 °C | 7 | 0.05–0.10 |
Table 3.
Model calibration and validation results of TGRA.
| Type | Station Name | Calibration Period | Validation Period | ||
|---|---|---|---|---|---|
| R2 | ENS | R2 | ENS | ||
| Total runoff | Nanyang | 0.63 | 0.50 | 0.61 | 0.50 |
| Wuxi | 0.92 | 0.70 | 0.84 | 0.63 | |
| Wenquan | 0.70 | 0.60 | 0.74 | 0.61 | |
| Tiantangyan | 0.72 | 0.50 | 0.73 | 0.64 | |
| Shibanping | 0.71 | 0.65 | 0.61 | 0.61 | |
| Wucha | 0.56 | 0.52 | 0.53 | 0.52 | |
| Sihai | 0.53 | 0.51 | 0.52 | 0.51 | |
| Changtan | 0.76 | 0.53 | 0.76 | 0.59 | |
| Lianghe | 0.62 | 0.59 | 0.51 | 0.50 | |
| Shizhu | 0.53 | 0.51 | 0.51 | 0.50 | |
| Sediment | Nanyang | 0.78 | 0.74 | 0.71 | 0.56 |
| Wuxi | 0.72 | 0.69 | 0.65 | 0.53 | |
| Wenquan | 0.79 | 0.52 | 0.61 | 0.53 | |
| Wucha | 0.67 | 0.57 | 0.67 | 0.58 | |
| TN | Xiangxi River | 0.96 | 0.84 | 0.84 | 0.80 |
| Pengxi River | 0.85 | 0.60 | 0.83 | 0.61 | |
| Tang River | 0.62 | 0.54 | 0.61 | 0.52 | |
| Yandu River | 0.73 | 0.66 | 0.71 | 0.61 | |
| Sunxi River | 0.66 | 0.54 | 0.63 | 0.50 | |
| Modaoxi River | 0.53 | 0.46 | 0.50 | 0.46 | |
| Quxi River | 0.54 | 0.42 | 0.52 | 0.44 | |
| Long River | 0.57 | 0.53 | 0.55 | 0.47 | |
| TP | Xiangxi River | 0.86 | 0.65 | 0.82 | 0.63 |
| Pengxi River | 0.74 | 0.60 | 0.61 | 0.61 | |
| Tang River | 0.61 | 0.52 | 0.59 | 0.64 | |
| Yandu River | 0.70 | 0.63 | 0.71 | 0.64 | |
| Sunxi River | 0.64 | 0.53 | 0.52 | 0.49 | |
| Modaoxi River | 0.69 | 0.52 | 0.64 | 0.51 | |
| Quxi River | 0.67 | 0.51 | 0.66 | 0.49 | |
| Long River | 0.65 | 0.56 | 0.63 | 0.52 | |
© 2019 by the authors. Licensee MDPI, Basel, Switzerland. This article is an open access article distributed under the terms and conditions of the Creative Commons Attribution (CC BY) license (http://creativecommons.org/licenses/by/4.0/).
Share and Cite
MDPI and ACS Style
Chen, X.; Xu, G.; Zhang, W.; Peng, H.; Xia, H.; Zhang, X.; Ke, Q.; Wan, J. Spatial Variation Pattern Analysis of Hydrologic Processes and Water Quality in Three Gorges Reservoir Area. Water 2019, 11, 2608. https://doi.org/10.3390/w11122608
AMA Style
Chen X, Xu G, Zhang W, Peng H, Xia H, Zhang X, Ke Q, Wan J. Spatial Variation Pattern Analysis of Hydrologic Processes and Water Quality in Three Gorges Reservoir Area. Water. 2019; 11(12):2608. https://doi.org/10.3390/w11122608
Chicago/Turabian StyleChen, Xiaomin, Gaohong Xu, Wanshun Zhang, Hong Peng, Han Xia, Xiao Zhang, Qian Ke, and Jing Wan. 2019. "Spatial Variation Pattern Analysis of Hydrologic Processes and Water Quality in Three Gorges Reservoir Area" Water 11, no. 12: 2608. https://doi.org/10.3390/w11122608
Note that from the first issue of 2016, this journal uses article numbers instead of page numbers. See further details here.