Landslide Susceptibility Based on Extreme Rainfall-Induced Landslide Inventories and the Following Landslide Evolution

Department of Water Resources Engineering and Conservation, Feng Chia University, Taichung 40724, Taiwan
Water 2019, 11(12), 2609; https://doi.org/10.3390/w11122609
Submission received: 15 September 2019
/
Revised: 4 December 2019
/
Accepted: 6 December 2019
/
Published: 11 December 2019
(This article belongs to the Special Issue Soil–Water Conservation, Erosion, and Landslide)
Abstract
:Landslide susceptibility assessment is crucial for mitigating and preventing landslide disasters. Most landslide susceptibility studies have focused on creating landslide susceptibility models for specific rainfall or earthquake events, but landslide susceptibility in the years after specific events are also valuable for further discussion, especially after extreme rainfall events. This research provides a new method to draw an annual landslide susceptibility map in the 5 years after Typhoon Morakot (2009) in the Chishan River watershed in Taiwan. This research establishes four landslide susceptibility models by using four methods and 12 landslide-related factors and selects the model with the optimum performance. This research analyzes landslide evolution in the 5 years after Typhoon Morakot and estimates the average landslide area different ratio (LAD) in upstream, midstream, and downstream of the Chishan River watershed. We combine landslide susceptibility with the model with the highest performance and average annual LAD to draw an annual landslide susceptibility map, and its mean correct ratio ranges from 62.5% to 73.8%.
1. Introduction
Deaths and economic losses due to natural disasters have drastically increased in Taiwan over the past two decades, especially after the 1999 Chichi earthquake [1]. In Taiwan, landslides and debris flows are the major causes of serious rainfall-induced disasters. The death toll due to Typhoon Morokot in 2009 was around 703, and the death toil due to the associated landslides and debris flow disasters was over 500, including 465 deaths caused by the Xiaolin deep landslide [2]. The number and intensity of the heavy rainfall events are expected to increase in the future in Taiwan [3], and the occurrences of landslides and debris flows over the next decade are expected to increase. Therefore, the assessment of landslide susceptibility is an important consideration for disaster prevention or mitigation in Taiwan.
Landslide susceptibility assessment models can be created based on heuristic, deterministic, and statistical approaches. Among these approaches, statistical methods are the most popular because of the development of geographic information systems and remote sensing techniques. The processes involved in evaluating landslide susceptibility by establishing a susceptibility model using statistical approaches include selecting landslide-related factors, creating a database, acquiring the most suitable fitting equations from the statistical model for landslide occurrence, and calibrating or validating models. The prediction accuracy of most statistical landslide susceptibility models can exceed 70% [4,5,6,7]. Technological statistical methods for predicting landslide susceptibility have improved to involve artificial neural networks [8], machine learning [9,10], empirical methods based on big data [11,12], and artificial intelligence [13]; the prediction accuracy of landslide susceptibility models using these technologies range from 80% to 90%.
Several rainfall events with a return period of more than 100 years have occurred in Taiwan, particularly in the Central and Southwestern regions, over the past two decades. Extreme rainfall events in Taiwan typically occur when daily rainfall >800.0 mm (such as that in Southern Taiwan during Typhoon Morakot in 2009 and Northern Taiwan during Typhoon Soudelor in 2015) or hourly rainfall intensity >80.0 mm/h (such as that in Northeastern Taiwan during Typhoon Megi in 2010). Extreme rainfall events also result in serious disasters. The accumulated rainfall and rainfall intensity during Typhoon Morakot in Southern Taiwan is representative of extreme rainfall events. The 48- and 72-h accumulated rainfall at most rainfall stations during Typhoon Morakot in Southwestern Taiwan exceeded the accumulated rainfall record of the 200-year return period [2], and the average rainfall intensity from 12:00 a.m. to 8:00 p.m. on 8 August 2009 in the midstream of the Chishan River watershed was more than 80.0 mm/h. Some studies have started to emphasize the seriousness of extreme rainfall-induced landslide or debris flow [8,9] or have created landslide susceptibility models for regions with high annual and daily rainfall [10] because of the increasing occurrence frequency of extreme rainfall events. Rainfall is widely used as a factor for building landslide susceptibility models, but the pattern and extent of rainfall should be emphasized [14,15]. Therefore, the assessment of landslide susceptibility is a crucial consideration for disaster prevention and mitigation in Taiwan [16].
The novelty of this research includes the applicability of landslide susceptibility models using statistical modeling in areas with dense landslide distribution and the process of drawing annual landslide susceptibility maps in the years after extreme rainfall events. The landslides induced by Typhoon Morakot in the Chishan River watershed were densely distributed, and the landslide types mainly included debris falls, translational landslides, riverbank landslides, and large-scale landslides. Areas with dense landslide distributions induced by an extreme rainfall event are uncommon globally, and discussing the performance of landslide susceptibility maps using statistical models in dense landslide distribution areas is valuable. Another novelty in this research is that a large amount of sediment was deposited downhill or transported into the river after numerous landslides occurred in the area. The large amount of sediment deposited randomly in the river resulted in sinuous rivers and subsequent riverbank landslides. Landslide susceptibility in some specific areas in the years after extreme rainfall events did not decrease; they instead increased, because riverbank landslides increased substantially. Numerous articles have focused on predicting landslide susceptibility for specific rainfall or earthquake events, and this research suggests that annual landslide susceptibility maps after specific rainfall or earthquake events should be emphasized as well.
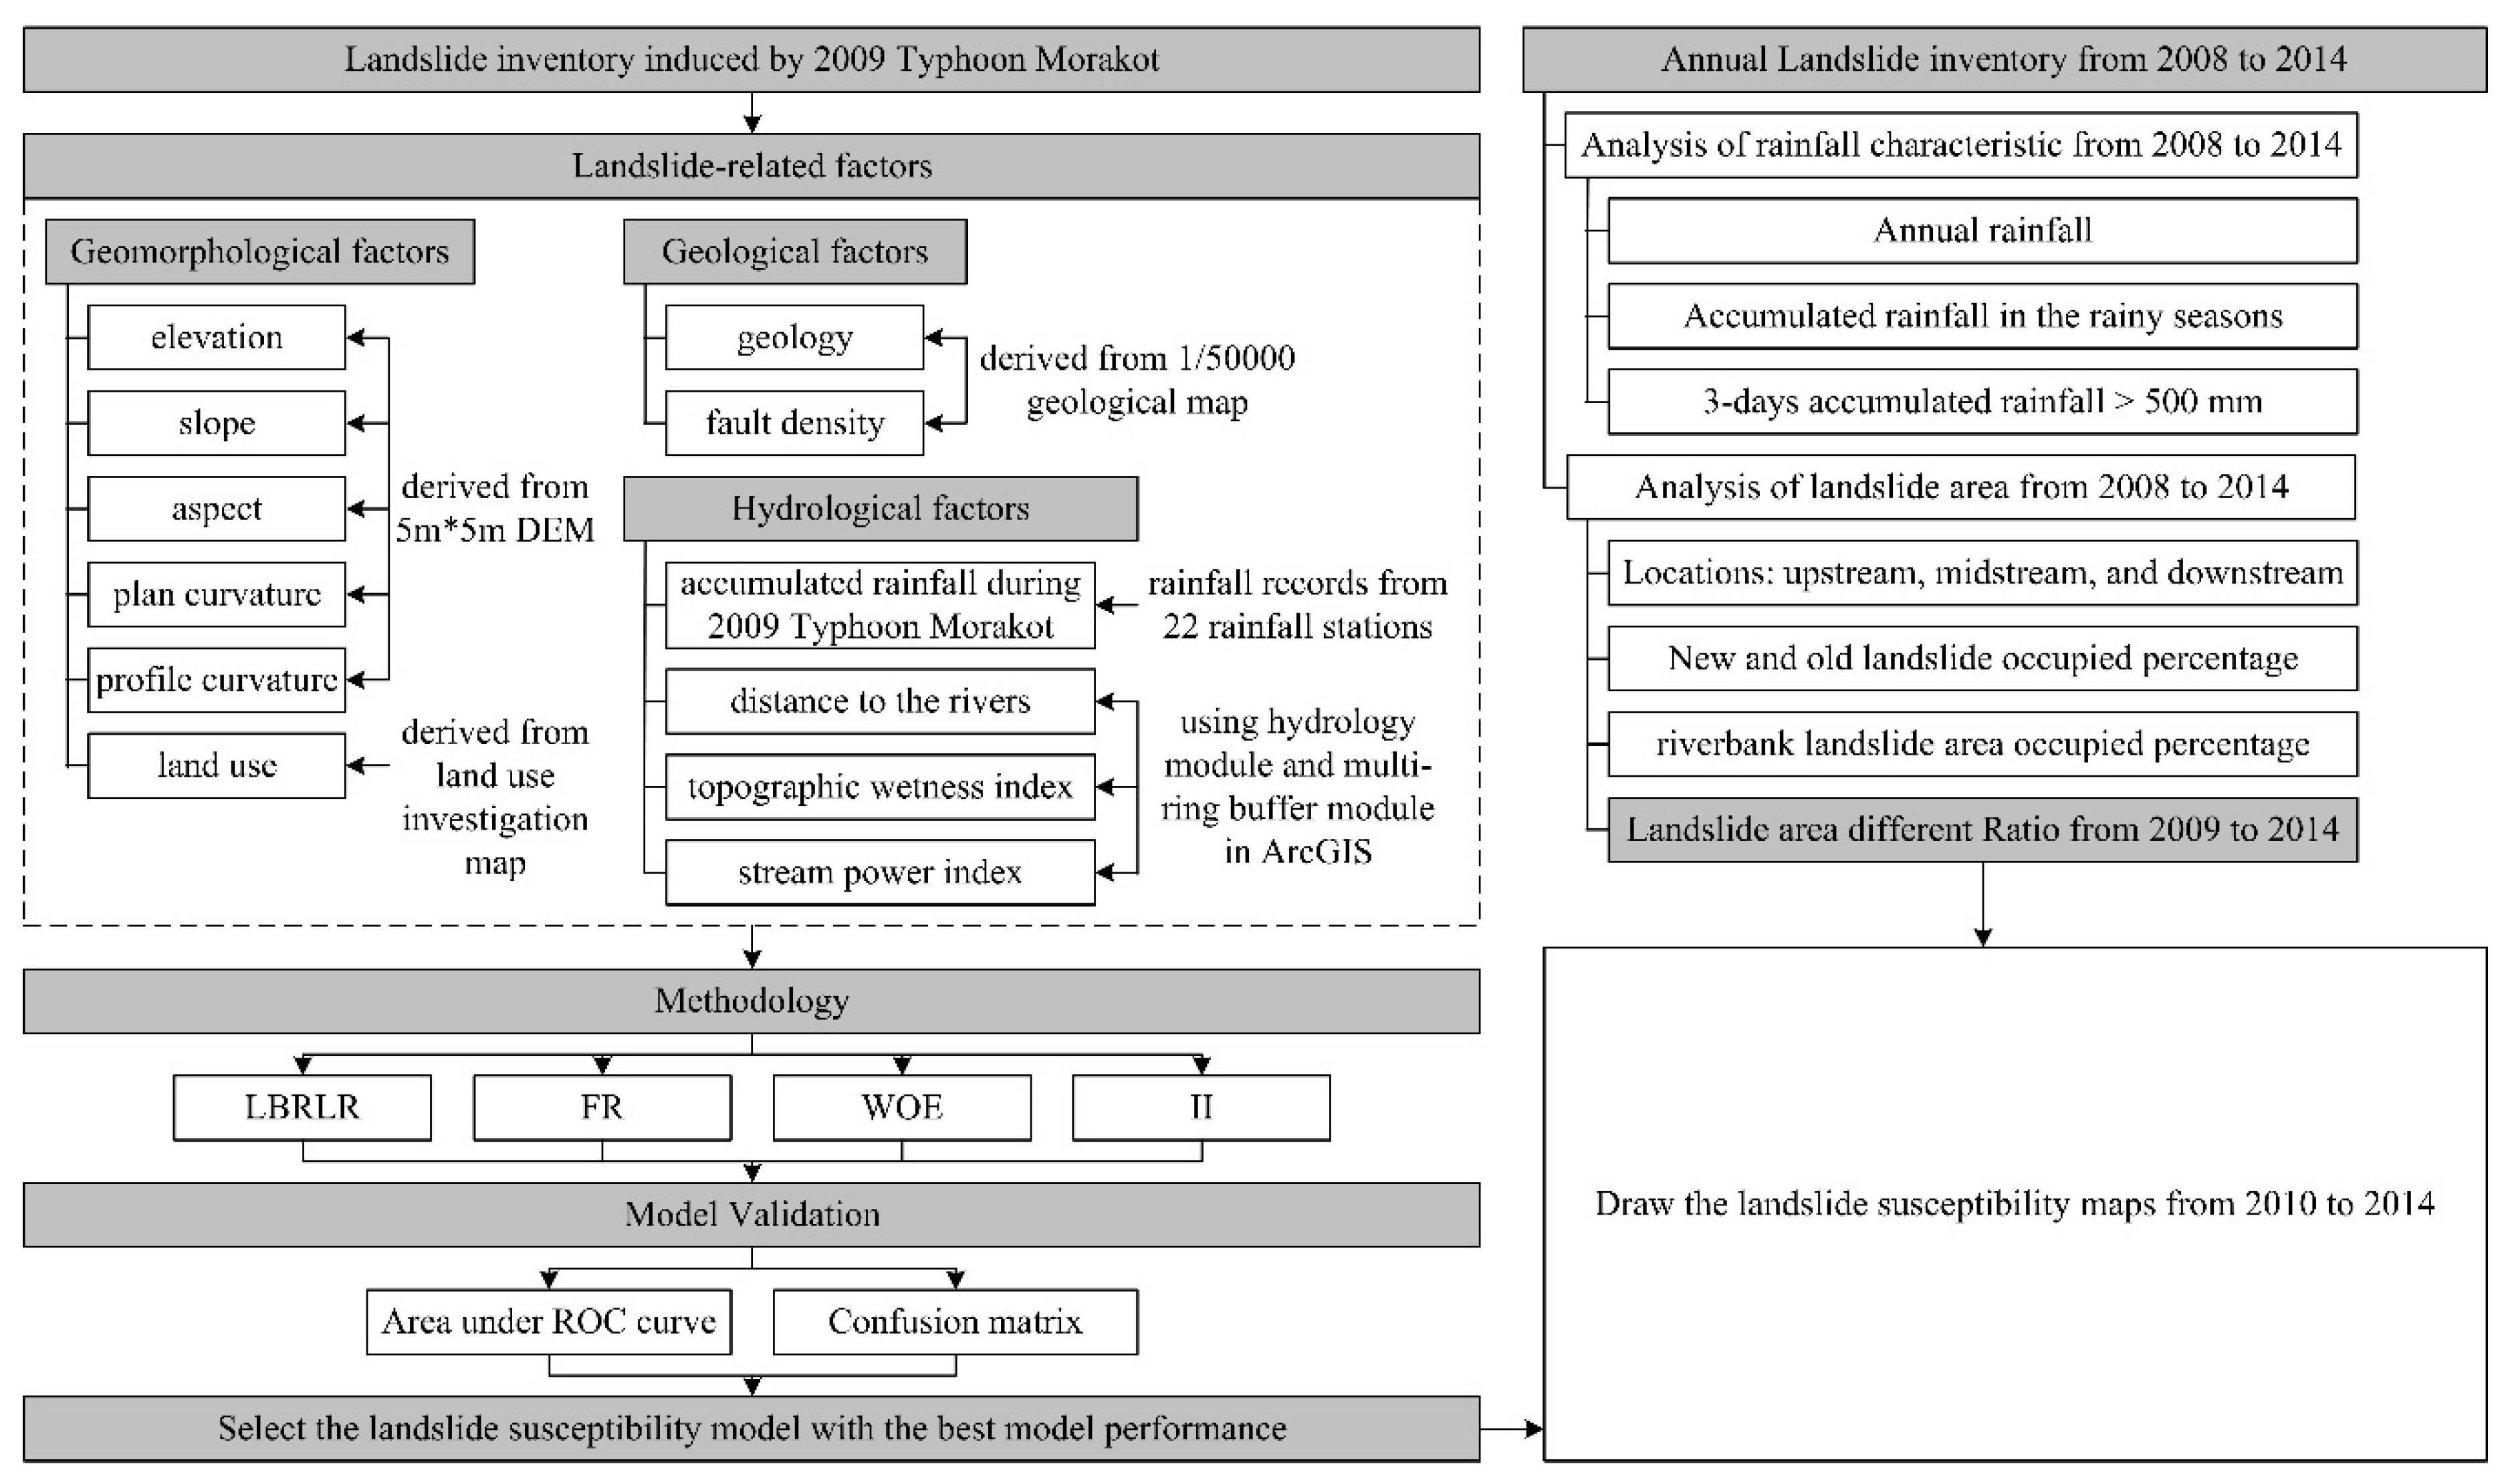
This research compares and analyzes the applicability of landslide susceptibility assessment models based on four methods by using the extreme rainfall-induced landslide inventory and suggests a process of drawing landslide susceptibility maps in the years after extreme rainfall events. The four methods used in the study include landslide ratio-based logistic regression (LRBLR) [17], frequency ratio (FR), weights of evidence (WOE), and instability index (II) [18]. The landslide susceptibility model is combined with 12 factors. The validation of the landslide susceptibility model in this research adopts the area under receiver operating curves and confusion matrix methods. The research selected the landslide susceptibility model with the best performance of the four as the basis for drawing landslide susceptibility maps after Typhoon Morakot. Furthermore, this study analyzes the long-term landslide evolution from 2008 to 2014 in the Chishan River watershed. The landslide evolution analysis from 2008 to 2009 identifies geomorphic characteristics of extreme rainfall-induced landslide-prone locations, whereas the analysis from 2009 to 2014 analyzes the difference in landslide count and area induced by Typhoon Morakot from 2010 to 2014 to understand the long-term evolution of landslides in the Chishan River watershed. Finally, the study draws annual landslide susceptibility maps from 2010 to 2014 by combining the extreme rainfall-induced landslide susceptibility model and the statistical data from landslide evolution from 2010 to 2014 in the Chishan River watershed. Figure 1 presents the flowchart of this research.
2. Materials and Methods
2.1. Research Area and Extreme Rainfall Event
2.1.1. Research Area: Chishan River Watershed in Southwestern Taiwan
The Chishan river watershed (Figure 2) is a tributary watershed of Kaoping river watershed in Southwestern Taiwan. Kaoping river watershed ranks 11th in terms of suspended load in the world [19,20]. The mean sediment yield (5.9 kg/m2/year) and physical denudation rate (655.8 g/m2/year) of the Kaoping watershed are 1.96 and 4.37 times larger than that of mountainous rivers throughout the world [21,22]. The high suspended sediment quantity show that Kaoping river watershed is a soil erosion-, landslide-, and debris flow-prone watershed due to the fragile geology, steep terrain, and heavy rainfall.
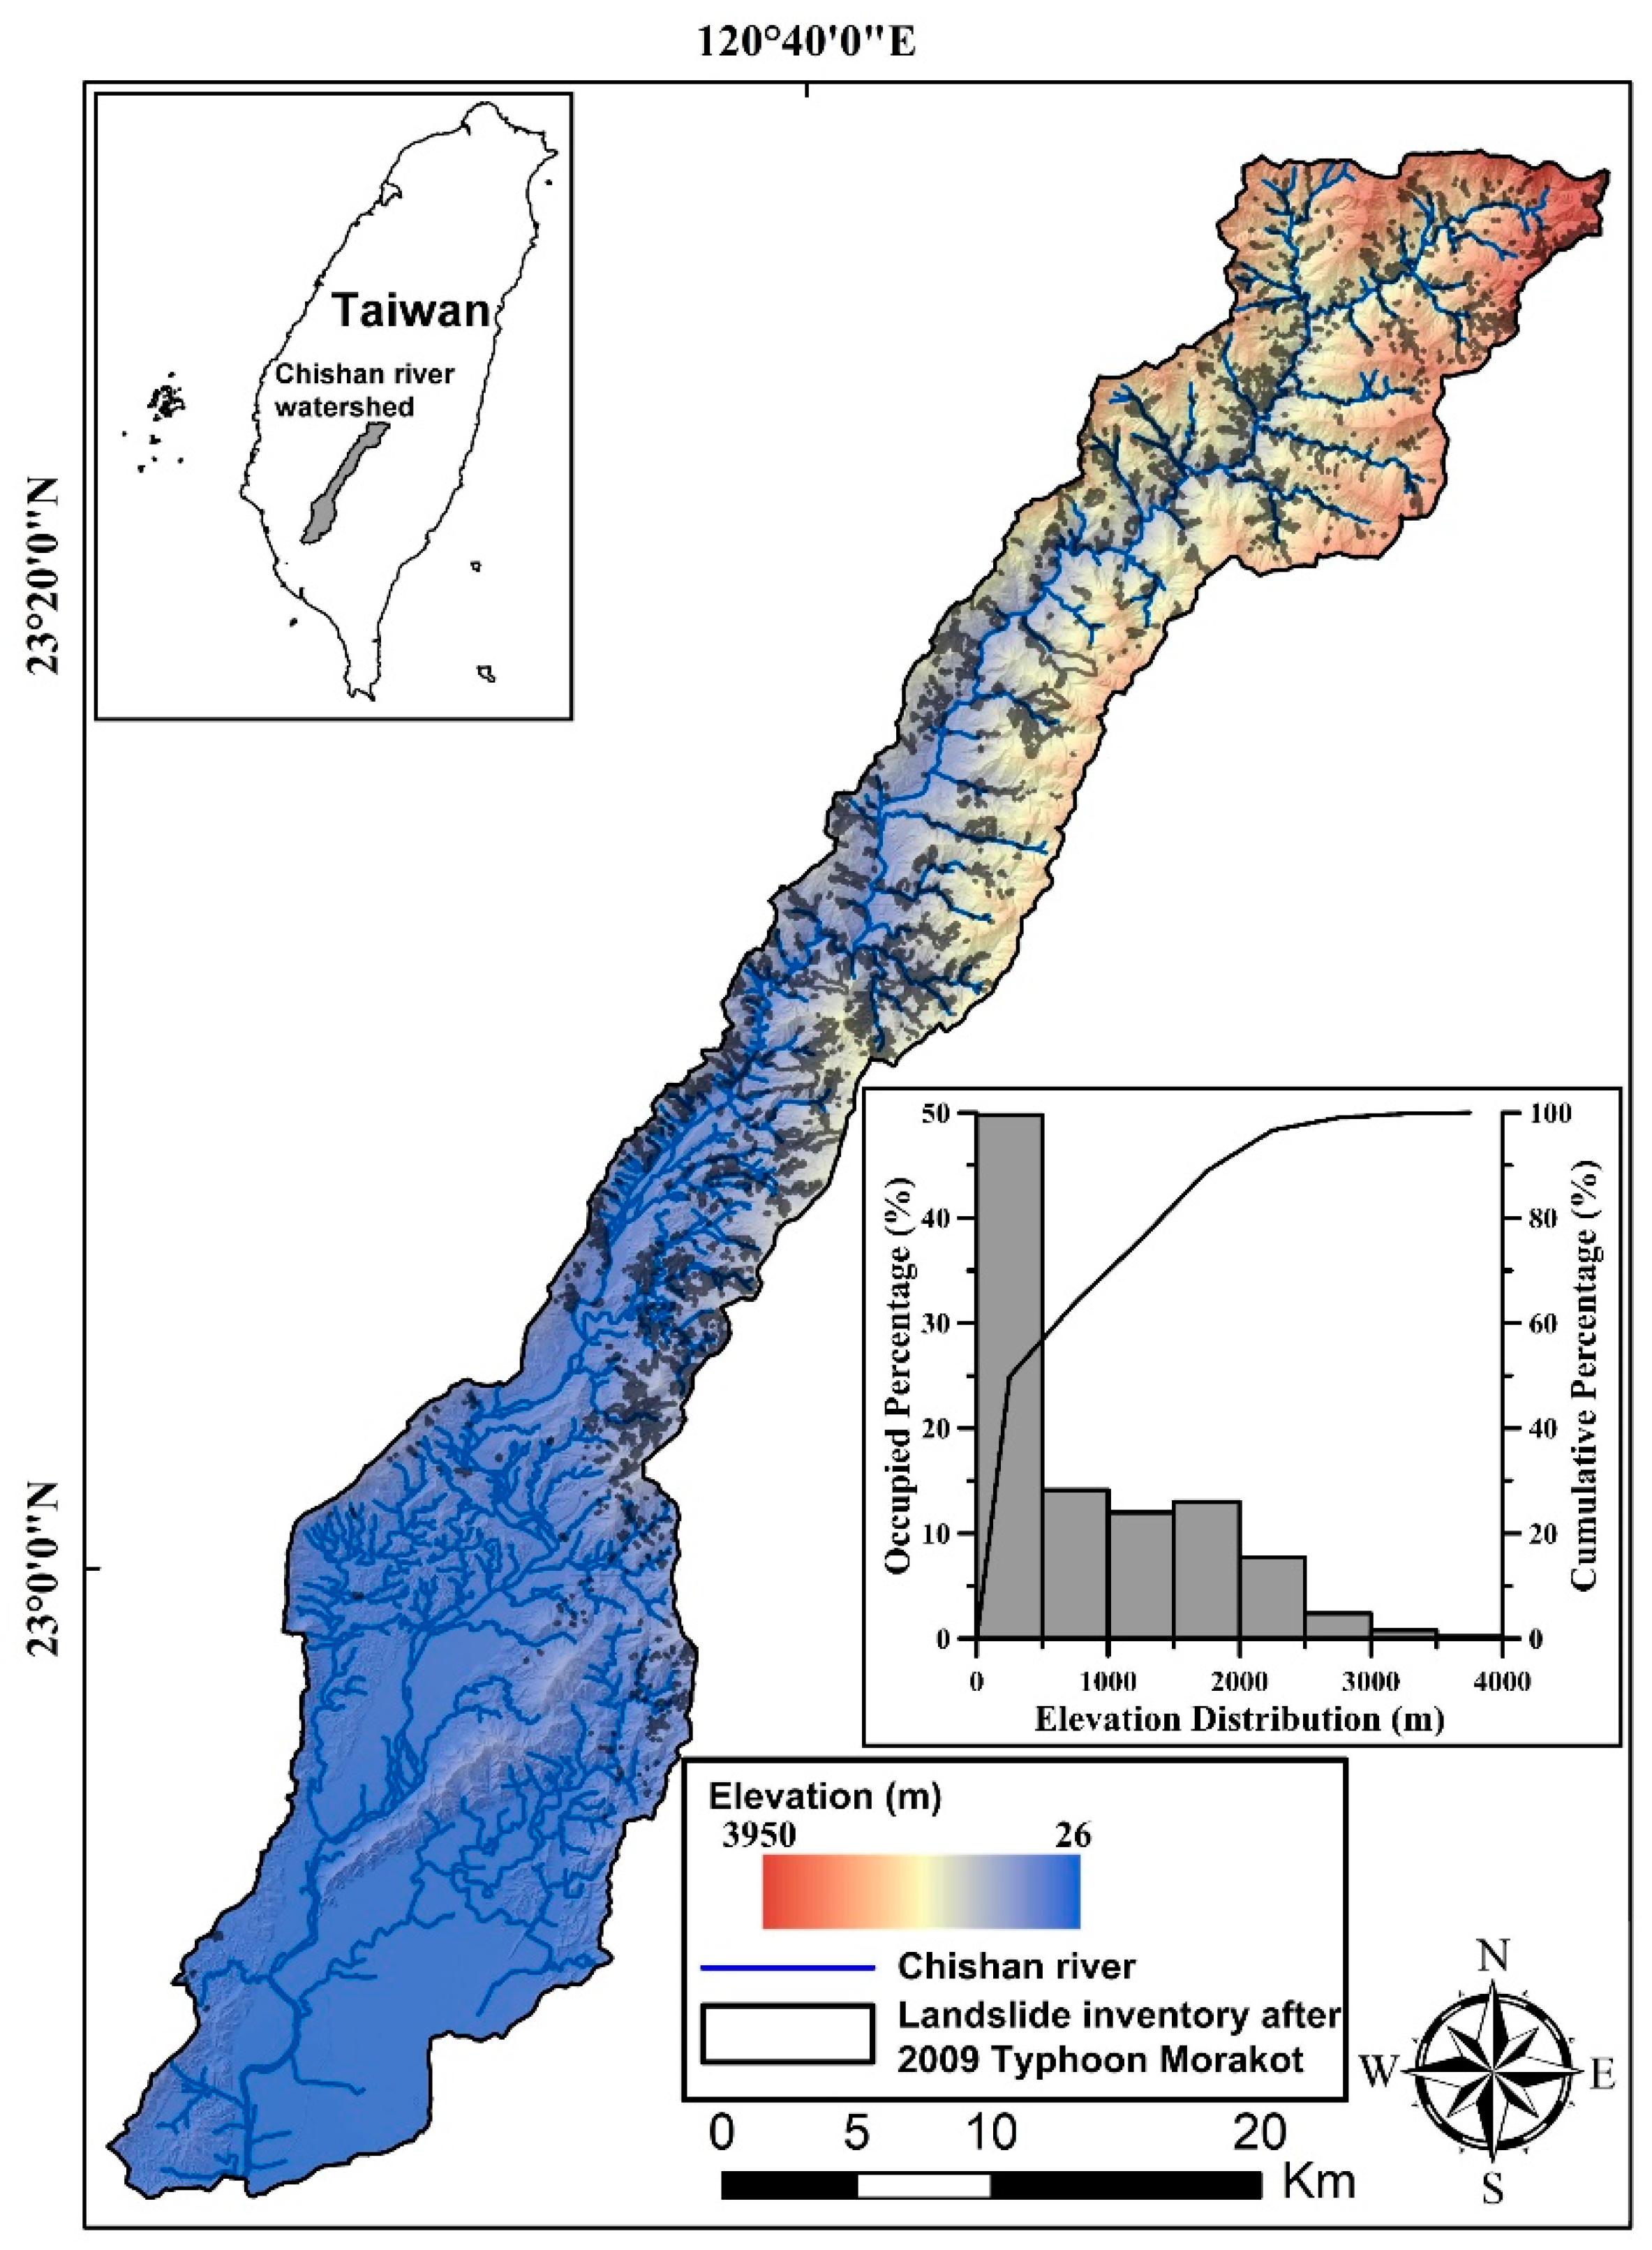
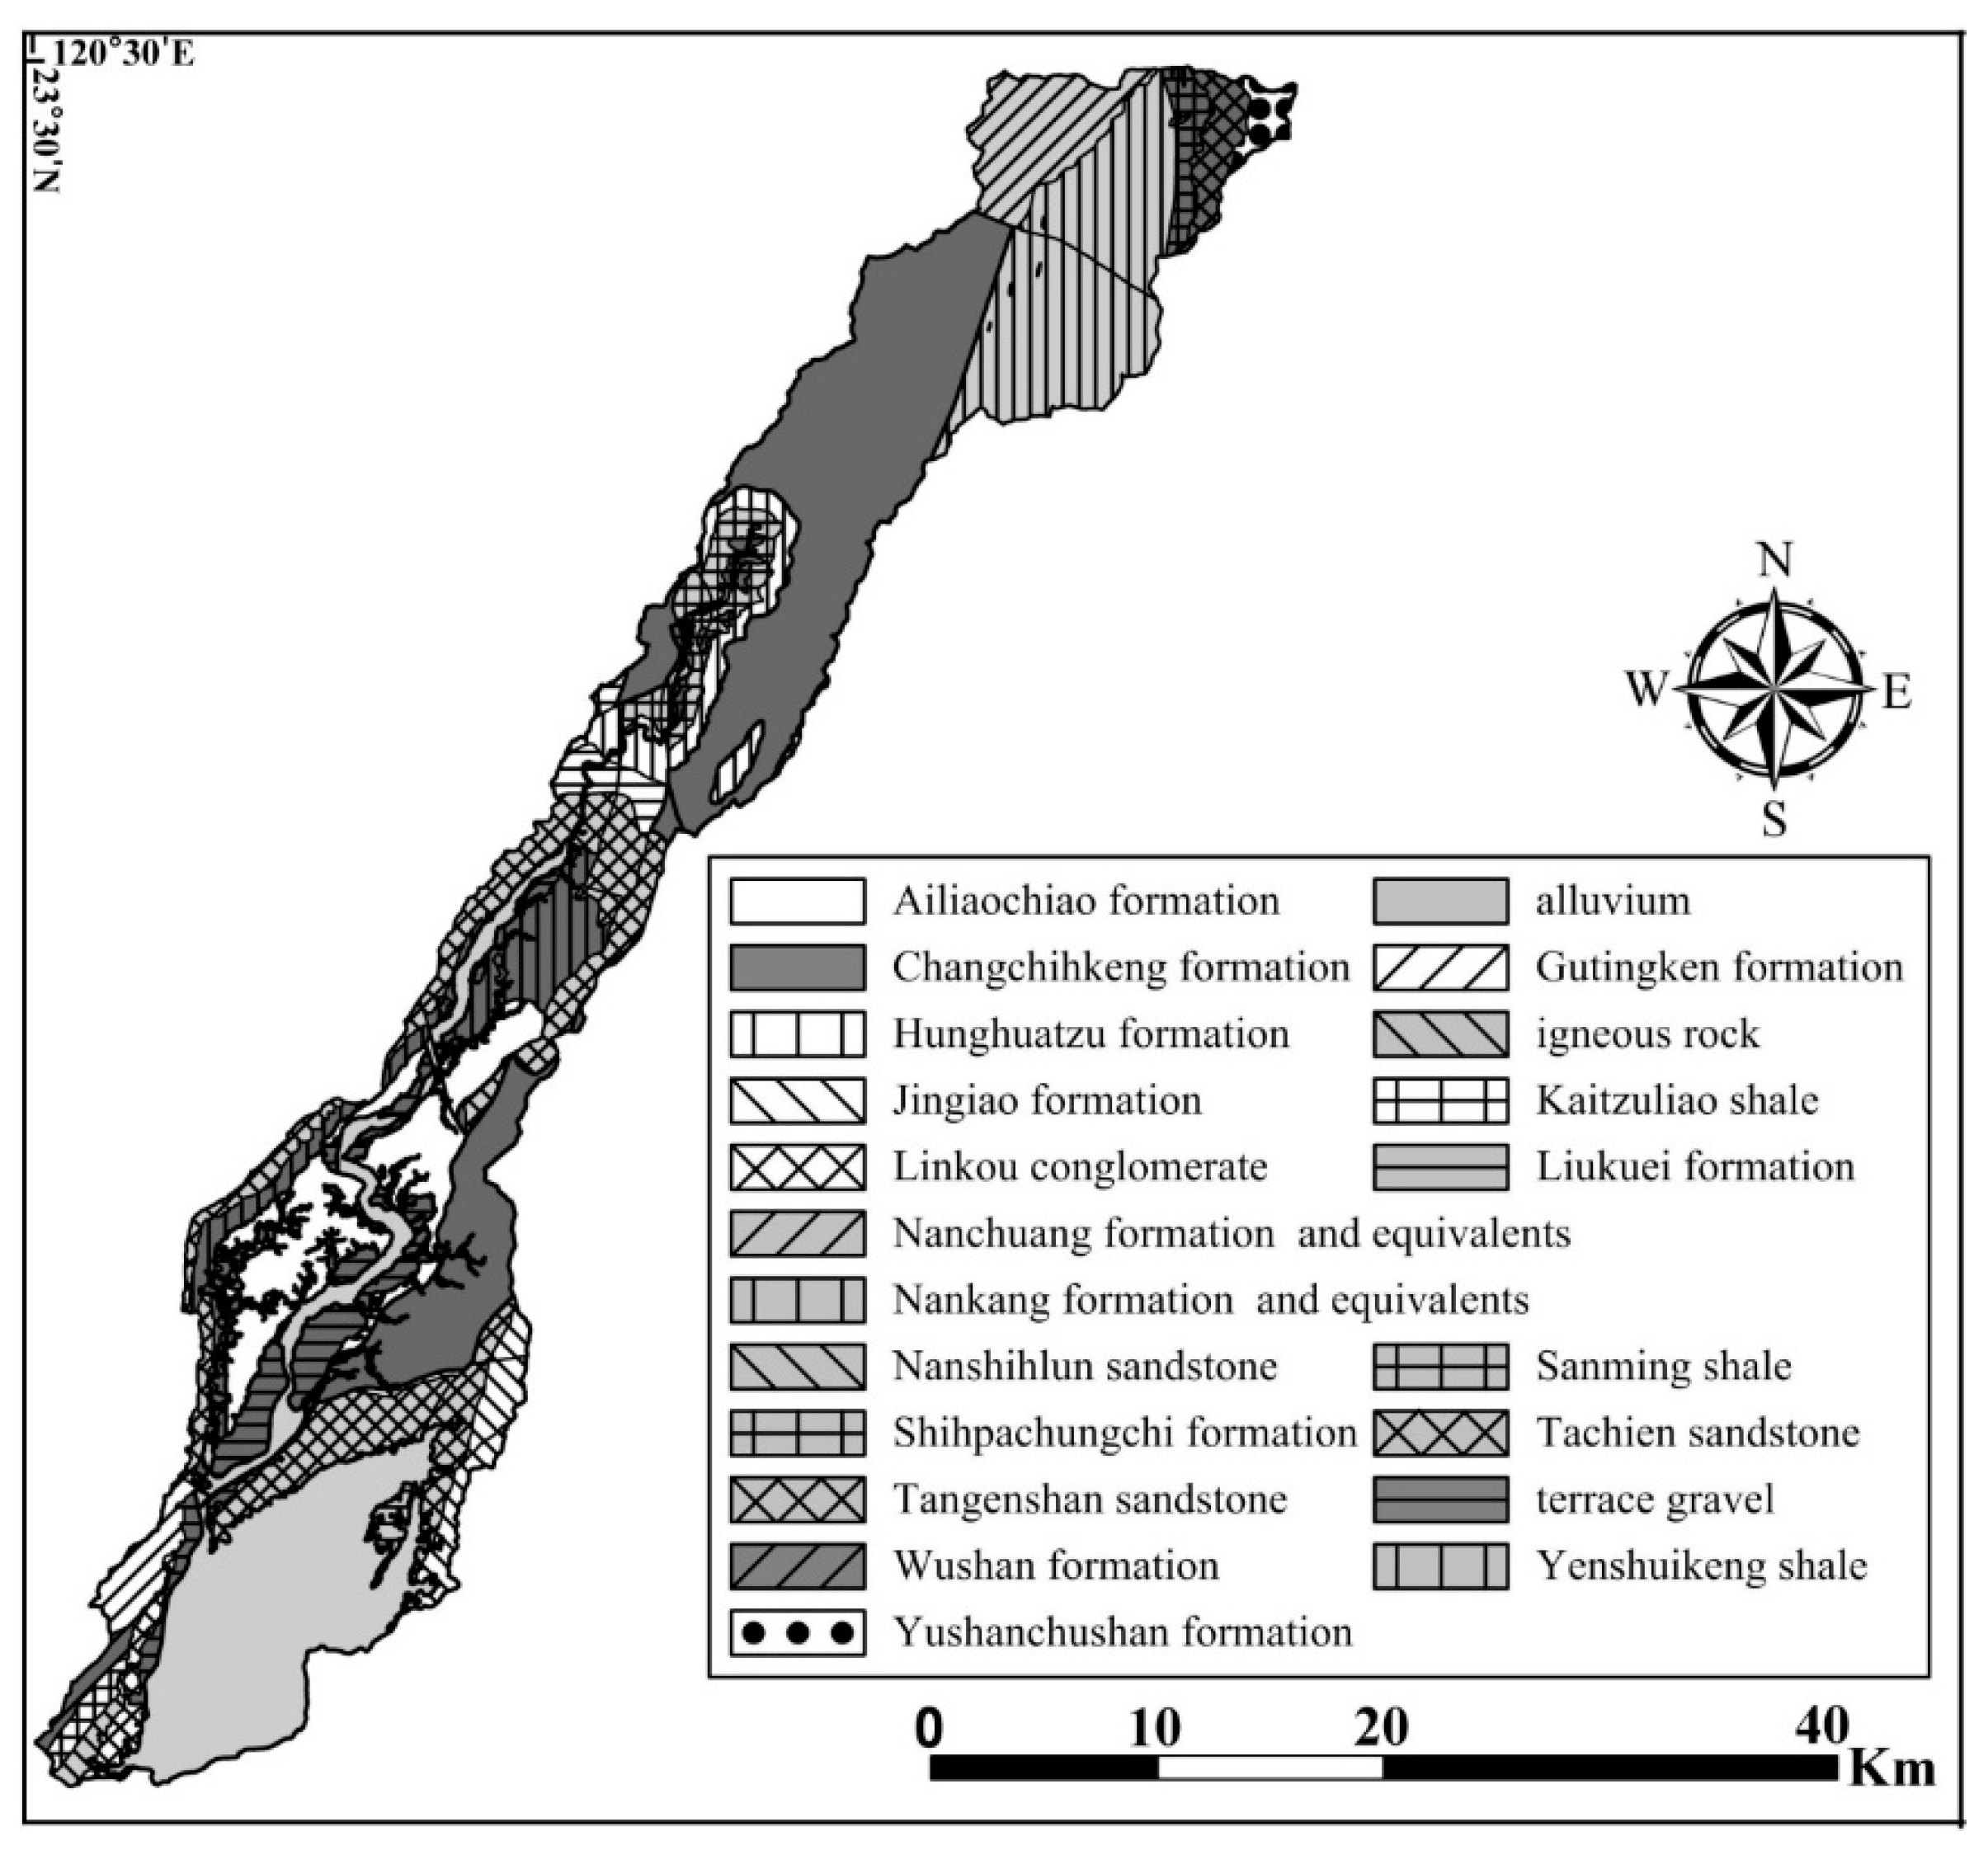
The area of the Chishan river watershed is around 819 km2 with the mean elevation and slope of 838 m (Figure 2) and 22.4° (Table 1). The average annual precipitation is 4468 mm. The mean precipitation in the rainy season, i.e., from May to October, occupies 83% to 89% of the mean annual precipitation, and that in the dry seasons, from November to April, only occupies 11% to 17%. The land use in the research area consists of forest (65.0%), agriculture (23.2%), development (4.2%), river (2.7%), and bare land (5.0%) based on the land use investigation maps produced in 2008 by National Land Surveying and Mapping Center in Taiwan. The main strata (Figure 3 and Table 2) in the research area includes the Miocene Changchihkeng formation (26.2% of the watershed), the Holocene alluvium (17.8% of the watershed), middle Miocene Nankang formation and equivalents (10.8% of the watershed), and the Miocene Tangenshan sandstone (10.5% of the watershed) based on the 1/5000 basin geological map in Taiwan [23].
2.1.2. Extreme Rainfall Event: 2009 Typhoon Morakot
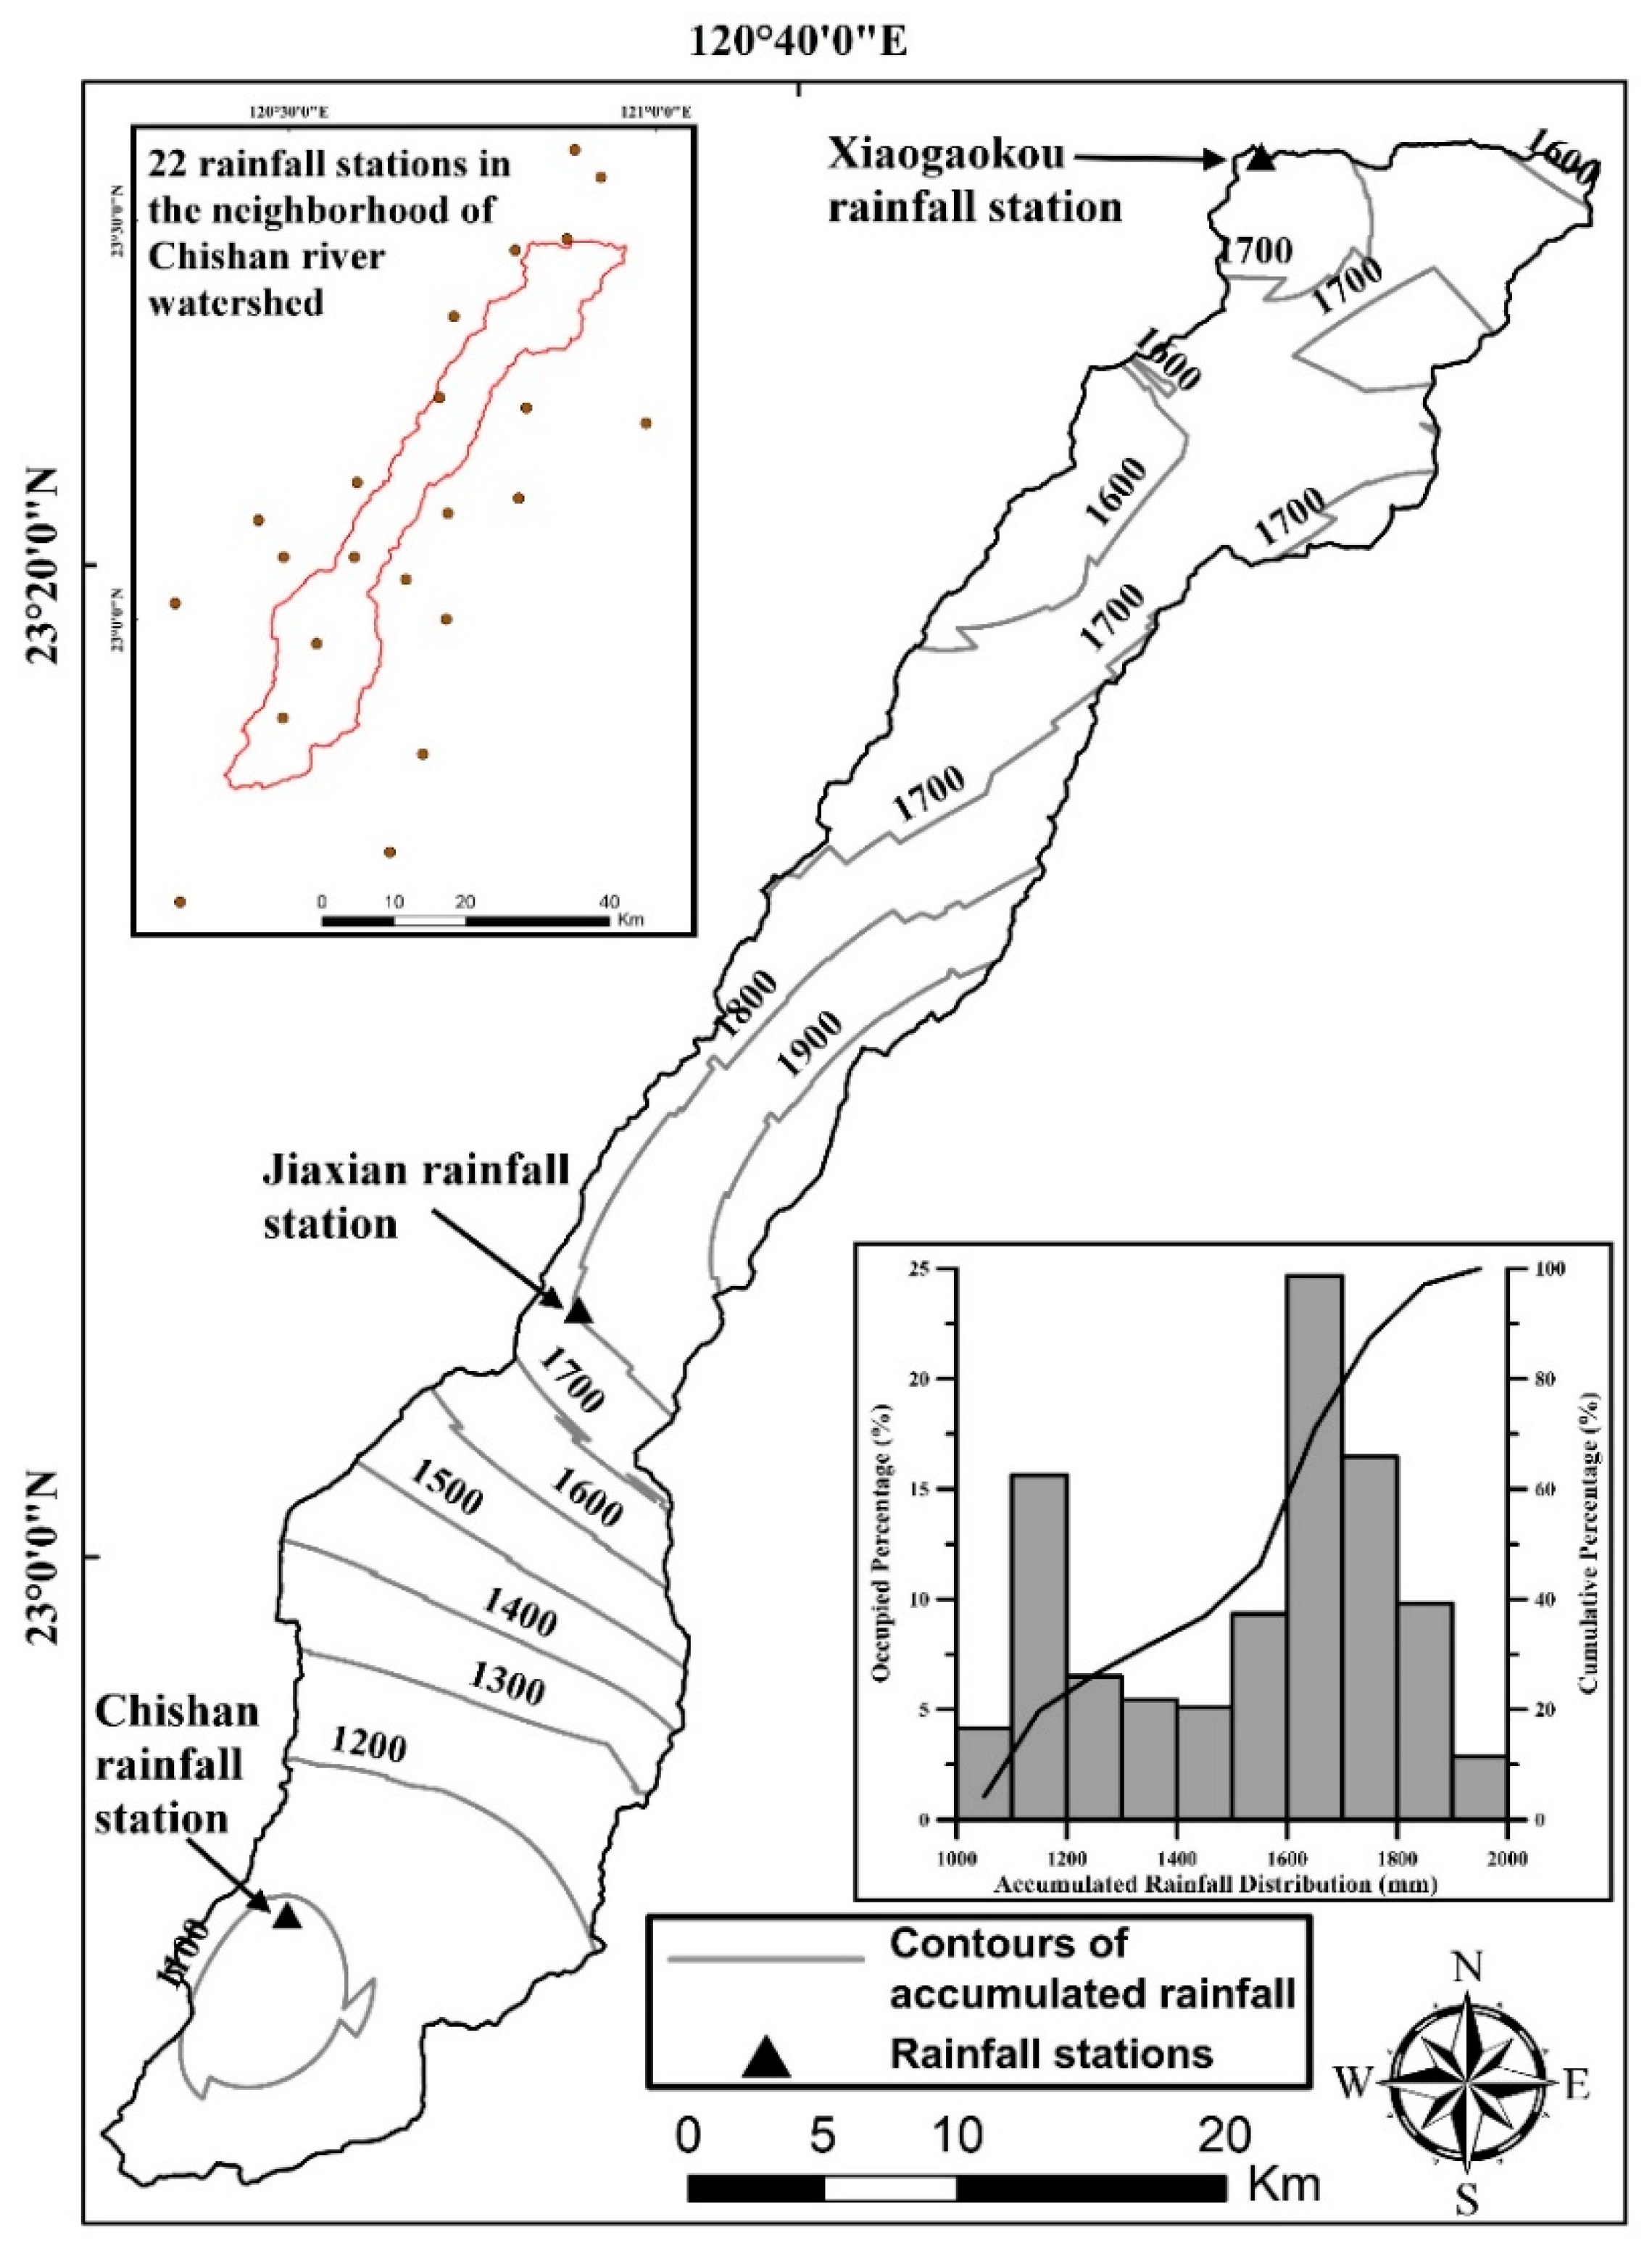
Typhoon Morakot struck Southern Taiwan between 6 and 10 August 2009. The rainfall distribution in the Chishan river watershed based on the rainfall records from 22 rainfall stations is shown in Figure 4. The rainfall ranges from 1083 to 1990 mm with an average of 1528.0 mm. The 24-h, 48-h, and 72-h accumulated rainfall exceeded the 200-year return-period accumulated rainfall [2]. The accumulated rainfall during the most intense rainfall period, i.e., 1 pm to 12 pm on 8 August 2009, was 577.0 mm to 786.5 mm, equal to a mean rainfall intensity of 48.1 mm/h to 65.5 mm/h in this period. The 2389 landslide cases (Figure 2) induced by 2009 Typhoon Morakot in the Chishan river watershed were extracted from high resolution SPOT 5 images [24,25]. The area of each identified landslide polygons ranges from 264 m2 to 3.5 km2. The total landslide area in the Chishan river watershed is around 33.5 km2 with the landslide ratio (LR) of 4.1%.
2.2. Research Methodology for Landslide Susceptibility Mapping and Long-Term Landslide Evolution
2.2.1. Landslide-Related Factors
Based on the literature [18] and data availability, this research selects a total of 12 factors as the basis for establishing the landslide susceptibility model and can be classified into geomorphological, geological, and hydrological. Geomorphological factors include elevation, slope, aspect, land use, plan curvature, and profile curvature. The elevation (Figure 2), slope, aspect, plan curvature, and profile curvature factors are derived from a 5-m digital elevation model (DEM), whereas the land use factor adopts the land use investigation map in Taiwan, which was produced in 2008 by the National Land Surveying and Mapping Center. Because the Chishan River watershed is an erosion- and landslide-prone watershed, we adopt plan and profile curvature factors to describe divergence and convergence of water flow and runoff and infiltration mechanisms.
Geological factors include geology and fault density, and this study adopts a 1/50,000 geological map of the Chishan River watershed [23] to draw the geological setting map and estimate fault density. Geological formations in the Chishan River watershed are fragile and landslide-prone, and six fault lineaments pass through the Chishan River watershed, particularly in midstream. Hydrological factors include the accumulated rainfall during Typhoon Morakot, proximity to the rivers, topographic wetness index (TWI), and stream power index (SPI). This research uses the accumulated rainfall during Typhoon Morakot (from 20:30 on 5 August to 05:30 on 10 August 2009) to describe the influence of heavy rainfall on landslides. Rainfall records from 22 rainfall stations within or near the Chishan River watershed were collected to draw the distribution of accumulated rainfall in the watershed (Figure 3). Furthermore, headward erosion- and bank erosion-induced landslide cases occupy a considerable portion of the landslide inventory. The area within 300 m of the rivers occupies approximately 43.9% of the Chishan River watershed area, but the landslide area within 300 m of the rivers after Typhoon Morakot occupies approximately 52.8% of the total landslide area. This research adopts the hydrology module in ArcGIS to draw the river distribution and estimate the TWI and SPI. The TWI is defined as the natural logarithm ratio of the local upslope area drainage per contour length to the local slope angle and describes the water saturation in the surface soil layer. The SPI is defined as the product of the natural logarithm of both slope and flow accumulation. The SPI describes the erosion strength of river flow and is suitable for determining riverbank landslide locations.
2.2.2. Landslide Susceptibility Methodology: Landslide Ratio-Based Logistic Regression Method (LRBLR)
The purpose of logistic regression analysis is to find the best fitting equation (Equation (1)) to describe the dependent variable (landslide or not landslide, Y in Equation (1)) and the independent parameters (landslide-related factors, Xn in Equation (1)):
where is a constant and n is the nth regression coefficient. The landslide susceptibility P can be written as Equation (2). Wu [17] suggested that the performance of landslide susceptibility model using the logistic regression method with the LR index is better than that using the original logistic regression method. Landslide ratio (LR) refers to the ratio of the landslide area in a specific area to that in the total watershed area. This research follows the suggestions from Wu [17] and reclassifies the categories of all variables according to LR. The number of landslide ratio classifications (LRC number) in a specific category is marked as 1, 2, 3, 4, 5, 6, 7, 8, 9, 10, and 11 as the LR in a specific category is <1.0%, 1.0–2.0%, 2.0–3.0%, 3.0–4.0%, 4.0–5.0%, 5.0–6.0%, 6.0–7.0%, 7.0–8.0%, 8.0–9.0%, 9.0–10.0%, and >10.0%, respectively. All variables in the LRBLR analysis are categorical variables.
The total grid count in the Chishan river watershed is approximately 3.17 × 10⁷ grids, including 3.14 × 10⁷ non-landslide grids and 1,356,104 landslide grids. The non-landslide grid count is approximately 23.2 times greater than the landslide grid count. In this study, all grid counts were attempted to be placed into the statistical software for logistic regression analysis, which was difficult to be analyzed in the statistical software, and the result was dominated by the non-landslide grid. This research was based on the study conducted by Yesilnacar and Topcal [26], who performed a random sampling analysis. Twenty random sampling datasets were picked, and each dataset included 1,356,104 and 1,356,104 landslide and non-landslide grids, respectively. The 20 random sampling datasets were analyzed using the SPSS software to obtain the Cox-Snell R2 value and Nagelkerke R2 value. Only when the Cox-Snell R2 and Nagelkerke R2 values from the logistic regression analysis were greater than 0.15, the dataset was considered as useful and valid [26] in the research. In this research, datasets with the highest Cox-Snell R2 and Nagelkerke R2 values were picked from 20 random sampling datasets, and coefficients from logistic regression were used to develop the landslide susceptibility model.
2.2.3. Landslide Susceptibility Methodology: Frequency Ratio Method (FR)
Lee and Talib [27] suggested that landslide susceptibility should be directly proportional to LR in a specific area, i.e., the landslide susceptibility in an area with a dense landslide distribution should be high. Frequency ratio value (FR) can be a useful index when establishing a landslide susceptibility map. The FR value can be calculated as the ratio of the occupied percentage of landslide area in specific category in specific landslide-related factor to the occupied percentage of area in specific category in specific landslide-related factor. The FR value in each category of each factor is estimated in Table 3. The FR value in each category of every landslide-related factor can be calculated, and the sum of FRs can be used as the landslide susceptibility index (LSI, Equation (3)). FRn represents the frequency ratio value of the nth landslide-related factor. If the FR value in a specific category of the specific landslide-related factor >1, this means the landslide in the specific category of the specific landslide-related factor has a high correlation to the landslide distribution, while a value of <1 indicates a lower correlation.
2.2.4. Landslide Susceptibility Methodology: Weight of Evidence Method (WOE)
The WOE method was proposed by Bonham-Carter (1994) [28], and the assessment equations in WOE method can be written as Equations (4)–(6) [5]:
where A1 (A3) is the landslide area (not-landslide) in a specific category of specific landslide-related factor and A2 (A4) is the total landslide (not-landslide) area not in the specific category of specific landslide-related factor. The W+ (W−) value represents the landslide-induced positive (negative) weight of the specific category in the landslide-related factor. The weights contrast value (C) is the difference between W+ and W− and represents the spatial association between the specific category in the landslide-related factor and landslide occurrence [5]. The landslide susceptibility in a specific grid can be calculated as the summation of C values in each landslide-related factor.
2.2.5. Landslide Susceptibility Methodology: Instability Index Method (II)
The instability index (II) method was proposed by Jian [29] to assess the slope stability. The calculation process for assessing the landslide susceptibility using the II method can be divided into two parts: the normalized grades (D) of each category in each landslide-related factor and the weighting value (We) of each landslide-related factor. The D and We values can be written as Equations (7) and (8) [30]:
where Xi can be calculated as the ratio of LR in the ith category to the total LR in all categories in a specific landslide-related factor, while Xmin (Xmax) represents the minimum (maximum) ratio value in all categories of the landslide-related factor. in Equation (9) is the coefficient of variation of the values in all categories for the nth landslide-related factor. The D value is a normalization value to show the landslide-induced influence of a specific category in all categories.
2.2.6. Validation and Similarity of Landslide Susceptibility Models
The area under the receiver operating characteristic curve (AUC) and the confusion matrix are the two methods to assess the model performance of landslide susceptibility models in this research. The receiver operating characteristic curve is obtained by plotting the sensitivity value on the vertical axis and the 1-specificity value on the horizontal axis, and the AUC value is adopted as an index to assess the model performance. The model performance can be considered as failed, poor, fair, good, and excellent with AUC values (the area under the receiver operating characteristic curve) ranges of 0.5–0.6, 0.6–0.7, 0.7–0.8, 0.8–0.9, and 0.9–1.0, respectively.
This research uses the confusion matrix [18] concept to set four indexes. The PLCR (PLWR) is the ratio of the predicted-landslide area within (not within) the range of landslide inventory to the total landslide area, and the PNLCR (PNLWR) is the ratio of the predicted-non-landslide area outside (not outside) the range of landslide inventory to the total non-landslide area. The mean correct ratio (MCR) is the mean of PLCR and PNLCR, while the mean wrong ratio (MWR) is the mean of PLWR and PNLWR.
This research adopts the correlation analysis to assess the similarities of four landslide susceptibility models. The similarities between the two models is very weak, weak, moderate, strong, and very strong when the correlation coefficient from the correlation analysis is 0.0–0.2, 0.2–0.4, 0.4–0.7, 0.7–0.9, and 0.9–1.0, respectively.
2.2.7. Long-Term Landslide Evolution Analyses
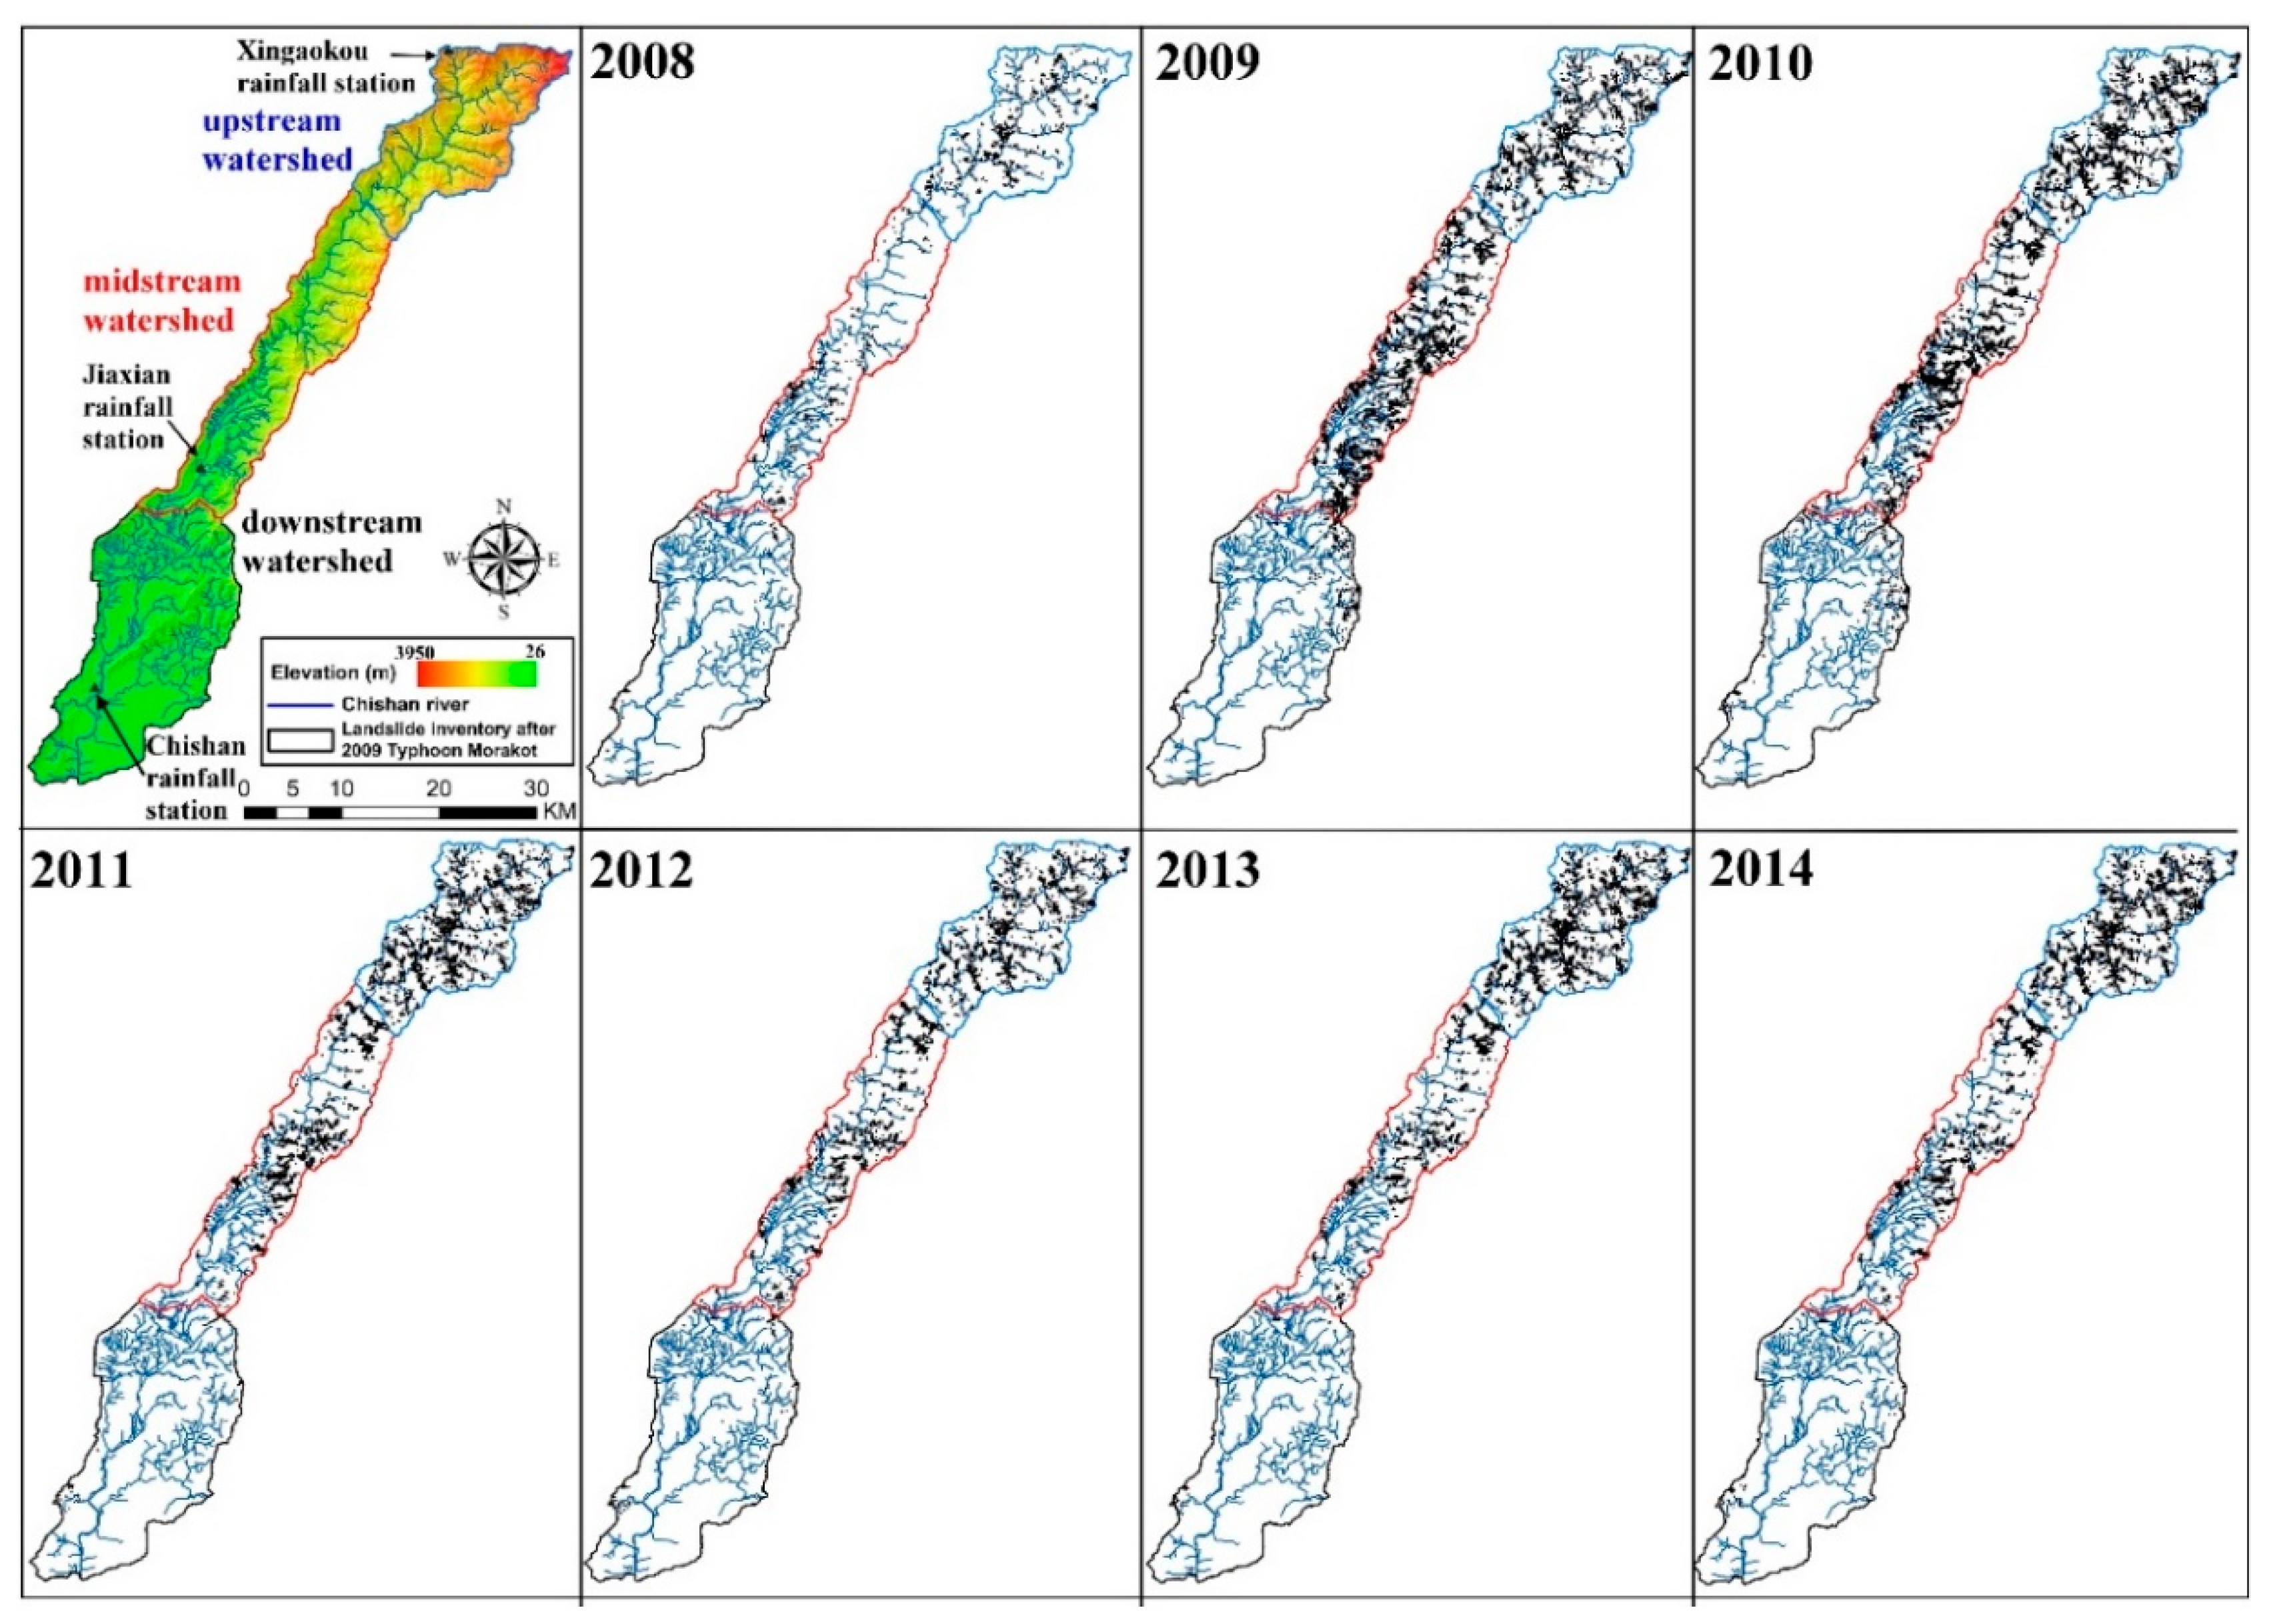
The analysis of long-term landslide evolution includes the analysis of long-term rainfall records and the difference analysis of the annual landslide distribution from 2008 to 2014 in the Chishan river watershed. We collect the rainfall record in the Chishan river watershed from 2008 to 2014 to analyze the long-term rainfall distribution. The Chishan river watershed can be classified into three sun-watersheds, including upstream, midstream, and downstream watersheds (Figure 3). This research selects a representative rainfall station in each watershed, including the Xingaokou station in the upstream watershed, the Jiaxian station in the midstream watershed, and the Chishan station in the downstream watershed (Figure 3), based on the rainfall station location and rainfall record data availability. The research estimates the annual rainfall, the accumulated rainfall in the rainy seasons, i.e., from May to October, and also estimates the counts of the accumulated rainfall of three days in a row over 500 mm to understand the inducing strength from heavy rainfall in a specific year.
The long-term landslide evolution analyses in this research means that we adopt the annual landslide inventories from 2008 to 2014, and analyze the difference of annual landslide distribution and expanding or contracting of the total landslide area in every year. The annual landslide inventory used in this research was produced by the Forestry Bureau in Taiwan and the landslide inventory was identified from the Formosat-2 images with the spatial resolution of 2 m shot during January to July every year.
The landslide distribution of the Chishan river watershed after 2009 Typhoon Morakot was strongly related to the landslide location and proximity to the river [27]. In this study, the landslide distribution of the upstream, midstream, and downstream of the Chishan river watershed in 2008 to 2014 was analyzed. The areas of the upstream, midstream, and downstream river watershed were 210.0, 250.3, and 357.9 km2, respectively. Furthermore, areas within 300 m of the rivers were defined as riverbank areas and areas 300 m outside the rivers were identified as non-riverbank areas. A landslide located on the riverbank area was recognized as a riverbank landslide and a landslide that was not located on the riverbank area was recognized as a non-riverbank landslide.
In this study, the count and area of the landslide and the new and old landslide ratio of each year of the Chishan river watershed were estimated. A new landslide grid refers to when a landslide was identified this year, but was not identified as a landslide in the previous year, whereas the old landslide grid refers to when a landslide was identified both in this year and the previous year. The new and old landslide ratio is the ratio of the sum of the new and old landslide area to the total landslide area in a specific year. The purpose of the new or old landslide comparison from two annual landslide inventories from 2008 to 2009 is different to that from 2009 to 2014. In this study, the definition of new or old landslide from 2008 to 2009 is according to the aforementioned definition but that from 2009 to 2014 is the comparison of the landslide inventory in 2009 and the following year. For example, the old landslide ratio of 62.9% in 2014 suggests that 62.9% of the landslide grid in 2014 was also identified as a landslide grid in 2009.
3. Results
3.1. Extreme Rainfall-Induced Landslide Characteristics
The extreme rainfall-induced landslide characteristics in the Chishan river watershed can be explained based on the statistical data in Table 3. If we consider the LR of >5.0% as an obvious landslide-prone area, the top three obvious landslide-prone areas in all categories of 12 landslide-related factors are the bare land category in land use factor (LR = 22.8%), the area with fault density >20 × 10−3 m/km2 category in fault density factor (LR = 16.0%), and the Yushanchushan formation (Yn) category in geology factor (LR = 13.1%). The three factors with the largest variance of LR are the land use factor (154.71), accumulated rainfall factor (112.18), and the geology factor (108.52), while those with the smallest variance of LR are the profile curvature factor (17.80), the proximity to the river factor (19.06), and the plan curvature (32.05). The geological setting and rainfall distribution are key factors for landslide distribution in the Chishan river watershed. The area of the strata with the LR > 5.0 occupies 42.6% of the total area in the Chishan river watershed, but the landslide area in the same area occupies 75.0% of the total landside area. Lithology in the categories with the LR > 5.0 in the geology factor is all about sandstone, shale, siltstone, and slate. The total area with accumulated rainfall >1400 mm during the 2009 Typhoon Morakot occupies 68.2% of the watershed area, while the landslide area with accumulated rainfall >1400 mm occupies 99.4% of the total landslide area in the watershed.
3.2. Landslide Susceptibility Models Usinf Four Methods
The landslide susceptibility mapping is followed by using four methods, and the research selects the landslide susceptibility model with the best performance from four models for the following research. In the process of establishing the landslide susceptibility model using the LRBLR method, every category in each landslide-related factor is marked a LRC number based on LR (Table 3). The highest mean LRC number is 9.4 in the fault density factor, while the highest variation of LRC number is 94.5% in the land use factor. The research picks 20 random sampling datasets for the logistic regression analyses and selects the result for the random sampling dataset with the largest Cox & Snell R2 value and Nagelkerke R2 value. Only if the two indexes, including Cox & Snell R2 value and Nagelkerke R2 value, from the logistic regression analysis result using the random sampling datasets are greater than 0.15, the dataset is useful and valid [7] in the research. This research picks the dataset with the highest Cox & Snell R2 value (0.346) and Nagelkerke R2 value (0.461) from 20 random sampling datasets, and uses the coefficients resulted from the logistic regression for developing the landslide susceptibility model. The coefficient of each landslide-related factor from logistic regression analysis is listed in Table 4.
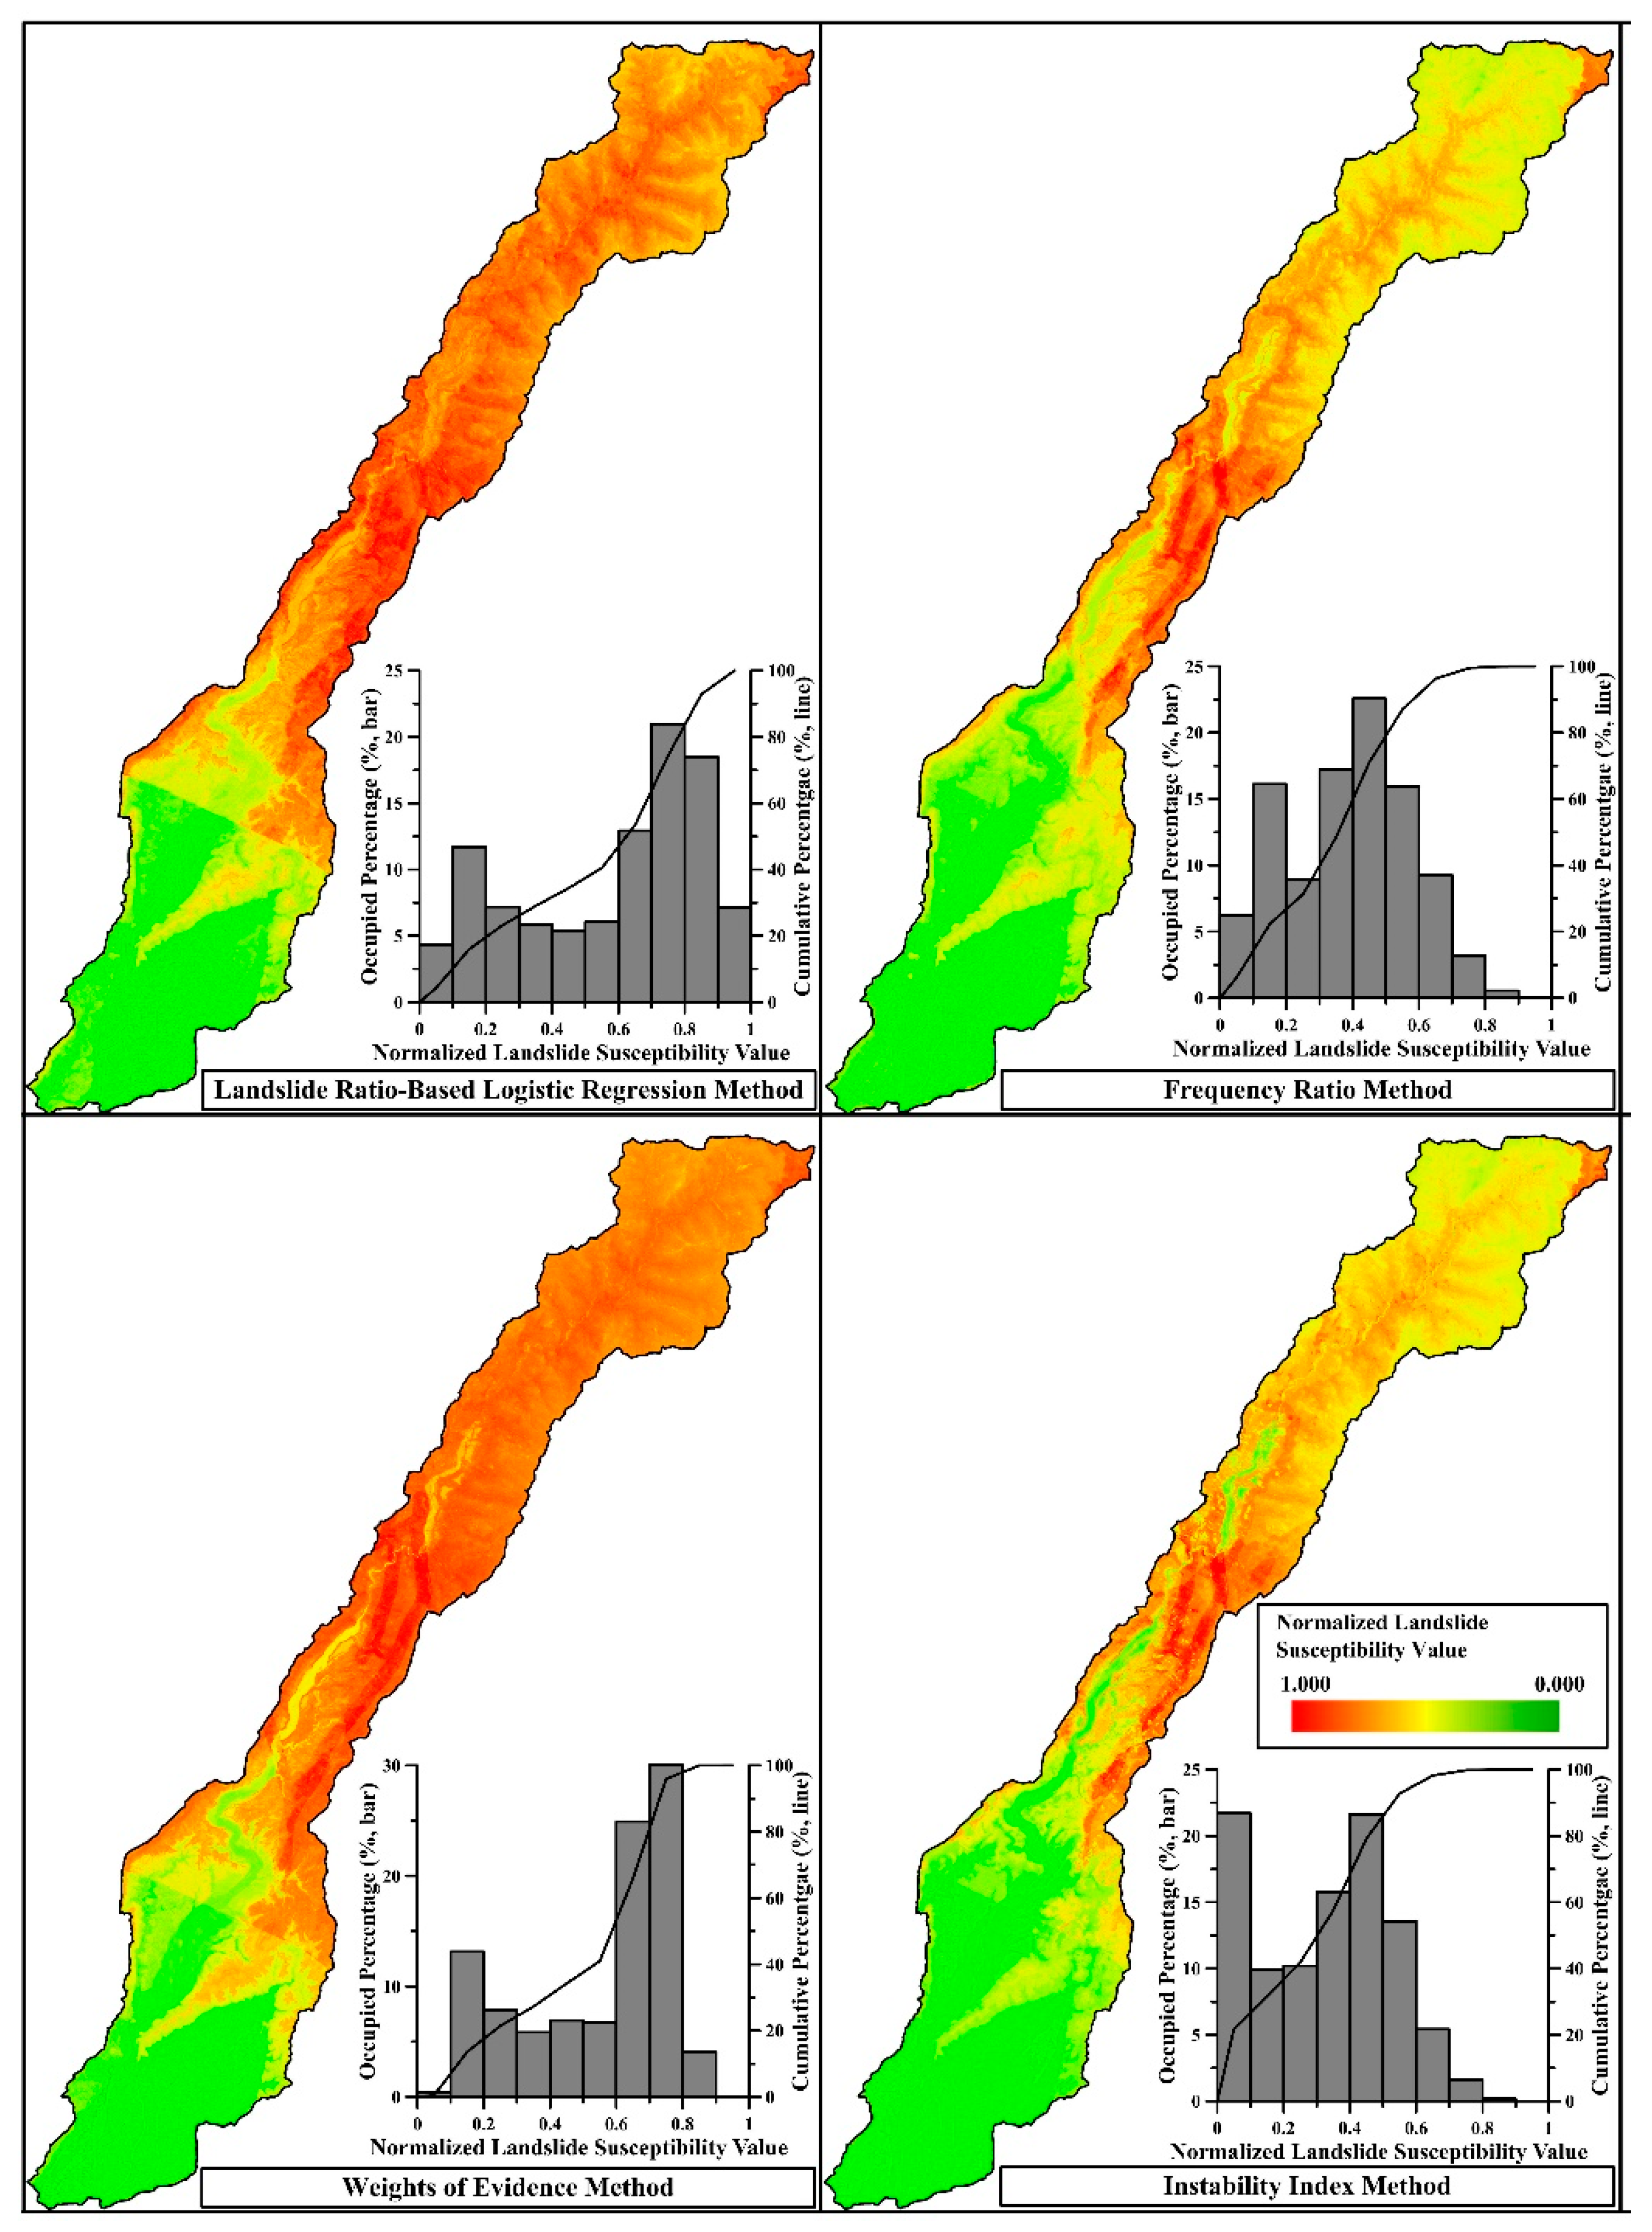
The FR and C values in the process of establishing the landslide susceptibility map using FR and WOE methods are listed in Table 3, while the D and W values using II method are also listed in Table 3 and Table 5. The landslide susceptibility maps using four methods are shown in Figure 5. The mean landslide susceptibility, standard deviation and variance of landslide susceptibility values using the LRBLR method are 0.533%, 0.280%, and 52.5%, while those using the FR method are 0.387%, 0.185%, and 47.8%. The mean landslide susceptibility, standard deviation and variance of landslide susceptibility values by the WOE method are 0.549%, 0.222%, and 40.4%, while those using the II method are 0.325%, 0.199%, and 61.2%. The accumulated percentages from 0 to 0.5 of landslide susceptibility using FR and II methods are 71.1% and 79.2%, while those from 0.5 to 1.0 of landslide susceptibility using LRBLR and WOE methods are 65.6% and 65.8%.
The performance of landslide susceptibility models based on four methods is considered from good to fair [28], because the AUC value of each method is LRBLR (0.803) > WOE (0.789) > FR (0.762) > II (0.721). The confusion matrix of four landslide susceptibility models is shown in Table 6. This research only explains the PLCR, PNLCR, and MCR data of landslide susceptibility models using four methods, because the summation of MCR and MWR is 1.0. The PLCR value of the landslide susceptibility model is 96.2% for LRBLR, 75.3% for FR, 92.3% for WOE, and 62.7% for II, while the PNLCR is 45.6% for LRBLR, 60.3% for FR, 46.3% for WOE, and 62.2% for II. The MCR of landslide susceptibility model is 70.9% for LRBLR, 67.8% for FR, 69.3% for WOE, and 64.0% for II. Based on the performance of landslide susceptibility models, including the AUC and MCR values, this research considers that the landslide susceptibility model using the LRBLR method is the most suitable model in four landslide susceptibility models in the Chishan river watershed.
3.3. Rainfall Records from 2008 to 2014 in the Chishan River Watershed
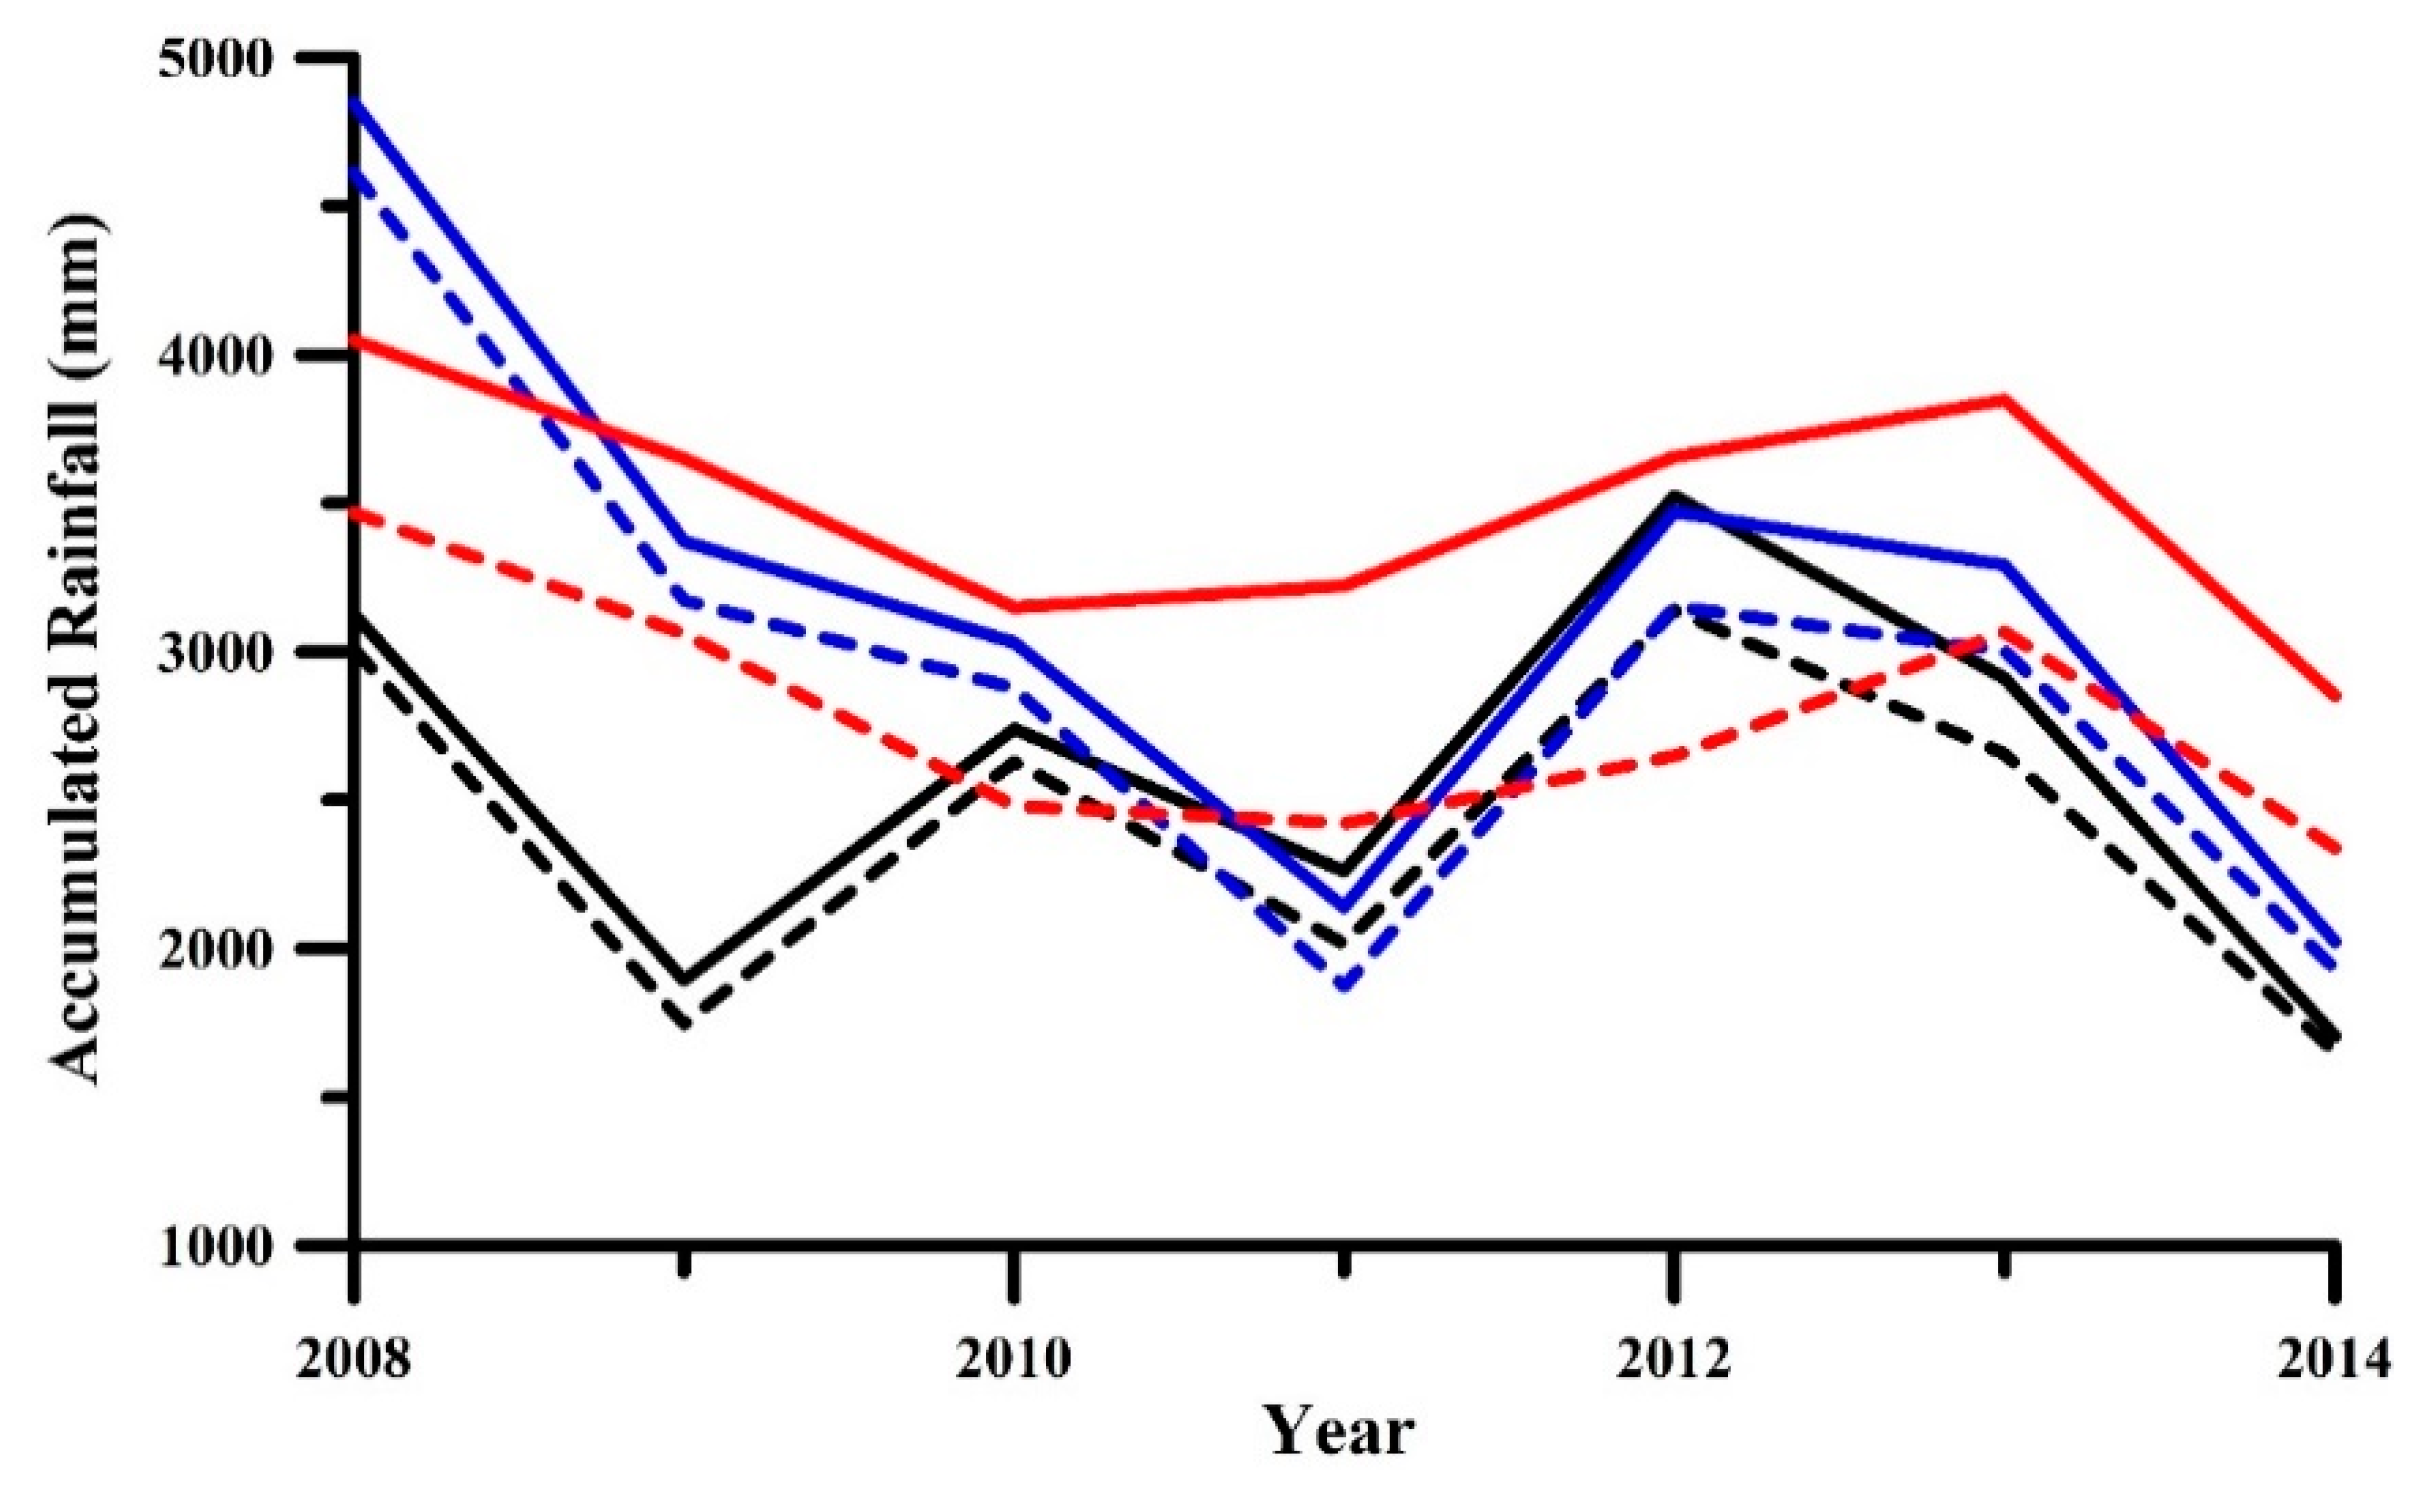
The rainfall records in the Chishan river watershed from 2008 to 2014 are shown in Figure 6 and Table 7. The mean accumulated rainfall during the rainy seasons and annual rainfall from 2008 to 2014 are 2784 mm and 3488 mm in the upstream watershed, 2478 mm and 3168 mm in the midstream watershed, and 2408 mm and 2595 mm in the downstream watershed. The accumulated rainfall during the rainy seasons in the upstream watershed occupied 72.5% to 85.6% of the annual rainfall from 2008 to 2014, while those in the midstream and downstream watershed occupied over 87.0%.
The research collects the heavy rainfall or typhoon events with the 3-day accumulated rainfall over 500 mm from 2008 to 2014 in the Chishan river watershed and lists in Table 7. The most accumulated rainfall in 3 days were 1018 mm in 2008 and 2142 mm in 5 days in 2009 in the midstream watershed, and 604 mm in 2008 and 2076 mm in 2009 in the upstream watershed. Furthermore, the most accumulated rainfall was 572 mm in 3 days in 2008 and 900 mm in 5 days in 2009 in the downstream watershed.
The comparison of the rainfall concentration in 2008 and 2009 can explain why the landside ratio in 2009 is larger than that in 2008. The accumulated rainfall during the rainy season in 2008 ranges from 3012 mm to 4615 mm, and that in 2009 ranges from 1747 mm to 3173 mm. The concentrated rainfall during 2009 Typhoon Morakot is the key factor for the dense landslide distribution in the Chishan river watershed. The 3-day accumulated rainfall in 2008 in the Chishan river watershed ranges from 566 mm to 1018 mm, while that in 2009 ranges from 900 mm to 2142 mm. The rainfall concentration during specific heavy rainfall or typhoon events is a key factor for inducing landslides in the Chishan river watershed.
3.4. Landslide Distribution from 2008 to 2014 in the Chishan River Watershed
The annual landslide distributions and statistical data from 2008 to 2014 are shown in Figure 7 and Table 8. The landslide distributions from 2008 to 2014 in the Chishan river watershed are concentrated in the midstream and upstream watersheds. The landslide counts and area in 2009 are 3.4 times and 7.4 times larger than those in 2008 due to 2009 Typhoon Morakot. The landslide area lowers gradually from 2009 to 2012, and raises slight from 2012 to 2013, and lower again from 2013 to 2014. The landslide counts and area in 2014 are only 69.8% and 53.4% of those in 2009. The landslide area from 2010 to 2014 shows that the landslide area in the following years after 2009 Typhoon Morakot gradually decreases if without any heavy rainfall event with more accumulated rainfall than that during 2009 Typhoon Morakot.
The new landslide ratio in 2009 rises to 91.3% due to the concentrated rainfall during 2009 Typhoon Morakot. The new landslide occupied percentage from 2009 to 2014 is <38.3%. This means that the landslide induced by 2009 Typhoon Morakot still plays an important role in the annual landslide inventory from 2010 to 2014.
Table 9 lists the statistical data of landslide ratio, new and old landslide percentage in the upstream, midstream, and downstream watershed of the Chishan river watershed from 2008 to 2014. Most of landslide distribution from 2010 to 2014 still overlaps the landslide distribution induced by 2009 Typhoon Morakot. The mean old landslide percentage from 2010 to 2014 in the upstream, midstream, and downstream watersheds are 60.1%, 76.1%, and 49.7%, respectively. The old landslide percentage in the upstream, midstream, and downstream watersheds in 2014 are 56.7% and 76.0%, and 45.8%, respectively, and this means that near or over 50% of landslide induced by Typhoon Morakot in 2009 is still hard to recover in 2014.
The statistical data of riverbank-landslide and non-riverbank-landslide from 2008 to 2014 in the Chishan river watershed is shown in Figure 8. The area of the riverbank-landslide and non-riverbank-landslide in the downstream of the Chishan river watershed from 2008 to 2014 are still smaller than 1.0 km2, and the downstream watershed can be considered as a non-landslide-prone area. The area of riverbank-landslide and non-riverbank-landslide in the upstream watershed in 2009 are 3.3 and 3.5 times larger than those in 2008, while those in the midstream watershed are 13.5 and 17.9 times larger than those in 2008. The area of riverbank-landslide and non-riverbank-landslide in the midstream watershed in 2014 are only 25.3% and 30.5%, respectively, of those in 2009, while those in the upstream watershed are 122% and 112%, respectively, of those in 2009. This shows that most of landslide induced by 2009 Typhoon Morakot in the midstream watershed has been gradually recovery in 2014, but that in the upstream watershed was still hard to recover in 2014.
3.5. Landslide Susceptibility in the Following 5 Years after the 2009 Typhoon Morakot in the Chishan River Watershed
The long-term landslide evolution analysis in this research has proved that the landslide distribution in 2010 to 2014 has a high correlation to the landslide distribution induced by the 2009 Typhoon Morakot. We suggest that the annual landslide susceptibility maps of the Chishan river watershed from 2010 to 2014 can be the combination of the landslide susceptibility map after the 2009 Typhoon Morakot and the average landslide area different ratio (LAD) to the power of the year interval number between 2009 to the specific year in 2010–2014. The LAD ratio in this study can be defined as the ratio of the total landslide area in a specific year from 2010 to 2014 to the total landslide area in 2009 of the watershed. For example, the annual landslide susceptibility map in 2012 is the production of the landslide susceptibility model after the 2009 Typhoon Morakot and the LAD value to the power of 3.
The annual landslide susceptibility map in 2010 to 2014 of the Chishan river watershed was drawn based on two assumptions. The first assumption was that no previous heavy rainfall event occurred with more accumulated rainfall than that of the 2009 Typhoon Morakot. This assumption is valid for the Chishan river watershed based on data shown in Figure 5 and Table 7. Second, the LAD ratio in a specific area was considered to be constant in the 5 years following the 2009 Typhoon Morakot.
Given the difference in the landslide evolution in the upstream, midstream, and downstream areas of the Chishan river watershed and for the riverbank and non-riverbank areas, the Chishan river watershed was classified into six subareas, including the riverbank and non-riverbank areas in the upstream, midstream, and downstream watersheds. The research uses the landslide area in 2009 and 2014 in the same subareas to calculate the LAD value. The average LAD values in the riverbank and non-riverbank areas in the midstream watershed from 2010 to 2014 were 0.760 and 0.788, respectively, whereas those in the downstream watershed were 0.732 and 0.789, respectively. The average LAD values of the riverbank and non-riverbank areas in the upstream watershed from 2010 to 2014 were 1.04 and 1.02, respectively.
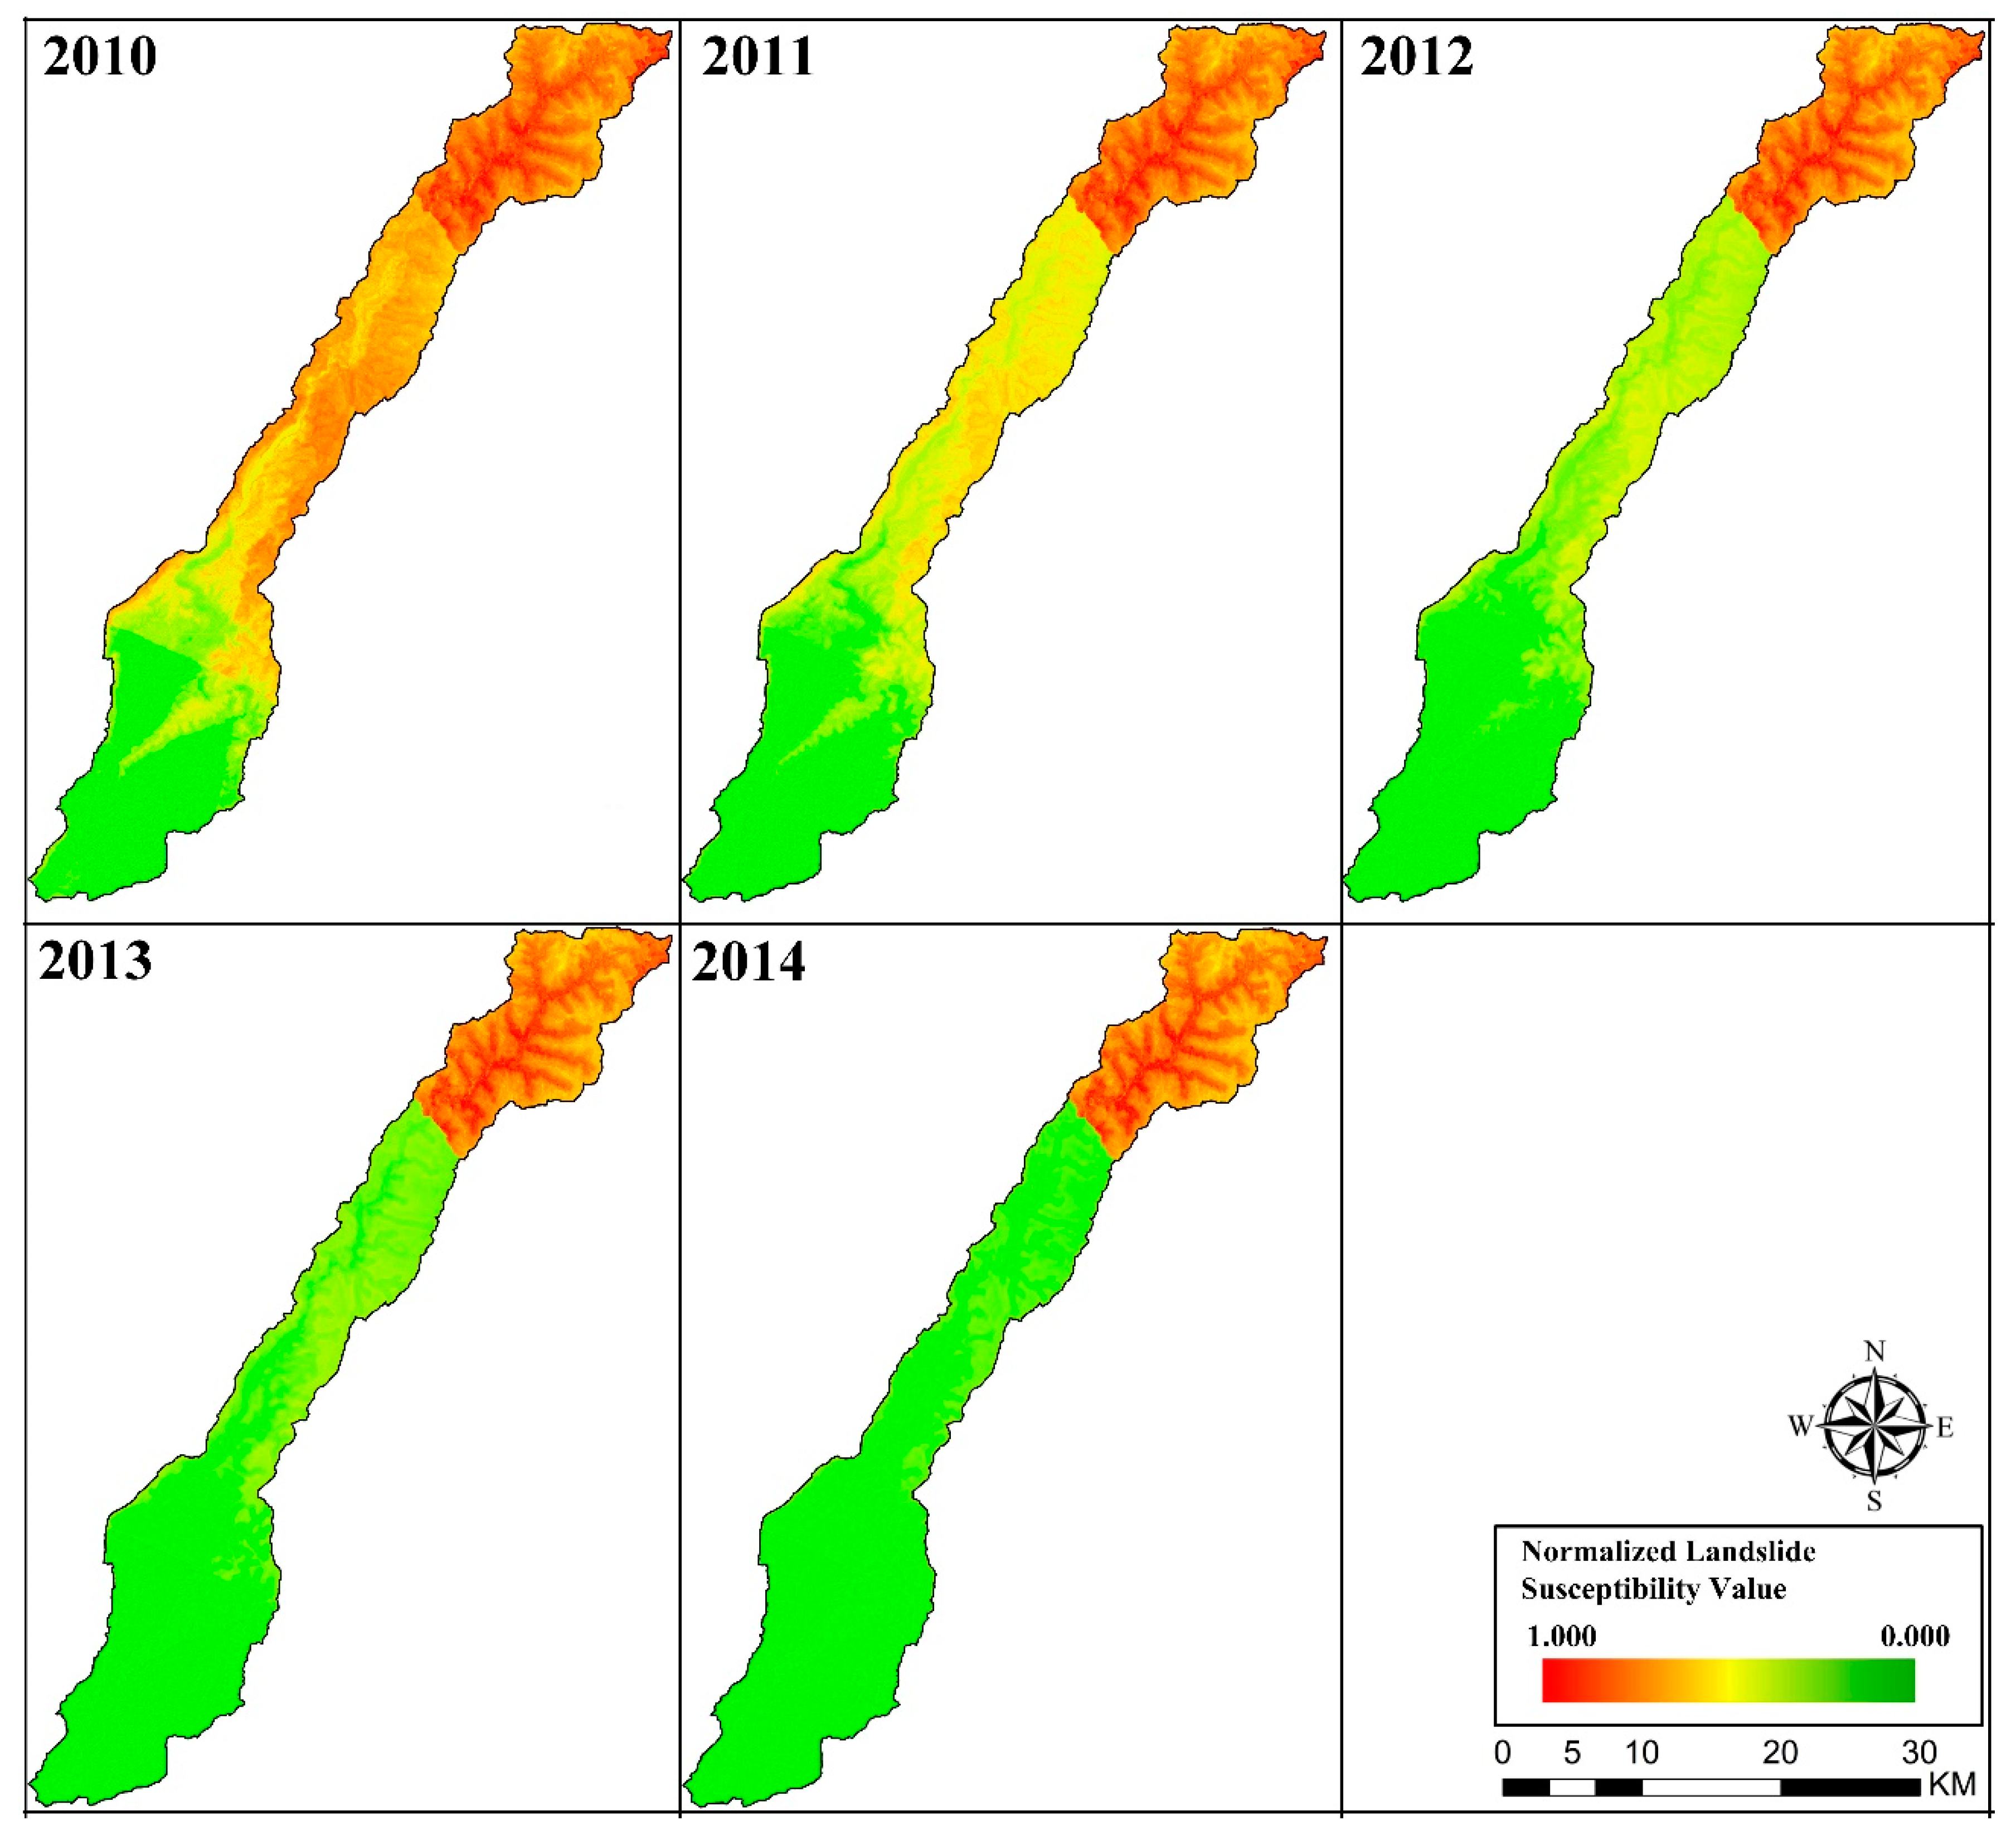
The annual landslide susceptibility of each subarea of the river watershed in a specific year from 2010 to 2014 is the production of landslide susceptibility in 2009 and the LAD ratio to the power of the year interval. The annual landslide susceptibility distributions of the Chishan river watershed from 2010 to 2014 are shown in Figure 9, and the statistical data of the annual landslide susceptibility from 2010 to 2014 are shown in Table 6. The MCR value of the landslide susceptibility model using the landslide ratio-based logistic regression (LRBLR) method in 2009 was 70.9%, and the MCR values of the annual landslide susceptibility models from 2010 to 2014 ranged from 62.5% to 73.8%. The MCR values of the annual landslide susceptibility maps from 2010 to 2014 are still acceptable.
4. Discussion
4.1. Applicability of Landslide Susceptibility Models to the Areas with Dense Landslide Distribution
The similarity and difference of landslide susceptibility models using four methods can help to understand the applicability of each landslide susceptibility model to the areas with dense landslide distribution induced by extreme rainfall events. The correlation analysis result of the four landslide susceptibility models is listed in Table 10.
The similarity between the landside susceptibility models based on LRBLR, FR, WOE, and II methods is strong to very strong. The four landslide susceptibility models can be classified into two groups based on the similarity, including the first group with the landslide susceptibility maps based on LRBLR and WOE methods and the second group with the landslide susceptibility maps based on FR and II methods. The distribution of landslide susceptibility based on the methods in the first group is somewhat different to that in the second group.
The difference of landslide susceptibility models based on four methods is the process how the assessing grade of each category and weighting value of each landslide-related factor are decided in the specific method. The concept of landslide ratio is used in the four methods, such as LRC classification in LRBLR, FR value in FR, W+ value in WOE, and the D value in II. The landslide susceptibility value by using FR or WOE methods is with equal weighting value, while using LBRLR or II methods gives a different weighting value. The accumulated rainfall, geology distribution, and land use factors should be the top three key factors for building the landslide susceptibility models based on the variance of landslide ratio in each factor in the Chishan river watershed based on the above-mentioned analysis. The factors used in building the extreme rainfall-induced landslide susceptibility model should be with different weighting values, so the FR and WOE methods are not suitable methodologies to build the landslide susceptibility model in the Chishan river watershed after the 2009 Typhoon Morakot.
The process of building the landslide susceptibility models by using LRBLR and II methods are with LR ratio and weighting values, but the difference between the two methodologies is the method by which landslide susceptibility values can be estimated. The landslide susceptibility value by using the II method is the product of the landslide susceptibility value of each factor, and the landslide susceptibility value in each factor was <1.0. The mean landslide susceptibility value by using the II method was 0.325, which is only 60.9% of the mean landslide susceptibility value obtained using the LBRLR method. Using the product to combine each landslide susceptibility value of each factor by using the II method underestimates the landslide susceptibility. In this study, the II method is considered suitable to develop the landslide susceptibility in the area with mild landslide distribution. The landslide susceptibility value using the LRBLR method is the summation of the assessment value of each category of each factor, and the assessment value of each category of each factor is determined by the SPSS software. The LRBLR method was considered suitable to develop the landslide susceptibility model for the extreme rainfall-induced landslide susceptibility model.
4.2. Evolution of Landslide Distribution in the Following 5 Years after the 2009 Typhoon Morakot
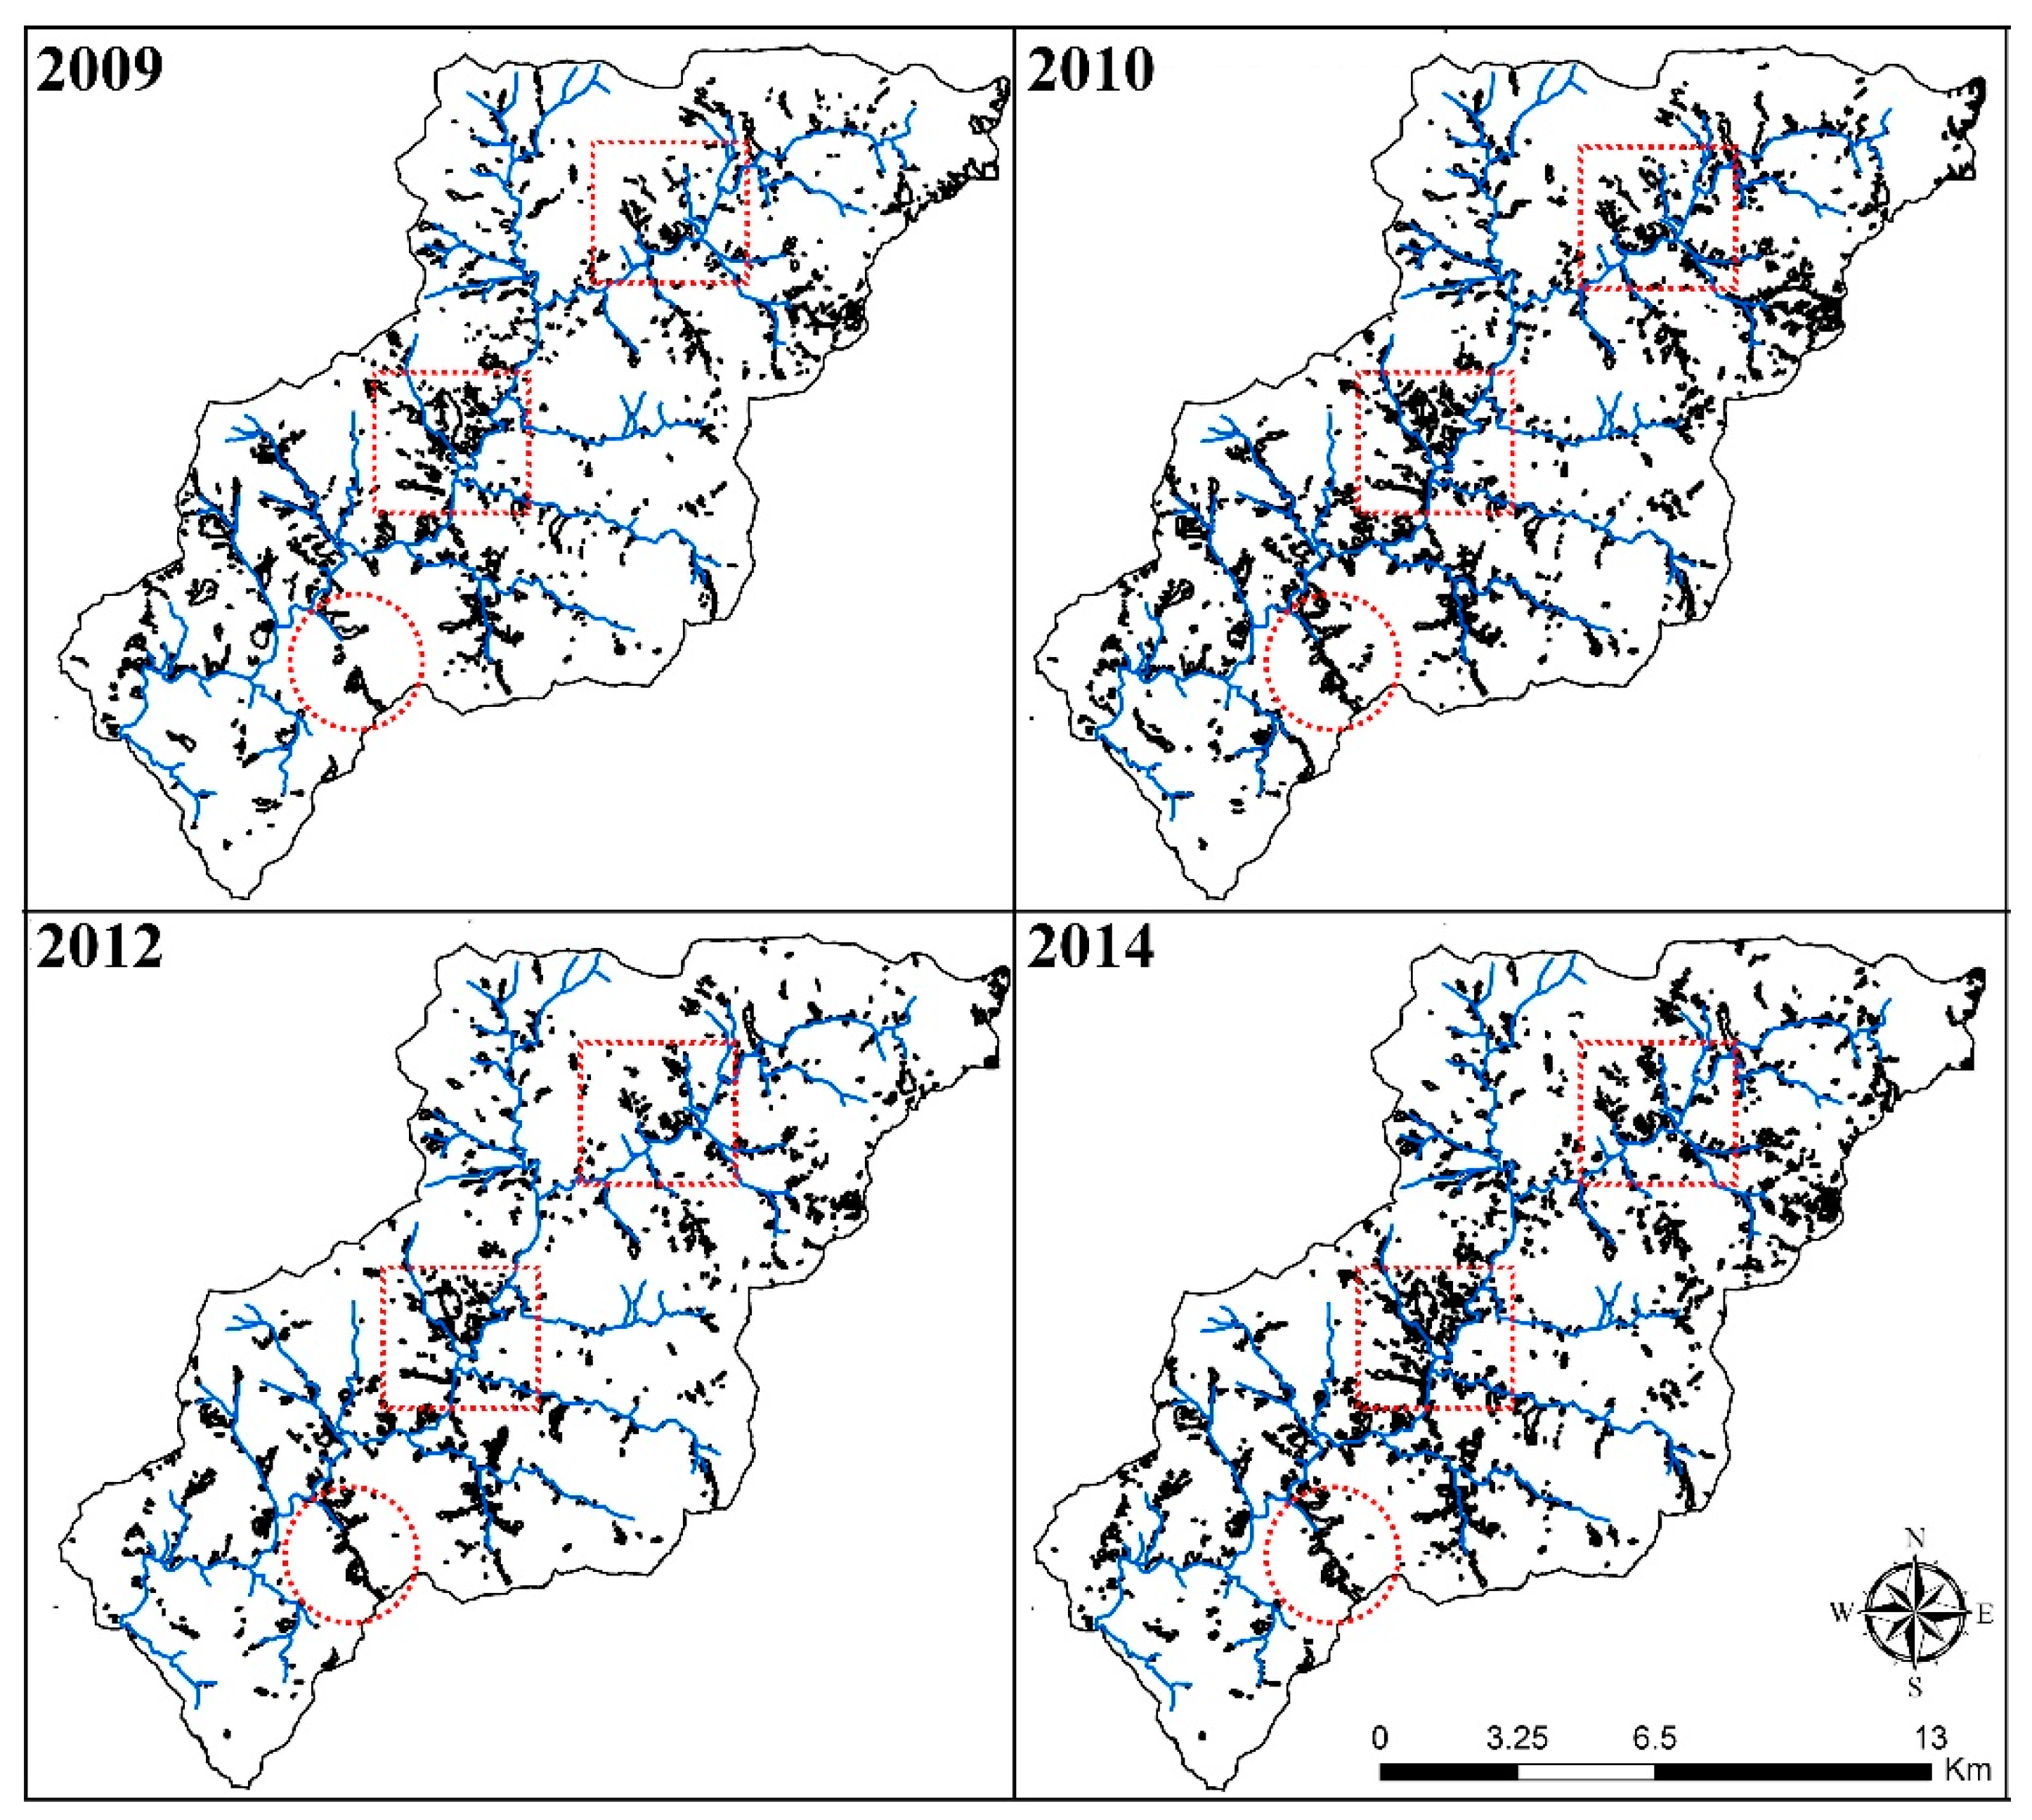
The landslide evolution in 2010 to 2014 is different in the upstream, midstream, and downstream of the Chishan river watershed and must be discussed in detail. The landslide ratio in the upstream watershed was 1.37% in 2008, 4.62% in 2009, and 5.40% in 2014. The landslide ratio in the upstream watershed from 2010 to 2014 was larger than that in 2009, except 2012. On average, the landslide inventory from 2010 to 2014 in the upstream watershed was composed of 60.1% old landslide that had originated from the 2009 typhoon Morakot and 39.9% new landslide. This means that the landslide in the upstream watershed following the 2009 typhoon Morakot is difficult to recover and easily induced by the mild heavy rainfall events. The landslide distribution in the upstream watershed in 2009, 2010, 2012, and 2014 is shown in Figure 10 for detailed discussion. The river intersection area (red rectangles in Figure 10) and the river source area (red circles in Figure 10) are the two main areas where the landslide is problematic to recover and easily induced from 2010 to 2014.
The midstream watershed has the most landslide area after 2009 Typhoon Morakot in the Chishan river watershed. The landslide ratio in the midstream reaches peak (9.19%) in 2009 and decreases gradually to 2.56% in 2014. On average, the landslide inventory from 2010 to 2014 in the midstream watershed is composed of 76.1% old landslide originating from 2009 Typhoon Morakot and 23.9% new landslide. This means that the landside in the midstream watershed is easily induced only by extreme rainfall events and recovers quickly in 5 years after extreme rainfall events. The composition of strata should be among important factors for the different landslide recovery in the upstream and midstream watersheds. The main strata in the upstream watershed include the Nankang formation, Changchihkeng Formation, and Nanchuang formation. The accumulated occupied percentage of the three strata in the upstream is around 87.9%. The composition of the three strata is slate, sandstone and shale, i.e., three landslide-prone lithologies. The landslide occurred in the three strata in the upstream watershed in 2009 occupied 85.3% of the total landslide in the upstream, while that in 2014 still occupied 87.8% of the total landslide in the upstream.
The recovery of riverbank landslide from 2010 to 2014 was different in the upstream and midstream of the Chishan river watershed. Wu [31] mentioned that the riverbank landslide after the 2009 Typhoon Morakot in Taiwan was difficult to recover because of the excessive sediment yield from numerous landslides and debris flow that deposited randomly in the river and resulted in serious riverbank landslide. The area of the riverbank landslide induced by the 2009 Typhoon Morakot in the midstream watershed was recovered in 2014, whereas that in the upstream watershed increased in 2014. This is a notable and valuable observation for further discussion.
The riverbank landslide areas from 2012 to 2013 in the upstream and midstream watersheds are obvious comparisons for the difference in landslide recovery. The midstream watershed had suffered two heavy rainfall events with a 3-day accumulated rainfall of over 500.0 mm in August 2013 (Table 7), but the riverbank landslide area still decreased from 2012 to 2013. Additionally, the upstream watershed had suffered two heavy rainfall events on the same date, but the 3-day accumulated rainfall of Xingaokou station on 21–23 August and 29–31 August were only 449.5 mm and 353.5 mm, respectively. The riverbank landslide area in the upstream watershed in 2013 increased by 1.63 times of that in 2012, and the non-riverbank landslide area also increased by 1.66 times. In this study, the statistical data of landslide and rainfall in 2008 in the upstream watershed were adopted for obvious comparison. The annual rainfall in 2008 and in 2013 in the upstream watershed were 4049 and 3846 mm, respectively, and there were three heavy rainfall events with accumulated rainfall over 500.0 mm in 2008 and zero event in 2013 in the upstream watershed. The riverbank landslide ratio in the upstream in 2008 was 1.5%, and that in 2013 was 6.5%. These data demonstrate that the landslide proneness in the upstream watershed increased significantly after the 2009 Typhoon Morakot, whereas that in the midstream and downstream watershed decreased gradually. The upstream watershed should be considered the most important area in the Chishan river watershed to implement further engineering and disaster prevention based on the long-term landslide evolution analysis.
Another key consideration for future studies can be that the landslide distribution in a river watershed in the following years after extreme rainfall events is mostly overlapped with that induced by extreme rainfall events. The old landslide percentages in the upstream and midstream of the Chishan river watershed were still over 60.0% from 2010 to 2014. The landslide susceptibility maps after extreme rainfall events can be the basis for the annual landslide susceptibility in the years following extreme rainfalls. We suggest that the landslide susceptibility model should be developed after extreme rainfall or earthquake events, and the annual landslide maps in the years following extreme rainfall or earthquake events can be the combination of the landslide susceptibility model and LAD values to the power of the year interval. The LAD values should be estimated carefully in each of the subareas. The annual landslide susceptibility maps from 2010 to 2014 in the Chishan river watershed in this research also proves the aforementioned concept and can be used with acceptable accuracy.
5. Conclusions
This research draws annual landslide susceptibility maps in the years after specific extreme rainfall events. Numerous landslides were induced by Typhoon Morakot in the Chishan River watershed. Based on our analysis result, 61.7% of the landslide area from 2010 to 2014 upstream and midstream of the Chishan River watershed overlapped with that induced by Typhoon Morakot in 2009. This indicates that the landslide distribution following specific extreme rainfall events are strongly related to that induced by the events. We suggest that annual landslide susceptibility maps in the years after specific extreme rainfall events can be drawn on the basis of the landslide susceptibility maps induced by specific extreme rainfall events. Most landslides in the years after specific extreme rainfall events were riverbank landslides induced by sinuous rivers that resulted from the large amount of sediment deposited in the river from the dense landslide after Typhoon Morakot. We emphasize the importance of riverbank landslides and explain how to assess susceptibility to them in the 5 years after Typhoon Morakot.
The research selects 12 landslide-related factors as the basis for establishing landslide susceptibility models using four methods, and the highest-performing landslide susceptibility model of the four methods is the LRBLR method. Accumulated rainfall, geology distribution, and land use are the top three key factors for establishing the landslide susceptibility model based on the variance of landslide ratios in each factor. Furthermore, we adopt the annual landslide inventories from 2008 to 2014 in the Chishan River watershed to analyze the long-term landslide evolution. The mean old landslide percentages from 2010 to 2014 upstream, midstream, and downstream of the Chishan River watershed are 60.1%, 76.1%, and 49.7%, respectively. The study calculates the mean LAD in the riverbank and non-riverbank areas upstream, midstream, and downstream of the Chishan River watershed. We suggest that the annual landslide susceptibility maps of the Chishan River watershed from 2010 to 2014 can be the combination of the landslide susceptibility map after Typhoon Morakot and the average LAD to the power of the year interval number between 2009 to the specific year from 2010 to 2014. We can roughly draw the annual landslide susceptibility map in the Chishan River watershed from 2010 to 2014. We compare the annual landslide inventories and susceptibility map from 2010 to 2014 in the Chishan River watershed, and the mean correct ratios from 2010 to 2014 range from 62.5% to 73.8%.
Funding
This research was funded by National Science Council in Taiwan (MOST 107-2313-B-035-001). And The APC was funded by National Science Council in Taiwan.
Conflicts of Interest
The authors declare no conflict of interest.
References
- National Fire Agency. Loses Caused by Natural Disasters; Ministry of Interior: Taipei, Taiwan, 2019. Available online: https://www.nfa.gov.tw/cht/index.php?code=list&ids=233 (accessed on 30 November 2019).
- Wu, C.H.; Chen, S.C.; Chou, H.T. Geomorphologic characteristics of catastrophic landslides during Typhoon Morakot in the Kaoping watershed, Taiwan. Eng. Geol. 2011, 123, 13–21. [Google Scholar] [CrossRef]
- Shiu, C.J.; Liu, S.C.; Chen, J.P. Diurnally asymmetric trends of temperature, humidity, and precipitation in Taiwan. J. Clim. 2009, 22, 5635–5649. [Google Scholar] [CrossRef] [Green Version]
- Conforti, M.; Pascale, S.; Robustelli, G.; Sdao, F. Evaluation of prediction capability of the artificial neural networks for mapping landslide susceptibility in the Turbolo River catchment (northern Calabria, Italy). CATENA 2014, 113, 236–250. [Google Scholar] [CrossRef]
- Regmi, N.; Giardino, J.R.; Vitek, J.D. Modeling susceptibility to landslides using the weight of evidence approach: Western Colorado, USA. Geomorphology 2010, 115, 172–187. [Google Scholar] [CrossRef]
- Wang, L.J.; Guo, M.; Sawada, K.; Lina, J.; Zhang, J.C. Landslide susceptibility mapping in Mizunami City, Japan: A comparison between logistic regression, bivariate statistical analysis and multivariate adaptive regression spline models. CATENA 2015, 135, 271–282. [Google Scholar] [CrossRef]
- Yilmaz, I. Landslide susceptibility mapping using frequency ratio, logistic regression, artificial neural networks and their comparison: A case study from Kat landslides(Tokat-Turkey). Comput. Geosci. 2009, 35, 1125–1138. [Google Scholar] [CrossRef]
- Cama, M.; Lombardo, L.; Conoscenti, V.; Agnesi, V.; Rotigliano, E. Predicting storm-triggered debris flow events: Application to the 2009 Ionian Peloritan disaster (Sicily, Italy). Nat. Hazards Earth Syst. Sci. 2015, 15, 1785–1806. [Google Scholar] [CrossRef] [Green Version]
- Goetz, J.N.; Brenning, A.; Petschko, H.; Leopold, P. Evaluating machine learning and statistical prediction techniques for landslide susceptibility modeling. Comput. Geosci. 2015, 81, 1–11. [Google Scholar] [CrossRef]
- Pham, B.T.; Shirzadi, A.; Shahabi, H.; Omidvar, E.; Singh, S.K.; Sahana, M.; Asl, D.T.; Ahmad, B.B.; Quoc, N.K.; Lee, S. Landslide Susceptibility Assessment by Novel Hybrid Machine Learning Algorithms. Sustainability 2019, 11, 4386. [Google Scholar] [CrossRef] [Green Version]
- Sameen, M.I.; Sarkar, R.; Pradhan, B.; Drukpa, D.; Alamri, A.M.; Park, H.J. Landslide spatial modelling using unsupervised factor optimisation and regularised greedy forests. Comput. Geosci. 2020, 134, 104336. [Google Scholar] [CrossRef]
- Shafizadeh-Moghadam, H.; Minaei, M.; Shahabi, H.; Hagenauer, J. Big data in Geohazard; pattern mining and large scale analysis of landslides in Iran. Earth Sci. Inform. 2018. [Google Scholar] [CrossRef]
- Lombardo, L.; Cama, M.; Conoscenti, C.; Maerker, M.; Rotigliano, E. Binary logistic regression versus stochastic gradient boosted decision trees in assessing landslide susceptibility for multiple-occurring landslide events: Application to the 2009 storm event in Messina (Sicily, southern Italy). Nat. Hazards 2015, 79, 1621–1648. [Google Scholar] [CrossRef]
- Bragagnolo, L.; da Silva, R.V.; Grzybowski, M.V. Landslide susceptibility mapping with r. landslide: A free open-source GIS-integrated tool based on Artificial Neural Networks. Environ. Model. Softw. 2020, 103, 104565. [Google Scholar] [CrossRef]
- Hong, H.Y.; Liu, J.Z.; Zhu, A.X. Landslide susceptibility evaluating using artificial intelligence method in the Youfang district (China). Environ. Earth Sci. 2019, 78, 488. [Google Scholar] [CrossRef]
- Lee, C.T.; Fei, L.Y. Nationwide Landslide Hazard Analysis and Mapping in Taiwan. Eng. Geol. Soc. Territory 2015, 2, 971–974. [Google Scholar]
- Wu, C.H. Landslide susceptibility mapping by using landslide ratio-based logistic regression: A case study in the Southern Taiwan. J. Mt. Sci. 2015, 12, 721–736. [Google Scholar] [CrossRef]
- Su, M.B.; Chen, Y.H.; Fang, C.J. Analysis of landslide susceptibility by using instability index method. J. Soil Water Conserv. Technol. 2009, 4, 9–23. [Google Scholar]
- Water Resources Agency. The Analysis of the Rainfall and River Discharge During Typhoon Morakot; Water Resources Agency, Ministry of Economic Affairs: Taipei, Taiwan, 2009; pp. 24–25.
- Liu, J.T.; Liu, K.J.; Huang, J.C. The effect of a submarine canyon on the river sediment dispersal and inner shelf sediment movements in southern Taiwan. Mar. Geol. 2002, 181, 357–386. [Google Scholar] [CrossRef]
- Milliman, J.D.; Syyitski, J.P.M. Geomorphic/tectonic control of sediment discharge to the ocean: The importance of small mountainous rivers. J. Geol. 1992, 100, 525–544. [Google Scholar] [CrossRef]
- Hung, J.J.; Hung, P.Y. Carbon and nutrient dynamics in a hypertrophic lagoon in southwestern Taiwan. J. Mar. Syst. 2003, 42, 97–114. [Google Scholar] [CrossRef]
- Sinotech Consultants. Geological Investigation and Database Construction for the Upstream Watershed of Flood-Prone; Central Geological Survey, Ministry of Economic Affairs, R.O.C: Taipei, Taiwan, 2007.
- Wu, C.H.; Chen, S.C.; Feng, Z.Y. Flooding process of Xiaolin landslide dam failure triggered by extreme rainfall of Typhoon Morakot in Taiwan. Landslides 2014, 11, 357–367. [Google Scholar] [CrossRef] [Green Version]
- Central Geological Survey. The Topographic and Geological Database; Central Geological Survey: Taipei, Taiwan, 2009. Available online: http://gwh.moeacgs.gov.tw/mp/Portal/index.cfm (accessed on 30 November 2019).
- Yesilnacar, E.; Topal, T. Landslide susceptibility mapping: A comparison of logistic regression and neural networks methods in a medium scale study, Hendek region (Turkey). Eng. Geol. 2005, 79, 251–266. [Google Scholar] [CrossRef]
- Lee, S.; Talib, J.A. Probabilistic landslide susceptibility and factor effect analysis. Environ. Geol. 2005, 47, 982–990. [Google Scholar] [CrossRef]
- Bonham-Carter, G.F. Geographic Information Systems for Geoscientists: Modeling with GIS; Pergamon Press: Oxford, UK, 1994. [Google Scholar]
- Jian, L.B. Application of Geographic Information System in the Quantitative Assessment of Slope Stability. Master’s Thesis, National Chung Hsing University, Taichung, Taiwan, 1992. [Google Scholar]
- Shou, K.J.; Wu, C.C.; Lin, J.F. Predictive analysis of landslide susceptibility in the Kao-ping watershed, Taiwan under climate change conditions. NHESS 2015, 3, 575–606. [Google Scholar] [CrossRef]
- Wu, C.H. Comparison and Evolution of Extreme Rainfall-Induced Landslides in Taiwan. Int. Soc. Photogramm. Remote Sens. 2017, 6, 367. [Google Scholar] [CrossRef] [Green Version]
Figure 1.
The flow chart of this research.

Figure 2.
The distribution of elevation, river, and landslide inventory induced by 2009 Typhoon Morakot in the Chishan river watershed.
Figure 2.
The distribution of elevation, river, and landslide inventory induced by 2009 Typhoon Morakot in the Chishan river watershed.

Figure 3.
The geological settings of the Chishan river watershed.

Figure 4.
The distribution of accumulated rainfall during the 2009 Typhoon Morakot and rainfall stations in the Chishan river watershed.
Figure 4.
The distribution of accumulated rainfall during the 2009 Typhoon Morakot and rainfall stations in the Chishan river watershed.

Figure 5.
The landslide susceptibility maps using four methods based on the landslide inventory after 2009 Typhoon Morakot in the Chishan river watershed.
Figure 5.
The landslide susceptibility maps using four methods based on the landslide inventory after 2009 Typhoon Morakot in the Chishan river watershed.

Figure 6.
The annual rainfall (solid lines) and accumulated rainfall during the rainy season (dash lines) from three representative rainfall stations, including Xingaokou station (red line), Jiaxian station (blue line), and Chishan station (black line), in the Chishan river watershed from 2008 to 2014.

Figure 7.
The landslide distribution from 2008 to 2014.

Figure 8.
Area of the riverbank-landslide (solid lines) and non-riverbank-landslide (dash lines) in the upstream (black line), midstream (blue line), and downstream (red line) from 2008 to 2014.
Figure 8.
Area of the riverbank-landslide (solid lines) and non-riverbank-landslide (dash lines) in the upstream (black line), midstream (blue line), and downstream (red line) from 2008 to 2014.

Figure 9.
The annual landslide susceptibility from 2010 to 2014 in the Chishan river watershed.

Figure 10.
The landslide distributions in 2009, 2010, 2012, and 2014 in the upstream of the Chishan river watershed.
Figure 10.
The landslide distributions in 2009, 2010, 2012, and 2014 in the upstream of the Chishan river watershed.


Table 1.
The statistical data of twelve landslide-related factors in this research in the Chishan river watershed.
Table 1.
The statistical data of twelve landslide-related factors in this research in the Chishan river watershed.
| Variable (Unit) | Max | Min | Mean | Median | S.D. * | Skewness | Kurtosis |
|---|---|---|---|---|---|---|---|
| Geomorphological factors | |||||||
| Elevation (m) | 3979.4 | 26.3 | 830.61 | 505.5 | 806.32 | 0.881 | 2.762 |
| Slope (degrees) | 79.2 | 0.0 | 22.32 | 25.5 | 15.34 | 0.065 | 2.111 |
| Aspect (degrees) | 360.0 | −1.0 | 188.37 | 193.3 | 102.50 | −0.188 | 1.934 |
| Land use | categorical variable | ||||||
| Plan curvature | 200.4 | −200.4 | −0.77 | 0 | 3.01 | −0.376 | 63.282 |
| Profile curvature | 201.0 | −271.4 | −0.89 | 0 | 4.63 | −0.719 | 127.152 |
| Geological factors | |||||||
| Geology | categorical variable | ||||||
| Fault density (10−3 m−1) | 2.4 | 0.0 | 0.07 | 0 | 0.28 | 4.213 | 21.591 |
| Hydrological factors | |||||||
| Accumulated rainfall (mm) | 2174.1 | 1083.3 | 1671.0 | 1705.4 | 263.15 | −0.565 | 2.746 |
| Proximity to the rivers (m) | 5641.0 | 0 | 352.1 | 221.4 | 178.9 | 4.579 | 13.212 |
| Topographic wetness index | 41.2 | 6.9 | 12.6 | 12.3 | 2.31 | 1.549 | 7.361 |
| Stream power index | 24.2 | −9.0 | 2.4 | 2.8 | 3.73 | −0.409 | 4.343 |
* Note: The S.D. indicates the standard deviation.
Table 2.
The geological settings in the Chishan river watershed.
| Ab. | Times | Strata | Lithology | Oc. (%) |
|---|---|---|---|---|
| a | Holocene | alluvium | gravel, sand and clay | 17.8 |
| Al | Pliocene | Ailiaochiao formation | thin alternation of siltstone and shale | 7.6 |
| Cc | Miocene | Changchihkeng formation | alternations of sandstone and shale | 26.2 |
| Gt | Pliocene-Pleistocene | Gutingken formation | mudstone with intercalated sandstone | 1.3 |
| Hh | Miocene | Hunghuatzu formation | thick-bedded siltstone, thick alteration of siltstone and sandstone | 2.9 |
| ig | none | igneous rock | igneous rock | 0.0 |
| Kz | Miocene-Pliocene | Kaitzuliao shale | shale | 0.6 |
| Le | Pleistocene | Liukuei formation | conglomerate, sandstone, sandy shale and mudstone | 0.4 |
| Lo | Pleistocene | Linkou conglomerate | conglomerate with mudstone interbeds, intercalated with sheet or lenticular sandstone | 0.9 |
| M2 | Middle Miocene | Nankang formation and equivalents | augillite or slate | 10.8 |
| Nc | Miocene | Nanchuang formation and equivalents | sandstone and shale interbeded with igneous rock | 3.6 |
| Nl | Pliocene | Nanshihlun sandstone | thick sandstone, mudstone, alternations of sandstone and shale, thick carbonaceous shale with intercalated sandstone | 0.5 |
| Si | Miocene | Sanming shale | shale intercalated with thin-bedded siltstone | 2.3 |
| Sp | Eocene | Shihpachungchi formation | slate with mate-sandstone | 1.1 |
| t | Pleistocene-Holocene | Terrace gravel | mud, sand, and gravel | 5.9 |
| Tc | Eocene | Tachien sandstone | meta-sandstone with slate | 1.3 |
| Tn | Miocene | Tangenshan sandstone | sandstone intercalated with shale | 10.5 |
| Wa | Miocene-Pliocene | Wushan formation | thin alternation of sandstone and shale | 0.5 |
| Ya | Eocene | Yushanchushan formation | meta-sandstone and slate interbeded | 0.7 |
| Ys | Pliocene | Yenshuikeng shale | massive shale | 4.9 |
Note: Ab. means abbreviation and Oc. refers to the occupied percentage of the strata in the Chishan river watershed.
Table 3.
Coefficient values of landslide-related factors based on four methods.
| Factors | Area (Km2) | Landslide Area (Km2) | LR (%) | LRC Number | FR | C | Di |
|---|---|---|---|---|---|---|---|
| Elevation (m) | |||||||
| <250 | 285.2 | 0.3 | 0.1 | 1 | 0.03 | −4.16 | 1.00 |
| 250–500 | 122.2 | 3.8 | 3.1 | 4 | 0.75 | −0.35 | 3.26 |
| 500–750 | 64.3 | 6.7 | 10.4 | 11 | 2.51 | 1.13 | 8.74 |
| 750–1000 | 51.2 | 5.7 | 11.0 | 11 | 2.68 | 1.18 | 9.27 |
| 1000–1250 | 45.5 | 5.5 | 12.2 | 11 | 2.91 | 1.28 | 10.00 |
| 1250–1500 | 52.8 | 5.0 | 9.4 | 10 | 2.28 | 0.98 | 8.03 |
| 1500–1750 | 53.0 | 2.9 | 5.5 | 6 | 1.32 | 0.31 | 5.03 |
| 1750–2000 | 53.4 | 1.8 | 3.4 | 4 | 0.81 | −0.23 | 3.45 |
| 2000–2250 | 39.7 | 0.9 | 2.4 | 3 | 0.55 | −0.65 | 2.63 |
| 2250–2500 | 23.6 | 0.3 | 1.4 | 2 | 0.31 | −1.24 | 1.88 |
| 2500–2750 | 14.2 | 0.2 | 1.1 | 2 | 0.34 | −1.12 | 1.98 |
| 2750–3000 | 5.2 | 0.1 | 1.8 | 2 | 0.46 | −0.80 | 2.37 |
| >3000 | 7.9 | 0.8 | 10.2 | 11 | 2.44 | 0.97 | 8.52 |
| Slope (°) | |||||||
| <10 | 219.0 | 1.1 | 0.5 | 1 | 0.12 | −2.44 | 1.00 |
| 10–20 | 102.5 | 2.8 | 2.8 | 3 | 0.66 | −0.48 | 4.14 |
| 20–30 | 172.8 | 8.0 | 4.7 | 5 | 1.12 | 0.15 | 6.81 |
| 30–40 | 190.2 | 13.2 | 7.0 | 8 | 1.68 | 0.79 | 10.00 |
| 40–50 | 95.5 | 6.5 | 6.8 | 7 | 1.65 | 0.62 | 9.87 |
| 50–60 | 30.9 | 1.7 | 5.4 | 6 | 1.33 | 0.31 | 8.03 |
| >60 | 7.4 | 0.5 | 6.7 | 7 | 1.64 | 0.53 | 9.80 |
| Aspect | |||||||
| flat | 20.7 | 0.0 | 0.0 | 1 | 0.00 | −4.52 | 1.00 |
| North | 82.9 | 3.6 | 4.4 | 5 | 1.05 | 0.05 | 8.11 |
| Northeast | 73.0 | 4.0 | 5.5 | 6 | 1.32 | 0.33 | 10.00 |
| East | 86.0 | 4.1 | 4.7 | 5 | 1.15 | 0.17 | 8.80 |
| Southeast | 102.4 | 4.4 | 4.3 | 5 | 1.04 | 0.04 | 8.03 |
| South | 107.7 | 4.7 | 4.4 | 5 | 1.05 | 0.06 | 8.14 |
| Southwest | 116.0 | 4.7 | 4.1 | 5 | 0.98 | −0.03 | 7.63 |
| West | 120.4 | 4.6 | 3.8 | 4 | 0.92 | −0.10 | 7.25 |
| Northwest | 108.9 | 3.8 | 3.5 | 4 | 0.84 | −0.20 | 6.71 |
| Land use | |||||||
| agriculture | 189.5 | 1.1 | 0.6 | 1 | 0.14 | −2.24 | 1.00 |
| forest | 547.7 | 28.5 | 5.2 | 6 | 1.26 | 0.99 | 2.86 |
| development | 43.1 | 0.4 | 1.0 | 2 | 0.22 | −1.57 | 1.13 |
| neighborhood of river | 22.3 | 0.3 | 1.1 | 2 | 0.32 | −1.17 | 1.30 |
| bare land | 15.7 | 3.6 | 22.8 | 11 | 5.53 | 2.03 | 10.00 |
| Accumulated rainfall (mm) | |||||||
| <1200 | 161.9 | 0.1 | 0.0 | 1 | 0.01 | −4.48 | 1.00 |
| 1200–1400 | 97.9 | 0.1 | 0.1 | 1 | 0.02 | −3.88 | 1.00 |
| 1400–1600 | 118.3 | 4.1 | 3.4 | 4 | 0.83 | −0.22 | 3.88 |
| 1600–1800 | 336.5 | 18.7 | 5.5 | 6 | 1.34 | 0.58 | 5.68 |
| >1800 | 103.6 | 11.0 | 10.6 | 11 | 2.56 | 1.27 | 10.00 |
| Geology | |||||||
| a | 145.8 | 0.2 | 0.1 | 1 | 0.03 | −3.65 | 1.09 |
| Al | 61.8 | 0.9 | 1.5 | 2 | 0.35 | −1.13 | 2.01 |
| Cc | 214.4 | 14.1 | 6.6 | 7 | 1.59 | 0.73 | 5.55 |
| Gt | 10.9 | 0.1 | 0.6 | 1 | 0.22 | −1.55 | 1.64 |
| Hh | 24.1 | 2.6 | 10.6 | 11 | 2.60 | 1.08 | 8.47 |
| ig | 0.3 | 0.0 | 4.9 | 5 | 0.00 | −0.26 | 1.00 |
| Kz | 5.0 | 0.0 | 0.0 | 1 | 0.00 | −3.08 | 1.00 |
| Le | 3.3 | 0.0 | 0.0 | 1 | 0.00 | −2.66 | 1.00 |
| Lo | 7.7 | 0.0 | 0.0 | 1 | 0.00 | −3.51 | 1.00 |
| M2 | 88.4 | 3.7 | 4.2 | 5 | 1.01 | 0.01 | 3.90 |
| Nc | 29.4 | 0.7 | 2.3 | 3 | 0.57 | −0.59 | 2.65 |
| Nl | 3.9 | 0.0 | 0.0 | 1 | 0.00 | −2.83 | 1.00 |
| Si | 18.8 | 1.0 | 5.3 | 6 | 1.28 | 0.27 | 4.68 |
| Sp | 8.7 | 0.4 | 4.2 | 5 | 1.11 | 0.11 | 4.18 |
| t | 48.4 | 0.4 | 0.9 | 1 | 0.20 | −1.70 | 1.57 |
| Tc | 10.8 | 0.3 | 3.1 | 4 | 0.67 | −0.42 | 2.92 |
| Tn | 86.3 | 7.0 | 8.1 | 9 | 1.96 | 0.84 | 6.62 |
| Wa | 4.3 | 0.0 | 0.0 | 1 | 0.00 | −2.93 | 1.00 |
| Ya | 5.5 | 0.7 | 13.1 | 11 | 3.07 | 1.23 | 9.81 |
| Ys | 40.3 | 1.8 | 4.5 | 5 | 1.08 | 0.08 | 4.09 |
| Fault density (10−3 m/km2) | |||||||
| <5 | 764.6 | 28.2 | 3.7 | 4 | 0.89 | −1.11 | 1.00 |
| 10 | 22.8 | 2.1 | 9.4 | 10 | 2.23 | 0.89 | 4.57 |
| 15 | 23.8 | 2.6 | 11.1 | 11 | 2.64 | 1.10 | 5.68 |
| 20 | 5.3 | 0.6 | 11.2 | 11 | 2.74 | 1.10 | 5.93 |
| >20 | 1.7 | 0.3 | 16.0 | 11 | 4.27 | 1.61 | 10.00 |
| proximity to the river (m) | |||||||
| <250 | 320.9 | 15.1 | 4.7 | 5 | 1.14 | 0.23 | 10.00 |
| 250–500 | 192.0 | 8.1 | 4.2 | 5 | 1.02 | 0.02 | 7.83 |
| 500–750 | 123.4 | 4.9 | 4.0 | 4 | 0.96 | −0.05 | 6.72 |
| 750–1000 | 78.4 | 3.0 | 3.8 | 4 | 0.92 | −0.09 | 6.07 |
| >1000 | 103.5 | 2.8 | 2.7 | 3 | 0.65 | −0.49 | 1.00 |
| Plan curvature | |||||||
| <−0.6 | 182.3 | 11.3 | 6.2 | 7 | 1.50 | 0.58 | 10.00 |
| −0.6 – −0.3 | 91.5 | 3.6 | 3.9 | 4 | 0.95 | −0.06 | 4.84 |
| −0.3 – 0 | 173.1 | 3.9 | 2.2 | 3 | 0.54 | −0.75 | 1.00 |
| 0 – 0.3 | 81.9 | 3.5 | 4.3 | 5 | 1.03 | 0.04 | 5.61 |
| 0.3 – 0.6 | 93.9 | 3.2 | 3.5 | 4 | 0.82 | −0.23 | 3.64 |
| >0.6 | 195.5 | 8.4 | 4.3 | 5 | 1.04 | 0.05 | 5.66 |
| Profile curvature | |||||||
| <−5 | 28.5 | 1.1 | 4.0 | 4 | 0.93 | −0.07 | 1.63 |
| −5–−3 | 22.4 | 0.9 | 4.0 | 4 | 0.97 | −0.03 | 2.29 |
| −3–−1 | 82.6 | 3.8 | 4.6 | 5 | 1.11 | 0.13 | 4.73 |
| −1–1 | 552.0 | 20.5 | 3.7 | 4 | 0.90 | −0.31 | 1.00 |
| 1–3 | 80.2 | 4.7 | 5.8 | 6 | 1.42 | 0.42 | 10.00 |
| 3–5 | 22.1 | 1.2 | 5.5 | 6 | 1.31 | 0.30 | 8.20 |
| >5 | 30.4 | 1.6 | 5.3 | 6 | 1.27 | 0.27 | 7.50 |
| Topographic Wetness index | |||||||
| <10 | 44.9 | 2.2 | 5.0 | 5 | 1.08 | 0.08 | 8.69 |
| 10–12 | 258.2 | 12.0 | 4.7 | 5 | 1.02 | 0.04 | 8.03 |
| 12–14 | 239.1 | 12.9 | 5.4 | 5 | 1.19 | 0.29 | 10.00 |
| 14–16 | 84.3 | 2.7 | 3.2 | 4 | 0.70 | −0.41 | 4.25 |
| 16–18 | 40.9 | 0.8 | 2.0 | 2 | 0.43 | −0.91 | 1.00 |
| >18 | 21.0 | 0.7 | 3.2 | 4 | 0.73 | −0.33 | 4.59 |
| Stream Power Index | |||||||
| <−2 | 106.6 | 2.4 | 2.3 | 3 | 0.54 | −0.70 | 2.08 |
| −2–1 | 66.9 | 3.0 | 4.4 | 5 | 1.08 | 0.09 | 8.56 |
| 1–4 | 415.5 | 20.7 | 5.0 | 5 | 1.20 | 0.44 | 10.00 |
| 4–7 | 159.1 | 6.4 | 4.0 | 4 | 0.97 | −0.04 | 7.22 |
| 7–10 | 53.1 | 1.0 | 1.8 | 2 | 0.45 | −0.85 | 1.00 |
| >10 | 16.9 | 0.4 | 2.4 | 3 | 0.57 | −0.59 | 2.41 |
Table 4.
Coefficients of landslide-related factors in the landslide ratio-based logistic regression analyses.
Table 4.
Coefficients of landslide-related factors in the landslide ratio-based logistic regression analyses.
| LRC Number | Coe* | LRC Number | Coe* | LRC Number | Coe* |
|---|---|---|---|---|---|
| elevation | geology | Plan curvature | |||
| 1 | —v | 1 | — | 3 | — |
| 2 | 0.510 | 2 | 0.026 | 4 | 0.487 |
| 3 | 1.123 | 3 | 0.281 | 5 | 0.662 |
| 4 | 1.487 | 4 | 0.784 | 7 | 0.841 |
| 6 | 1.889 | 5 | 0.821 | Profile curvature | |
| 10 | 2.327 | 6 | 0.892 | 4 | — |
| 11 | 2.483 | 7 | 0.978 | 5 | 0.065 |
| slope | 9 | 1.148 | 6 | 0.119 | |
| 1 | — | 11 | 1.124 | Topographic wetness index | |
| 3 | 0.632 | Land use | 2 | — | |
| 5 | 0.725 | 1 | — | 4 | 0.981 |
| 6 | 1.142 | 2 | 0.657 | 5 | 1.123 |
| 7 | 1.168 | 6 | 0.742 | Stream power index | |
| 8 | 1.392 | 11 | 1.183 | 2 | — |
| aspect | accumulated rainfall | 3 | 0.221 | ||
| 1 | — | 1 | — | 4 | 1.103 |
| 4 | 16.623 | 4 | 2.032 | 5 | 1.123 |
| 5 | 17.145 | 6 | 2.685 | Constant | −21.652 |
| 6 | 17.862 | 11 | 3.112 | ||
| fault density | proximity to the river | ||||
| 4 | — | 3 | — | ||
| 10 | −0.174 | 4 | 0.124 | ||
| 11 | 0.235 | 5 | 0.521 | ||
Note: Coe* means the coefficient of category in the twelve landslide-related factors from landslide ratio-based logistic regression analysis.
Table 5.
Weights of landslide-related factors based on the II method.
| Variables | Elevation | Slope | Aspect | Land Use | Accumulated Rainfall | Geology |
| S.D. | 5.538 | 4.843 | 3.856 | 6.140 | 3.920 | 3.500 |
| mean | 4.430 | 2.430 | 1.552 | 9.499 | 4.397 | 3.798 |
| variance | 79.941 | 50.083 | 40.246 | 154.713 | 112.178 | 108.520 |
| W.V. | 0.109 | 0.069 | 0.055 | 0.212 | 0.153 | 0.148 |
| Variables | Fault Density | Proximity to the Rivers | Plan Curvature | Profile Curvature | TWI | SPI |
| S.D. | 10.280 | 3.880 | 4.067 | 4.700 | 3.917 | 3.317 |
| mean | 4.425 | 0.740 | 1.303 | 0.837 | 1.318 | 1.315 |
| variance | 43.041 | 19.062 | 32.049 | 17.801 | 33.656 | 39.653 |
| W.V. | 0.059 | 0.026 | 0.044 | 0.024 | 0.046 | 0.054 |
Note: S.D. means the standard deviation, W.V. means the weighting value, TWI refers to the Topographic wetness index, and SPI refers to stream power index.
Table 6.
Confusion matrix of landslide susceptibility models using the four methods and in 2010 to 2014.
Table 6.
Confusion matrix of landslide susceptibility models using the four methods and in 2010 to 2014.
| Statistical Data between 4 Methods | Statistical Data from 2010 to 2014 | ||||||||
|---|---|---|---|---|---|---|---|---|---|
| LRBLR | FR | WOE | II | 2010 | 2011 | 2012 | 2013 | 2014 | |
| PLCR | 96.2 | 75.3 | 92.3 | 62.7 | 94.6 | 95.2 | 96.4 | 91.8 | 62.6 |
| PNLCR | 45.6 | 60.3 | 46.3 | 65.2 | 30.4 | 34.6 | 36.0 | 55.7 | 75.5 |
| MCR | 70.9 | 67.8 | 69.3 | 64.0 | 62.5 | 64.9 | 66.2 | 73.8 | 69.1 |
| PLWR | 3.8 | 24.7 | 7.7 | 37.3 | 5.4 | 4.8 | 3.6 | 8.2 | 37.4 |
| PNLWR | 54.4 | 39.7 | 53.7 | 34.8 | 69.6 | 65.4 | 64.0 | 44.3 | 24.5 |
| MWR | 29.1 | 32.2 | 30.7 | 36.1 | 37.5 | 35.1 | 33.8 | 26.3 | 31.0 |
Note: PLCR and PNLCR refer to the predicted landslide correct ratio and the predicted non-landslide correct ratio, respectively, PLWR and PNLWR refer to the predicted landslide wrong ratio and predicted non-landslide wrong ratio, respectively, and MCR and MWR refer to the mean correct ratio and mean wrong ratio, respectively.
Table 7.
The 3-day accumulated rainfall >500 mm records from 2008 to 2014 in the Chishan river watershed.
Table 7.
The 3-day accumulated rainfall >500 mm records from 2008 to 2014 in the Chishan river watershed.
| Year | The Rainfall Events with the 3-Day Accumulated Rainfall > 500 mm |
|---|---|
| Chishan station in the downstream watershed | |
| 2008 | 572 mm from 17 to 19 July |
| 2009 | 900 mm from 6 to 10 August |
| 2010 | No event |
| 2011 | No event |
| 2012 | 577 mm from 10 to 12 June |
| 2013 | 820 mm from 29 to 31 August |
| 2014 | No event |
| Jiaxian station in the midstream watershed | |
| 2008 | 1018 mm from 17 to 19 July and 618 mm from 13 to 15 September |
| 2009 | 2142 mm from 6 to 10 August |
| 2010 | 677 mm from 18 to 20 September |
| 2011 | No event |
| 2012 | 706 mm from 10 to 12 June |
| 2013 | 567 mm from 21 to 23 August and 852 mm from 29 to 31 August |
| 2014 | No event |
| Xingaokou station in the upstream watershed | |
| 2008 | 566 mm from 17 to 19 July, 883 mm from 13 to 15 September, and 601 mm from 28 to 30 September |
| 2009 | 2076 mm from 6 to 10 August |
| 2010 | No event |
| 2011 | No event |
| 2012 | 784.5 mm from 10 to 12 June |
| 2013 | No event |
| 2014 | 501.5 mm on 23 July |
Table 8.
The statistical data of landslide distribution from 2008 to 2014.
| Year | 2008 | 2009 | 2010 | 2011 | 2012 | 2013 | 2014 |
|---|---|---|---|---|---|---|---|
| N | 710 | 2389 | 2750 | 1551 | 1501 | 1957 | 1667 |
| A (km2) | 4.6 | 33.9 | 26.2 | 19.0 | 14.8 | 18.3 | 18.1 |
| OP (%) | — | 8.7 | 66.2 | 68.7 | 71.4 | 61.7 | 62.9 |
| NP (%) | — | 91.3 | 33.8 | 31.3 | 28.6 | 38.3 | 37.1 |
Notes: N and A refer to the landslide count and landslide area (km2), respectively, and OP and NP refer to the old and new landslide percentage (%), respectively.
Table 9.
The landslide ratio, new and old landslide percentages in the upstream, midstream, and downstream of the Chishan river watershed from 2008 to 2014.
Table 9.
The landslide ratio, new and old landslide percentages in the upstream, midstream, and downstream of the Chishan river watershed from 2008 to 2014.
| Watershed | 2008 | 2009 | 2010 | 2011 | 2012 | 2013 | 2014 |
|---|---|---|---|---|---|---|---|
| Old and New landslide percentage in the upstream watershed (%) | |||||||
| Old | — | 18.4 | 60.6 | 61.4 | 67.4 | 54.5 | 56.7 |
| New | — | 81.6 | 39.4 | 38.6 | 32.6 | 45.5 | 43.3 |
| Old and New landslide percentage in the midstream watershed (%) | |||||||
| Old | — | 4.5 | 72.6 | 77.1 | 76.6 | 78.0 | 76.0 |
| New | — | 95.5 | 27.4 | 22.9 | 23.4 | 22.0 | 24.0 |
| Old and New landslide percentage in the downstream watershed (%) | |||||||
| Old | — | 8.8 | 39.8 | 62.0 | 52.8 | 47.9 | 45.8 |
| New | — | 91.2 | 60.2 | 38.0 | 47.2 | 52.1 | 54.2 |
Table 10.
The correlation coefficients of landslide susceptibility models based on four methods.
| Landslide Susceptibility Models | LRBLR | FR | WOE | II |
|---|---|---|---|---|
| LRBLR | 1.000 | 0.838 | 0.924 | 0.782 |
| FR | 0.838 | 1.000 | 0.807 | 0.886 |
| WOE | 0.924 | 0.807 | 1.000 | 0.763 |
| II | 0.782 | 0.886 | 0.763 | 1.000 |
© 2019 by the author. Licensee MDPI, Basel, Switzerland. This article is an open access article distributed under the terms and conditions of the Creative Commons Attribution (CC BY) license (http://creativecommons.org/licenses/by/4.0/).
Share and Cite
MDPI and ACS Style
Wu, C. Landslide Susceptibility Based on Extreme Rainfall-Induced Landslide Inventories and the Following Landslide Evolution. Water 2019, 11, 2609. https://doi.org/10.3390/w11122609
AMA Style
Wu C. Landslide Susceptibility Based on Extreme Rainfall-Induced Landslide Inventories and the Following Landslide Evolution. Water. 2019; 11(12):2609. https://doi.org/10.3390/w11122609
Chicago/Turabian StyleWu, Chunhung. 2019. "Landslide Susceptibility Based on Extreme Rainfall-Induced Landslide Inventories and the Following Landslide Evolution" Water 11, no. 12: 2609. https://doi.org/10.3390/w11122609
Note that from the first issue of 2016, this journal uses article numbers instead of page numbers. See further details here.