Sub-Daily Rainfall Intensity Extremes: Evaluating Suitable Indices at Australian Arid and Wet Tropical Observing Sites

School of Earth, Atmosphere and Environment, Monash University, Melbourne 3800, Australia
Water 2019, 11(12), 2616; https://doi.org/10.3390/w11122616
Submission received: 10 September 2019
/
Revised: 8 December 2019
/
Accepted: 9 December 2019
/
Published: 11 December 2019
(This article belongs to the Section Hydrology)
Abstract
:Rainfall intensity extremes are relevant to many aspects of climatology, climate change, and landsurface processes. Intensity is described and analysed using a diversity of approaches, reflecting its importance in these diverse areas. The characteristics of short-interval intensity extremes, such as the maximum 5-min intensity, are explored here. It is shown that such indices may have marked diurnal cycles, as well as seasonal variability. Some indices of intensity, such as the SDII (simple daily intensity index), provide too little information for application to landsurface processes. Upper percentiles of the intensity distribution, such as the 95th and 99th percentiles (Q95 and Q99) are used as indices of extreme intensity, but problematically are affected by changes in intensity below the nominated threshold, as well as above it, making the detection of secular change, and application to sites with contrasting rainfall character, challenging. For application to landsurface processes, a new index is introduced. This index (RQ95), is that intensity or rainfall rate above which 5% of the total rainfall is delivered. This index better reflects intense rainfall than does Q95 of even 5-min accumulation duration (AD) rainfall depths. Such an index is helpful for detecting secular change at an observing station, but, like Q95, remains susceptible to the effects of change elsewhere in the distribution of intensities. For understanding impacts of climate and climate change on landsurface processes, it is argued that more inclusive indices of intensity are required, including fixed intensity criteria.
1. Introduction
Rainfall intensity is a functionally-important aspect of rainfall arrival at the landsurface, but one whose characteristics are challenging to quantify. Intensity influences many hydrological processes of importance to society, including urban drainage problems, the triggering of mass movements, and important ecosystem functions [1,2,3]. Rainfall intensity also exerts an important influence on soil erosion processes and rates [4,5], though in some situations amount has been found to be more important than peak intensity [6], and generalisation is difficult given the many influencing factors involved in erosion processes. Secular change in rainfall intensity is one of the expected but incompletely-known aspects of climate change, connected with invigoration of the hydrological cycle. There are widely divergent findings in this area, including both significantly increasing and decreasing secular changes in intensity, as well as many reports of no detectable change [7,8,9]. At least part of the variability of results may be linked to the different indices used to express rainfall intensity. Given that rain is highly intermittent in time, the use of daily rainfall amounts to infer intensity changes [10,11] contributes to uncertainty in interpretation.
Owing to the diversity of contexts in which it is important, rainfall intensity has been analysed and reported using a corresponding diversity of data and methods, which can yield different characterisations of the same rainfall records. In studies of the secular changes in climate, for instance, the simple daily intensity index (SDII; [12,13]) finds wide application. This index is simply the total rainfall depth over a period such as a month or a year, divided by the number of rain days in that period; it is therefore the mean wet day rainfall. This is perhaps more correctly described as a measure of the wetness of rain days, and can only be loosely connected with the actual intensity when raining, since rain commonly falls for only a part of each rain day [14,15]. Locations with different degrees of rainfall intermittency (or different variance of rainday intensities) may exhibit different intensities when raining, even if their SDII values are the same. Therefore, whilst the SDII is a useful index in secular change studies, it provides too little resolution of true intensity for investigating phenomena such as water partitioning at the landsurface [16], and others mentioned above, which have a marked dependence on the actual short-term values of intensity, intermittency, and other rainfall properties that may vary over periods of <<1 h. For instance, [17] observed that the concentration time for many storm events over urban catchments was in the range 15–30 min, and intensities on such timescales must be quantified. Likewise, crop growth is influenced by aspects of the rainfall intensity and frequency, and not merely the accumulated rainfall amount, because of the way in which these affect the entry of water into the root zone [18]. Consequently, [19] noted that “the impact of a rainfall event depends on how it unfolds [that is, on the intensity as it varies from moment to moment] as much as on the final rainfall tally.” and similarly, [20] observed that “rainfall intensity is more important than the accumulative rainfall”.
The difficulty of recording rainfall intensity contributes to the many different metrics used to report it. The wide range of methods cannot be reviewed here. It is clear that the true rainfall intensity at a point—that is, the instantaneous rate of arrival of rain—is difficult to estimate using commonly-used methods such as tipping bucket rain gauges (TBRGs). More often, the total rainfall amount recorded during an accumulation duration (AD), such as an hour, is used to derive what is best referred to as a ‘rainfall rate’ that is conditional on that AD: that unvarying rate of arrival that would yield the observed rainfall depth in the corresponding AD. Such unvarying rainfall rates are not present during actual rainfall; rather, intensity fluctuates and, at intervals, rainfall may cease and then resume (rainfall intermittency). Such phenomena are partially or wholly concealed in data that have been temporally aggregated and this raises the issue of by what measure intensity is best characterised. The decline in apparent rainfall rates with increasingly long ADs has been widely documented [21], and in recognising this effect, many studies of extreme rainfall explore the statistics using multiple ADs from 1 h to 24 h [22,23], in which diminution of intensity in the longer ADs is highlighted. Long duration ADs of 1 h, several hours, or 1 day, remain in use to describe rainfall extremes [24,25,26,27,28,29,30,31,32,33,34,35], even though these lack the resolution to reveal actual rainfall intensities.
Among the sub-daily ADs, hourly rainfall totals synchronised with clock time are perhaps the most widely-available. However, these are likely to mis-represent the maximum intensity of many important convective rainfall events, since, as emphasised by [36] these cannot be expected to peak exactly between two clock hours.
In the context of climate change, and for studies of landsurface processes, a key aspect of rainfall intensity is the upper end of the distribution of intensities-the extremes of intensity-which may drive hazardous processes, and which may show the largest intensification in warmer future climates. However, sustained moderate intensities may also trigger flooding and mass movements, but with less rapid onset. Even the proportion of rainfall at the lower end of the intensity range, which can be lost to evaporation from wet foliage and litter, affects the net or effective rainfall that reaches the ground beneath forests and crops; net rainfall in turn affects stream hydrographs [37]. The proportion of rainfall arriving at very low intensity is important additionally because it is ineffective at producing groundwater recharge, which instead is most active in wet spells well above the median monthly rainfall [38,39,40]. Extremely high monthly rainfall amounts may be required for major episodes of groundwater recharge, especially in drylands [41], and yet the likely effect on recharge rates and amounts of altered rainfall intensities linked to climate change is unclear [42]. Taken as a whole, these observations confirm that the entire distribution of rainfall intensities is of relevance to landsurface and ecological processes; nevertheless, extremes of intensity may be particularly important. Evidently, multiple indices of rainfall intensity may be needed to capture aspects important to the diverse landsurface processes that are affected by intensity.
For the kinds of reasons just sketched, in studies of secular rainfall change, measures of short-term rainfall intensities toward the upper tail of the distribution are widely used. An additional motivation is the expectation that intensification of the hydrologic cycle will involve increased moisture-holding capacity of warmer air, as described by the Clausius–Clapeyron relation [43]. In convective rainfall, which is of relatively high intensity, significant further intensity increases are envisaged. As noted above, the time-aggregation of rainfall data may partially mask this effect, such that sub-hourly data can exhibit super-CC scaling that may not be evident in hourly or daily data [44,45]. For this reason, intensity changes in rainfall recorded over sub-hourly ADs, commonly as brief as 5 min, have been widely investigated in attempts to explore the link between temperature and extreme rainfall intensity [46,47,48,49,50]. Diverse indices, such as the wettest 6 min or 12 min per rain day, month, or year, have been used in this work [51,52], but rainfall tallied using ADs of 5, 10, 15, 30, and 60 min has also been widely explored [17,53,54]. Despite the diversity of indices of intensity, it has become clear that secular change in intensity can differ in magnitude among the seasons as well as geographically [36,55].
This paper attempts to explore further the statistics of the high-intensity tail of the distribution of rainfall intensities, using data having an unaggregated time resolution of 1 s. Data having high temporal resolution (<<hourly) remain relatively uncommon; it is informative to explore the properties of the short-term intensities revealed by such data, in which minimal intensity information is lost. A beneficial aspect of short intervals of intense rain is that they are less likely to be affected by intermittency than corresponding intervals of low intensity, when there is a greater likelihood that rain may stop and start, and when, in any case, the continuity of rainfall is more difficult to assess from TBRG data. In contrast, uncertainty in hourly or other aggregated data arises because a rain hour might in fact have contained just 6 min of rainfall, or 60 min—such that for the same rainfall amount, the 6-min period would reflect an intensity 10 times higher than would be suggested by the hourly total. Furthermore, six minutes of intense rainfall is far more likely to have comprised continuous rainfall, and the timing of rainfall arrival will be recorded with less uncertainty in TBRG data owing to the short bucket filling time under intense rainfall.
In summary, rainfall intensity estimates are required for a number of purposes. These include the following:
- Exploring the dependence of the most intense rainfalls on temperature (dry bulb or dew point) and possible secular change of intensity under global warming;
- Climatological description and the provision of necessary intensity and duration information for planning of urban drainage systems, including assessment of secular intensity change;
- To assist in understanding the triggering of mass movements, the drivers of soil erosion, and related phenomena;
- For hydrologic applications, including research on water partitioning, infiltration, canopy interception, and others.
Many of these areas of application require sub-hourly intensity data, which, as noted above, are relatively under-explored owing to limited availability. The specific questions addressed here, in seeking to address this aspect of the intensity problem, are as follows:
- What diurnal and seasonal variability is shown by intensity data at 5, 15, 30, and 60 min ADs? The objective in exploring this is to document the nature of the population of such intensities, which is the little-explored context (the statistical population) from which measures of extremes are sampled. To what extent do the patterns of variability differ between arid and very wet observing sites?
- Is the widely-used index of extreme rainfall, the 95th percentile of rainfall amounts (or equivalently, intensities) over short ADs [23,39], a meaningful index for application of intensity data to landsurface processes? Might an index based on rainfall amounts delivered above an intensity threshold (RQ95, introduced below) be more informative?
- To what extent can descriptors of extreme rainfall intensity that rely on percentiles of a wide distribution of intensities, and which are therefore not associated with any fixed intensity, be used to compare the rainfall climates of wet and dry locations, or to detect secular change in intensity?
The remainder of this paper is structured as follows: to provide additional context, a brief commentary on methods used to identify and report measures of intensity extremes is presented first. The data sources used and the analyses undertaken are then presented, followed by key results from two field observing sites. The interpretation of the results, including similarities and differences between the sites, and an evaluation of the Q95 and RQ95 indices of intensity extremes, is then discussed, followed by some conclusions drawn from the work.
Short AD Rainfall Data as Measures of Rainfall Intensity Extremes: Approaches and Indices
Various reasons for preferring to derive intensity data from short (sub-hourly) ADs were noted above. The nature of the rainfall process itself provides additional justification for this.
Intense convective cell lifetimes can be quite short, and may require sub-hourly rainfall data for the characterisation of their intensity. For instance, [56] devised a tracking method in a Lagrangian framework, in order to follow rainfall intensity during the lifetime of convective cells. Most cells had lifetimes of <1 h, and showed highest intensities at about 0.3 of the event duration (i.e., ~15–20 min into the lifetime of the rainfall event). In light of this kind of behaviour, in a growing number of studies, sub-hourly data are used to characterise rainfall extremes [51,52,53,54,57,58,59,60,61]. In a recent study, for instance, [62] used 10 min data (as well as these data aggregated further to yield 30 min and 60 min totals) in a study of extreme rainfall in Sicily. When such high-resolution data are available, diurnal and seasonal cycles can be investigated, in order to show what information is masked when hourly or daily aggregated data are analysed, and what resolution is consequently sacrificed using other approaches (e.g., the annual series). The exploration of diurnal and other variations in rainfall intensity therefore form a component of the present paper. However, it is important to note that even when high-resolution data are available, in some studies the data are processed as though they are drawn from a single statistical population, ignoring diurnal and seasonal variations, type of precipitation (convective or stratiform), intermittency, and other factors. For instance, [63] pooled 5 min rainfall data from six German observing stations, each with ~30 years of data, to form a composite record 190 years in length. They then averaged the mean intensity for each AD (5, 10, 15, 30, 60 min and longer periods of hours) in this long record. Clearly, the statistics from such pooled data would subsume whatever diurnal and seasonal variability had been present in the original data.
Rainfall data collected with short ADs (sub-hourly) become voluminous in observing station records of even moderate length. Various approaches to extracting statistical measures of extreme intensities are therefore used. The use of fixed intensity thresholds is frequently rejected as being unsuitable when rainfall characteristics are widely variable among the large sets of observing station data (e.g., [64,65]). These might span arid to wet tropical climates. The use of single maxima, such as the largest 10-min or 30-min rainfall amount in each year of record, forms an ‘annual series’. Also common is the peak-over-threshold (PoT) approach, in which some intensity or rainfall amount is set, above which multiple events are tallied as a measure of extremes. This approach can generate several values for each year of record (a ‘partial series’). One problem with the PoT approach is that more than one AD may be selected per day [66], which reduces the likely independence of the successive samples. An advantage is that multiple values can be derived from each calendar year of data, providing a larger sample for the estimation of statistical characteristics.
In many studies, particular percentiles of the distribution of intensities (here symbolised ‘Q’, for quantile), derived using various ADs, are used as indices of extreme intensity. These include Q90, Q95, Q98, Q99, and Q99.9 [57,59,62,67,68,69,70]. These percentiles, most commonly Q95, are also frequently adopted as a threshold to be used in generating partial-series data using peak-over-threshold (PoT) methods. Generally, in that case Q95 is based on pooled, long-term station data. For studies seeking to detect secular change that might be a component of climate change, measures such as those nominated by the ETCCDI (Expert Team on Climate Change Detection and Indices) [71], which include the largest one-day and five-day rainfalls (RX1day, RX5day), SDII, and the number of days receiving more than 10 mm or 20 mm (R10 mm and R20 mm) are employed. In studies of mass movement, surface hydrologic processes such as infiltration and runoff, and soil erosion, short-term measures of intensity find wide application [72]. These are typically the maximum intensity recorded in 5 min (I5), 10 min (I10), 15 min (I15) or 30 min (I30), though other ADs are used. The index I30 is particularly widespread [73], having been shown to have predictive power for plot-scale soil erosion, and incorporated as a key parameter in the Unified Soil Loss Equation (USLE) developed in the USA in the mid-twentieth century, and still widely-used internationally in the revised (RUSLE) form [74]. Sort-term intensity indices such as I30 are also frequently applied in studies of the triggering of landslides, debris flows, and other mass movements [73]. Yet other indices seek relevance to ecosystem function and impacts, an example being the ‘cumulative hydroclimatic stress index’ (CHS) which takes extreme rainfalls to be those exceeding the Q99.9, but which also considers periods of low rainfall [3].
A key difficulty that arises in the use of percentiles as criteria for what is extreme intensity is that percentiles are affected by the entire distribution of data, not just the values in the positive tail. Thus, the value of Q95 would change if more rain fell at intensities exceeding Q95 or if, for instance, dry periods were to occupy more of the record at lower percentiles, or if the intermittency of rainfall changed with no change in total rainfall, with fewer wet ADs but with larger rainfall totals. This would occur even if the changes in rainfall arrival were wholly restricted to intensities below the Q95 intensity. This problem with the use of percentiles, though explored in the context of wet and dry daily AD data [75], appears not to have been evaluated in the case of sub-daily extremes and their distribution. The authors of [75] demonstrated that, because upper percentiles are affected by the distribution of less intense rainfalls, an apparent change in indices such as Q95 could arise from a change in the wet day fraction, with no actual increase in the intensity extremes.
Furthermore, data can become very scarce in the tail of the intensity distribution (e.g., in assessing Q99 or Q99.9), and the distribution is often fat-tailed, which limits the extent to which extreme percentiles of intensity can be distinguished with confidence. An alternative, involving percentiles of the rainfall amount, rather than of the ADs themselves, is explored below.
2. Materials and Methods
2.1. Field Sites and Data Collection
Data from two Australian field observing stations are analysed, one near the township of Millaa Millaa in the wet tropics of far northern Queensland (hereafter MM) and one located in the dry climate of the Fowlers Gap Arid Zone Research Station (hereafter FG), in arid western New South Wales. Both locations were equipped with tipping-bucket rain gauges and event data loggers which stored the Gregorian date and time of each bucket tip event with a resolution of ~1 s. Gauge sensitivities were 0.2 mm (MM) and 0.5 mm (FG).
MM has a wet tropical climate, with a wet season that extends from about December to June, and a dry season in which the driest months are August and September. The observing station was located in the uplands that lie immediately inland from the coast, at an elevation of about 700 m. Mean annual rainfall at the site is about 2500 mm.
FG has a continental dryland climate, exhibiting a less regular seasonality of rainfall, with a smaller amplitude from wettest to driest months. The mean annual rainfall is about 220 mm.
The field data span 9.5 years at FG (total rainfall 2676 mm) and 3.3 years at MM (total rainfall 9148 mm), with no missing data.
2.2. Data Processing
The data logger files of bucket tip events were converted to Modified Julian day numbers, using subroutines from the International Astronomical Union ‘Standards of Fundamental Astronomy’ time and date algorithms (http://www.iausofa.org/index.html), and all data processing involving the Julian calendar was performed using double-precision arithmetic.
The unaggregated inter-tip times (ITTs) of the TBRGs used for some analyses provide the highest temporal resolution (and lowest loss of rainfall intensity information) from this kind of pluviography. The data were also aggregated to various accumulation durations (ADs), including 5-min, 15-min, 30-min, 60-min, and 24 h. Upper percentiles of the distributions were extracted as measures of extreme intensity. Some useful properties of an alternative index, RQ95 (the 95th quantile of the cumulative distribution of rainfall amounts ranked according to intensity) is documented. This proposed index is expressed in mm h−1 (rainfall intensity) units. It quantifies that intensity above which 5% of the total rainfall (in a season, year, or longer period of record) is delivered. In contrast, the conventional Q95 index of intensity expresses the rainfall intensity that is exceeded by 5% of recorded intensities. The utility of both indices is considered later in the context of the field data. Counts of rain days and rain hours were made as required for certain analyses reported below. A rain day was taken to be a day on which any rain was recorded (thus the minimum amount is 0.5 mm at FG and 0.2 mm at MM).
3. Results
3.1. Seasonal Distributions of Short-AD Rainfall Intensities
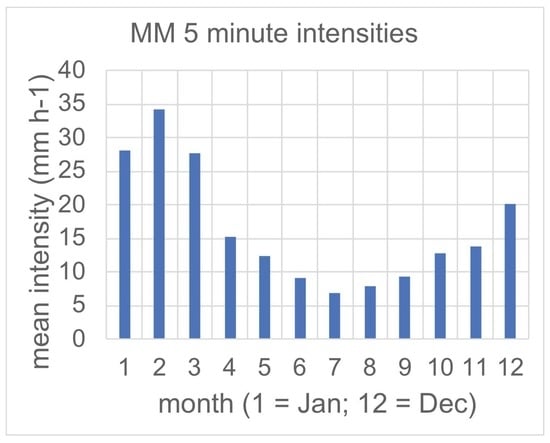
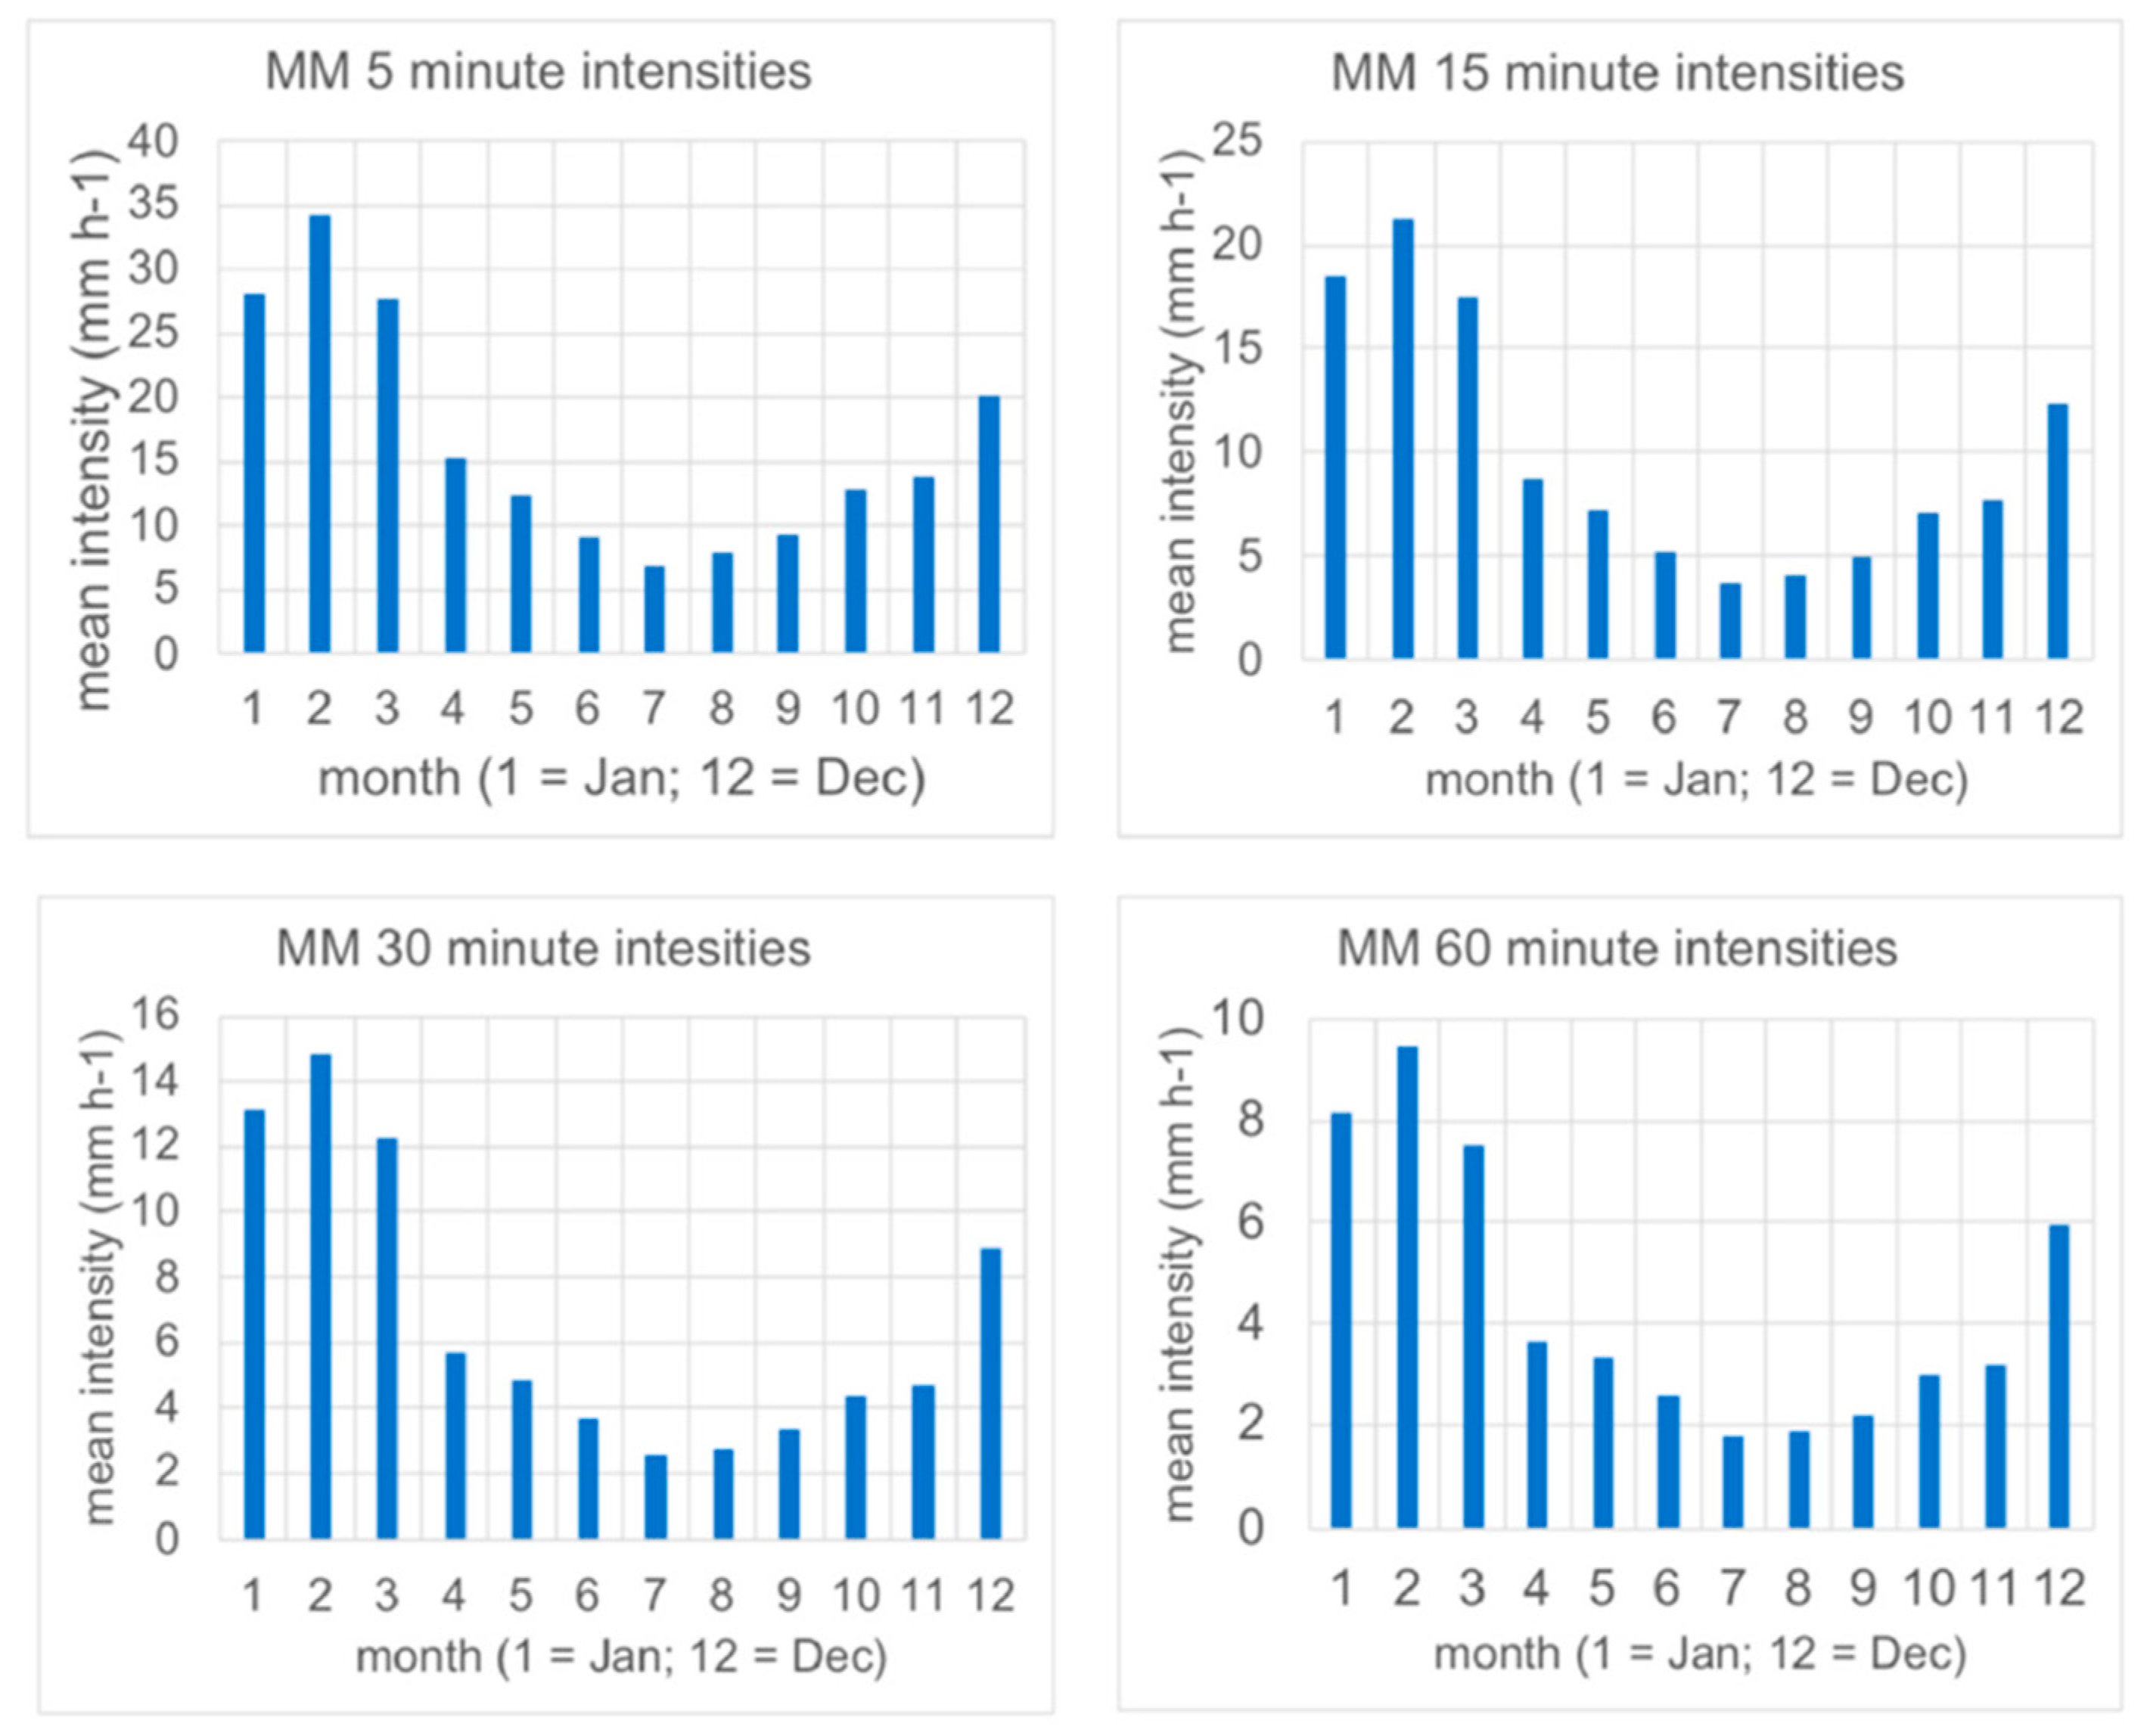
Rainfall intensity characteristics averaged by month for both FG and MM were investigated using 5-min, 15-min, 30-min, and 60-min ADs. All ADs exhibited clear annual cycles of rainfall intensities (Figure 1 and Figure 2). The pattern at MM involves maximum intensities in February (the last month of summer but often the warmest) and minima in June–July (winter), presumably linked to the more frequent occurrence of convective mechanisms in the warm season, as has been found elsewhere [76]. At FG, the pattern is similar though slightly less regular (Figure 2).
Though at MM (Figure 1) February is the month with the highest average intensity across 5–60 min ADs, individual ‘top 10’ daily maxima among the 790 rain days occur in the four months January to April. Therefore, whilst the seasonal distribution graphs suggest that an annual maximum I5, for instance, likely reflects intensity in February, it may occur in other months. The February peak simply indicates that the mean I5 is highest in that month. A long period of record would be required to assess the frequency with which the annual maximum I5 or other short AD intensity occurred in particular months. Such data are not available for the field locations studied here; in any case, the statistics may not exhibit stationarity in long records.
The amplitude of the intensity variation through the year declines for increasing ADs. For 5-min ADs, the amplitude is ~21 mm h−1 but declines to ~6 mm h−1 for 60-min data. Thus, seasonal variability is damped in the data at longer ADs, and the variance of intensity appears smaller.
3.2. Diurnal Cycle of Short-Duration Intensity Extremes
Diurnal cycles of intensity for short ADs have rarely been analysed. Clearly evident diurnal cycles for the maximum value of 5-min, 15-min, 30-min, and 60-min AD data, processed to yield means for each hour of the day using all rain days recorded for each month in the entire record, were found for MM (Figure 3). Though exhibiting less regularity than the seasonal cycles discussed above, the hourly intensities show an afternoon peak in intensity at 16:00–17:00 h, and a morning minimum at 10:00 h. The amplitude of the diurnal cycle diminishes with AD as expected. It is 21.2 mm h−1 for 5-min AD and declines to 7.7 mm h−1 for 60-min AD data.
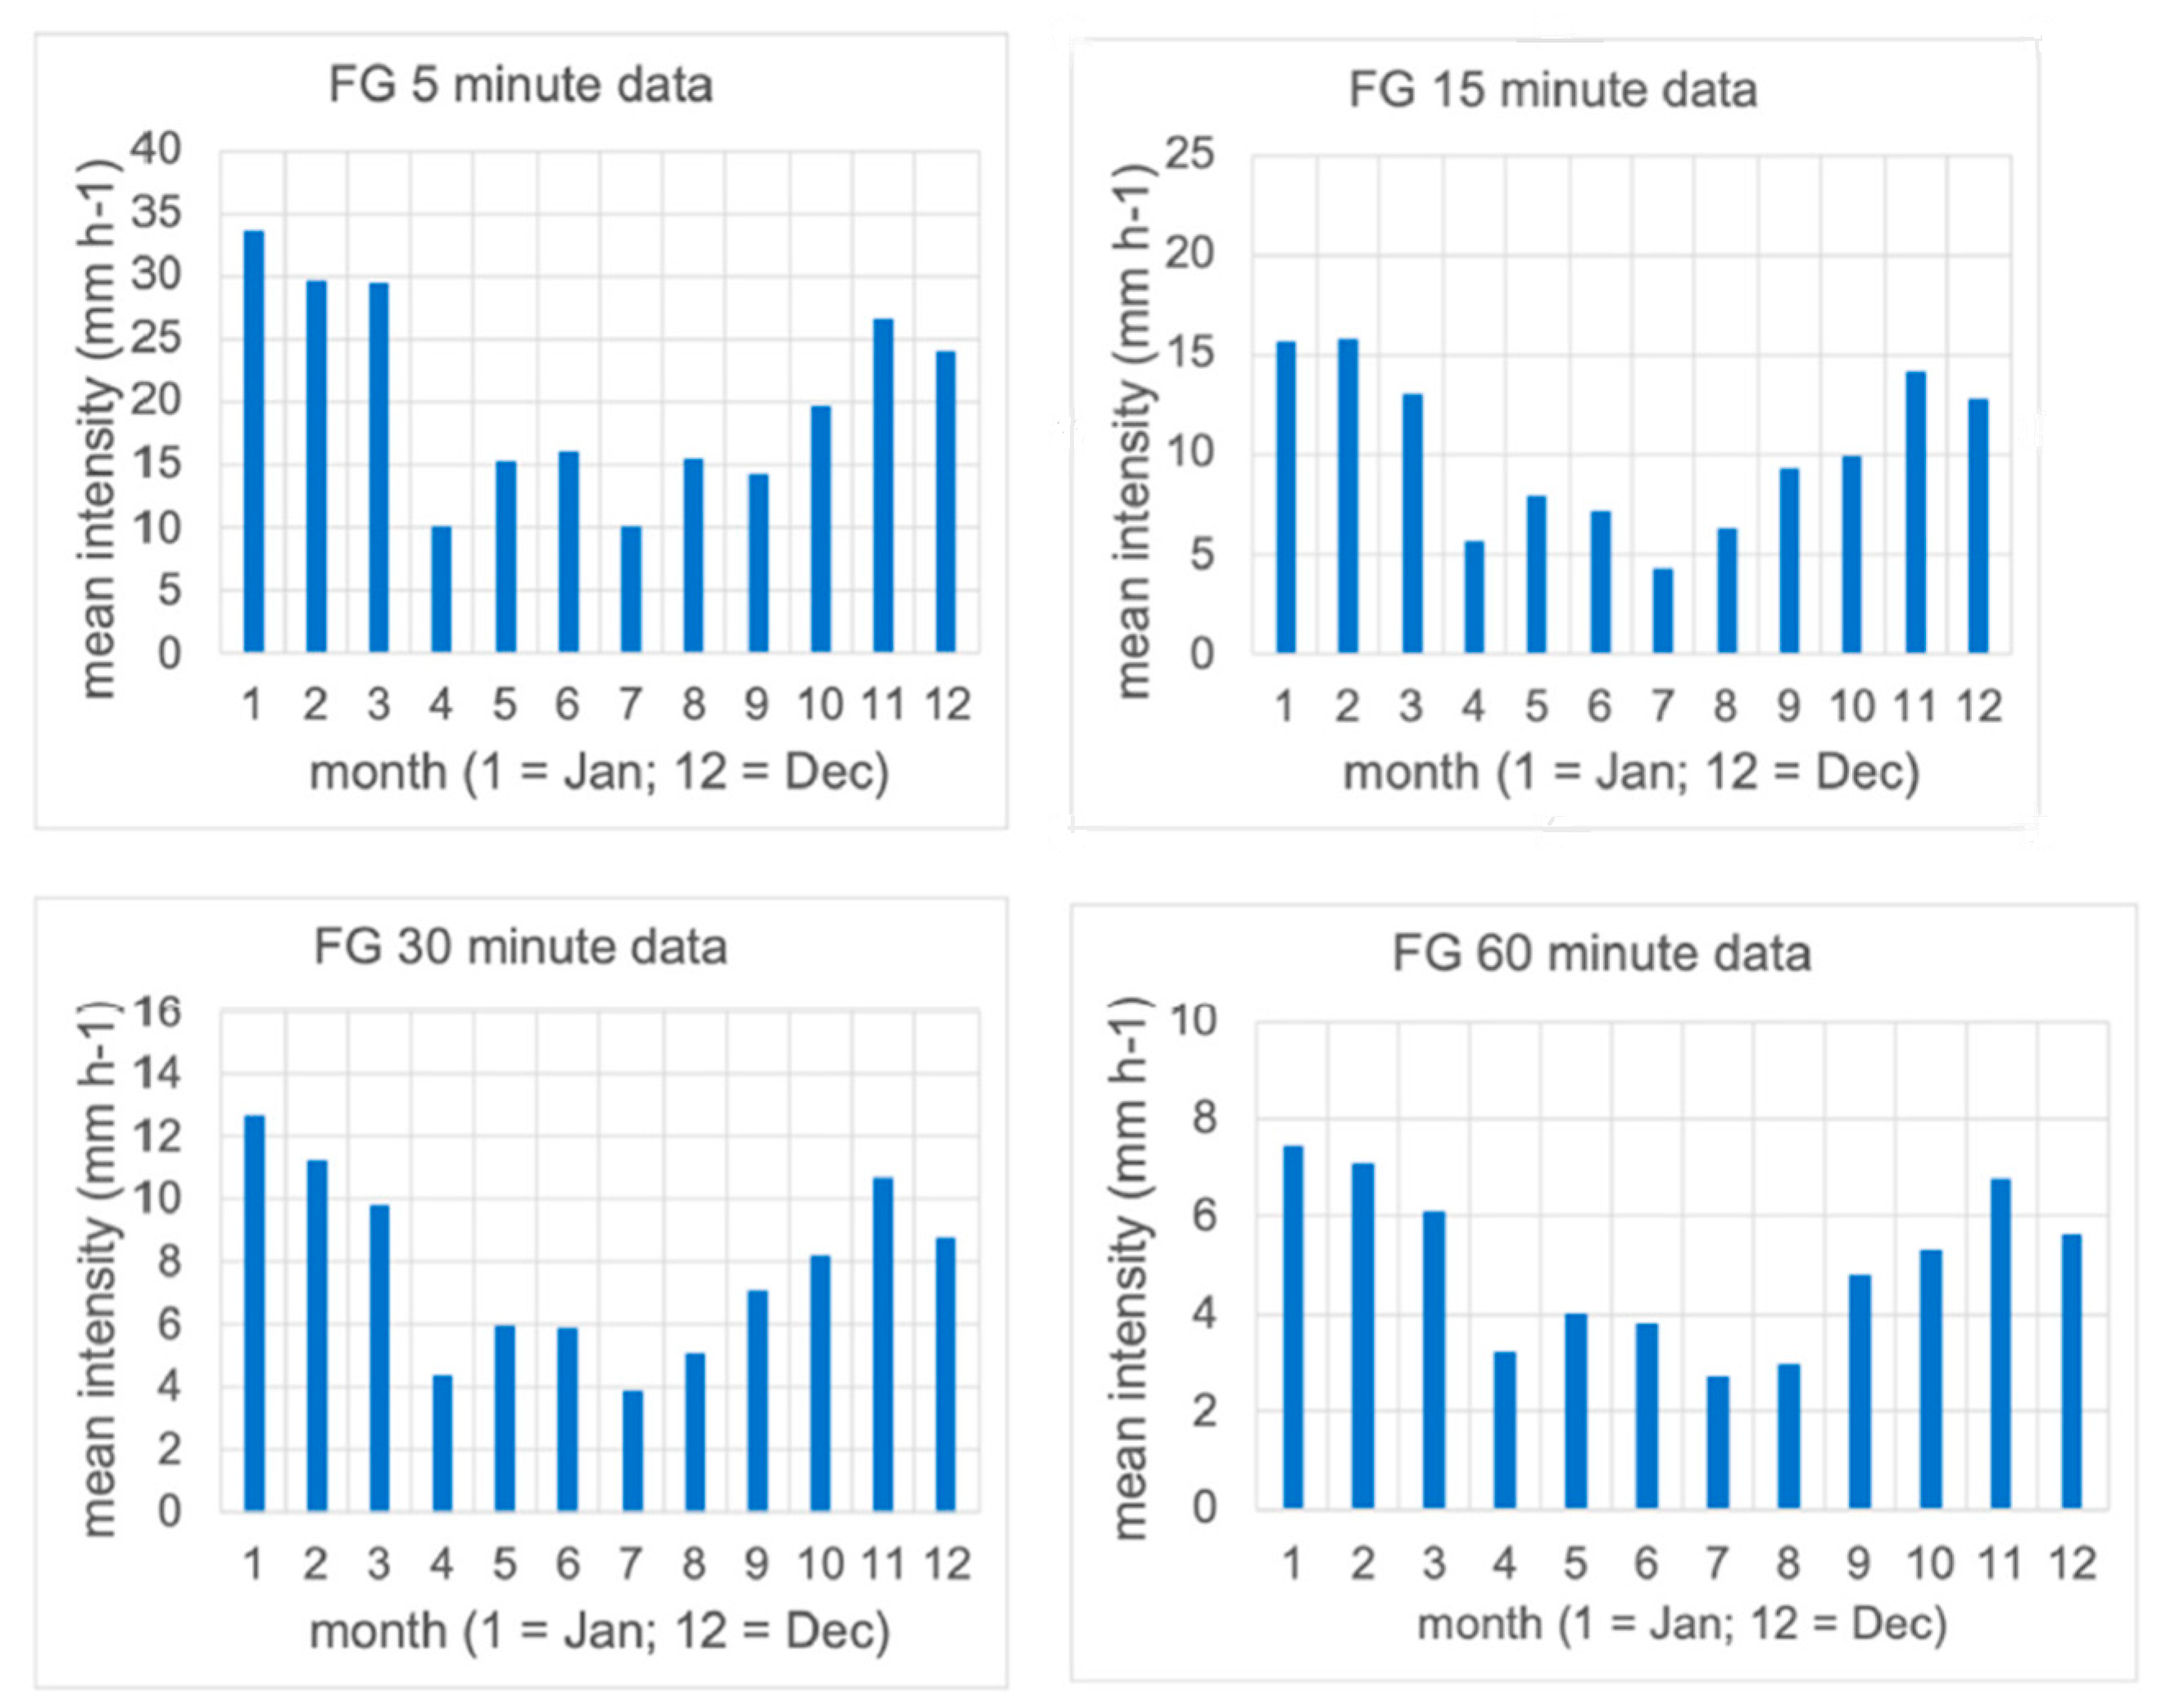
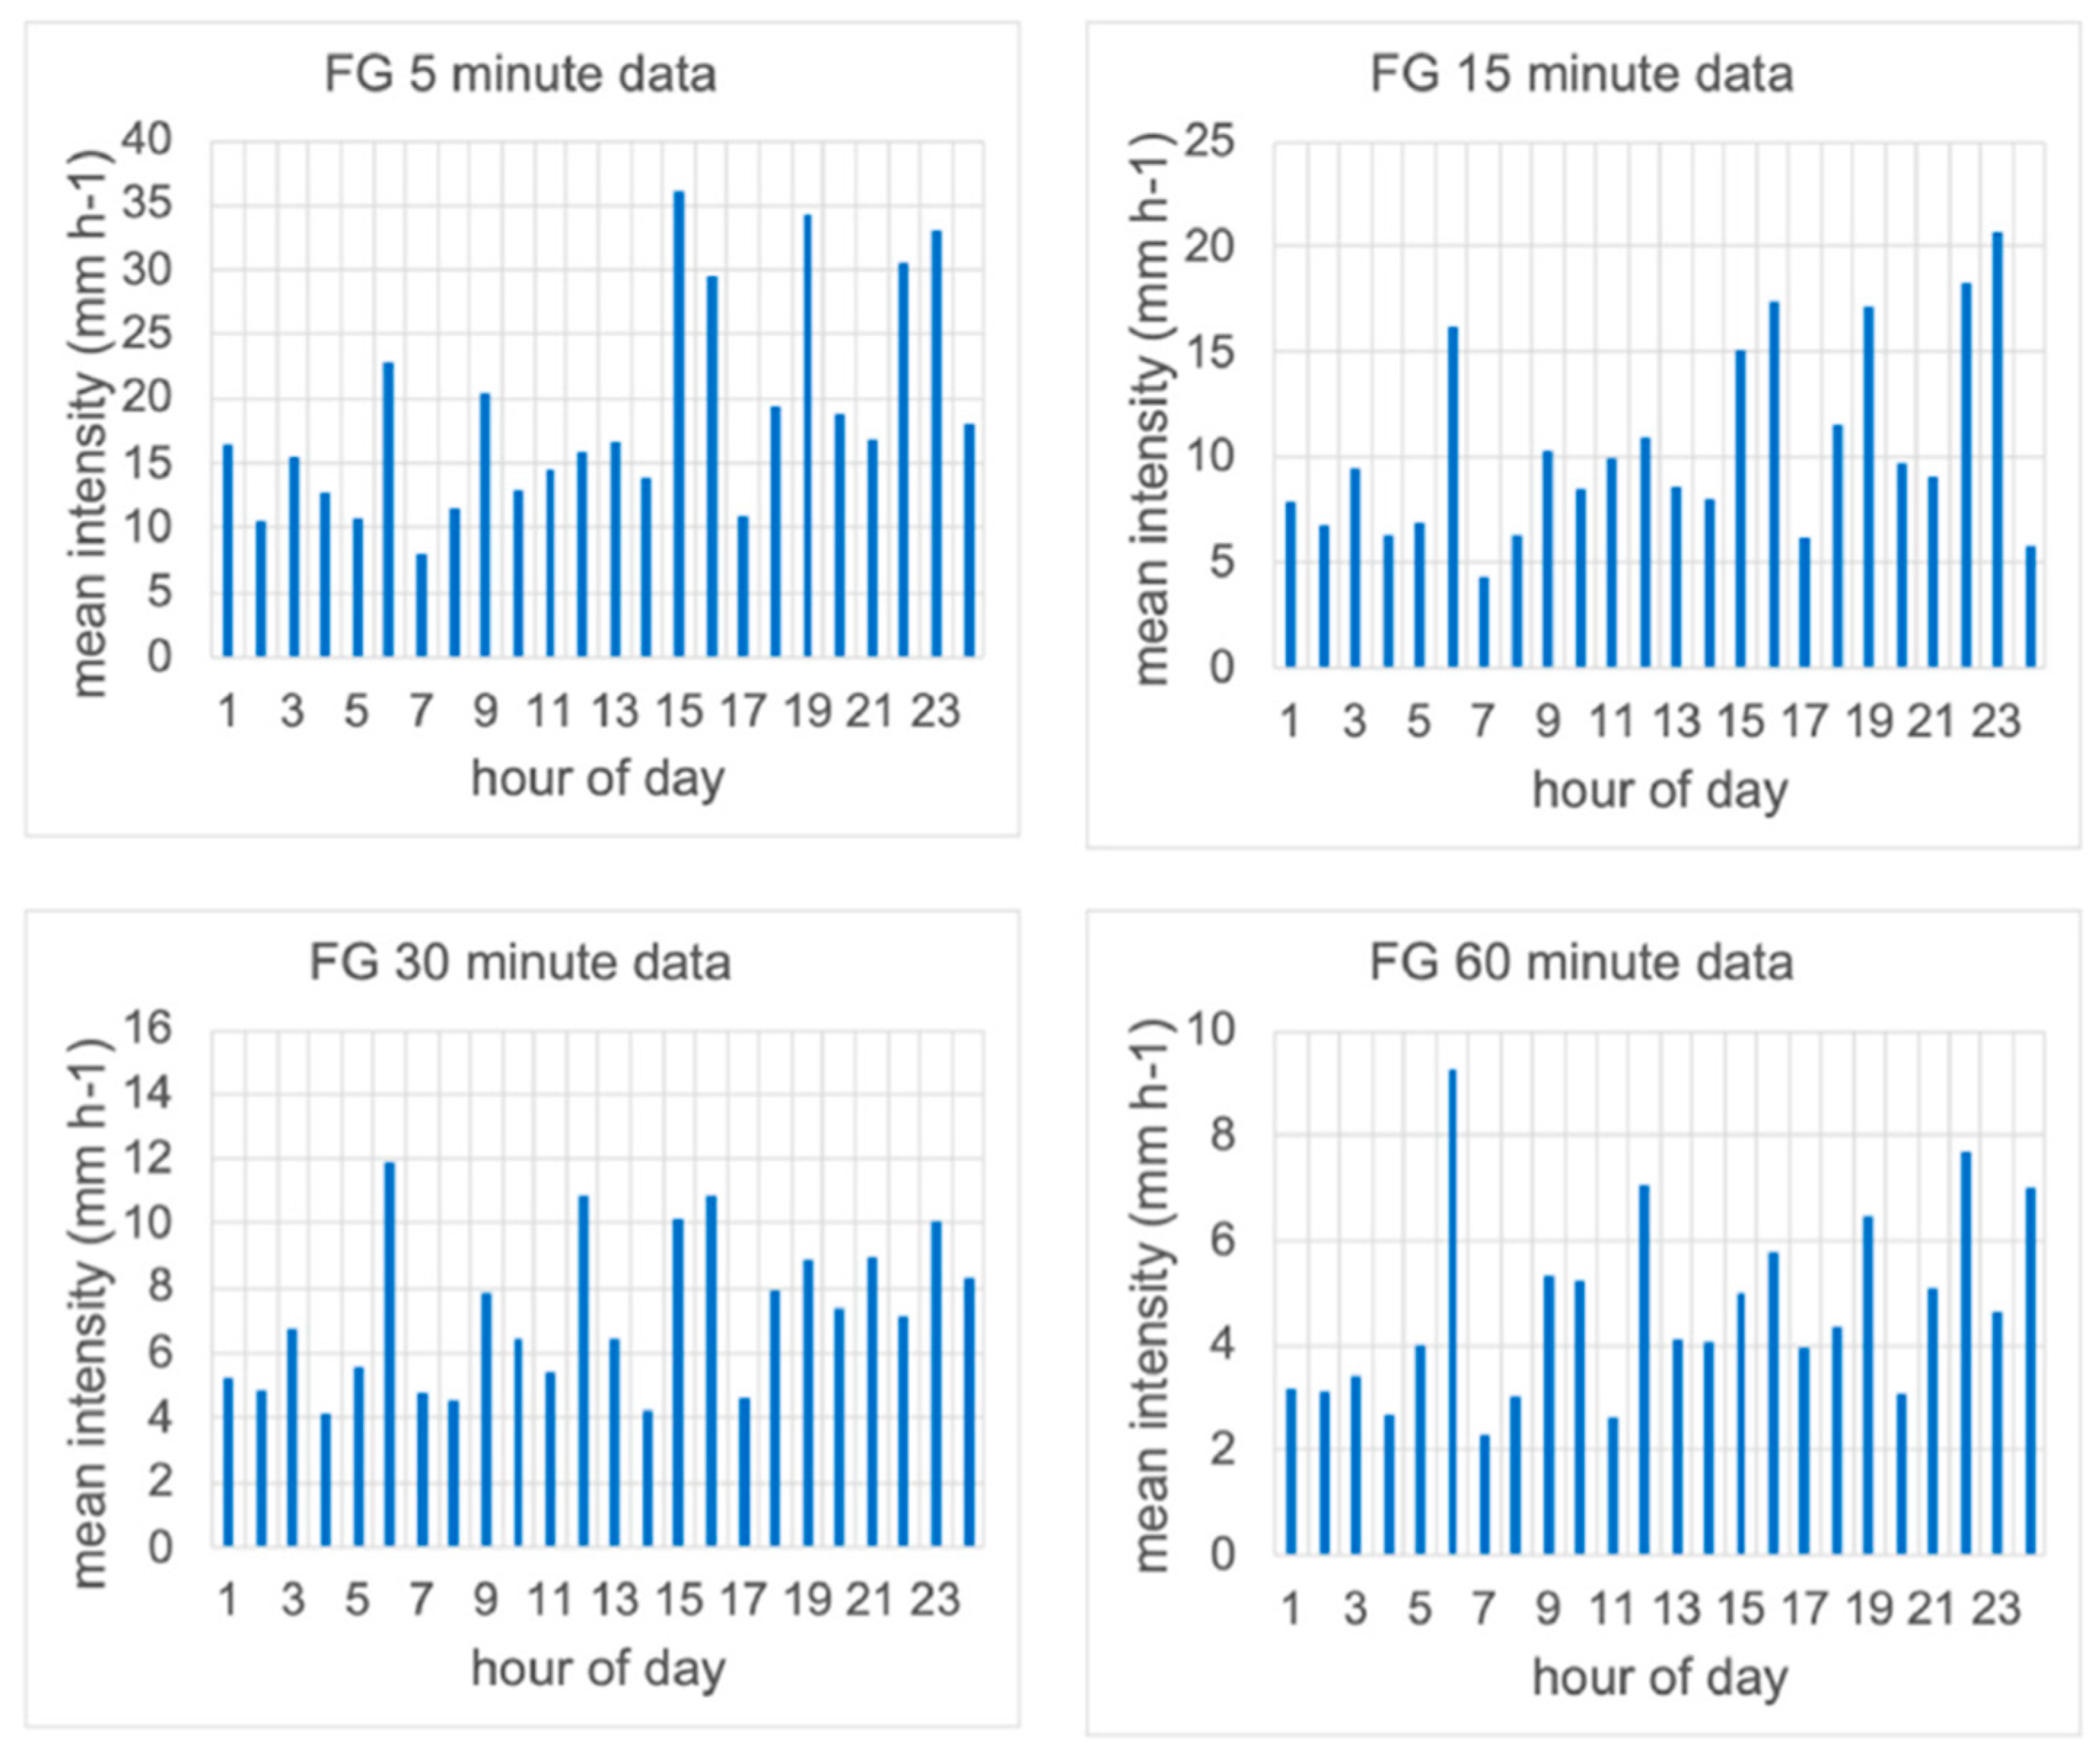
The diurnal variation was less regular at FG (Figure 4). Nevertheless, a morning minimum and a tendency for intensity maxima in the afternoon and evening are evident. The timing of the maximum intensity is variable—it occurs at 15:00 h in the 5-min AD data, 23:00 in the 15-min AD data, but moves to a morning peak at 06:00 in the 30-min and 60-min AD data. In the 5-min AD data, the amplitude of the diurnal cycle is 28 mm h−1, which is somewhat larger than at MM.
The diurnal cycles can be revealed in mean rainfall intensities of pooled data from the 790 rain days at MM, for the various ADs. Two examples are shown in Figure 5 (15-min and 60-min ADs). These suggest two intensity minima per diurnal cycle-the first at 10:00 h and the second late in the evening at 21:00–22:00 h. The two maxima that are suggested in these data are the afternoon peak at 14:00–19:00 h and a secondary morning intensity peak (whose intensity is only about 75% of the afternoon intensity maximum).
It has to be remembered that rain hours typically contain some rainless time. Elsewhere, the author [15] has reported that afternoon rainfall tends to exhibit higher intermittency, which reaches a minimum during the early morning intensity peak. Therefore, true intensities in the afternoon are higher than suggested by the data of Figure 5.
3.3. The 5-min and Unaggregated ITT Intensity Data: Full Period of Record
As noted earlier, in the analysis of intensity extremes, the distribution of intensities is often characterised using one or several of the upper percentiles of the pooled data. The shortest ADs yield the least loss of intensity information, and 5-min AD data are explored here for that reason. The goal of the descriptions that follow is to characterize the rainfall intensity at MM and FG in terms of mean and maximum intensity, and to identify the field site that is characterized by the more intense rainfall.
At MM, there were 20,946 5-min ADs with rain. Expressed as equivalent hourly intensities, the mean was 4.4 mm h−1 and the maximum 152 mm h−1. The distribution of intensities has extreme positive skew (skewness 6.47), and the mode was 2.4 mm h−1. At MM, the intensity reaches 10 mm h−1 at Q92 of the 5-min AD rainfalls, and it reaches 15 mm h−1 at about Q96. All intensities >15 mm h−1 are thus contained in the uppermost 4% of the 5-min AD data. Only 1364 5-min ADs have intensities > 10 mm h−1 (~0.7% of values). Their total duration is the equivalent of ~4.7 days of rainfall. Thus, rainfall of the Q92 intensity is uncommon, given the record length of 3.3 years, amounting to <36 h per year. This raises the issue of the significance of such uncommon rainfall intensities for landsurface processes, considered further below.
FG had 3519 5-min ADs with rain. Their mean intensity was 7.6 mm h−1, and the maximum 110 mm h−1. All percentiles from Q90 to Q99.9 were larger at FG than at MM (Table 1), confirming the occurrence of more intense rain at the arid field site.
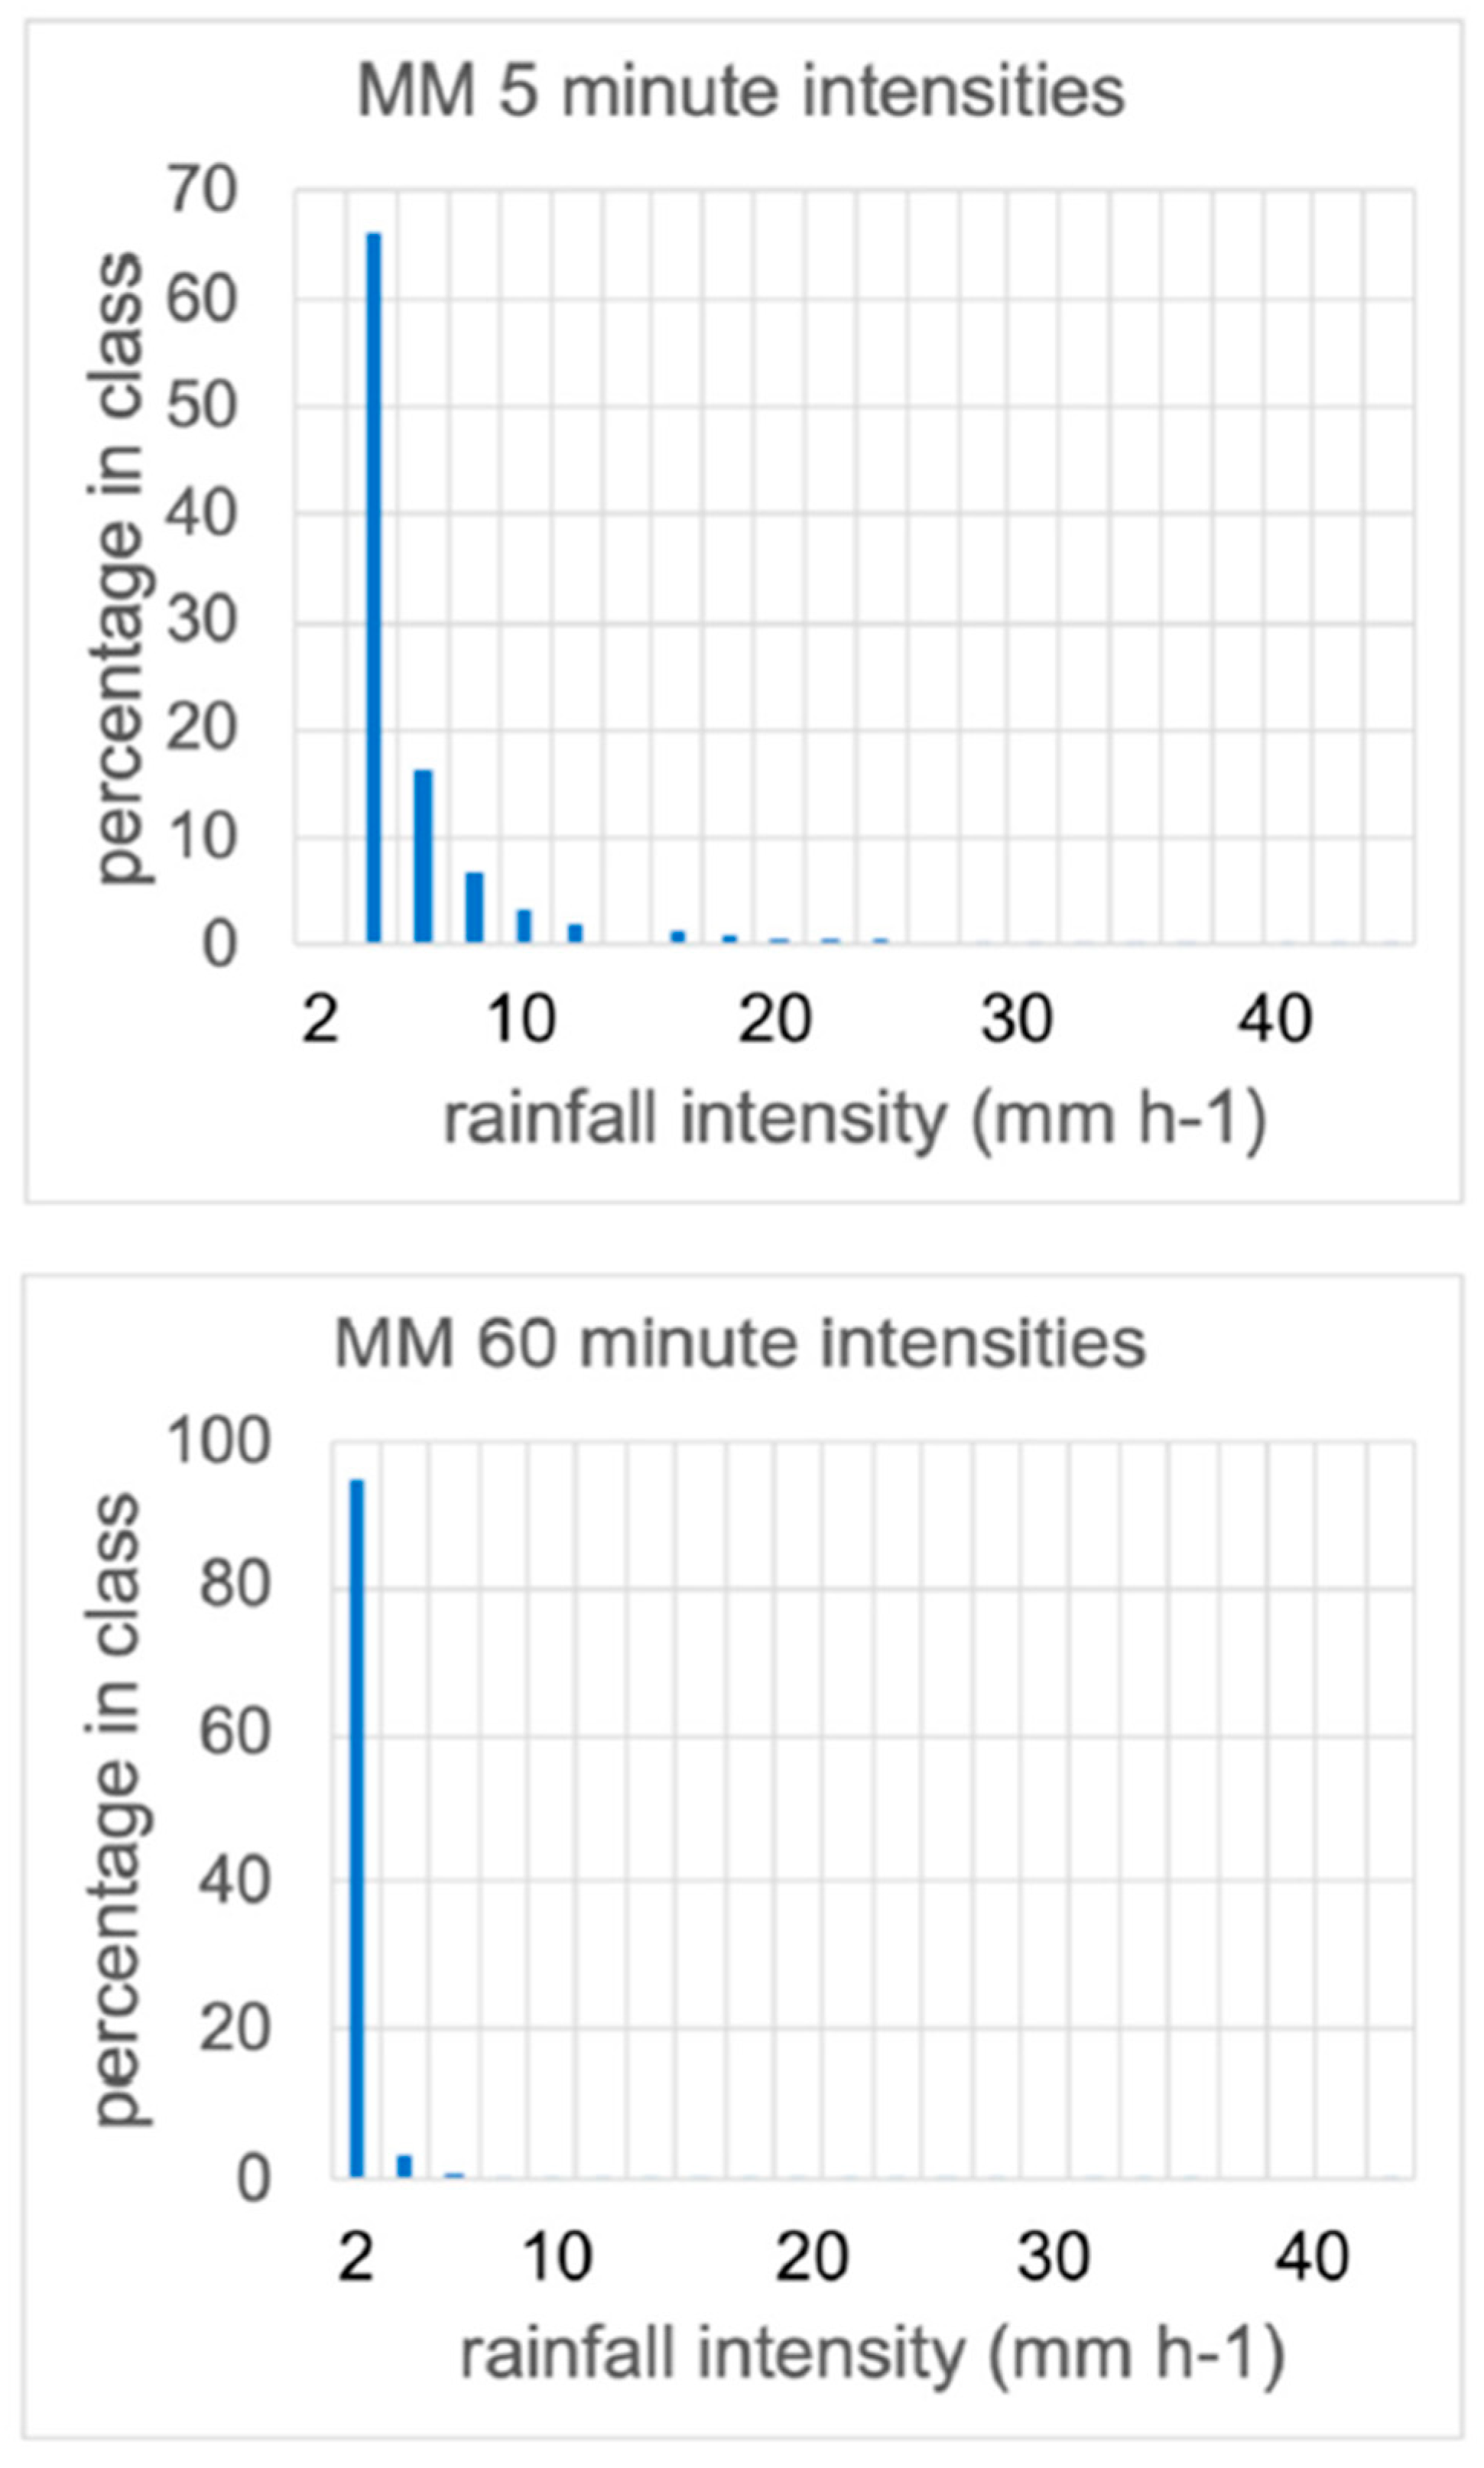
Even 5-min AD data represent a small but significant level of aggregation, and associated loss of intensity information. Furthermore, when converted to equivalent hourly rainfall rates, some limitations emerge. For instance, at MM, the smallest rainfall amount possible in a 5-min AD is 0.2 mm, which is equivalent to an hourly rainfall rate of 2.4 mm h−1. Thus, the intensity class 0–2 mm h−1 is empty at this site (Figure 6). The mode therefore lies in the 2–4 mm h−1 intensity class (Figure 6), and the occurrence of higher intensities declines rapidly thereafter. This situation becomes more severe for 60-min AD data (Figure 6). For both locations, Q95 in the 5-min AD data reaches only 20%–30% of Q95 of the unaggregated ITT data (Table 1). In interpreting the AD percentile data, it has to be remembered that successive percentiles may reflect minutes of rain that fell months apart. The seasonal and diurnal analyses presented above suggest that it is probable that the upper percentiles of intensity reflect afternoon rain during summer months, but there is no ready means of checking this. Indeed, the limitations of the analysis of percentiles in pooled data such as these raises issues of importance to landsurface processes. Aspects of importance in that context include the rainfall depth (perhaps as a proportion of the annual rainfall) arriving in single events, and the amount delivered above the various percentiles shown in Table 1. Other issues, such as the sequence of intensities and the duration of continuous rainfall vs. intermittent rainfall, cannot be examined using percentile data such as Q95 of 5-min rainfalls.
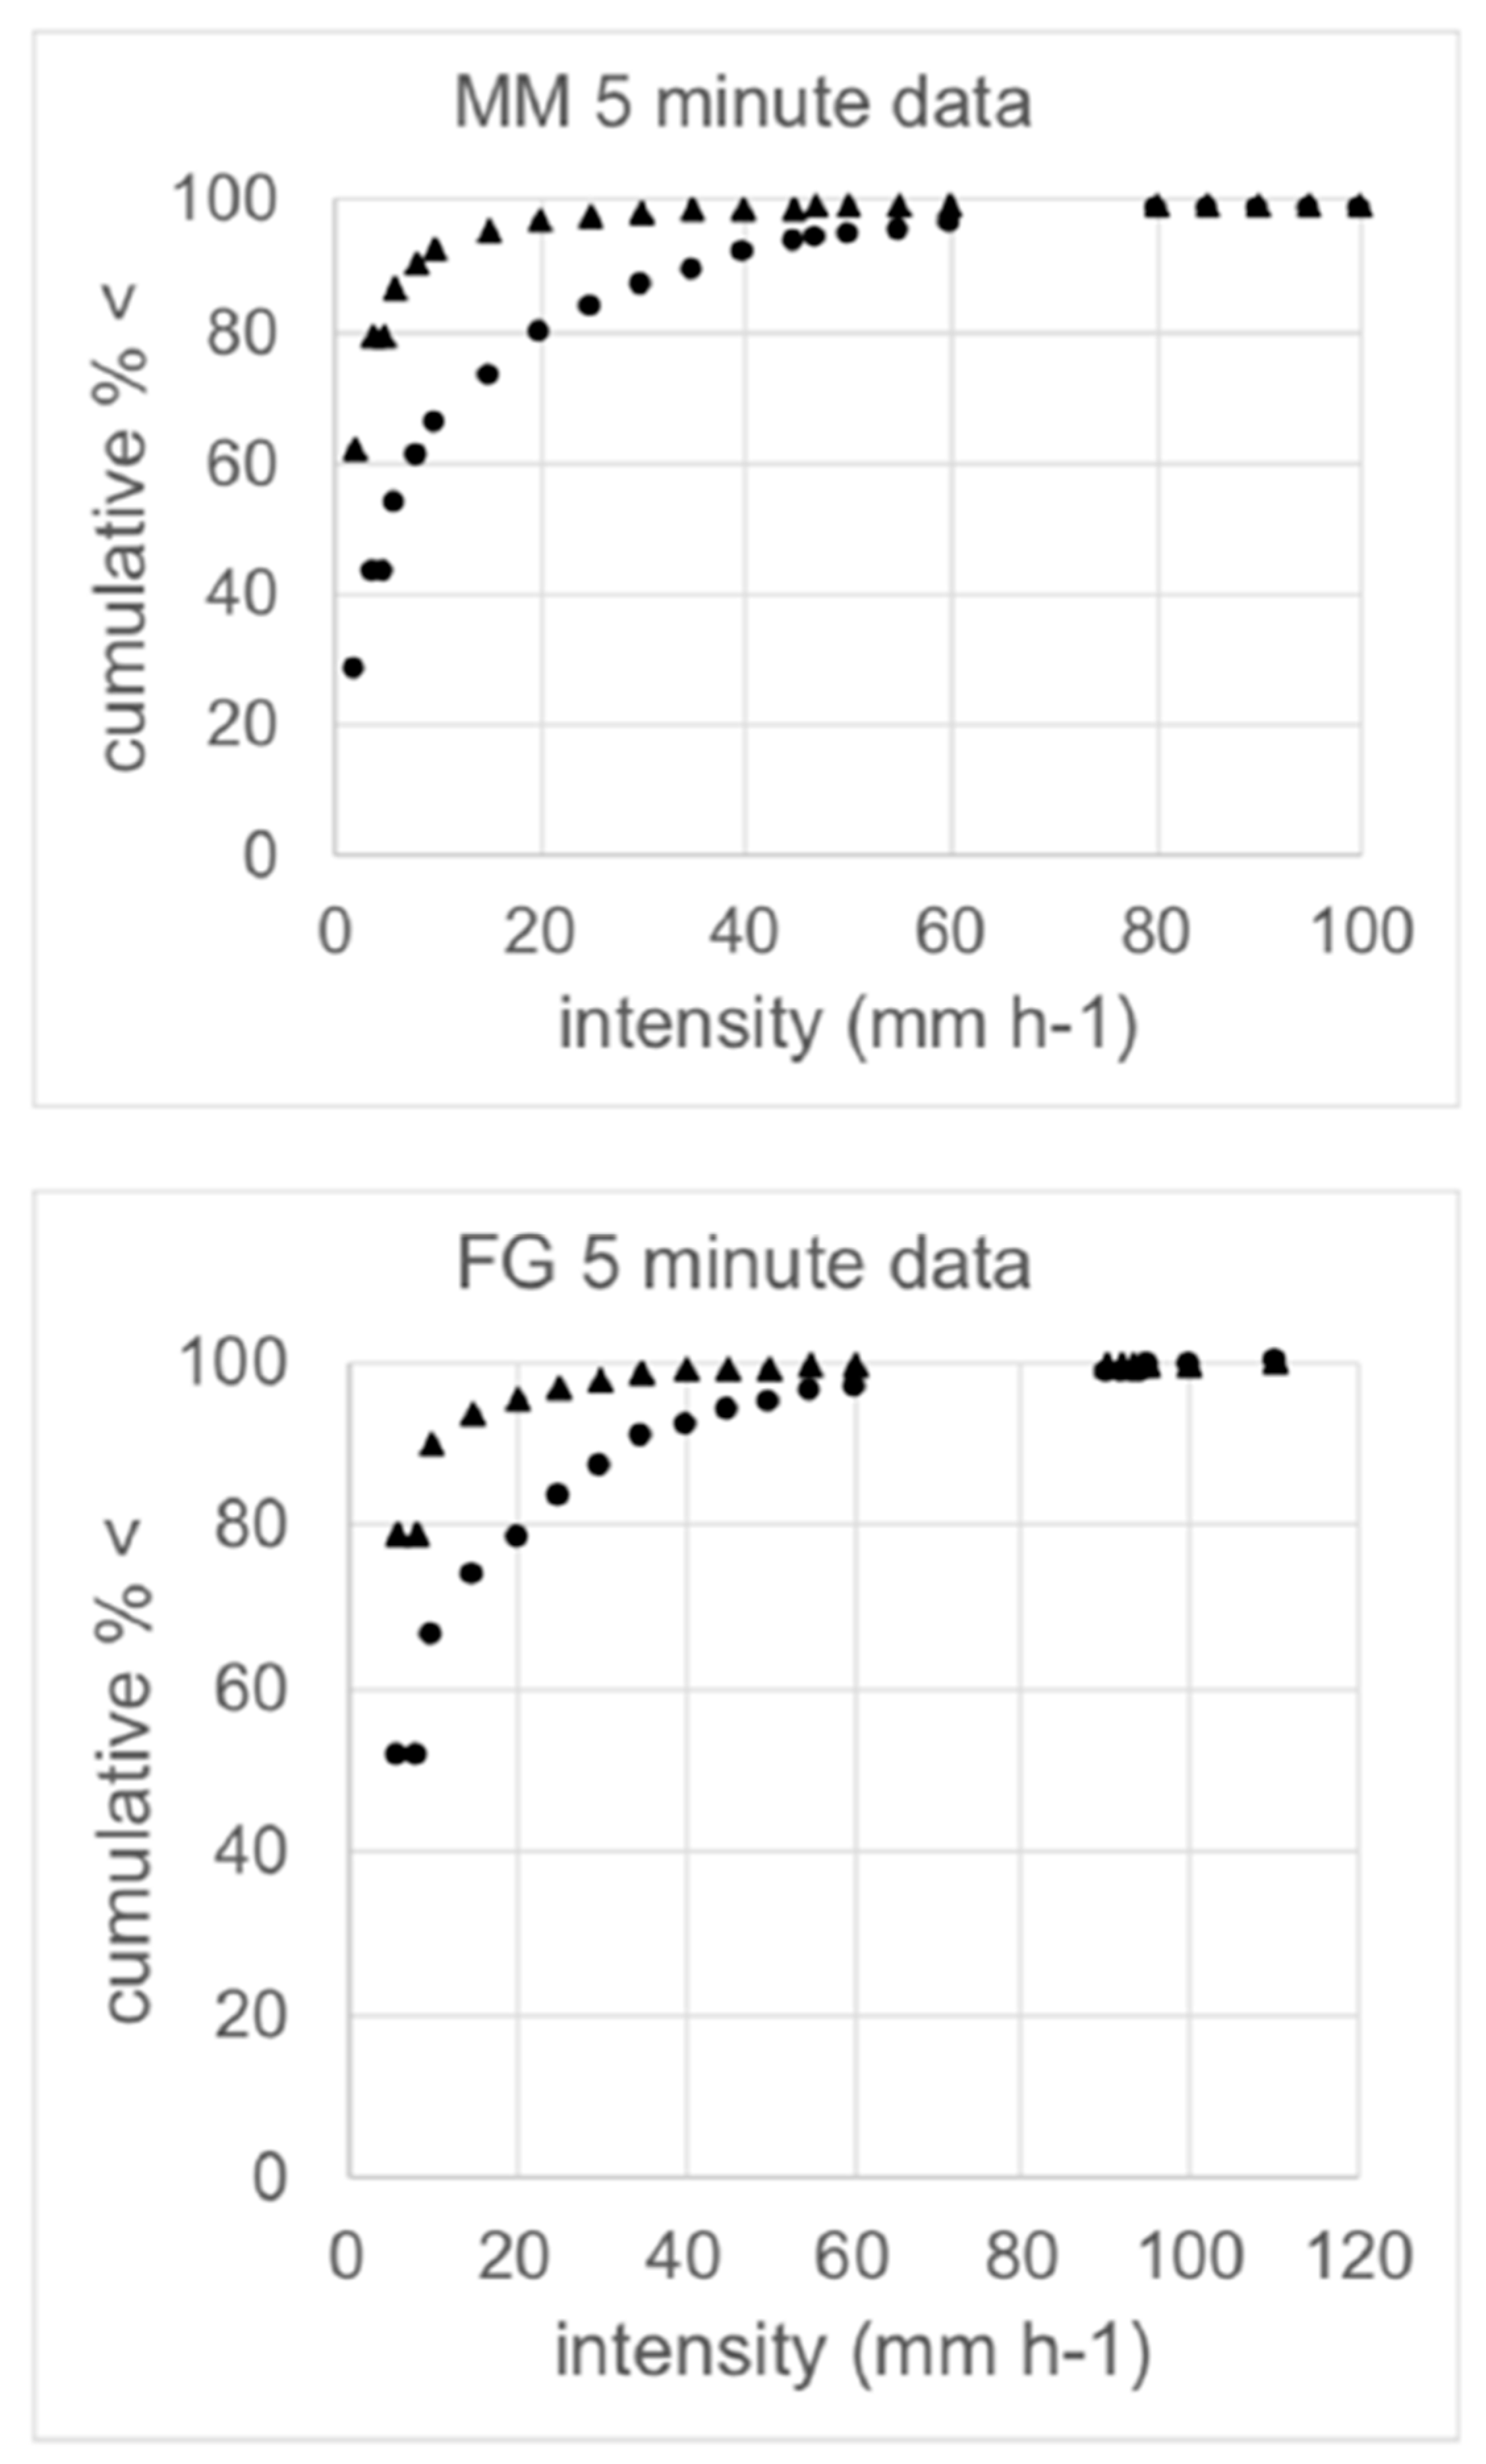
By aggregating the rainfall data into intensity classes, and summing the rainfall delivered in each intensity class, further information on the distribution of intensity can be derived. The index RQ95, described above, can be derived from such data. Classes having a width of 2 mm h−1 were used in the calculations below. The trends in the cumulative distributions of 5-min ADs and of cumulative rainfall depths are shown in Figure 7.
At MM, the 5-min AD data indicate that rain of >8 mm h−1 delivers 10% of the total rainfall (915 mm). Rain of >32 mm h−1 delivers 1% of the total rainfall (91.5 mm). These are substantial amounts of rainfall at high intensities.
Values are somewhat different at FG, where 10% of the rain is delivered at >15 mm h−1 and rain of >40 mm h−1 delivers 1% of rain. These intensities are higher than those at MM. Rain of >60 mm h−1 represents just 1.7 h of rain at FG (cf. 145 h at MM), but delivers almost 7% of the total rainfall (c.f. <6% at MM). In terms of landsurface processes, these relatively short periods of intense rainfall may drive significant processes: hillslope erosion, and channel change, bank scour, and sediment transport, especially in smaller catchments where the concentration time is short. This emphasises the need to focus on antecedent wetness and the temporal sequence of rainfalls.
The data from MM and FG presented in Table 2 suggest that the intensity above which 5% of the rainfall is delivered (RQ95) might provide a suitable index for characterising intense rainfall. At both sites, the 95th percentile of the 5-min ADs corresponds to an intensity of about 15 mm h−1, which is not an extreme intensity. In contrast, the 95th percentile of the rain depths corresponds to an intensity of about 50 mm h−1, which is extreme. By ‘5% of the rainfall’ is meant 5% of the total in any record, which might for instance span a single wet season, or which might include 50 months of data or 8.7 years of data. Annual figures are not essential to compute a value for RQ95.
Table 2 presents summary data for MM and FG, covering rainfall having intensities of ≤2 mm h−1 to ≤100 mm h−1, together with the corresponding percentiles of the 5-min AD data. It is apparent that RQ95 and Q95 of the 5-min AD data reveal quite different characterisations of extreme intensities at the two field sites.
Thus, at MM, according to the rainfall depth data, nearly 29% of the total recorded rainfall depth fell at intensities ≤2 mm h−1, and approaching half (44%) fell at intensities ≤5 mm h−1. In contrast, about 63% of 5-min ADs have intensities <2 mm h−1 and almost 80% have intensities ≤5 mm h−1. Rain at ≤20 mm h−1 delivered 80% of the total recorded rainfall, but this intensity corresponds with Q97.5 of the 5-min AD data. In all cases, the percentiles associated with the AD intensity data are considerably higher than those derived from the rainfall amount data.
Very similar results were found at FG. There, 52% of the rain amount was delivered at ≤5 mm h−1, and as at MM, rain of ≤20 mm h−1 delivered almost 80% of the rainfall. However, this intensity corresponds with a much higher percentile position (Q95.5) of the 5-min AD data for FG.
In summary, Q95 (a percentile commonly used to define what is ‘extreme’ intensity) of the 5-min data is reached at both field sites for rainfalls of ~15 mm h−1. This is a considerably lower intensity than the threshold intensity above which 5% of the total recorded rainfall is delivered (RQ95), which is ~50 mm h−1. This raises the question of which measure is the more informative in studies of rainfall intensity. This issue is considered further below.
4. Discussion
4.1. Seasonal and Diurnal Variation in Short AD Rainfall Intensities
Key findings presented above include the observation that at both field observing stations, there are both seasonal and diurnal variations in short AD rainfall intensities, whose amplitudes exceed 20 mm h−1. These findings suggest that when measures such as Q95 of the 5-min AD data are extracted, there is a significant likelihood that they represent afternoon rainfall during summer months. This is perhaps unsurprising, given the greater convective activity likely during hot summer afternoons. However, the more important implication for studies of extremes is that if these characteristics of the population of rainfall data change, or differ among observing stations, then so too will indices such as Q95. If an increase in Q95 is detected, the correct interpretation of this must be supported by an understanding of whether change in the pattern of diurnal and seasonal variation of intensity might partly account for the observation. For instance, the afternoon intensity peak might expand to occupy a larger fraction of the day, so perturbing the entire distribution of 5-min AD data, including Q95. The presence of seasonal and diurnal cycles also argues against the pooling of data from multiple stations and the use of a single percentile such as Q95, without a knowledge of the population of intensities from which it is drawn.
4.2. What Best Reflects Extremes of Rainfall Intensity
It was shown that for the two observing stations, MM and FG, the Q95 of 5-min AD rainfalls is ~15 mm h−1. This does not mean that 5% of the rain exceeds this intensity, since data aggregated to such an AD are not true intensities. Rather, Q95 of the 5-min AD data means that 5% of the AD values exceed ~15 mm h−1. In fact, the data of Table 2 show that 20%–25% of the rainfall exceeds Q95. Given that up to a quarter of the total rainfall recorded at each field site exceeds the Q95 intensity, the suitability of this value as a measure of ‘extreme’ can be questioned. In fact, RQ95 may well be more relevant: that intensity above which ~5% of the total rainfall is delivered. The relevant intensity for both observing stations is about 50 mm h−1 (considerably more intense than Q95 of the 5-min AD data).
There are further limitations to the use of percentiles of the AD data. Thus, although 5% of 5-min ADs have rainfall totals exceeding Q95, the extent to which their intensity is higher is not revealed in such data. The upper 5% of AD values might be very much higher than the Q95 value, or only slightly higher. Further, if the uppermost 5% of ADs contain very high intensity, they may contribute proportionally more to the total rainfall than the Q95 percentile suggests. If they are of only slightly higher intensity, then their contribution to total rainfall may be smaller. Thus, again, the interpretation of Q95 in 5-min AD data is not entirely clear, and indeed it may have different significance under different rainfall climatologies.
In any case, it has to be remembered that even 5-min data represent a temporal aggregation for intense rainfall. For instance, at MM, an intensity of 120 mm h−1 results in a bucket tip event every 6 s. A period of 5 min could contain 50 tip events at this intensity, or might include just 10 tip events if the intensity only lasted for 1 min within the 5-min AD. Therefore, the rainfall recorded in a particular 5-min AD may not represent correctly the intensity even during that short period. Considerably higher intensities are suggested by the unaggregated ITT data than by the 5-min AD data (Table 1).
One advantage of the proposed RQ95 index is that it permits the depth of rainfall delivered by the upper 5% of intensities to be estimated in a straightforward way from a knowledge of the annual total rainfall. This cannot be done using the 95th percentile of 5-min AD rainfalls. A necessary prerequisite is the acquisition of rainfall intensity data having high temporal resolution.
4.3. Data Availability and the Detection of Intensity Extremes
Intensity extremes are not straightforward to quantify, in part owing to the relative infrequency of observations toward the upper tail of the distribution of intensities. Pooling data from various observing sites and years in order to accumulate more data on intensity extremes would blur secular trends, the variation of intensity with drought, or associated with various teleconnections such as ENSO, which are known to affect the intensity distribution [77]. Likewise, the use of long records may hinder the detection of secular change in rainfall intensities. For instance, percentiles of rainfall intensity derived from long records have no associated time of occurrence—they are merely percentiles of the statistical distribution.
Other limitations are associated with the use of percentiles of short AD rainfall data (5–60 min) such as Q95. As mentioned earlier, fixed clock periods such as 60 min may fail to capture the intensity reached in extreme convective rainfalls, if for instance the event is split across two clock hours, such that the total rainfall of neither hour reflects the true intensity of the event. In that situation, it is not entirely clear what information is conveyed by Q95 of the maximum 60 min intensity per rain day (e.g., [50]). The interpretation of the diversity of published studies is made more difficult by the use of differing percentiles as indices of intensity extremes. For instance, [46] adopted the Q90, Q99, and Q99.9 of hourly rainfalls, whilst others adopt Q95. Furthermore, it is not clear how much more intense percentiles above Q95 are, since this depends on the nature of the distribution of intensities in the positive tail of the distribution (often heavy-tailed), as well as on the AD used to aggregate the rainfall amounts. The number of data points that are available to define extreme intensities such as the Q99.9 intensity percentile, or another value far into the tail of the distribution, can become small and again lead to uncertainty about the significance of such a measure of extreme intensity.
4.4. The Proposed RQ95 Index
The alternative examined above was the adoption as a measure of extreme intensity, RQ95, which is the intensity above which 5% of the annual rainfall (or seasonal rainfall) is recorded, or equivalently, the intensity below which 95% of the rainfall is received. This seems to offer some advantages over the use of a percentile of fixed AD rainfall amounts, though it does not fully solve the problems of describing intensity extremes.
An advantage of the proposed RQ95 index is that it can be more readily understood in terms of impacts of intense rainfall on processes such as urban drainage and flooding, or likely infiltration and runoff mechanisms, than is possible with a percentile of fixed AD rainfall amounts.
As an example, for Millaa the Q95 of 5-min data are 14 mm h−1 (and Q99 is about 32 mm h−1), which suggests that the rain is only moderately intense there. However, this is because there are many 5-min intervals with just a single tip event (these amount to 63% of all 5-min AD rainfalls), and these occupy all rankings up to Q63. In contrast, 14 mm h−1 is only Q74 in the cumulative rainfall amount data, which demonstrates that nearly a quarter of the total rainfall is delivered in rain that is more intense than 14 mm h−1, which the 5-min data therefore somewhat misleadingly suggest is near the upper tail of the distribution of intensities. Of course, the two intensity measures progressively converge toward the absolute maximum intensities, since the highest intensities become very uncommon, such that they are both an uppermost percentile of the 5-min data and in the rainfall amount data, and deliver very little of the total rainfall. For instance, at MM, Q99.5 of the 5-min AD rainfalls is ~40 mm h−1; this intensity is at the Q92.7 of rainfall amounts. By Q99.9, the 5-min AD intensity (70 mm h−1) is not greatly different in the rainfall amounts, where Q99.9 percentile is ~75 mm h−1.
Similar contrasts between the two measures of intense rainfall were seen in the FG data. There, Q95 of the rainfall amount is 51 mm h−1. Above this intensity, there are 19 5-min AD rainfalls (1.6 h) delivering 136 mm of rain. This is 5.1% of the total rainfall, and represents a mean intensity of 85 mm h−1, which can be taken as a better measure of ‘extreme’ intensity at FG.
A final observation that is important relates to the secular change of rainfall intensity. An increase in Q95 of 5-min AD rainfalls might simply be the result of diminished rainfalls (less frequent rainfall) at lower intensities without any actual change in the intense upper tail of the distribution. The same applies to the RQ95 criterion. This is unavoidable, since both indices reflect the distribution of rain across the whole intensity range in any data set being analysed. This issue was raised by [75] in the case of daily data, as noted earlier. However, the problem of changes in Q95 of short-term AD rainfall data is more severe for measures of short-term intensity extremes. This is because, as shown in the MM and FG data, very large numbers of 5-min AD rainfalls represent a single tip of the TBRG bucket during those 5 min. At MM, 13,222 of the 20,946 5-min ADs with rain (that is, 63%) have the value 0.2 mm; at FG, the figure is more extreme (2776 of the 5-min ADs from the total of 3519 ADs, or 78.8%, have the value 0.5 mm). These figures are conditioned by the respective bucket capacities (0.2 mm at MM and 0.5 mm at FG) but also reflect the rainfall intensities at the two locations. These data reveal that the more intense tail of the distribution, as seen in 5-min AD data, is compressed into a smaller part of the entire distribution of values. This makes indices such as Q90, Q95, and Q99 much more susceptible to the kinds of ‘artificial’ increases in these indices (the term used by [75]) that might result from a change in the very numerous AD values representing lower intensities. This could occur with no actual increase in intensity extremes. Knowledge of the whole population of intensities is needed to detect such artefacts.
5. Conclusions
The results presented above demonstrated that short AD intensities exhibit both diurnal and seasonal variability. This is pertinent to the interpretation of percentiles of short AD data such as Q95. Inclusion of fewer low intensity 5-min ADs would increase Q95 of 5-min AD intensity, and also increase the intensity above which 5% of rain is delivered. This could, for instance, be caused by a change in the amplitude of the diurnal cycle of intensities—especially if there are fewer 5-min ADs or lower intensities in the same number of 5-min ADs. A lower number of ADs could result from increased intermittency and might not reflect an actual intensification of rainfall. This suggests that the description of rainfall intensity, and the processing of rainfall data in seeking evidence of secular change in intensities, may need to use multiple indices to capture the nature of the whole statistical population of intensities. Indices could include RQ95 but also related indices such as RQ25, RQ50, and RQ75.
Changes anywhere in the population of short AD rainfall intensities can result in a change in Q95. This can easily be mis-interpreted as a change in intensity extremes. A more secure way to examine secular change in the upper tail of the intensity distribution would be to establish the intensity corresponding to RQ95 in a baseline period, and the tally the fraction of the rainfall recorded at or above that intensity in subsequent data collections. This could readily be done for multiple intensity thresholds in order to detect intensity change at various points in the distribution of rainfall intensities. For purposes such as this, RQ95, being based on the proportion of annual rainfall rather than a percentile of the distribution of short AD rainfall amounts, appears from the data analysed here to be arguably a more meaningful index of what is ‘extreme intensity’.
Funding
This research received no external funding.
Acknowledgments
The author extends thanks to the three reviewers of this paper, who provided careful and very helpful suggestions for improvements to it.
Conflicts of Interest
The author declares no conflict of interest.
References
- Todeschini, S. Trends in long daily rainfall series of Lombardia (northern Italy) affecting urban stormwater control. Int. J. Climatol. 2012, 32, 900–919. [Google Scholar] [CrossRef]
- Benestad, R.E. Association between trends in daily rainfall percentiles and the global mean temperature. J. Geophys. Res. Atmos. 2013, 118, 10–802. [Google Scholar] [CrossRef]
- Giorgi, F.; Raffaele, F.; Coppola, E. The response of precipitation characteristics to global warming from climate projections. Earth Syst. Dyn. 2019, 10, 73–89. [Google Scholar] [CrossRef] [Green Version]
- Römkens, M.J.M.; Helming, K.; Prasad, S.N. Soil erosion under different rainfall intensities, surface roughness, and soil water regimes. Catena 2002, 46, 103–123. [Google Scholar] [CrossRef]
- Zhu, Q.; Yang, X.; Fei, J.; Liu, D.L.; Yu, Q. Extreme rainfall, rainfall erosivity, and hillslope erosion in Australian Alpine region and their future changes. Int. J. Climatol. 2019. [Google Scholar] [CrossRef]
- Piacentini, T.; Galli, A.; Marsala, V.; Miccadei, V. Analysis of soil erosion induced by heavy rainfall: A case study from the NE Abruzzo Hills area in Central Italy. Water 2009, 10, 1314. [Google Scholar] [CrossRef] [Green Version]
- De Toffol, S.; Laghari, A.N.; Rauch, W. Are extreme rainfall intensities more frequent? Analysis of trends in rainfall patterns relevant to urban drainage systems. Water Sci. Technol. 2009, 59, 1769–1776. [Google Scholar] [CrossRef]
- Du Plessis, J.A.; Burger, G.J. Investigation into increasing short-duration rainfall intensities in South Africa. Water SA 2015, 41, 416–424. [Google Scholar] [CrossRef] [Green Version]
- Panthou, G.; Lebel, T.; Vischel, T.; Quantin, G.; Sane, Y.; Ba, A.; Ndiaye, O.; Diongue-Niang, A.; Diopkane, M. Rainfall intensification in tropical semi-arid regions: The Sahelian case. Environ. Res. Lett. 2018, 13, 064013. [Google Scholar] [CrossRef]
- De Waal, J.H.; Chapman, A.; Kemp, J. Extreme 1-day rainfall distributions: Analysing change in the Western Cape. S. Afr. J. Sci. 2017, 113, 1–8. [Google Scholar] [CrossRef] [Green Version]
- Sharma, S.; Mujumdar, P.P. On the relationship of daily rainfall extremes and local mean temperature. J. Hydrol. 2019, 572, 179–191. [Google Scholar] [CrossRef]
- Zhang, X.; Alexander, L.; Hegerl, G.C.; Jones, P.; Tank, A.K.; Peterson, T.C.; Trewin, B.; Zwiers, F.W. Indices for monitoring changes in extremes based on daily temperature and precipitation data. Wiley Interdiscip. Rev. Clim. Chang. 2011, 2, 851–870. [Google Scholar] [CrossRef]
- Chernokulsky, A.; Kozlov, F.; Zolina, O.; Bulygina, O.; Mokhov, I.I.; Semenov, V.A. Observed changes in convective and stratiform precipitation in Northern Eurasia over the last five decades. Environ. Res. Lett. 2019, 14, 045001. [Google Scholar] [CrossRef]
- Dunkerley, D.L. Rainfall intensity bursts and the erosion of soils: An analysis highlighting the need for high temporal resolution rainfall data for research under current and future climates. Earth Surf. Dyn. 2019, 7, 345–360. [Google Scholar] [CrossRef] [Green Version]
- Dunkerley, D. How does sub-hourly rainfall intermittency bias the climatology of hourly and daily rainfalls? Examples from arid and wet tropical Australia. Int. J. Climatol. 2019, 39, 2412–2421. [Google Scholar] [CrossRef]
- Dunkerley, D. Effects of rainfall intensity fluctuations on infiltration and runoff: Rainfall simulation on dryland soils, Fowlers Gap, Australia. Hydrol. Process. 2012, 26, 2211–2224. [Google Scholar] [CrossRef]
- Beecham, S.; Chowdhury, R.K. Temporal characteristics and variability of point rainfall: A statistical and wavelet analysis. Int. J. Climatol. 2010, 30, 458–473. [Google Scholar] [CrossRef]
- Muneepeerakul, C.P.; Muneepeerakul, R.; Huffaker, R.G. Rainfall intensity and frequency explain production basis risk in cumulative rain index insurance. Earth Future 2017, 5, 1267–1277. [Google Scholar] [CrossRef] [Green Version]
- Biasutti, M.; Yuter, S.E. Observed frequency and intensity of tropical precipitation from instantaneous estimates. J. Geophys. Res. Atmos. 2013, 118, 9534–9551. [Google Scholar] [CrossRef]
- Miao, Q.; Yang, D.; Yang, H.; Li, Z. Establishing a rainfall threshold for flash flood warnings in China’s mountainous areas based on a distributed hydrological model. J. Hydrol. 2016, 541, 371–386. [Google Scholar] [CrossRef]
- Camarasa-Belmonte, A.M.; Soriano, J. Empirical study of extreme rainfall intensity in a semi-arid environment at different time scales. J. Arid Environ. 2014, 100, 63–71. [Google Scholar] [CrossRef]
- Li, X.; Meshgi, A.; Wang, X.; Zhang, J.; Tay, S.H.X.; Pijcke, G.; Manocha, N.; Ong, M.; Nguyen, M.T.; Babovic, V. Three resampling approaches based on method of fragments for daily-to-subdaily precipitation disaggregation. Int. J. Climatol. 2018, 38, e1119–e1138. [Google Scholar] [CrossRef]
- Wu, Y.-C.; Wang, S.-Y.S.; Yu, Y.-C.; Kung, C.-Y.; Wang, A.-H.; Los, S.A.; Huang, W.-R. Climatology and change of extreme precipitation events in Taiwan based on weather types. Int. J. Climatol. 2019, 39. [Google Scholar] [CrossRef] [Green Version]
- Berg, P.; Haerter, J.O.; Thejll, P.; Piani, C.; Hagemann, S.; Christensen, J.H. Seasonal characteristics of the relationship between daily precipitation intensity and surface temperature. J. Geophys. Res. 2009, 114. [Google Scholar] [CrossRef]
- Jeong, J.-H.; Walther, A.; Nikulin, G.; Chen, D.; Jones, C. Diurnal cycle of precipitation amount and frequency in Sweden: Observation versus model simulation. Tellus A 2011, 63, 664–674. [Google Scholar] [CrossRef] [Green Version]
- Yilmaz, A.G.; Hossain, I.; Perera, B.J.C. Effect of climate change and variability on extreme rainfall intensity–frequency–duration relationships: A case study of Melbourne. Hydrol. Earth Syst. Sci. 2014, 18, 4065–4076. [Google Scholar] [CrossRef] [Green Version]
- Alber, R.; Jaagus, J.; Oja, P. Diurnal cycle of precipitation in Estonia. Est. J. Earth Sci. 2015, 64, 305–313. [Google Scholar] [CrossRef]
- Beck, F.; Bárdossy, A.; Seidel, J.; Müller, T.; Sanchis, E.F.; Hauser, A. Statistical analysis of sub-daily precipitation extremes in Singapore. J. Hydrol. Reg. Stud. 2015, 3, 337–358. [Google Scholar] [CrossRef] [Green Version]
- Brönnimann, S.; Rajczak, J.; Fischer, E.M.; Raible, C.C.; Rohrer, M.; Schär, C. Changing seasonality of moderate and extreme precipitation events in the Alps. Nat. Hazards Earth Syst. Sci. 2018, 18, 2047–2056. [Google Scholar] [CrossRef] [Green Version]
- Uboldi, F.; Lussana, C. Evidence of non-stationarity in a local climatology of rainfall extremes in northern Italy. Int. J. Climatol. 2018, 38, 506–516. [Google Scholar] [CrossRef]
- Merino, A.; Fernández-González, S.; García-Ortega, E.; Sánchez, J.L.; López, L.; Gascón, E. Temporal continuity of extreme precipitation events using sub-daily precipitation: Application to floods in the Ebro basin, northeastern Spain. Int. J. Climatol. 2018, 38, 1877–1892. [Google Scholar] [CrossRef]
- Douka, M.; Karacostas, T. Statistical analyses of extreme rainfall events in Thessaloniki, Greece. Atmos. Res. 2018, 208, 60–77. [Google Scholar] [CrossRef]
- Darwish, M.M.; Fowler, H.J.; Blenkinsop, S.; Tye, M.R. A regional frequency analysis of UK sub-daily extreme precipitation and assessment of their seasonality. Int. J. Climatol. 2018, 38, 4758–4776. [Google Scholar] [CrossRef]
- Xiao, C.; Yuan, W.; Yu, R. Diurnal cycle of rainfall in amount, frequency, intensity, duration, and the seasonality over the UK. Int. J. Climatol. 2018, 38, 4967–4978. [Google Scholar] [CrossRef]
- Sim, I.; Lee, O.; Kim, S. Sensitivity Analysis of Extreme Daily Rainfall Depth in Summer Season on Surface Air Temperature and Dew-Point Temperature. Water 2019, 11, 771. [Google Scholar] [CrossRef] [Green Version]
- Barbero, R.; Fowler, H.J.; Lenderink, G.; Blenkinsop, S. Is the intensification of precipitation extremes with global warming better detected at hourly than daily resolutions? Geophys. Res. Lett. 2017, 44, 974–983. [Google Scholar] [CrossRef] [Green Version]
- Kokkonen, T.; Koivusalo, H.; Karvonen, T.; Croke, B.; Jakeman, A. Exploring streamflow response to effective rainfall across event magnitude scale. Hydrol. Process. 2004, 18, 1467–1486. [Google Scholar] [CrossRef]
- Jasechko, S.; Taylor, R.G. Intensive rainfall recharges tropical groundwaters. Environ. Res. Lett. 2015, 10, 124015. [Google Scholar] [CrossRef]
- Zhang, J.; Felzer, B.S.; Troy, T.J. Extreme precipitation drives groundwater recharge: The Northern High Plains Aquifer, central United States, 1950–2010. Hydrol. Process. 2016, 30, 2533–2545. [Google Scholar] [CrossRef]
- Kotchoni, D.O.V.; Vouillamoz, J.-M.; Lawson, F.M.A.; Adjomayi, P.; Boukari, M.; Taylor, R.G. Relationships between rainfall and groundwater recharge in seasonally humid Benin: A comparative analysis of long-term hydrographs in sedimentary and crystalline aquifers. Hydrogeol. J. 2019, 27, 447–457. [Google Scholar] [CrossRef] [Green Version]
- Calf, G.E.; McDonald, P.S.; Jacobson, G. Recharge mechanism and groundwater age in the Ti-Tree Basin, Northern Territory. Aust. J. Earth Sci. 1991, 38, 299–306. [Google Scholar] [CrossRef]
- Taylor, R.G.; Scanlon, B.; Döll, P.; Rodell, M.; van Beek, R.; Wada, Y.; Longuevergne, L.; Leblanc, M.; Famiglietti, J.S.; Edmunds, M.; et al. Ground water and climate change. Nat. Clim. Chang. 2012, 3, 322. [Google Scholar] [CrossRef] [Green Version]
- Skliris, N.; Zika, J.D.; Nurser, G.; Josey, S.A.; Marsh, R. Global water cycle amplifying at less than the Clausius-Clapeyron rate. Sci. Rep. 2016, 6, 38752. [Google Scholar] [CrossRef] [PubMed] [Green Version]
- Lenderink, G.; Barbero, R.; Loriaux, J.M.; Fowler, H.J. Super-Clausius–Clapeyron scaling of extreme hourly convective precipitation and its relation to large-scale atmospheric conditions. J. Clim. 2017, 30, 6037–6052. [Google Scholar] [CrossRef]
- Lochbihler, K.; Lenderink, G.; Siebesma, A.P. Response of extreme precipitating cell structures to atmospheric warming. J. Geophys. Res. Atmos. 2019, 124, 6904–6918. [Google Scholar] [CrossRef] [PubMed]
- Lenderink, G.; van Meijgaard, E. Linking increases in hourly precipitation extremes to atmospheric temperature and moisture changes. Environ. Res. Lett. 2010, 5, 025208. [Google Scholar] [CrossRef]
- Wasko, C.; Sharma, A.; Johnson, F. Does storm duration modulate the extreme precipitation-temperature scaling relationship? Geophys. Res. Lett. 2015, 42, 8783–8790. [Google Scholar] [CrossRef] [Green Version]
- Wasko, C.; Lu, W.T.; Mehrotra, R. Relationship of extreme precipitation, dry-bulb temperature, and dew point temperature across Australia. Environ. Res. Lett. 2018, 13, 074031. [Google Scholar] [CrossRef]
- Wasko, C.; Sharma, A. Steeper temporal distribution of rain intensity at higher temperatures within Australian storms. Nat. Geosci. 2015, 8, 527. [Google Scholar] [CrossRef]
- Hardwick Jones, R.; Westra, S.; Sharma, A. Observed relationships between extreme sub-daily precipitation, surface temperature, and relative humidity. Geophys. Res. Lett. 2010, 37. [Google Scholar] [CrossRef] [Green Version]
- Olsson, J.; Foster, K. Short-term precipitation extremes in regional climate simulations for Sweden. Hydrol. Res. 2013, 45, 479–489. [Google Scholar] [CrossRef]
- Olsson, J.; Södling, J.; Berg, P.; Wern, L.; Eronn, A. Short-duration rainfall extremes in Sweden: A regional analysis. Hydrol. Res. 2019, 50, 945–960. [Google Scholar] [CrossRef]
- Laz, O.U.; Rahman, A.; Yilmaz, A.; Haddad, K. Trends in sub-hourly, sub-daily and daily extreme rainfall events in eastern Australia. J. Water Clim. Chang. 2014, 5, 667–675. [Google Scholar] [CrossRef]
- Shephard, M.W.; Mekis, E.; Morris, R.J.; Feng, Y.; Zhang, X.; Kilcup, K.; Fleetwood, R. Trends in Canadian short-duration extreme rainfall: Including an intensity–duration–frequency perspective. Atmos. Ocean 2014, 52, 398–417. [Google Scholar] [CrossRef]
- Herath, S.M.; Sarukkalige, R.; Nguyen, V.T.V. Evaluation of empirical relationships between extreme rainfall and daily maximum temperature in Australia. J. Hydrol. 2018, 556, 1171–1181. [Google Scholar] [CrossRef]
- Moseley, C.; Berg, P.; Haerter, J.O. Probing the precipitation life cycle by iterative rain cell tracking. J. Geophys. Res. Atmos. 2013, 118, 13–361. [Google Scholar] [CrossRef] [Green Version]
- Jakob, D.; Karoly, D.J.; Seed, A. Non-stationarity in daily and sub-daily intense rainfall—Part 1: Sydney, Australia. Nat. Hazards Earth Syst. Sci. 2011, 11, 2263–2271. [Google Scholar] [CrossRef]
- Loriaux, J.M.; Lenderink, G.; De Roode, S.R.; Siebesma, A.P. Understanding Convective Extreme Precipitation Scaling Using Observations and an Entraining Plume Model. J. Atmos. Sci. 2013, 70, 3641–3655. [Google Scholar] [CrossRef]
- Demaria, E.M.C.; Goodrich, D.; Keefer, T. Frequency analysis of extreme sub-daily precipitation under stationary and non-stationary conditions across two contrasting hydroclimatic environments. Hydrol. Earth Syst. Sci. Discuss. 2017, 2017, 1–28. [Google Scholar] [CrossRef] [Green Version]
- Masud, M.B.; Khaliq, M.N.; Wheater, H.S. Projected changes to short- and long-duration precipitation extremes over the Canadian Prairie Provinces. Clim. Dyn. 2017, 49, 1597–1616. [Google Scholar] [CrossRef]
- Soldini, L.; Darvini, G. Extreme rainfall statistics in the Marche region, Italy. Hydrol. Res. 2017, 48, 686–700. [Google Scholar] [CrossRef]
- Pumo, D.; Carlino, G.; Blenkinsop, S.; Arnone, E.; Fowler, H.; Noto, L.V. Sensitivity of extreme rainfall to temperature in semi-arid Mediterranean regions. Atmos. Res. 2019, 225, 30–44. [Google Scholar] [CrossRef]
- Haerter, J.O.; Berg, P.; Hagemann, S. Heavy rain intensity distributions on varying time scales and at different temperatures. J. Geophys. Res. Atmos. 2010, 115. [Google Scholar] [CrossRef]
- Haylock, M.; Nicholls, N. Trends in extreme rainfall indices for an updated high quality data set for Australia, 1910–1998. Int. J. Climatol. 2000, 20, 1533–1541. [Google Scholar] [CrossRef]
- Saidi, H.; Ciampittiello, M.; Dresti, C.; Ghiglieri, G. Observed variability and trends in extreme rainfall indices and Peaks-Over-Threshold series. Hydrol. Earth Syst. Sci. Discuss. 2013, 2013, 6049–6079. [Google Scholar] [CrossRef]
- Schroeer, K.; Kirchengast, G. Sensitivity of extreme precipitation to temperature: The variability of scaling factors from a regional to local perspective. Clim. Dyn. 2018, 50, 3981–3994. [Google Scholar] [CrossRef] [Green Version]
- Utsumi, N.; Seto, S.; Kanae, S.; Maeda, E.E.; Oki, T. Does higher surface temperature intensify extreme precipitation? Geophys. Res. Lett. 2011, 38. [Google Scholar] [CrossRef]
- Boers, N.; Bookhagen, B.; Marwan, N.; Kurths, J.; Marrengo, J. Complex networks identify spatial patterns of extreme rainfall events of the South American Monsoon System. Geophys. Res. Lett. 2013, 40, 4386–4392. [Google Scholar] [CrossRef] [Green Version]
- Paxian, A.; Hertig, E.; Seubert, S.; Vogt, G.; Jacobeit, J.; Paeth, H. Present-day and future Mediterranean precipitation extremes assessed by different statistical approaches. Clim. Dyn. 2015, 44, 845–860. [Google Scholar] [CrossRef]
- Peleg, N.; Marra, F.; Fatichi, S.; Molnar, P.; Morin, E.; Sharma, A.; Burlando, P. Intensification of convective rain cells at warmer temperatures observed from high-resolution weather radar data. J. Hydrometeorol. 2018, 19, 715–726. [Google Scholar] [CrossRef]
- Albert, M.G.; Tank, K.; Zwiers, F.W.; Zhang, X. Guidelines on Analysis of Extremes in a Changing Climate in Support of Informed Decisions for Adaptation; World Meteorological Organisation: Geneva, Switzerland, 2009; p. 52. [Google Scholar]
- Dunkerley, D.L. How do the rain rates of sub-event intervals such as the maximum 5- and 15-min rates (I5 or I30) relate to the properties of the enclosing rainfall event? Hydrol. Process. 2010, 24, 2425–2439. [Google Scholar] [CrossRef]
- Dunkerley, D. What does I30 tell us? An assessment using high-resolution rainfall event data from two Australian locations. Catena 2019, 180, 320–332. [Google Scholar] [CrossRef]
- Panagos, P.; Borrelli, P.; Poesen, J.; Ballabio, C.; Lugato, E.; Meusburger, K.; Montanarella, L.; Alewell, C. The new assessment of soil loss by water erosion in Europe. Environ. Sci. Policy 2015, 54, 438–447. [Google Scholar] [CrossRef]
- Schär, C.; Ban, N.; Fischer, E.M.; Rajczak, J.; Schmidli, J.; Frei, C.; Giorgi, F.; Karl, T.R.; Kendon, E.J.; Tank, A.M.G.K.; et al. Percentile indices for assessing changes in heavy precipitation events. Clim. Chang. 2016, 137, 201–216. [Google Scholar] [CrossRef] [Green Version]
- Weder, C.; Müller, G.; Brümmer, B. Precipitation extremes on time scales from minute to month measured at the Hamburg Weather Mast 1997–2014 and their relation to synoptic weather types. Meteorologische Zeitschrift 2017, 26, 507–524. [Google Scholar] [CrossRef]
- Dunkerley, D. Sub-daily rainfall events in an arid environment with marked climate variability: Variation among wet and dry years at Fowlers Gap, New South Wales, Australia. J. Arid Environ. 2013, 96, 23–30. [Google Scholar] [CrossRef]
Figure 1.
The monthly variation in intensities for four accumulation durations (ADs) at the MM observing station.
Figure 1.
The monthly variation in intensities for four accumulation durations (ADs) at the MM observing station.

Figure 2.
The monthly variation in intensities for four ADs at the FG observing station.

Figure 3.
Diurnal variation of mean hourly intensities for four ADs, for the MM observing station.

Figure 4.
Diurnal variation of mean hourly intensities for four ADs, for the FG observing station.

Figure 5.
Diurnal pattern of rainfall intensities using pooled data for all 15 min ADs and 60 min ADs, for the MM observing station.
Figure 5.
Diurnal pattern of rainfall intensities using pooled data for all 15 min ADs and 60 min ADs, for the MM observing station.

Figure 6.
Frequency distributions of 5-min ADs at the MM observing station.

Figure 7.
Cumulative distribution of 5-min ADs (solid triangles) and of rainfall amounts in mm (solid circles) for both the MM and FG observing stations. Only 5-min ADs with rain are included.
Figure 7.
Cumulative distribution of 5-min ADs (solid triangles) and of rainfall amounts in mm (solid circles) for both the MM and FG observing stations. Only 5-min ADs with rain are included.


Table 1.
Upper percentiles of 5-min AD rainfalls and of intensities derived from unaggregated inter-tip times (ITTs), for both MM and FG observing stations.
Table 1.
Upper percentiles of 5-min AD rainfalls and of intensities derived from unaggregated inter-tip times (ITTs), for both MM and FG observing stations.
| Field Site | MM | FG | ||
|---|---|---|---|---|
| Percentile of | 5-Min AD Intensities (mm h−1) | Unaggregated ITT Intensities (mm h−1) | 5-Min AD Intensities (mm h−1) | Unaggregated ITT Intensities (mm h−1) |
| Q90 | 8 | 48.0 | 15 | 48.7 |
| Q95 | 14 | 65.5 | 20 | 71.2 |
| Q99 | 32 | 119.9 | 40 | 120.0 |
| Q99.5 | 42 | 179.9 | 55 | 133.3 |
| Q99.9 | 68.1 | 240.0 | 90 | 161.1 |
| maximum | 152 | 719.9 | 110 | 211.8 |
Table 2.
Percentiles of rainfall amounts and of 5-min ADs, for selected intensity classes at both the MM and FG observing sites.
Table 2.
Percentiles of rainfall amounts and of 5-min ADs, for selected intensity classes at both the MM and FG observing sites.
| Field Site | MM | FG | ||
|---|---|---|---|---|
| Intensity (mm h−1) | Percentile of Rain Depth (RQ) | Percentile of 5-Min ADs (Q) | Percentile of Rain Depth (RQ) | Percentile of 5-Min ADs (Q) |
| ≤2 | 28.91 | 63.1 | - | - |
| ≤5 | 44.24 | 79.86 | 51.87 | 78.88 |
| ≤10 | 66.76 | 93.49 | 66.37 | 89.91 |
| ≤15 | 73.94 | 95.94 | 73.88 | 93.72 |
| ≤20 | 80.46 | 97.56 | 78.74 | 95.57 |
| ≤50 | 95.36 | 99.70 | 94.92 | 99.46 |
| ≤100 | 99.50 | 99.98 | 99.59 | 99.97 |
© 2019 by the author. Licensee MDPI, Basel, Switzerland. This article is an open access article distributed under the terms and conditions of the Creative Commons Attribution (CC BY) license (http://creativecommons.org/licenses/by/4.0/).
Share and Cite
MDPI and ACS Style
Dunkerley, D. Sub-Daily Rainfall Intensity Extremes: Evaluating Suitable Indices at Australian Arid and Wet Tropical Observing Sites. Water 2019, 11, 2616. https://doi.org/10.3390/w11122616
AMA Style
Dunkerley D. Sub-Daily Rainfall Intensity Extremes: Evaluating Suitable Indices at Australian Arid and Wet Tropical Observing Sites. Water. 2019; 11(12):2616. https://doi.org/10.3390/w11122616
Chicago/Turabian StyleDunkerley, David. 2019. "Sub-Daily Rainfall Intensity Extremes: Evaluating Suitable Indices at Australian Arid and Wet Tropical Observing Sites" Water 11, no. 12: 2616. https://doi.org/10.3390/w11122616
Note that from the first issue of 2016, this journal uses article numbers instead of page numbers. See further details here.