Toxicity Abatement of Wastewaters from Tourism Units by Constructed Wetlands


1
Interdisciplinary Centre of Marine and Environmental Research (CIIMAR/CIMAR), University of Porto, Novo Edifício do Terminal de Cruzeiros do Porto de Leixões, Avenida General Norton de Matos, S/N, 4450-208 Matosinhos, Portugal
2
Universidade Católica Portuguesa, CBQF–Centro de Biotecnologia e Química Fina-Laboratório Associado, Escola Superior de Biotecnologia, Rua Diogo Botelho 1327, 4169-005 Porto, Portugal
3
GreenUPorto-Sustainable Agrifood Production Research Centre & Department of Biology, Faculty of Sciences of the University of Porto, Rua do Campo Alegre, 4169-007 Porto, Portugal
*
Author to whom correspondence should be addressed.
Water 2019, 11(12), 2623; https://doi.org/10.3390/w11122623
Submission received: 31 October 2019
/
Revised: 4 December 2019
/
Accepted: 9 December 2019
/
Published: 12 December 2019
(This article belongs to the Special Issue Recent Progress of Constructed Wetland for Wastewater Treatment)
Abstract
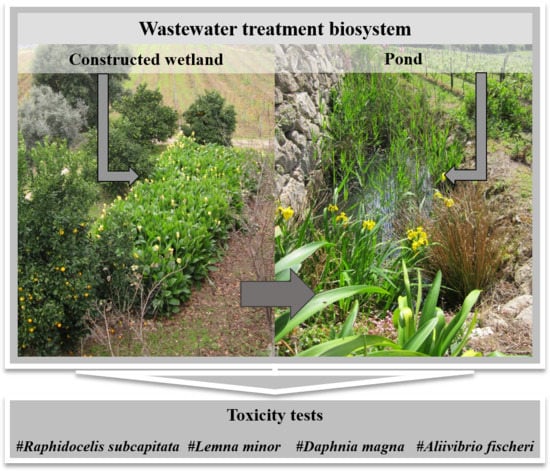
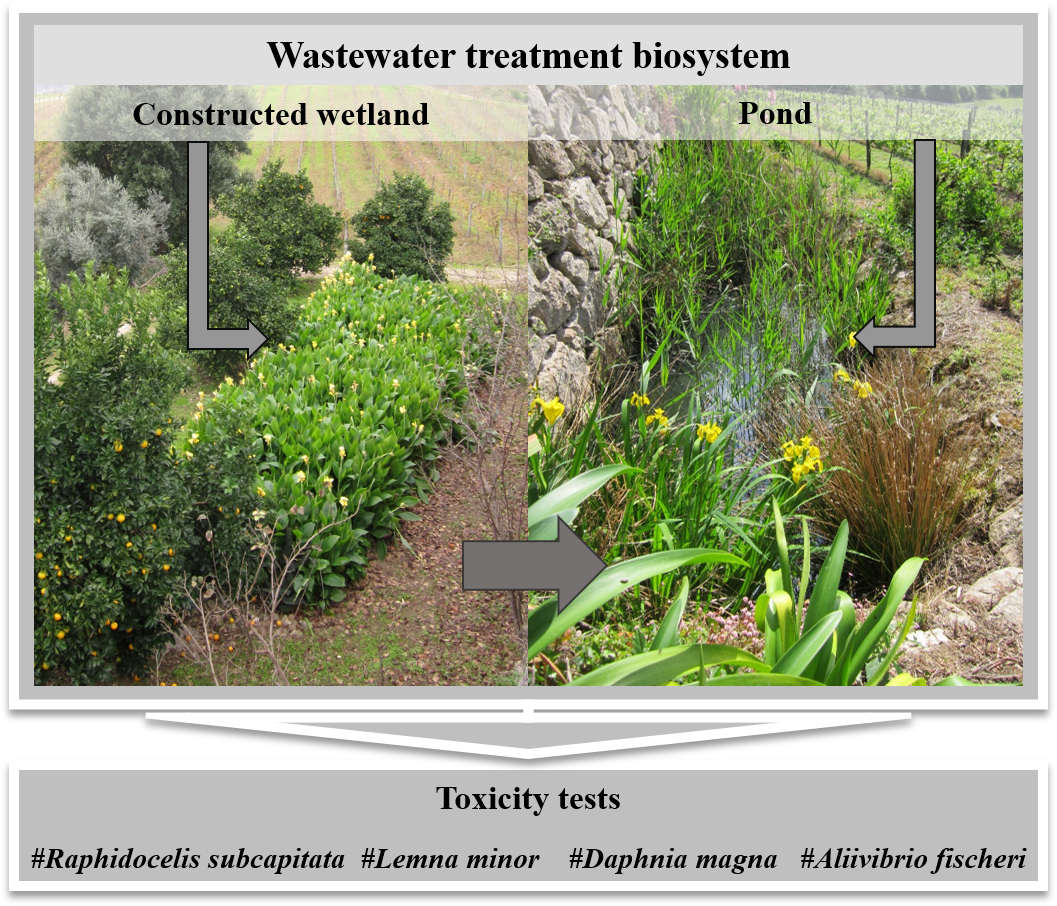
:The present research intended to investigate the toxicity abatement of domestic wastewater after passing a biosystem composed of a constructed wetland (CW) followed by a pond. The wastewater was generated in a tourism house in a rural and mountainous context and passed through a septic tank before being diverted to a CW followed by a pond. A battery of ecotoxicological tests, comprising microalgae (Raphidocelis subcapitata), macrophytes (Lemna minor), cladocerans (Daphnia magna), and bacteria (Aliivibrio fischeri), was used to assess the toxicity of the wastewater collected before and after the CW and the water of the pond. Physicochemical parameters (pH, conductivity, chemical oxygen demand, biochemical oxygen demand, total suspended solids, phosphates, ammonium, and nitrate) were also determined. The CW was able to remove carbon and nutrients from the water with a concomitant reduction of its toxicity. This study, reinforced the added value of using toxicity tests as a complement to CW operational monitoring to validate the solution and to analyze possible readjustments that may be required to improve efficiency. This study lends further support to the claim that CWs can be a sustainable solution for treating small volumes of domestic wastewater in a rural context.
1. Introduction
Constructed wetlands (CWs) are manmade systems for biological wastewater treatment that attempt to mimic natural wetlands in order to take advantage of the biological, physical, and chemical processes that occur there, which contribute to water depuration. They can operate under different climate conditions and have a wide range of applicability to different types of wastewater, ranging from industrial to domestic wastewater and stormwater [1,2,3].
CWs comprise several components, with plants, microorganisms, and the substrate influencing the performance of the whole system. The different configurations and modes of operation of CWs are mainly based on the types of flow and plants, which are described in detail in the literature [3]. However, several other design aspects must be considered in order to fulfil the expected performance. Concerns about the actual challenges of water reuse, sanitation [4], and emerging pollutants [5] are heightened when dealing with water management. CWs are characterized as inexpensive technological systems with low maintenance costs that are considered to be advantageous assets, especially if they are located in rural and mountainous areas, where access to sewage networks is limited. In the case of CWs applied to wastewater treatment coming from tourism facilities, a higher challenge is posed due to variations in wastewater quantity and quality [6]. Although the wastewater may be comparable to domestic wastewater, since the human activities (kitchen, laundry, and bathrooms) are similar to what happens in households, the concentration of parameters such as biochemical oxygen demand (BOD5) or nitrogen may vary with the tourism facility activities. For instance, they may vary according to overnight stays, restaurant activities, seasonality, and special events. Besides that, the toxicity associated with this wastewater may also vary according to the type of household cleaning products used, which can include strong detergents or chlorine [7]. Furthermore, personal care and pharmaceutical products used by guests can contribute to some punctual variability in the composition of wastewaters.
Wastewater characterization in terms of physicochemical and microbiological parameters is usually undertaken to monitor the performance of treatment systems and to assess the quality of the final water to ensure compliance with legislation, as well as to certify possible reuse alternatives; however, the environmental hazard is not exhaustively revealed by such analysis. Considering global wastewater quality, the “whole effluent” assessment is considered to be a valuable and interesting approach [8]. Several authors [9,10] have emphasized the importance of including toxicity tests in water monitoring plans to gather data for environmental risk assessment of discharges in natural ecosystems in order to cope with the premises of the Water Framework Directive. These tests are already in use in the United States to check the compliance of discharges with the Clean Water Act [11,12,13].
Ecotoxicological tests are also a valuable tool to support phytoremediation approaches by addressing toxicity abatement in CWs, since they are complex biosystems where several biogeochemical reactions occur that contribute to the adsorption and biodegradation of contaminants [3,13,14,15,16,17]. In this context, the purpose of this research was to further assess the efficiency of a CW operating in a historic tourism house located in northern Portugal, using a battery of ecotoxicological tests, comprising microalgae, macrophytes, cladocerans and bacteria. We hypothesized that the CW would be able to improve the general physical and chemical properties of the wastewater and reduce its toxicity to biota of receptor aquatic systems.
2. Material and Methods
2.1. Sampling Sites Description and Physicochemical Water Analysis
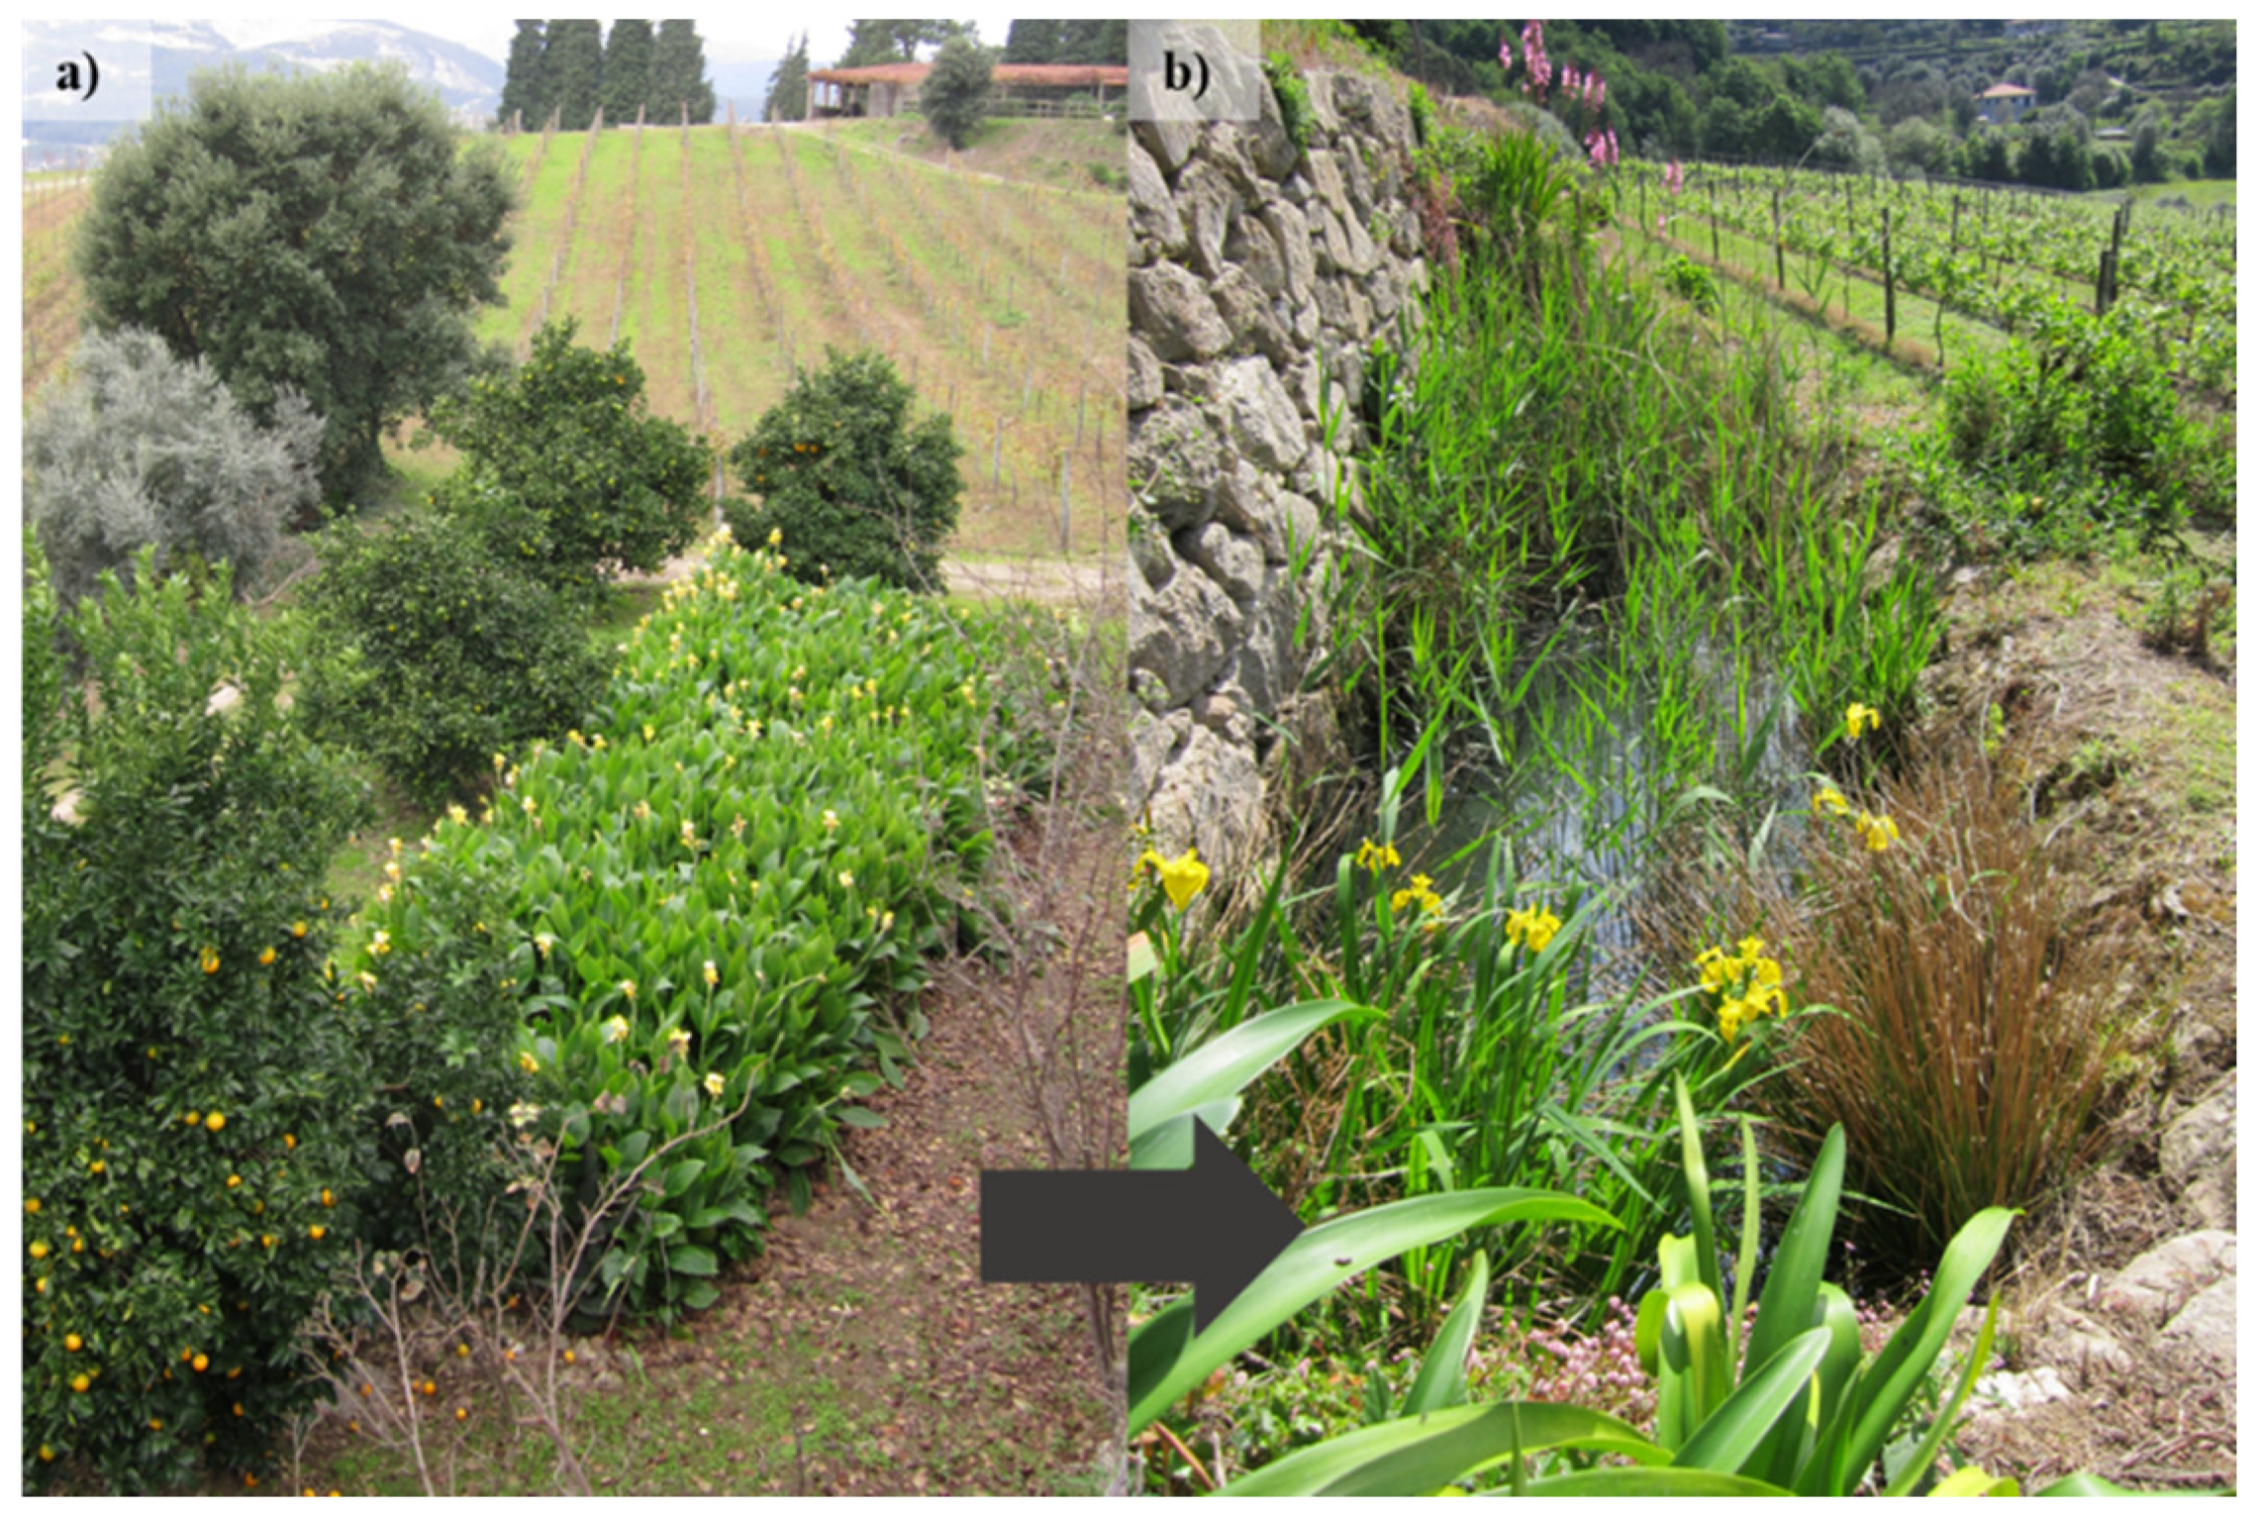
The wastewater treatment biosystem studied was composed of a CW followed by a small pond, as presented in Figure 1. The wetland was constructed in 2010 in an historic tourism house located in the northwest of Portugal for the biological treatment of domestic wastewaters. This CW operates in a horizontal subsurface flow mode and was designed to support house occupation rates varying from 6 to 40 persons (overnight stays).
The 40.5 m2 CW was originally planted with a polyculture of Canna flaccida, Canna indica, Zantedeschia aethiopica, Watsonia borbonica, and Agapanthus africanus in an expanded clay substrate (Leca®M; Saint-Gobain Weber Portugal, S.A.). Further details concerning the design, operation, and efficiency of the CW have been described by Calheiros and colleagues [6,18].
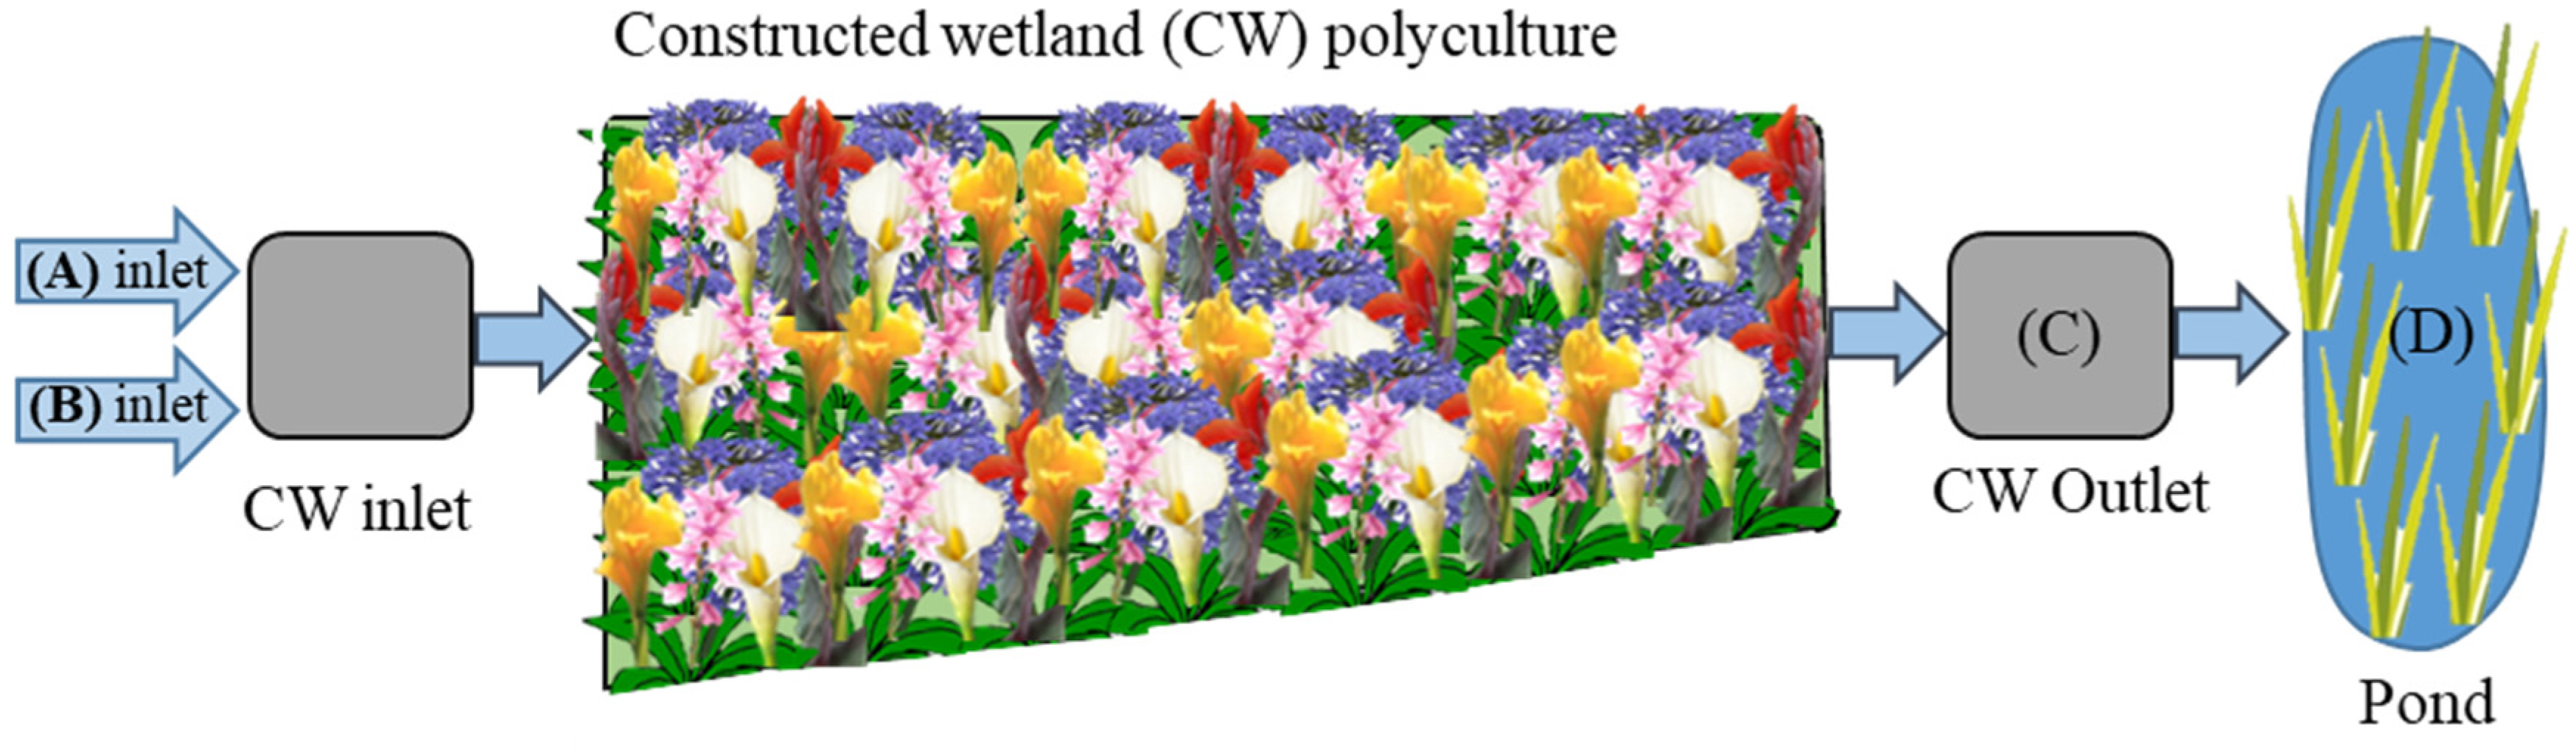
As shown in the schematic representation in Figure 2, the CW is fed by two pipelines connected to two septic tanks, which receive wastewaters from (A) the laundry, the main kitchen, and one bathroom, and (B) the main house and apartments, respectively.
The pond is located downstream and at a lower level than the CW, acting as a polishing treatment and a water reservoir. The 5 m2 artificial pond has a depth of 40 cm and the banks were planted with Iris pseudacorus, Juncus spp., Typha spp., and Phragmites spp.
In order to carry out the ecotoxicological studies, a wastewater/water characterization (physical and chemical analysis) in different sampling points of the biosystem (A–D) was undertaken. On two different days, samples were independently collected at the inlet (Figure 2A,B) and outlet (Figure 2C) of the CW, in the period of highest guest occupation of the year (summer). At the same time, two samples from the pond (Figure 2D) were also retrieved independently. Each sample was a composite sample, meaning that it was collected water from four different points in the pond and the samples were pooled to form one composite sample for analysis, in order to have a representative characterization of the pond.
Although all the wastewater samples were physically and chemically analyzed, only the Allivibrio fischeri bioluminescence inhibition test, which is an ecotoxicological test extensively applied for screening the toxicity of wastewaters, was performed for all the samples to assess the consistency of the CW treatment operation (for more details, please see Section 2.2.4). The other ecotoxicological tests were performed only for the samples of the first sampling period. After being collected, the samples were stored in the dark in a portable refrigerator and transported to the laboratory. The analysis and the tests were performed immediately after arriving at the laboratory; otherwise, the samples were stored at −20 °C before being tested.
Determinations of chemical oxygen demand (COD), BOD5, total suspended solids (TSS), pH, and conductivity were based on Standard Methods protocols [19]. The concentrations of PO43−-P, NH4+-N, and NO3−-N were determined with photometric test kits (Spectroquant®, Merck KGaA, Darmstadt, Germany) following the protocols provided by the vendor.
2.2. Ecotoxicological Assays
A battery of ecotoxicological assays was carried out to evaluate the toxicity of wastewater/water samples collected from the points described in Section 2.1 (points A–D). For this purpose, the cladoceran Daphnia magna, the microalga Raphidocelis subcapitata, the macrophyte Lemna minor, and the bacterium A. fischeri were used as test organisms.
2.2.1. D. Magna Acute Immobilization Test
The D. magna acute immobilization test was performed in accordance with the OECD Guideline 202 [20]. D. magna (clone BEAK) is continuously reared at LABRISK, in the Faculty of Sciences of the University of Porto, in flasks containing 800 mL of ASTM hard water medium [21] and 30 organisms per flask. The cultures were fed every other day with R. subcapitata (3.00 × 10⁵ cells/mL) and an organic supplement of Ascophylum nodosum (4.8 mL/L of ASTM). Cultures were maintained under constant photoperiod and temperature conditions (16 hL:8 hD; 20 ± 2 °C, respectively). Neonates, of less than 24 h, from the third through fifth broods were used either for toxicity tests or the renewal of cultures.
For the immobilization test, only samples retrieved in the first sampling period were tested. Four replicates of each water sample dilution (100.0%, 66.7%, 44.4%, 29.6%, and 19.8%), with five neonates of less than 24 h each, were prepared with ASTM medium [21]. A control with ASTM culture medium was also prepared. The glass test tubes with 20 mL of each sample dilution or ASTM and the organisms were loosely covered with perforated Parafilm® and placed under the same controlled conditions described for culture maintenance. Immobilization was checked after 24 and 48 h of exposure. Test organisms were considered immobilized if they were not able to swim after 15 s of gentle agitation of the test vessel, even if they could still move their antennae [20]. Dissolved oxygen and pH were measured at the beginning and end of the tests. Tests were considered valid if immobilization of the daphnids in the control did not exceed 10% and if the dissolved oxygen concentrations, at the end of the test in both the control and treatment replicates, were not lower than 3 mg L−1.
2.2.2. Algae Growth Inhibition Test
The algae growth inhibition test was performed according to the procedure described in the OECD Guideline 201 [22] and the ISO Guideline 8692 [23] adapted to 24-well microplates. For each test, an inoculum of R. subcapitata was obtained from laboratorial cultures. R. subcapitata was cultured in glass round-bottom flasks with 4 L of sterilized Woods Hole MBL medium [24] and covered with an adequate plug. A continuous air flow was supplied to the flasks by an air pump with a tube and a 0.22 μm syringe filter in order to prevent contamination. Cultures were kept in a chamber at 20 ± 2 °C under continuous illumination (100 mE m−2 s−1) and renewed each week. The water samples, retrieved in the first sampling period, were tested for the following range of dilutions: 100.0%, 66.7%, 44.4%, 29.6%, and 19.8%. A control with MBL medium was also prepared. Each sample dilution and the control were tested in triplicate. For each replicate, 900 μL of the sample or the MBL medium and 100 μL of the algae inoculum with a cell density of 105 cells/mL were added to the wells of the 24-well plates. Thus, tests started with an initial cell density of 104 cells/mL. Microplates were exposed to the same conditions described above for culture maintenance for 72 h, and the content of each well was mixed with a micropipette to resuspend algae cells twice a day. At the end of the test, absorbance at 440 nm was registered for each replicate and the cell density was estimated (Equation (1)) using the following equation:
The tests were valid when an increase of at least 16 times in cell density was recorded in the control and when the coefficient of variation of the specific growth rate in the control replicates did not exceed 7%. Algae specific growth rate was calculated according to the equation below (Equation (2)), and average values are presented:
where μ is the algae specific growth rate (day−1), Nf is the parameter measured at the end of the test (tf), and Ni is the parameter measured at the beginning of the test (ti).
2.2.3. L. Minor Growth Inhibition Test
The L. minor growth inhibition test followed the standard OECD 221 Guideline [25] for the wastewater samples B and C and the pond water sample D, which were retrieved in the first sampling period. The macrophyte L. minor was maintained in the laboratory under constant illumination (100 μE m−2 s−1) and temperature (20 ± 2 °C) conditions in Steinberg medium [26], which was renewed every 7 days. The test was carried out in 150 mL Erlenmeyer flasks, which were previously sterilized and filled with 100 mL of Steinberg medium in the controls or the water samples diluted with the same medium. Five dilutions were tested for each sample (100.0%, 66.7%, 44.4%, 29.6%, and 19.8%). Three colonies of L. minor were randomly transferred to Erlenmeyer flasks, and the number of fronds and colonies were the same in each test vessel. Three replicates were prepared per sample dilution and control. After 7 days of exposure under the same conditions described for culture maintenance, the specific growth rate was determined based on the dry weight of the colonies and the number of fronds, following Equation (2) described above (Section 2.2.1) for microalgae growth inhibition.
2.2.4. A. fischeri Bioluminescence Inhibition Test
The A. fischeri (Microtox®, Modernwater, London, UK) bioluminescence inhibition test was performed following the M500 Microtox manual [27] for the 81.9% basic test protocol. The bacteria were exposed to different dilutions (separated by a dilution factor of 2×) of the water samples under evaluation, and the intensity of the light emitted by the bacteria was recorded after 5, 15, and 30 min of exposure. The water samples used in this experiment were from the first and second sampling periods.
2.3. Data Analysis
The effect of the different concentrations of samples in the growth of R. subcapitata and L. minor was assessed by one-way analysis of variance (ANOVA) after checking the homogeneity of the variances with the Levene’s test. Whenever a significant effect was recorded, Dunnett’s multiple comparison test was performed to compare the average values recorded for each sample concentration with that of the control. The effective concentrations (EC50, EC20, and EC10) and the corresponding 95% confidence intervals (CIs) for the microalgae and macrophyte tests were estimated using the nonlinear least-squares regression procedure supplied by the software package Statistica 8.0 (StatSoft, Inc., Tulsa, OK, USA). For the D. magna test, EC50 values for immobilization were estimated after adjusting a probit linear regression to the data, using the IBM SPSS Statistics, version 25. The A. fischeri bioluminescence inhibition test EC50 values (concentration causing 50% reduction in the bioluminescence of the bacteria) and the corresponding 95% confidence intervals were computed using the software MicrotoxOmni®.
3. Results and Discussion
3.1. Wastewater Characterization
Table 1 presents the results of the wastewater characterization in the different sampling points of the biosystem (A–D). Concerning the pH, it was similar for all samples, whereas the conductivity of water decreased after passing through the CW. Wastewater at the inlet and outlet of the CW and the water of the pond can be considered as easily treatable by biological approaches, based on the BOD/COD ratio [28]. These findings are in alignment with what has been reported in literature for the operation of these systems, with a high organic loading in the period with a higher number of overnight stays, which usually occurs in the summer [6,29]. This gives rise to a typical low–medium strength untreated domestic wastewater, concerning its organic and nutrient contents.
In relation to the removal efficiencies for organics (COD and BOD), they were high (up to 87%) for both CW inlets (A and B). Values higher than 90%, independent of the loading conditions, were previously reported for this CW [6]. Further, if both inlets (A and B) were compared with the water from the pond (D), removal percentages up to 83% were registered. A high removal of total suspended solids was also achieved (up to 99%). The system reduced PO43− (up to 91%), NH4+, and NO3− (up to 97%), which aligns with what was reported by Calheiros et al. [6]. Concerning the microbiology associated with this wastewater, although it was not addressed here, it is very important to support a full water characterization. This issue was previously analyzed by Calheiros et al. [6] and a consistent removal efficiency (up to 99%) throughout the year, in relation to total coliform bacteria (total, fecal, and Escherichia coli) was reported. Also, Calheiros et al. [18] investigated in detail the fate of potential pathogenic bacteria (Enterobacteriaceae, E. coli, Salmonella spp., and Listeria monocytogenes) in wastewater samples from this CW inlet, outlet and pond.
3.2. Ecotoxicological Assessment
The results of the immobilization test with D. magna are presented in Table 2. The acute toxicity of the wastewater from the house was eliminated after passing through the CW. Looking at Table 1, the toxicity to D. magna was likely caused by ammonium levels in the wastewater (samples A and B), which were reduced by the CW. The concentration of ionized ammonia is usually greater than that of unionized ammonia, which is mainly determined by water pH and temperature [30]; thus, the former is the main component of total ammonia. The Canadian Water Quality Guidelines for the Protection of Aquatic Life [31] refers to concentrations of 4.82 and 1.54 mg/L, at pH of 7.0 and 7.5, respectively, and at 20 °C, for maximum total ammonia. The concentration of ionized ammonia (NH4+), per se, clearly surpassed these values in sample B (domestic wastewater), while these values were clearly diminished after passing through the CW (sample C).
In this study, nonionized ammonia (N-NH3) was not analyzed. However, its forecasted concentration, based on the concentration of the ionized ammonia detected, the pH of the samples, and the water temperature during the exposures [31], was likely lower than the 48 h LC50 value and the corresponding 95% confidence interval reported for D. magna of 2.94 (2.70–3.22) mg NH3-N/L in sample B [32]. The toxicity of ammonia has been mainly attributed to nonionized ammonia, which is kept in equilibrium with the ionized form [29]. An EC50 value of 1.5 mg/L NH3-N was reported for D. magna and an EC50 value for NH4+-N of 95.2 mg/L was estimated by Villamar et al. [33]. Ammonia has also been suggested to be the compound mainly responsible for the toxicity of effluents of human and animal origin (e.g., [33,34]). Thus, the combined effects of ammonia, other contaminants not analyzed (e.g., resulting from house cleaning and personal care products), and the conductivity may have all been responsible for the acute toxicity of wastewaters A and B to cladocerans. EC50 48 h values equal to dilutions of 32.0% (95% CI: 26.9–37.3) and 29.6% (95% CI: 16.7–45.6) were recorded for samples A and B, respectively, for this species. D. magna has been used previously to undertake broader evaluations concerning the efficiency of wastewater treatment systems [14]. In fact, this test showed sensitivity to detect water improvement through the treatment.
Figure 3 and Table 3 report the response of the microalga R. subcapitata to the wastewater samples collected at the CW and the associated pond. Significant differences in the microalgae growth rate were recorded for all the wastewater and pond water samples tested (p < 0.05). The EC50 values recorded and the graphical representation of the microalgae growth rate show that sample B, which came from the main house, was more toxic than sample A, as a complete inhibition of algae growth rate was recorded for concentrations equal to and higher than 44.4%. This response suggests once again that ammonium alone was likely not responsible for the highest toxicity of sample B. Nevertheless, and taking into account that the sample collected at point A joins wastewater coming from the laundry, and given the high COD levels, other contaminants may have also been responsible for the toxicity of sample A to the microalgae. Once again, the CW was able to reduce the toxicity of the domestic wastewater to the microalgae, as the highest EC50 value was recorded for sample C, collected at the outlet of the system. Somewhat surprising was the enhanced toxicity of the pond water. Despite the reduction in the phosphate levels promoted by the CW, this essential and limiting nutrient for microalgae development was still high, above levels recorded in hypereutrophic systems for total phosphorus [35]. Further, although other contaminants not tracked by our analysis may be present, we can hypothesize that the growth of microalgae may have been inhibited, at least in part, by allelopathic substances released by plants growing in the CW and the banks of the pond. This hypothesis was further corroborated by the transparency of the water in the lake. These substances may be also responsible for the toxicity of sample C from the CW to the microalgae, although in this case, the substrate helped retain allelopathic substances, reducing their bioavailability. The functions of root exudates are manifold, and allelopathy is one of them. This is well documented for wetlands and associated aquatic macrophytes [36]. Besides that, the sensitivity of microalgae to the allelopathy of aquatic plants may be affected to a different extent depending on biological (e.g., species and growth stage) and nonbiological (environmental stress, such temperature and nutritional status) factors. The same aquatic plant may have a distinct impact on different species of algae, just as one species of algae may have distinct sensitive responses to congeneric aquatic plants [37].
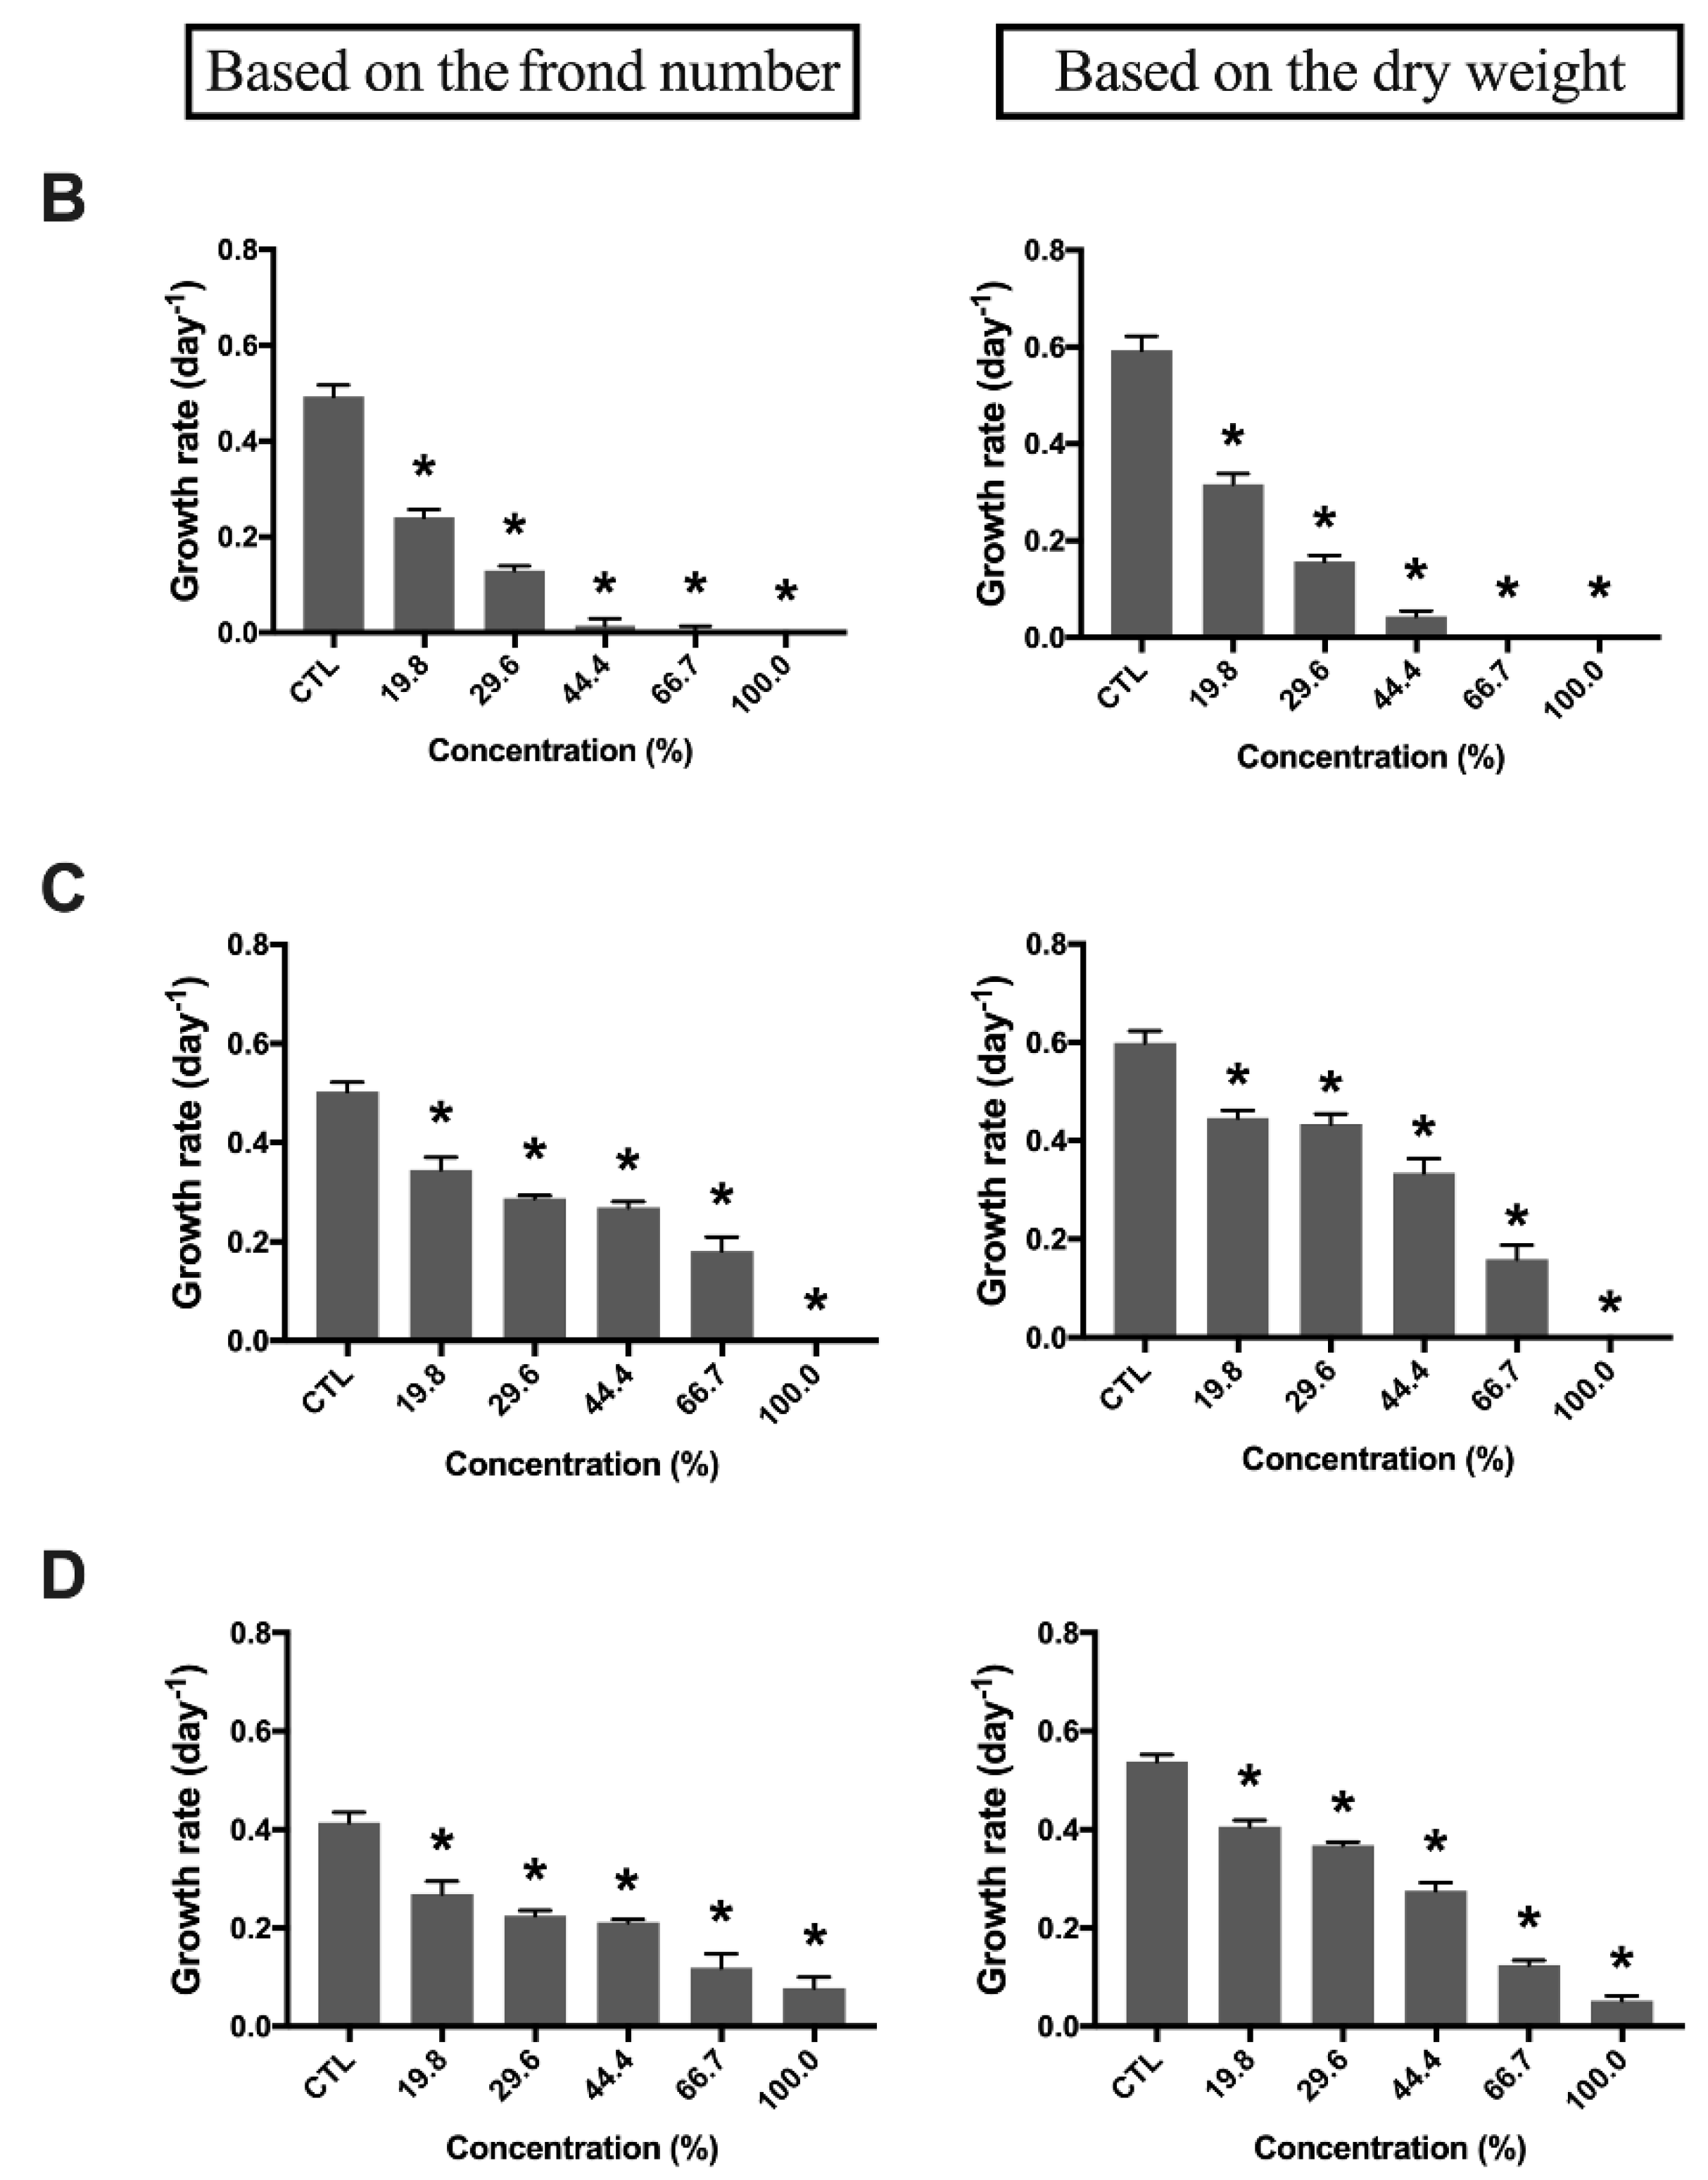
A similar pattern of toxicity was observed for the macrophyte L. minor (Figure 4 and Table 4). Complete growth rate inhibition was verified for the macrophyte at a concentration of 100% for sample B. As such, although the toxicity of the domestic wastewater was reduced by the CW, some toxicity persisted in sample C and the pond water (D). Allelopathic substances may also be responsible for the persistence of this toxicity (in samples C and D). The allelopathic interactions among and between macrophytes have also been addressed in the literature, although further research is needed [38]. L. minor is sensitive to small fractions of allelochemicals and was in fact proposed as a model species of assays aimed at detecting the biological activity of these chemical substances [38,39].
From the A. fischeri bioluminescence inhibition assay (Table 5), there was clear evidence of the reduction of toxicity from the inlet samples (A and B) to the outlet (C) and the pond water (D) samples, thus corroborating the results of the previous ecotoxicological tests in general and of the D. magna immobilization test in particular, regarding the ability of the CW to abate the toxicity of the wastewater. Furthermore, no remarkable changes were recorded in the toxicity of the samples collected at two different moments. Similar to other studies that aimed to evaluate wastewater from a municipal wastewater treatment plant (WWTP), the Microtox test was found to be one of the most sensitive tests and to have a better ability to discriminate treated and nontreated wastewater samples (e.g., [40]).
Wastewaters coming from tourism facilities can encompass different treatments by different technological approaches. However, the bottom line is that the decision will be supported by the cost of the implementation and maintenance of the treatment facilities, the level of confidence in the treatment, and the possibility that such technology can provide for the reuse of wastewater. CWs have proved to be very promising at fulfilling all these aspects [6,7].
4. Conclusions
This study clearly documented that CWs have the ability to decrease the toxicity of wastewaters from small tourism units, based on a battery of ecotoxicity tests with different organisms (D. magna, R. subcapitata, L. minor, and A. fischeri). There was clear evidence of the reduction of toxicity from the CW inlet samples to the outlet and, further on, the pond. Despite the efficiency of the CW to remove carbon and nutrients, some phosphorus was found to still pass through the biosystem, and allelopathic substances may have a positive role in preventing eutrophication downstream. In future research, it would be interesting to address, in a long-term monitoring plan, the toxicity variation in relation to fluctuation in wastewater characteristics that are typical of tourism facilities. This will also provide information to validate the solution and to introduce possible readjustments in the design of CWs.
This study reinforces that CWs can be a sustainable solution for treating domestic wastewater in a rural context and that toxicity tests are of great value to complement operational monitoring.
Author Contributions
Writing and review, R.P., C.S.C.C., and P.M.L.C.; data analysis, R.P.; Experimental work, A.G. and C.S.C.C.
Funding
This research was partially supported by the Strategic Funding UID/Multi/50016/2019 and UID/Multi/04423/2019 through national funds provided by FCT—Foundation for Science and Technology and the European Regional Development Fund (ERDF), in the framework of the program PT2020. Ana Gavina awarded a PhD Grant from Foundation for Science and Technology (SFRH/BD/94902/2013).
Acknowledgments
This research was partially supported by the Strategic Funding UID/Multi/50016/2019 and UID/Multi/04423/2019 through national funds provided by FCT—Foundation for Science and Technology and the European Regional Development Fund (ERDF), in the framework of the program PT2020. The authors are grateful to Verónica Nogueira for her support at the LabRisk. The authors are thankful for the collaboration of Paço de Calheiros. Ana Gavina awarded a PhD Grant from Foundation for Science and Technology (SFRH/BD/94902/2013).
Conflicts of Interest
The authors declare no conflict of interest. The funders had no role in the design of the study; in the collection, analyses, or interpretation of data; in the writing of the manuscript, or in the decision to publish the results.
References
- Calheiros, C.S.C.; Almeida, C.M.R.; Mucha, A.M. Chapter 8: Multiservices and functions of constructed wetlands. In Wetland Function, Services, Importance and Threats; Halicki, W., Ed.; Nova Science Publishers, Inc.: New York, NY, USA, 2018; pp. 269–298. ISBN 978-1-53613-562-6. [Google Scholar]
- Wu, H.; Zhang, J.; Ngo, H.H.; Guo, W.; Hu, Z.; Liang, S.; Fan, J.; Liu, H. A review on the sustainability of constructed wetlands for wastewater treatment: Design and operation. Bioresour. Technol. 2015, 175, 594–601. [Google Scholar] [CrossRef] [PubMed]
- Kadlec, R.H.; Wallace, S.D. Treatment Wetlands, 2nd ed.; CRC Press, Taylor & Francis Group: Boca Raton, FL, USA, 2009. [Google Scholar]
- Wu, S.; Carvalho, P.N.; Müller, J.A.; Manoj, V.R.; Dong, R. Sanitation in constructed wetlands: A review on the removal of human pathogens and fecal indicators. Sci. Total Environ. 2016, 15, 8–22. [Google Scholar] [CrossRef] [PubMed]
- Verlicchi, P.; Galletti, A.; Petrovic, M.; Barceló, D. Hospital effluents as a source of emerging pollutants: An overview of micropollutants and sustainable treatment options. J. Hydrol. 2010, 389, 416–428. [Google Scholar] [CrossRef]
- Calheiros, C.S.C.; Bessa, V.S.; Mesquita, R.B.R.; Brix, H.; Rangel, A.O.S.S.; Castro, P.M.L. Constructed wetland with a polyculture of ornamental plants for wastewater treatment at a rural tourism facility. Ecol. Eng. 2015, 79, 1–7. [Google Scholar] [CrossRef]
- Regelsberger, M.; Bahlo, K.; Conte, G.; Ebeling, B.; Masi, F.; Mitterer-Reichmann, G.; Platzer, C.; Regelsberger, B.; Urtane, L.; Wach, G. Sustainable Water Management and Wastewater Purification in Tourism Facilities-Guidelines for Sustainable Water Management in Tourism Facilities; Arbeitsgemeinschaft Erneuerbare Energie Gmbh: Gleisdorf, Austria, 2005; ISBN 3-901425-99-3. [Google Scholar]
- USEPA. Method Guidance and Recommendations for Whole Effluent Toxicity (WET) Testing (40 CFR Part 136); U.S. Environmental Protection Agency Office of Water: Washington, DC, USA, 2000; EPA/821/B-00/004.
- Movahedian, H.; Bina, B.; Asghari, G.H. Toxicity Evaluation of Wastewater Treatment Plant Effluents Using Daphnia magna. Iran. J. Environ. Health Sci. Eng. 2005, 2, 1–4. [Google Scholar]
- Mendonça, E.; Picado, A.; Paixão, S.M.; Silva, L.; Cunha, M.A.; Leitão, S.; Moura, I.; Cortez, C.; Brito, F. Ecotoxicity tests in the environmental analysis of wastewater treatment plants: Case study in Portugal. J. Hazard. Mater. 2009, 163, 665–670. [Google Scholar] [CrossRef] [PubMed]
- Federal Water Pollution Control Act (Clean Water Act) (33 U.S.C. 1251 et seq.); 2002; Q:\COMP\ WATER2\CLEANWAT.001. Available online: https://www.epa.gov/sites/production/files/2017-08/documents/federal-water-pollution-control-act-508full.pdf (accessed on 10 December 2019).
- USEPA. Methods for Measuring the Acute Toxicity of Effluents and Receiving Waters to Freshwater and Marine Organisms, 5th ed.; U.S. Environmental Protection Agency Office of Water: Washington, DC, USA, 2002; EPA-821-R-02-012.
- USEPA. Clean Water Act Methods Update Rule for the Analysis of Effluent. 40 CFR Part 136. Federal Register; 2017; Volume 82, No. 165. EPA–HQ–OW–2014–0797, 2017, FRL–9957–24–OW. Available online: https://www.govinfo.gov/content/pkg/FR-2017-08-28/pdf/2017-17271.pdf (accessed on 10 December 2019).
- Lutterbeck, C.A.; Zerwes, F.V.; Radtke, J.F.; Köhler, A.; Kist, L.T.; Machado, Ê.L. Integrated system with constructed wetlands for the treatment of domestic wastewaters generated at a rural property–Evaluation of general parameters ecotoxicity and cytogenetics. Ecol. Eng. 2018, 115, 1–8. [Google Scholar] [CrossRef]
- Calheiros, C.S.C.; Rangel, A.O.S.S.; Castro, P.M.L. The Effects of Tannery Wastewater on the Development of Different Plant Species and Chromium Accumulation in Phragmites australis. Arch. Environ. Contam. Toxicol. 2008, 55, 404–414. [Google Scholar] [CrossRef] [PubMed]
- Hemming, J.M.; Turner, P.K.; Brooks, B.W.; Waller, W.T.; La Point, T.W. Assessment of Toxicity Reduction in Wastewater Effluent Flowing through a Treatment Wetland Using Pimephales promelas, Ceriodaphnia dubia, and Vibrio fischeri. Arch. Environ. Contam. Toxicol. 2002, 42, 9–16. [Google Scholar]
- Belin, J.I.; McCaskey, T.A.; Black, M.C. Evaluating the efficiency of toxicity abatement in a constructed wetland with Ceriodaphnia Dubia. J. Toxicol. Environ. Health Part A 2000, 60, 137–151. [Google Scholar] [CrossRef] [PubMed]
- Calheiros, C.S.C.; Ferreira, V.; Magalhães, R.; Teixeira, P.; Castro, P.M.L. Presence of microbial pathogens and genetic diversity of Listeria monocytogenes in a constructed wetland system. Ecol. Eng. 2017, 102, 344–351. [Google Scholar] [CrossRef]
- APHA. Standard Methods for the Examination of Water and Wastewater, 20th ed.; American Public Health Association: Washington, DC, USA, 1998. [Google Scholar]
- OECD. Test No. 202: Daphnia sp. Acute Immobilisation Test, OECD Guidelines for the Testing of Chemicals; Section 2; OECD Publishing: Paris, France, 2004. [Google Scholar] [CrossRef]
- ASTM. Standard practice for conducting acute toxicity tests with fishes, macroinvertebrates and amphibians. In Report E 729-80; American Society for Testing and Materials: West Conshohocken, PA, USA, 1980. [Google Scholar]
- OECD. Test No. 201: Freshwater Alga and Cyanobacteria, Growth Inhibition Test, OECD Guidelines for the Testing of Chemicals; Section 2; OECD Publishing: Paris, France, 2011. [Google Scholar] [CrossRef] [Green Version]
- ISO (2004) 8692:2004. Water Quality—Freshwater Algal Growth Inhibition Test with Unicellular Green Algae. Standards by ISO/TC 147/SC 5 Biological Methods; ISO: Geneva, Switzerland, 2005. [Google Scholar]
- Nichols, H.W. Handbook of Phycological Methods; Stein, J.R., Ed.; Cambridge University Press: Cambridge, UK, 1973; pp. 16–17. [Google Scholar]
- OECD. Test No. 221: Lemna sp. Growth Inhibition Test, OECD Guidelines for the Testing of Chemicals; Section 2; OECD Publishing: Paris, France, 2006. [Google Scholar] [CrossRef]
- ISO 20079:2005. Water Quality-Determination of the Toxic Effect of Water Constituents and Waste Water on Duckweed (Lemna Minor)-Duckweed Growth Inhibition Test. Standards by ISO/TC 147/SC 5Biological Methods; ISO: Geneva, Switzerland, 2005. [Google Scholar]
- AZUR. Environmental Microtox Omni Manual; Microbics Corporation: Carlsbad, CA, USA, 1998. [Google Scholar]
- Metcalf & Eddy, Inc.; Tchobanoglous, G.; David Stensel, H.; Tsuchihashi, R.; Burton, F.L. Wastewater Engineering Treatment and Resource Recovery, 5th ed.; McGraw-Hill: New York, NY, USA, 2014. [Google Scholar]
- Calheiros, C.S.C.; Pereira, S.I.A.; Franco, A.R.; Castro, P.M.L. Diverse Arbuscular Mycorrhizal Fungi (AMF) Communities Colonize Plants Inhabiting a Constructed Wetland for Wastewater Treatment. Water 2019, 11, 1535. [Google Scholar] [CrossRef] [Green Version]
- Trussell, R.P. The Percent Un-Ionized Ammonia in Aqueous Ammonia Solutions at Different pH Levels and Temperatures. J. Fish. Res. Board Can. 1972, 29, 10. [Google Scholar] [CrossRef]
- Canadian Council of Ministers of the Environment. Canadian water quality guidelines for the protection of aquatic life: Ammonia. In Canadian Environmental Quality Guidelines; Canadian Council of Ministers of the Environment: Winnipeg, MB, Canada, 2010. [Google Scholar]
- Gersich, F.M.; Hopkins, D.L. Site-specific acute and chronic toxicity of ammonia to Daphnia magna straus. Environ. Toxicol. Chem. 1986, 5, 443–447. [Google Scholar] [CrossRef]
- Villamar, C.A.; Silva, J.; Bay-Schmith, E.; Vidal, G. Toxicity identification evaluation of anaerobically treated swine slurry: A comparison between Daphnia magna and Raphanus sativus. J. Environ. Sci. Health Part B 2014, 49, 880–888. [Google Scholar] [CrossRef] [PubMed]
- Machado, C.K.; Pinto, L.H.; Del Ciamp, L.F.; Lorenzi, L.; Correia, C.H.G.; Häder, D.P.; Erzinger, G.S. Potential environmental toxicity from hemodialysis effluent. Ecotoxicol. Environ. Saf. 2014, 102, 42–47. [Google Scholar] [CrossRef] [PubMed]
- Canadian Council of Ministers of the Environment. Canadian water quality guidelines for the protection of aquatic life: Phosphorus: Canadian Guidance Framework for the Management of Freshwater Systems. In Canadian Environmental Quality Guidelines; Canadian Council of Ministers of the Environment: Winnipeg, MB, Canada, 2004. [Google Scholar]
- Vymazal, J.; Kröpfelová, L. Wastewater Treatment in Constructed Wetlands with Horizontal Sub-Surface Flow. In Environmental Pollution; Alloway, B.J., Trevors, J.T., Eds.; Springer Science + Business Media B.V.: Dordrecht, The Netherlands, 2008; Volume 14. [Google Scholar]
- Hu, H.; Hong, Y. Algal-bloom control by allelopathy of aquatic macrophytes-A review. Front. Environ. Sci. Eng. 2008, 2, 421–438. [Google Scholar] [CrossRef]
- Ervin, G.N.; Wetzel, R.G. An ecological perspective of allelochemical interference in land–water interface communities. Plant Soil 2003, 256, 13–28. [Google Scholar] [CrossRef]
- Einhellig, F.A.; Leather, G.R.; Hobbs, L.L. Use of Lemna minor L. as a bioassay in allelopathy. J. Chem. Ecol. 1985, 11, 1. [Google Scholar] [CrossRef] [PubMed]
- Mendonça, E.; Picado, A.; Paixão, S.M.; Silva, L.; Barbosa, M.; Cunha, M.A. Ecotoxicological evaluation of wastewater in a municipal WWTP in Lisbon area (Portugal). Desalin. Water Treat. 2013, 51, 4162–4170. [Google Scholar] [CrossRef] [Green Version]
Figure 1.
Constructed wetland (CW) (a) with a polyculture of ornamental plants for domestic wastewater treatment followed by a pond (b).
Figure 1.
Constructed wetland (CW) (a) with a polyculture of ornamental plants for domestic wastewater treatment followed by a pond (b).

Figure 2.
Schematic representation of a tourism house wastewater treatment biosystem composed of a constructed wetland ornamental polyculture (CW) followed by a pond. Sampling points: (A) wastewater pipeline from a septic tank that receives water from the laundry, main kitchen, and one bathroom, (B) wastewater pipeline from a septic tank that receives water from the main tourism house, and (C) outlet of the CW that receives treated wastewater, which is then conducted to a (D) pond.

Figure 3.
Raphidocelis subcapitata average growth rate after being exposed to different concentrations of wastewater samples (A–C) and the pond water sample (D). Error bars correspond to standard deviation. Asterisks (*) highlight significant differences from the MBL control (CTL) (Dunnett’s test: p < 0.05). Sampling points: (A) water from a septic tank that receives wastewater from the laundry, main kitchen, and one bathroom, (B) water from a septic tank that receives wastewater from the main tourism house and apartments, (C) outlet of the CW receiving treated wastewater, and (D) pond.

Figure 4.
Lemna minor average growth rate, based on frond number and dry weight, after being exposed to different concentrations of wastewater samples (B,C) and pond water (D). Error bars correspond to standard deviation. Asterisks (*) highlight significant differences from the CTL (Dunnett’s test: p < 0.05). Sampling points: (B) water from a septic tank that receives wastewater from the main tourism house and apartments, (C) outlet of the CW receiving treated wastewater, and (D) pond.


Table 1.
Physical and chemical characterization of wastewater samples collected at different sampling points (A–C) and sampling times (1 and 2) of the CW and the water samples of the pond located downstream (D).
Table 1.
Physical and chemical characterization of wastewater samples collected at different sampling points (A–C) and sampling times (1 and 2) of the CW and the water samples of the pond located downstream (D).
| Sampling Points and Sampling Time | ||||||||
|---|---|---|---|---|---|---|---|---|
| Parameters | A * | B * | C * | D * | ||||
| 1 | 2 | 1 | 2 | 1 | 2 | 1 | 2 | |
| pH | 7.86 | 8.25 | 7.46 | 7.84 | 6.63 | 7.35 | 7.53 | 7.82 |
| Cond. (µS/cm) | 1210 | 1050 | 1709 | 1114 | 873 | 870 | 823 | 800 |
| COD (mg/L) | 621 | 426 | 274 | 577 | 80 | 112 | 103 | 140 |
| BOD5 (mg/L) | n.d. | n.d. | 220 | 155 | 55 | 60 | 90 | 105 |
| TSS (mg/L) | 800 | 450 | 220 | 150 | 10 | 8 | 9 | 7 |
| PO43−-P (mg/L) | 20.10 | 12.00 | 6.05 | 9.10 | 1.75 | 3.05 | 2.22 | 1.66 |
| NH4+-N (mg/L) | 1.00 | 4.10 | 14.48 | 9.35 | 1.37 | 1.81 | 0.03 | 0.23 |
| NO3−-N (mg/L) | 3.70 | 2.10 | 0.61 | 1.00 | 0.39 | 0.06 | 0.08 | 0.10 |
Notes: * Sampling points: (A) water from a septic tank that receives wastewater from the laundry, main kitchen, and one bathroom, (B) water from a septic tank that receives wastewater from the main tourism house and apartments, (C) outlet of the CW receiving treated wastewater, and (D) pond. Abbreviations: nd—not determined; COD—chemical oxygen demand; BOD5—biochemical oxygen demand; TSS—total suspended solids.
Table 2.
Percentage of immobilized Daphnia magna (clone BEAK) after exposures of 24 and 48 h to the wastewater samples coming from different sampling points of the biosystem (B and C) and to the water sample of the pond located downstream (D).
Table 2.
Percentage of immobilized Daphnia magna (clone BEAK) after exposures of 24 and 48 h to the wastewater samples coming from different sampling points of the biosystem (B and C) and to the water sample of the pond located downstream (D).
| % of Inhibition of D. magna Mobility for the Exposure Time | ||||||||
|---|---|---|---|---|---|---|---|---|
| Sampling Points | A * | B * | C * | D * | ||||
| Sample Concentration (%) | 24 h | 48 h | 24 h | 48 h | 24 h | 48 h | 24 h | 48 h |
| Control | 0 | 0 | 0 | 0 | 0 | 0 | 0 | 0 |
| 19.8 | 0 | 20 | 25 | 25 | 0 | 0 | 0 | 0 |
| 29.6 | 5 | 45 | 20 | 30 | 0 | 0 | 5 | 5 |
| 44.4 | 25 | 60 | 65 | 90 | 0 | 0 | 0 | 0 |
| 66.7 | 80 | 100 | 100 | 100 | 0 | 0 | 5 | 5 |
| 100.0 | 100 | 100 | 100 | 100 | 0 | 0 | 0 | 0 |
Notes: * Sampling points: (A) water from a septic tank that receives wastewater from the laundry, main kitchen, and one bathroom, (B) water from a septic tank that receives wastewater from the main tourism house and apartments, (C) outlet of the CW receiving treated wastewater, and (D) pond.
Table 3.
Results of the one-way ANOVA performed to test the influence of the concentration of each wastewater/water sample (A–D) on R. subcapitata growth rate, as well as the effective concentration (ECx) values estimated and the corresponding 95% confidence intervals (CIs).
Table 3.
Results of the one-way ANOVA performed to test the influence of the concentration of each wastewater/water sample (A–D) on R. subcapitata growth rate, as well as the effective concentration (ECx) values estimated and the corresponding 95% confidence intervals (CIs).
| Sample | One-Way ANOVA | ECx |
|---|---|---|
| A * | F (5,12) = 2217; p < 0.0001 | EC50 = 74.60 (70.79–78.41) EC20 = 67.04 (65.32–68.76) EC10 = 62.98 (60.56–65.40) |
| B * | F (5,12) = 2418; p < 0.0001 | EC50 = 32.42 (30.99–33.84) EC20 = 29.21 (28.63–29.79) EC10 = 27.48 (26.36–28.60) |
| C * | F (5,12) = 875.4; p < 0.0001 | EC50 = 69.83 (48.16–91.51) EC20 = 35.27 (13.99–56.55) EC10 = 23.65 (3.62–43.68) |
| D * | F (5,12) = 110.1; p < 0.0001 | EC50 = 16.59 (9.81–23.37) EC20 = 9.82 (1.47–18.19) EC10 = 7.23 (−0.93–15.40) |
Notes: * Sampling points: (A) water from a septic tank that receives wastewater from the laundry, main kitchen, and one bathroom, (B) water from a septic tank that receives wastewater from the main tourism house and apartments, (C) outlet of the CW receiving treated wastewater, and (D) pond.
Table 4.
Results of the one-way ANOVA performed to test the influence of the concentration of each wastewater/water sample (B–D) on L. minor growth rate, as well as the ECx values estimated and corresponding 95% confidence intervals.
Table 4.
Results of the one-way ANOVA performed to test the influence of the concentration of each wastewater/water sample (B–D) on L. minor growth rate, as well as the ECx values estimated and corresponding 95% confidence intervals.
| Sample | One-Way ANOVA | ECx |
|---|---|---|
| B * | F = 555.5; df = 5, 12; p < 0.0001 | Frond number based EC50 = 19.89 (18.59–21.18) EC20 = 12.79 (11.08–14.51) EC10 = 9.88 (8.09–11.67) |
| F = 204.3; df = 5, 12; p < 0.0001 | Dry weight based EC50 = 21.06 (18.42–23.70) EC20 = 14.17 (10.68–17.66) EC10 = 11.24 (7.47–15.01) | |
| C * | F = 258.9; df = 5, 12; p < 0.0001 | Frond number based EC50 = 39.25 (29.80–48.69) EC20 = 17.54 (9.81–25.27) EC10 = 10.94 (4.41–17.47) |
| F = 134.9; df = 5, 12; p < 0.0001 | Dry weight based EC50 = 47.66 (39.78–55.55) EC20 = 30.75 (21.86–39.63) EC10 = 23.78 (14.60–32.97) | |
| D * | F = 101.2; df = 5, 12; p < 0.0001 | Frond number based EC50 = 35.83 (29.34–42.32) EC20 = 11.83 (7.38–16.27) EC10 = 6.18 (2.95–9.40) |
| F = 693.2; df = 5, 12; p < 0.0001 | Dry weight based EC50 = 42.01 (38.06–45.96) EC50 = 22.25 (18.58–25.91) EC10 = 15.33 (11.96–18.70) |
Notes: * Sampling points: (B) water from a septic tank that receives wastewater from the main tourism house and apartments, (C) outlet of the CW receiving treated wastewater, and (D) pond.
Table 5.
EC50 values corresponding to the sample dilution that causes a 50% inhibition in Aliivibrio fischeri bioluminescence after different exposure periods of two wastewater (A–C) and pond water (D) samples.
Table 5.
EC50 values corresponding to the sample dilution that causes a 50% inhibition in Aliivibrio fischeri bioluminescence after different exposure periods of two wastewater (A–C) and pond water (D) samples.
| Mean EC50 (Min.–Max.) (%) | ||||||
|---|---|---|---|---|---|---|
| Exposure Time | 5 min | 15 min | 30 min | |||
| Sampling Point/Time | 1 | 2 | 1 | 2 | 1 | 2 |
| A * | 17.3 (15.9–18.8) | 12.5 (12.1–12.8) | 13.0 (12.9–13.1) | 10.8 (10.4–11.2) | 13.4 (11.8–15.1) | 13.0 (10.1–16.8) |
| B * | 16.3 (11.2–23.8) | 26.6 (21.7–32.6) | 13.2 (9.5–18.4) | 24.4 (21.0–28.3) | 14.5 (9.8–21.3) | 13.7 (13.6–13.7) |
| C * | NT | HE: 11.8 | HE: 6.5 | HE: 10.2 | HE: 5.6 | HE: 14.5 |
| D * | NT | HE: 13.4 | NT | NT | NT | NT |
Notes: NT: Nontoxic; HE: Highest effect in percentage. * Sampling points: (A) water from a septic tank that receives wastewater from the laundry, main kitchen, and one bathroom, (B) water from a septic tank that receives wastewater from the main tourism house and apartments, (C) outlet of the CW receiving treated wastewater, and (D) pond.
© 2019 by the authors. Licensee MDPI, Basel, Switzerland. This article is an open access article distributed under the terms and conditions of the Creative Commons Attribution (CC BY) license (http://creativecommons.org/licenses/by/4.0/).
Share and Cite
MDPI and ACS Style
Calheiros, C.S.C.; Castro, P.M.L.; Gavina, A.; Pereira, R. Toxicity Abatement of Wastewaters from Tourism Units by Constructed Wetlands. Water 2019, 11, 2623. https://doi.org/10.3390/w11122623
AMA Style
Calheiros CSC, Castro PML, Gavina A, Pereira R. Toxicity Abatement of Wastewaters from Tourism Units by Constructed Wetlands. Water. 2019; 11(12):2623. https://doi.org/10.3390/w11122623
Chicago/Turabian StyleCalheiros, Cristina S. C., Paula M. L. Castro, Ana Gavina, and Ruth Pereira. 2019. "Toxicity Abatement of Wastewaters from Tourism Units by Constructed Wetlands" Water 11, no. 12: 2623. https://doi.org/10.3390/w11122623
Note that from the first issue of 2016, this journal uses article numbers instead of page numbers. See further details here.