Analysis of the Inhomogeneous Effect of Different Meteorological Trends on Drought: An Example from Continental Croatia


Faculty of Civil Engineering and Architecture, Josip Juraj Strossmayer University of Osijek, Ulica V.Preloga 3, 31000 Osijek, Croatia
*
Author to whom correspondence should be addressed.
Water 2019, 11(12), 2625; https://doi.org/10.3390/w11122625
Submission received: 30 October 2019
/
Revised: 4 December 2019
/
Accepted: 10 December 2019
/
Published: 12 December 2019
(This article belongs to the Special Issue Management of Hydrological Extremes: Floods and Droughts)
Abstract
:The majority of central Europe has a transitional climate type as a result of interactions between maritime and continental climates. This study focuses on the appearance and severity of drought in continental Croatia, which is part of the transitional climate area. It is situated between 15° E and 19° E. The altitude declines from west (167 m a.s.l) to east (88 m a.s.l.). The time period analysed is 1981–2018. Air temperature and precipitation data series from 13 meteorological stations were analysed. The analysis was done on an annual basis to define the spatio-temporal variability in air temperature and precipitation and their impact on drought episodes using the standardised evapotranspiration precipitation index. Different statistical methods (e.g., the nonparametric Mann–Kendall test and agglomerative hierarchical clustering) were used to examine the trend homogeneity of the analysed region. The analysis indicated inhomogeneity across the study area in terms of what significantly impacted the occurrence and severity of droughts. Drought occurrence is influenced more strongly by increasing trends in air temperature as compared with increasing or decreasing precipitation trends. The probability of severe drought occurrence was estimated using a copula function, and the results demonstrated that areas with higher precipitation could be more exposed to drought. Furthermore, the results demonstrated the impacts of specific regional characteristics on drought occurrence, severity, and duration, which indicates that small-scale research on droughts is more reliable.
1. Introduction
One of the main characteristics of climate change is a higher frequency of extreme hydrological events, such as floods and droughts. Droughts have greater global influence relative to floods as they can affect entire regions, even continents [1].
Climate change due to global warming has been one of the most prominently studied topics in the past few decades. Many papers have been published analysing changes in the hydrological cycle and predictions of its future impact on ecological, geomorphological, and economic processes. Changes in precipitation, in particular, have significant consequences on the hydrological cycle and availability of water resources. This can lead to changes in ground water recharge and water availability, modification of fluvial regimes, and an increased risk of floods [2]. However, spatial coherence of hydrological extremes is very low [3]. The 2007 Intergovernmental Panel on Climate Change (IPCC) report stressed that very frequent regional and sub-regional variabilities in hydrological extremes require further investigation [4].
Drought vulnerability is especially severe in southern Europe, which is characterised by the Mediterranean climate [5,6,7,8,9]. Studies performed in Italy, Cyprus, Portugal, and Israel demonstrated significant negative trends for annual precipitation and mainly positive trends for drought and desertification on an annual and seasonal basis.
As the latest IPCC report [4] has shown, there is some confidence that droughts will intensify in the 21st century in some seasons and areas—including southern Europe and the Mediterranean region—due to reduced precipitation, increased evapotranspiration, or both.
There is interesting research based on one of the newest gridded databases with monthly rainfall data evaluated for a large area of the Northern Hemisphere for the period 1951–2016. According to the 12- and 24-month standardised precipitation index (SPI), the worst drought events occurred between October 2001 and August 2002 and involved about 12% and 13.5% of the grid points. As a result, drought in Europe and the Mediterranean basin appears to have a higher impact on water resource management than on vegetation and agricultural practices [10].
Validation of global models, however, must be done using observations on smaller scales—for example, on catchment areas with different characteristics, as in studies by Stahl et al. [11], Gudmundsson et al. [12], and Prudhomme et al. [13].
However, winter precipitation extremes may indicate more complex and less coherent changes in eastern, rather than western, Europe [14]. This research leads to the problem of transitional climate regions that show serious drying [15]. At the same time, analysis of temperature extremes and precipitation projections in central Europe suggests that most dry and very dry models are unrealistic, due to different land-atmosphere coupling strengths [16].
The method, also usually used for drought estimation, is the standardised precipitation evapotranspiration index (SPEI). The method is based on a combination of precipitation and temperature data. It is similar to SPI but includes the effects of temperature variability on drought assessment [17]. Many papers have shown the reliability of this method, Reference [18], for example, correlated annual SPEI with satellite-observed terrestrial water storage. According to results obtained by Tirivarombo et al. [19], SPEI identifies more droughts than SPI, particularly those with increased duration and severity. The 12-month SPEI shows high correlation with 12-month accumulated runoff, while the 3-month SPI is well correlated with soil moisture content, which defines crop water requirements during the vegetation period [20]. Another face of climate change is precipitation variation. It has a significant impact on water balance components causing dry conditions by decreasing run off and soil water content at a seasonal scale [21].
This study examines precipitation and air temperature changes (trends) over the period 1981–2018 and their impacts on drought occurrence in the continental part of Croatia. These two meteorological parameters are essential for drought estimation. They are also strongly influenced by climate change, which occurs on a global scale but has variable effects in different geographical locations. The analysis is focused on investigating the level of homogeneity of drought vulnerability across the study area in relation to meteorological trends with significance coefficients.
2. Materials and Methods
2.1. Study Area
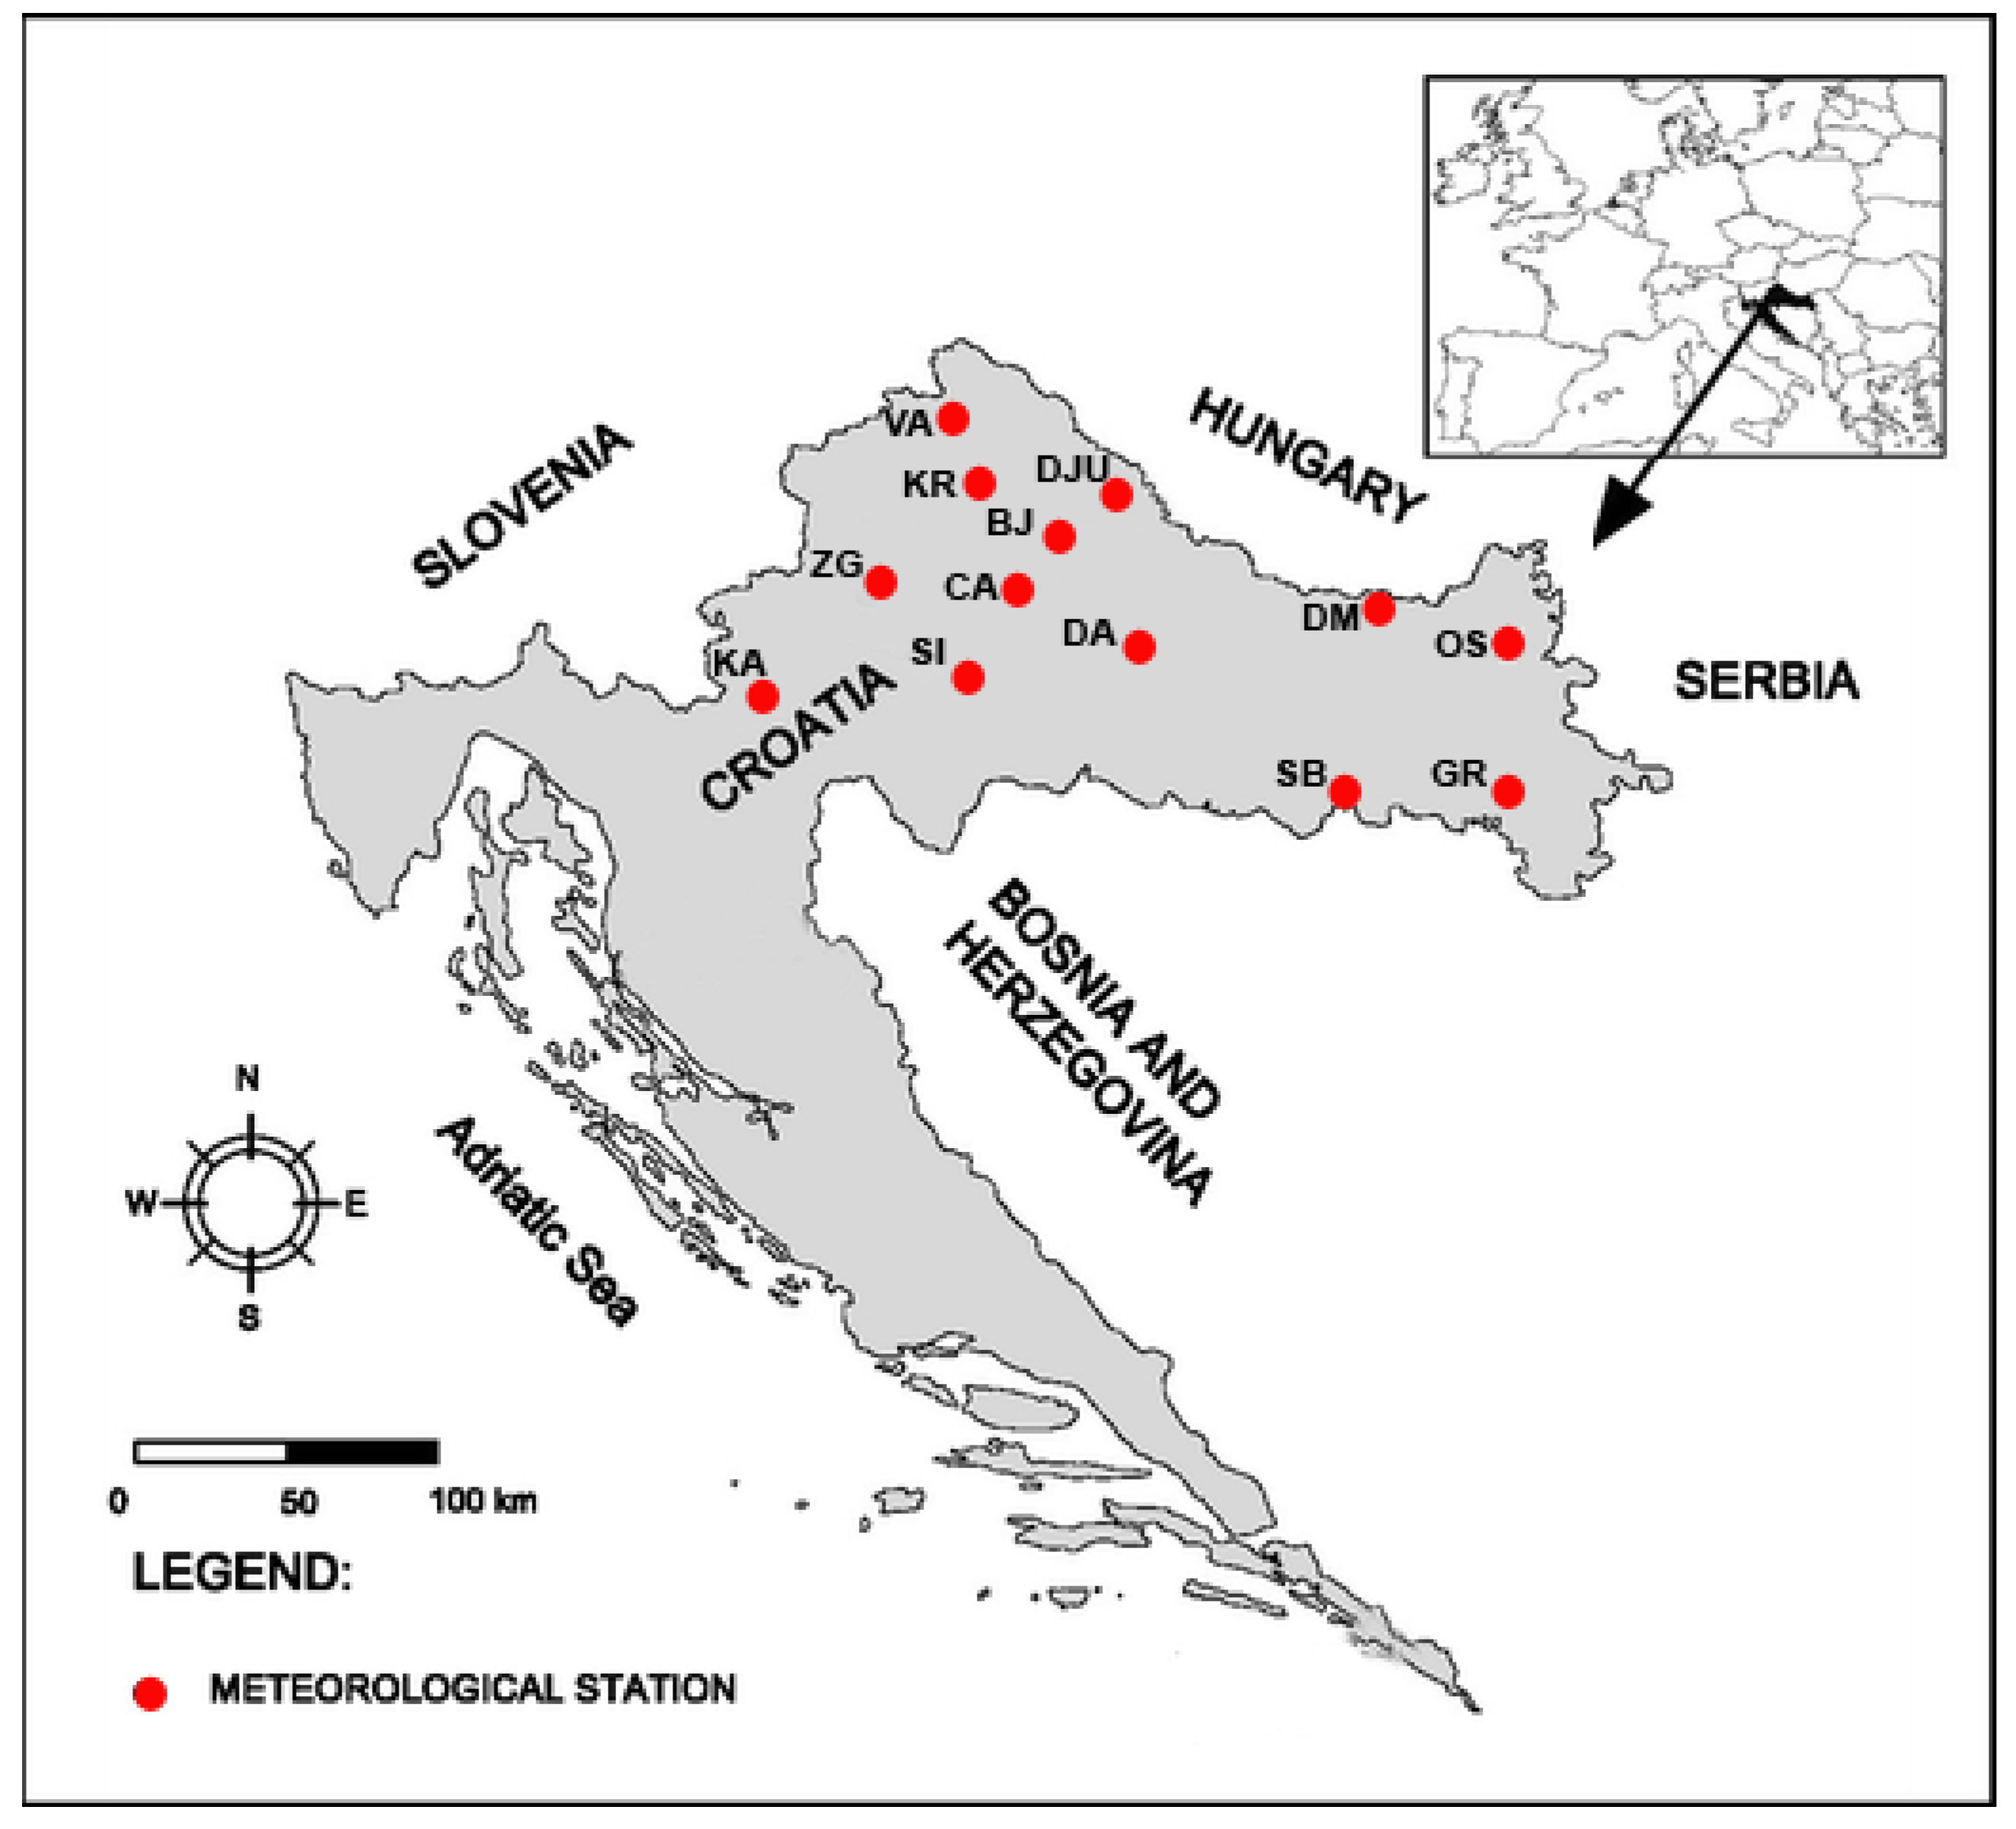
The study area is the continental region of Croatia. It is part of the Danube River Basin (Figure 1). It covers about 60% of the total area of Croatia (35,000 km2) and is mainly lowland. The altitude declines from west (167 m a.s.l) to east (88 m a.s.l.). It is situated between 15° E and 19° E (Table 1), and consequently, the distribution of annual precipitation—which is significantly related to geographical location—decreases from west to east. Despite the negative annual precipitation trends seen in Croatia since the beginning of the 21st century, its eastern region shows a positive but not significant annual precipitation trend that is similar to that of central Europe [22].
According to the Sixth National Communication of the Republic of Croatia under the United Nations Framework Convention on Climate Change, trends in air temperature during the period 1961–2010 show warming throughout Croatia, especially in the continental (mainland) part of the country and the Dalmatian hinterland [23]. Higher frequencies of extreme droughts have been more pronounced in the last decade [24].
The 13 meteorological stations included in this investigation are spread relatively uniformly over the study area (Figure 1). The time series of monthly precipitation and air temperature during the period 1981–2018 was used for analysis on an annual time scale.
2.2. Data Set
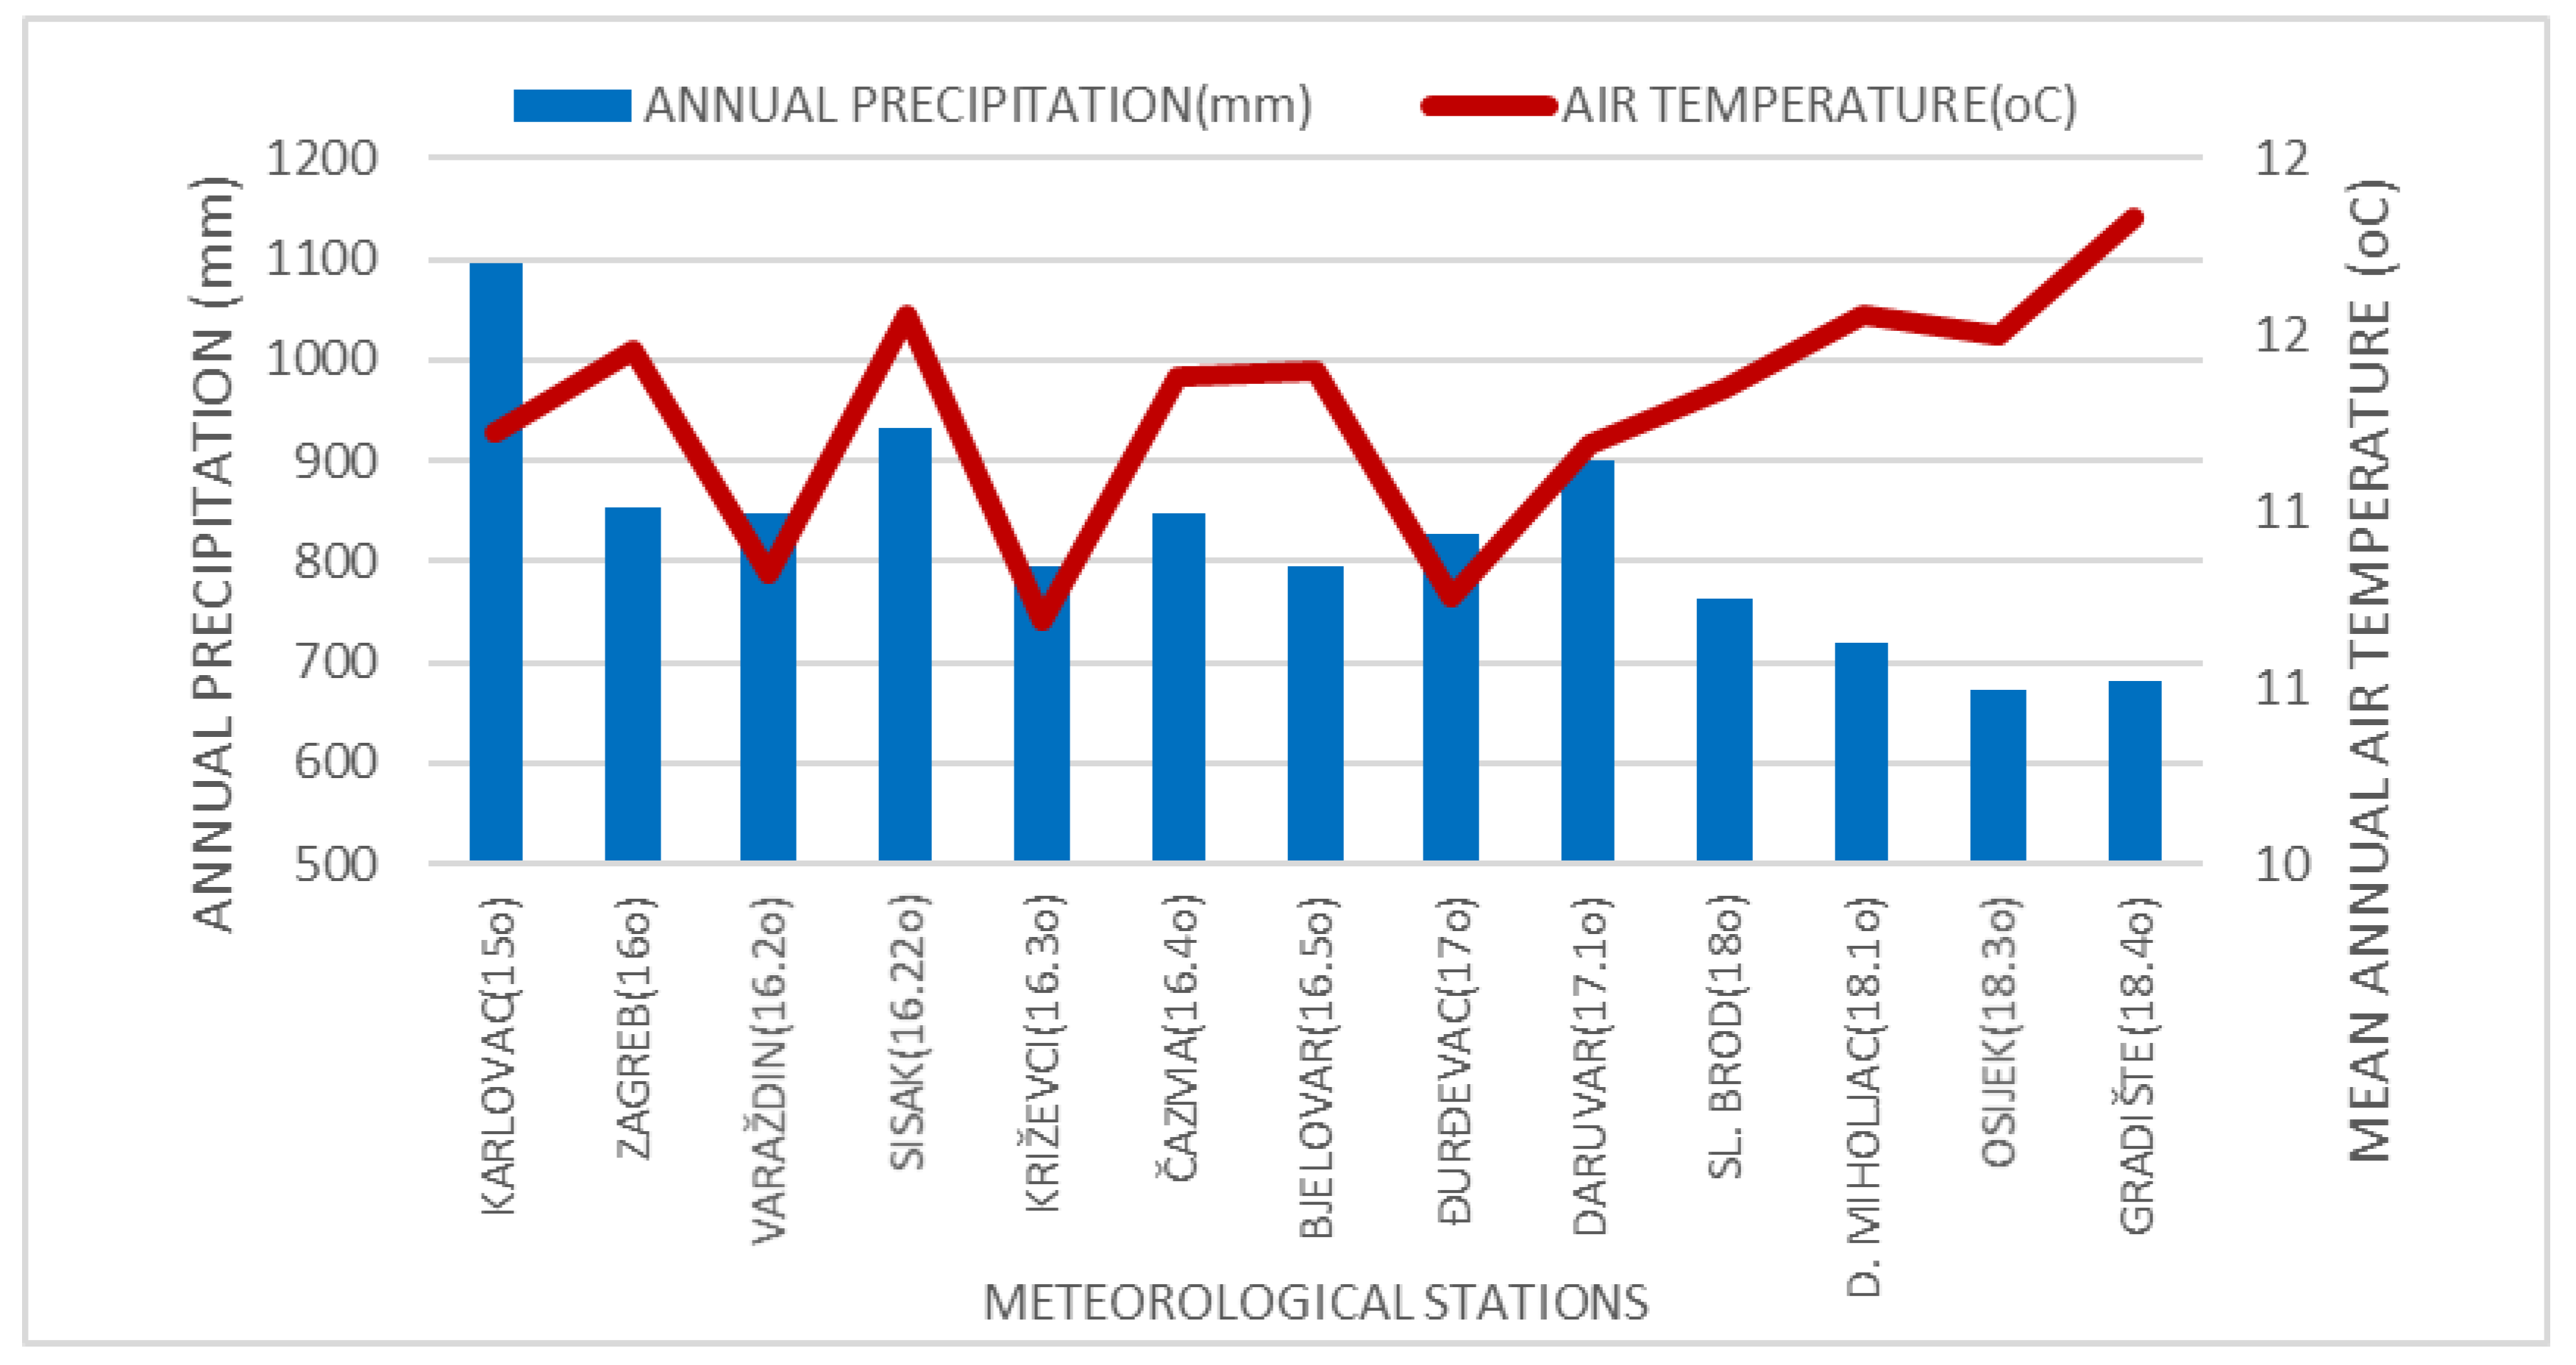
The data used in the drought analysis consisted of mean monthly and annual air temperatures between 1981 and 2018, and monthly and annual precipitation data from the same period was also used. Mean annual air temperature in the analysed period varied between 10.7 and 11.8 °C and generally increased from west to east. However, annual precipitation decreased from west to east (Figure 2). Other variables related to drought frequency, duration and severity—such as SPEI—were calculated for the same period. The time scale of drought analysis was 12 months.
2.3. Methodology
The drought analysis began with air temperature and precipitation temporal changes, which are basic variables for measuring drought prevalence and severity. The homogeneity of the air temperature and precipitation time series (1981–2018) were tested using the rescaled adjusted partial sums (RAPS) method. This test helps overcome random changes, errors, and variabilities in a time series. Consequently, the time series was divided into several homogeneous sub-periods based on an F-test and t-test at level p < 0.05. A visualisation approach based on RAPS overcame small systematic changes in the records and the variability of data values. The RAPS visualisation highlights trends, shifts, data clusters, irregular fluctuations, and periodicities in the record [25,26]. RAPS was calculated according to the following [25]:
where is the mean value of observed time series, Sy is the standard deviation, Yt is the observed parameter, and k is the counter.
Additionally, the Mann–Kendall non-parametric test was applied to determine the existence of significant temporal changes and trends in air temperature and precipitation [27,28,29,30]. The test statistic ZMK is described as below:
where positive and negative values depict, respectively, an upward and downward trend for a given period. Trends at α = 0.001, 0.01, 0.05, and 0.1 levels of significance were tested [31].
The analysis confirmed that the most appropriate drought index is the SPEI due to the potentially significant influence of air temperature temporal changes on water deficiency. The SPEI is already one of the most prevalent methods for drought evaluation in the study area [32]. Other methods for drought quantification—such as the SPI, percent of normal precipitation, rainfall anomaly index, decile index, and many others—are based only on precipitation. The integrated drought index, which considers precipitation and evapotranspiration, is more conclusive than indices based only on temperature and precipitation [33]. The SPEI was proposed by Vicente-Serrano [17] and can be used on different time scales, the most frequent being 1, 3, 6, 12, and 24 months, as these reflect different drought types. It is based on the same calculation as the SPI, which uses the normalised gamma distribution of precipitation and provides a number of standard deviations with regard to an average value [34,35]. The only difference is that precipitation is replaced by the difference between precipitation and potential evapotranspiration. The classification of SPEI values is shown in Table 2. Potential evapotranspiration was calculated based on the Thornthwaite equation. Possible trends and the existence of sub-periods for the calculated SPEI values were also visualised and examined using RAPS.
Run theory can be used to define drought severity, duration, and intensity. This is the most frequently used method to identify drought events which occur if the SPEI value is less than the chosen truncation level [37]. In this paper, this level is set at zero to obtain longer time series which will then be analysed based on the Copula function. Negative values indicate dry conditions. For every drought period (SPEI < 0), duration and severity were determined.
After identifying drought characteristics, such as duration and severity, based on run theory, the Copula function was used in order to combine these two variables. The Copula function is an effective method for describing correlation among multiple variables. It can construct joint distribution among multiple variables without considering the type of univariate marginal distribution and can combine the joint cumulative distribution function with the marginal distribution function of variables [34]. Sklar indicated that the copula was a joint function, which has been widely used in meteorological drought, hydrological drought, and flood disaster analysis [38]. In this paper, the bivariate copula was used to identify the correlation between drought duration and severity and probability of occurrence with different duration and severity for all stations.
A bivariate copula C is a joint distribution function of two uniform random variables and can be written as follows [38,39,40]:
C: (0,1)2→(0,1).
The following two conditions must be fulfilled: C(1,u) = C(u,1) = u and C(u,0) = C(0,u) = 0, and C(u1,u2) + C(v1,v2) − C(u1,u2) − C(v1,v2) ≥ 0, if u1 ≥ v1, u2 ≥ v2 and u1, u2, v1, v2 ∈ (0,1). The link between the copula and the joint distributions is based on Sklar’s theorem:
where FX,Y(x,y) is the joint cumulative distribution function of the random variables, and FX, FY are the marginal distribution functions. The marginal distributions for drought duration and severity for all stations were obtained based on the Schwarz information criterion (SIC—also known as the Bayesian information criterion or BIC), Akaike information criterion (AIC), and Hannan–Quinn information criterion (HQIC). Based on the same information criteria, the most appropriate bivariate copula function, among different types of copulas such as Frank, Gumbel, Normal, Clayton, and T, was selected for modelling random samples of duration and severity. During the correlation analysis, an uncertainty parameter was included. Marginal distributions and copulas were determined with ModelRisk, which is a Monte Carlo simulation add-in for Microsoft Excel.
FX,Y(x,y) = C(FX(x), FY(y)),
Another factor is related to the significance of spatial changes in air temperature and precipitation, as demonstrated in Figure 2. As air temperature increases from west to east, precipitation decreases; however, the significance of these trends should be checked in order to define any potential outliers in the study area. Agglomerative hierarchical clustering (AHC) was applied to consider this. This helped us group the 13 meteorological stations into several clusters on the basis of dissimilarities. Finally, the correlation between clusters was estimated using the Pearson correlation coefficient between the dissimilarity matrix used for the AHC and the cophenetic distance matrix. The closer to 1 the correlation, the better the quality of the clustering. The results of the AHC are presented in dendrograms. The geometry of a dendrogram indicates the size of the clusters and their level of homogeneity. The first level of data points (stations) has the greatest level of homogeneity within a cluster. The vertical axis refers to the distance between data points within a cluster or between clusters depending on the correlation value between the data points or clusters. The truncation level (cut-off line) is based on the general behaviour of the data points across several clusters.
3. Results
3.1. Temporal Variability
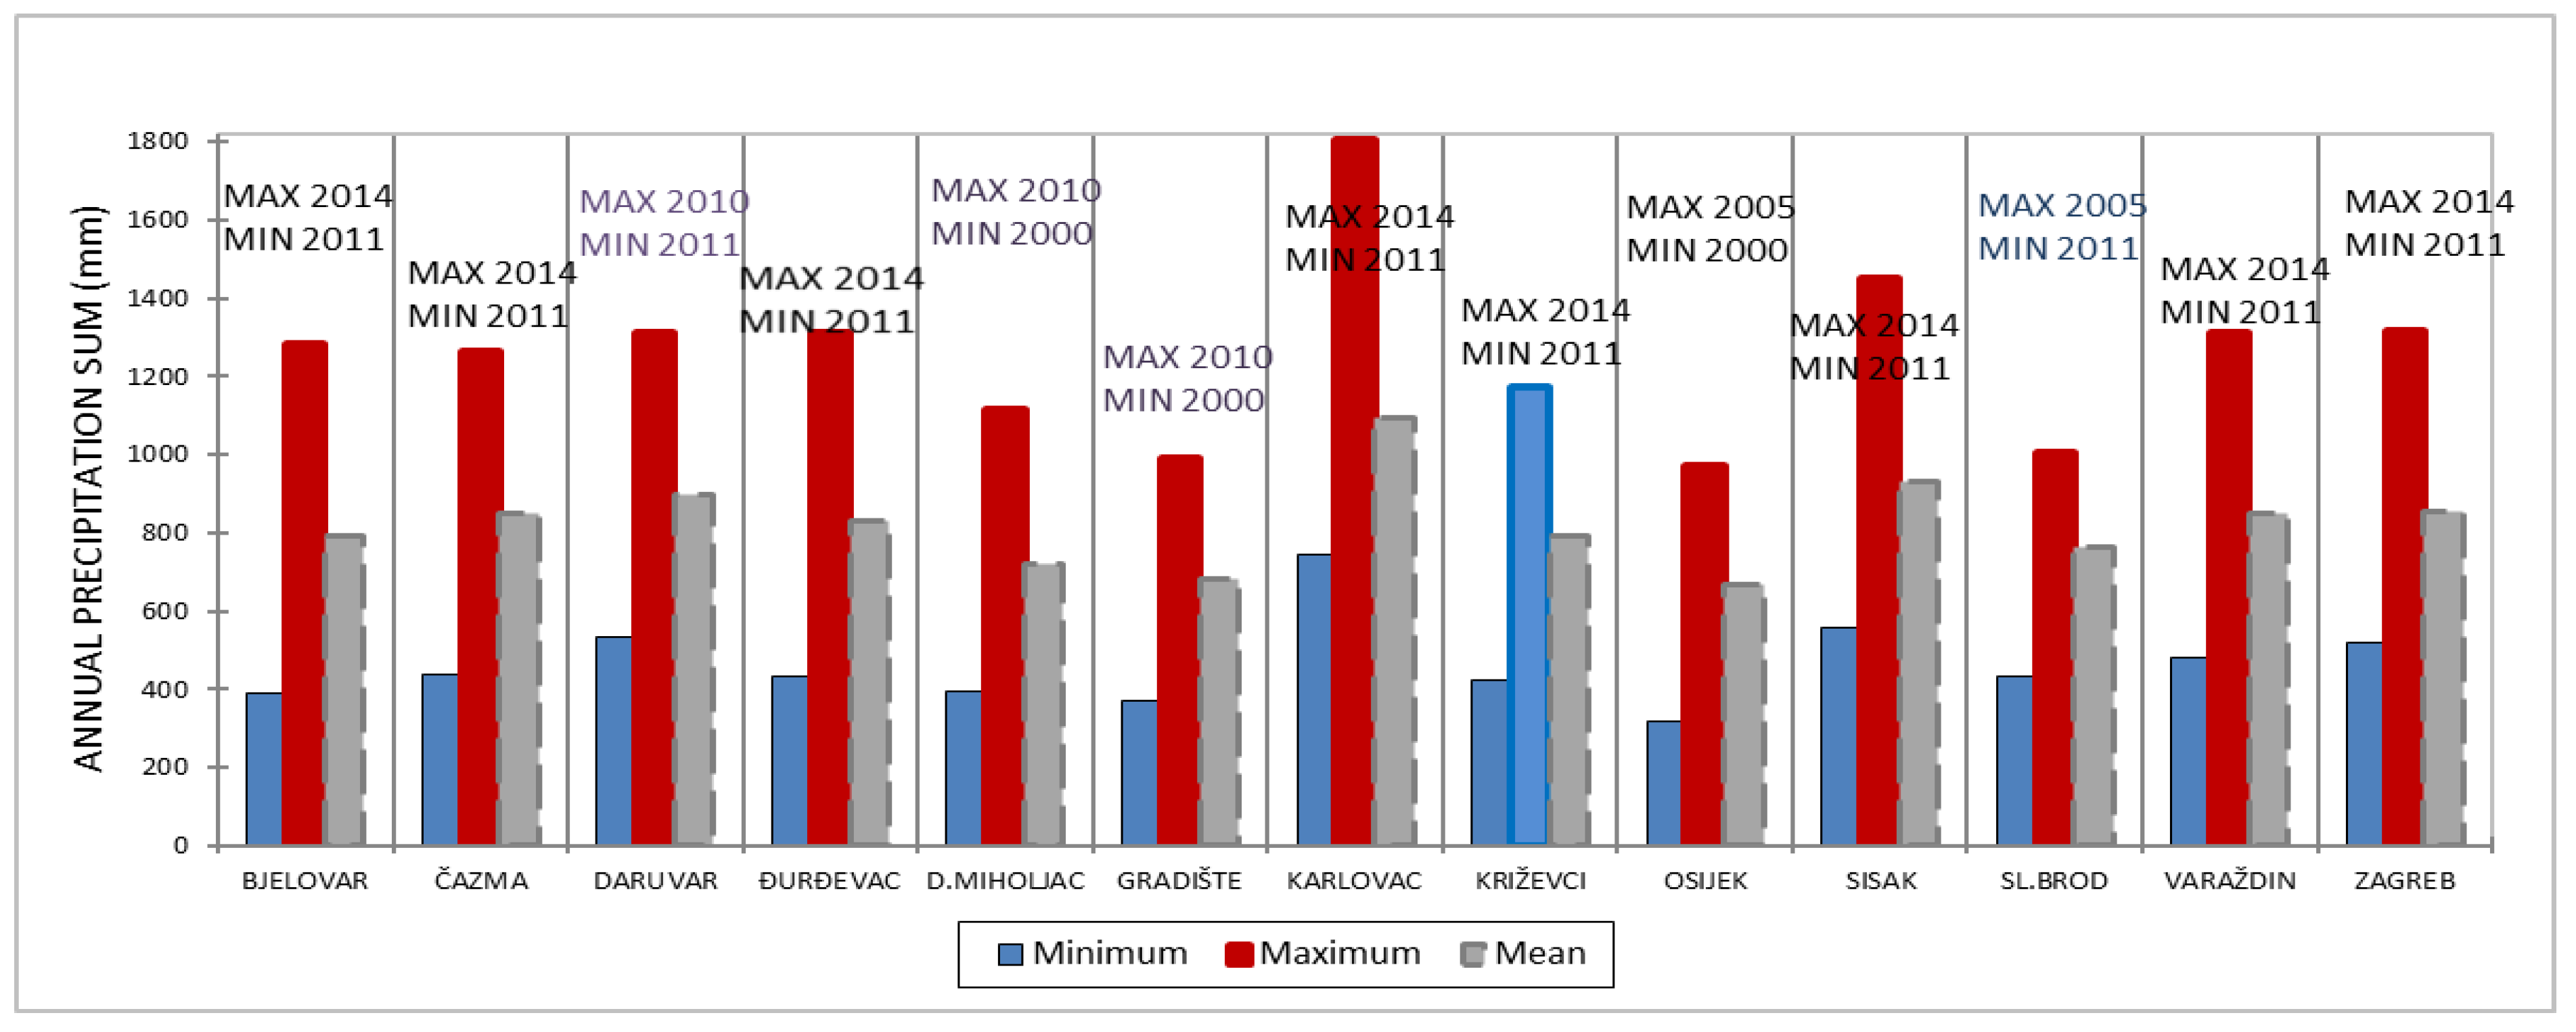
Minimum, maximum, and mean annual precipitation sums between 1981 and 2018 at 13 meteorological stations are presented in Figure 3. The years 2000 and 2011 were extremely dry in the entire study area. However, 2010 and 2014 were wet years as the annual precipitation was greater than the average at the most stations. Temporal statistical homogeneity was tested by the RAPS method and showed that all meteorological stations have homogeneous annual precipitation data series. Increasing precipitation trends are insignificant (Table 3). Only two stations have a weakly increasing trend at a 95% confidence level (α = 0.05).
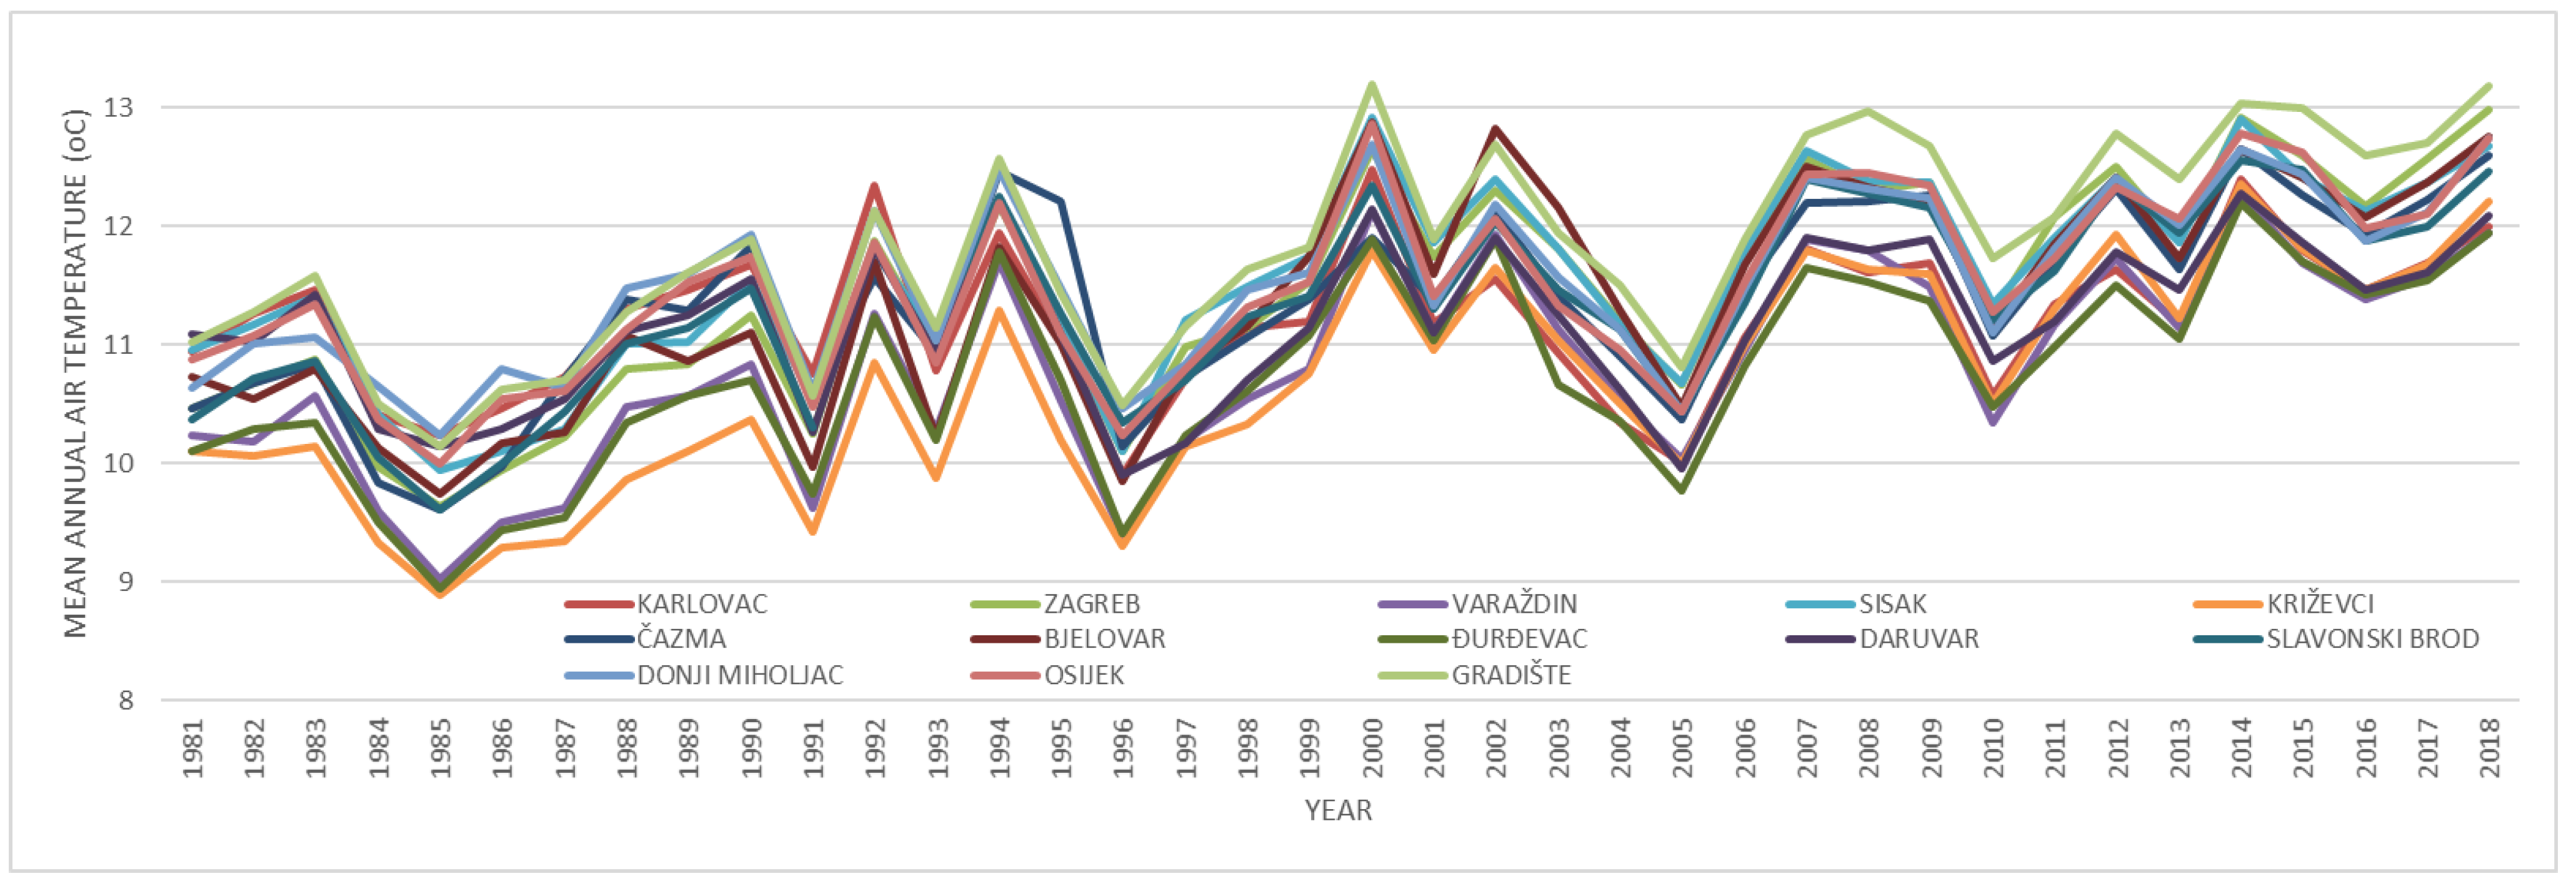
Mean annual air temperature over the period has a clear upward trend (Figure 4). Homogeneity was again tested by the RAPS method. The results show the existence of inhomogeneity, and the total series can be divided into two sub-series, with a substantially higher mean annual air temperature in the second sub-period (between 0.7 and 1.5 °C higher). The division of the two series occurs between 1998 and 2006 (Table 4). For the tested significance levels, the following symbols are used: ***red, if the trend is at the α = 0.001 level of significance, **orange, if the trend is at the α = 0.01 level of significance, and *yellow, if the trend is at the α = 0.05 level of significance (Table 4, Table 5 and Table 6) [31].
Regarding mean air temperature, most stations have a significant increasing trend (Table 4). Only two stations have a positive, but insignificant, mean air temperature trend.
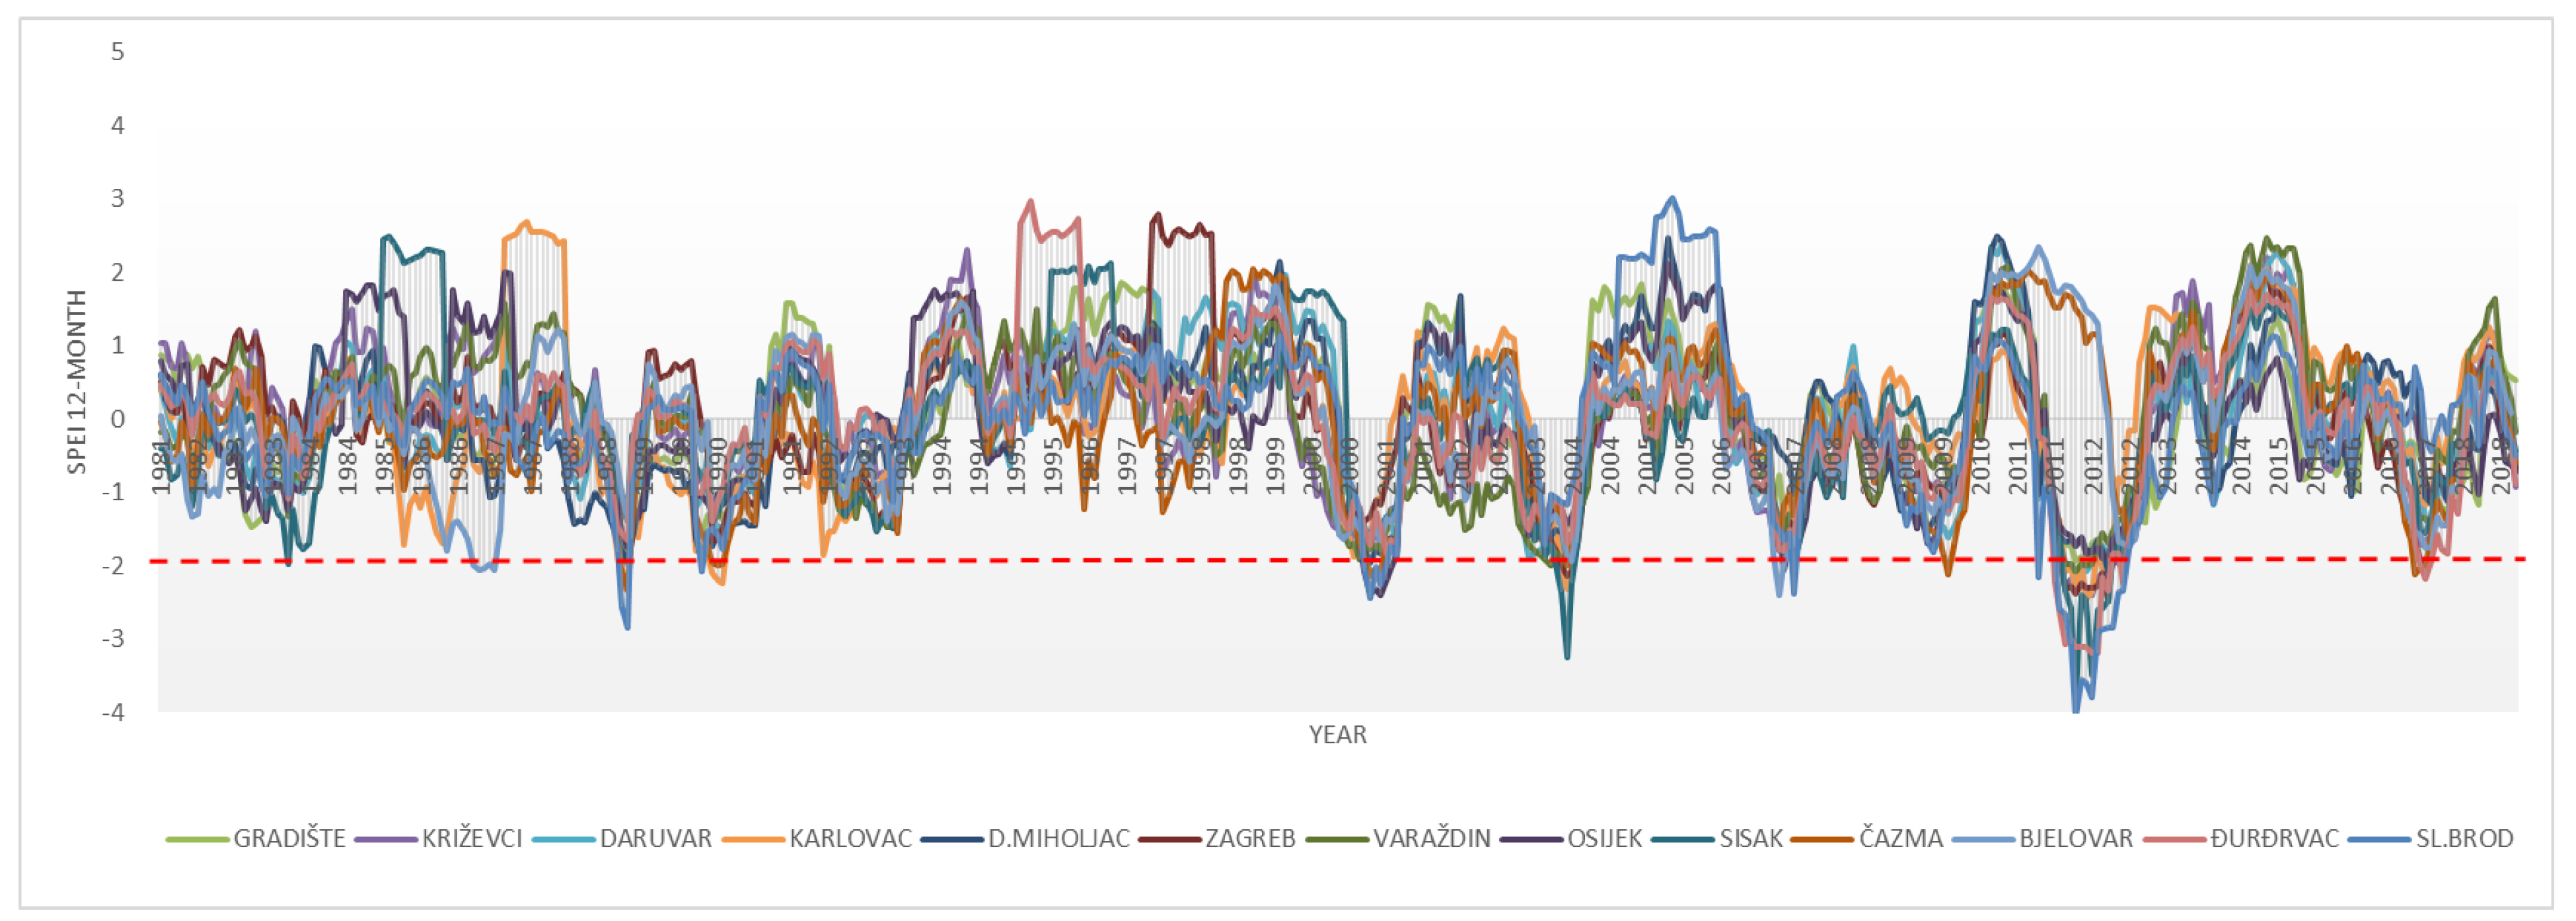
Previous analyses show that air temperature is a more dominant climate change feature than precipitation regime (Figure 3 and Figure 4). This conclusion leads to SPEI being the most appropriate drought index for drought evaluation. As explained previously, the main advantage of this method is the inclusion of temperature in drought assessment. Figure 5 presents SPEI 12-month values, illustrating that extreme droughts (red dashed line) (SPEI < −2) occurred in 2000, 2003, and 2011. These correspond with the extremely dry years (Figure 3).
Similar to the mean annual air temperatures, the time series of SPEI-12-month is not homogeneous. However, the break year between the two sub-periods is more variable, moving between 1993 and 2010 (Table 5). Regarding the Mann–Kendall trend coefficients of SPEI, seven of the 13 analysed stations show an increasing trend. The other six stations have negative SPEI trends, meaning drier conditions. However, values, in both cases, are statistically insignificant (Table 5).
3.2. Spatial Variability
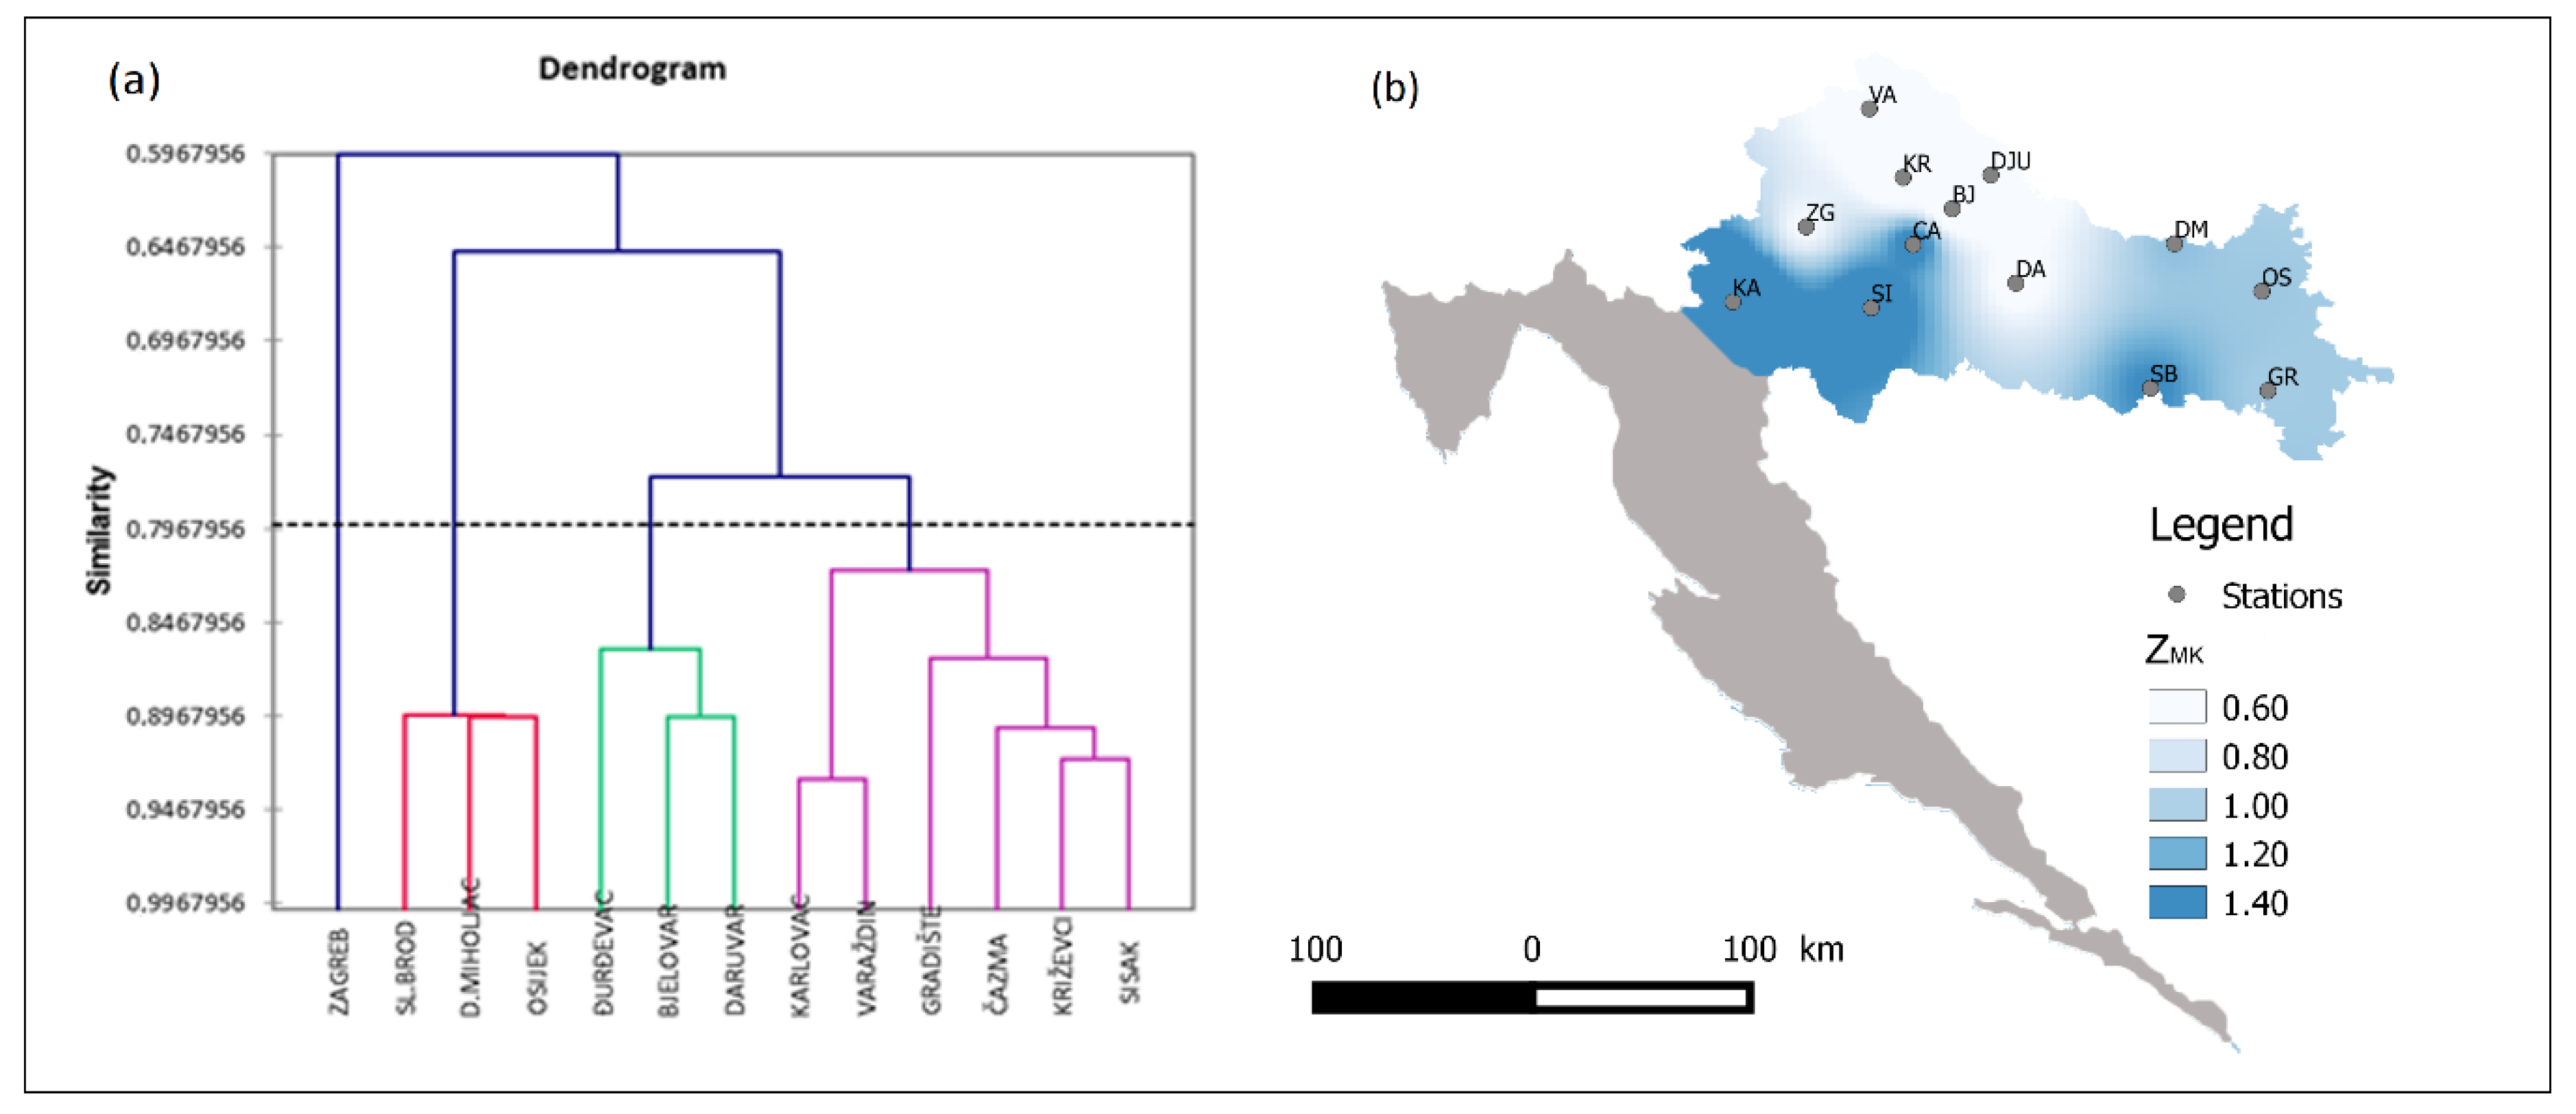
Analysis of drought significance, in the spatial sense, was done by applying agglomerative hierarchical clustering (AHC). This statistical method clusters variables (precipitation, air temperature, and SPEI trend coefficients) into several classes on the basis of dissimilarities. The results of the AHC are presented in dendrograms. Annual precipitation generally decreases from west to east. Figure 6a,b show four clusters in trend significance. The most significant upward trends in precipitation occur in the western region, especially in the region with higher altitude. The greatest downward trend is in the north-west region of the study area. Therefore, the eastern part which has the lowest annual precipitation is characterised by an increasing annual precipitation trend with the highest level of homogeneity.
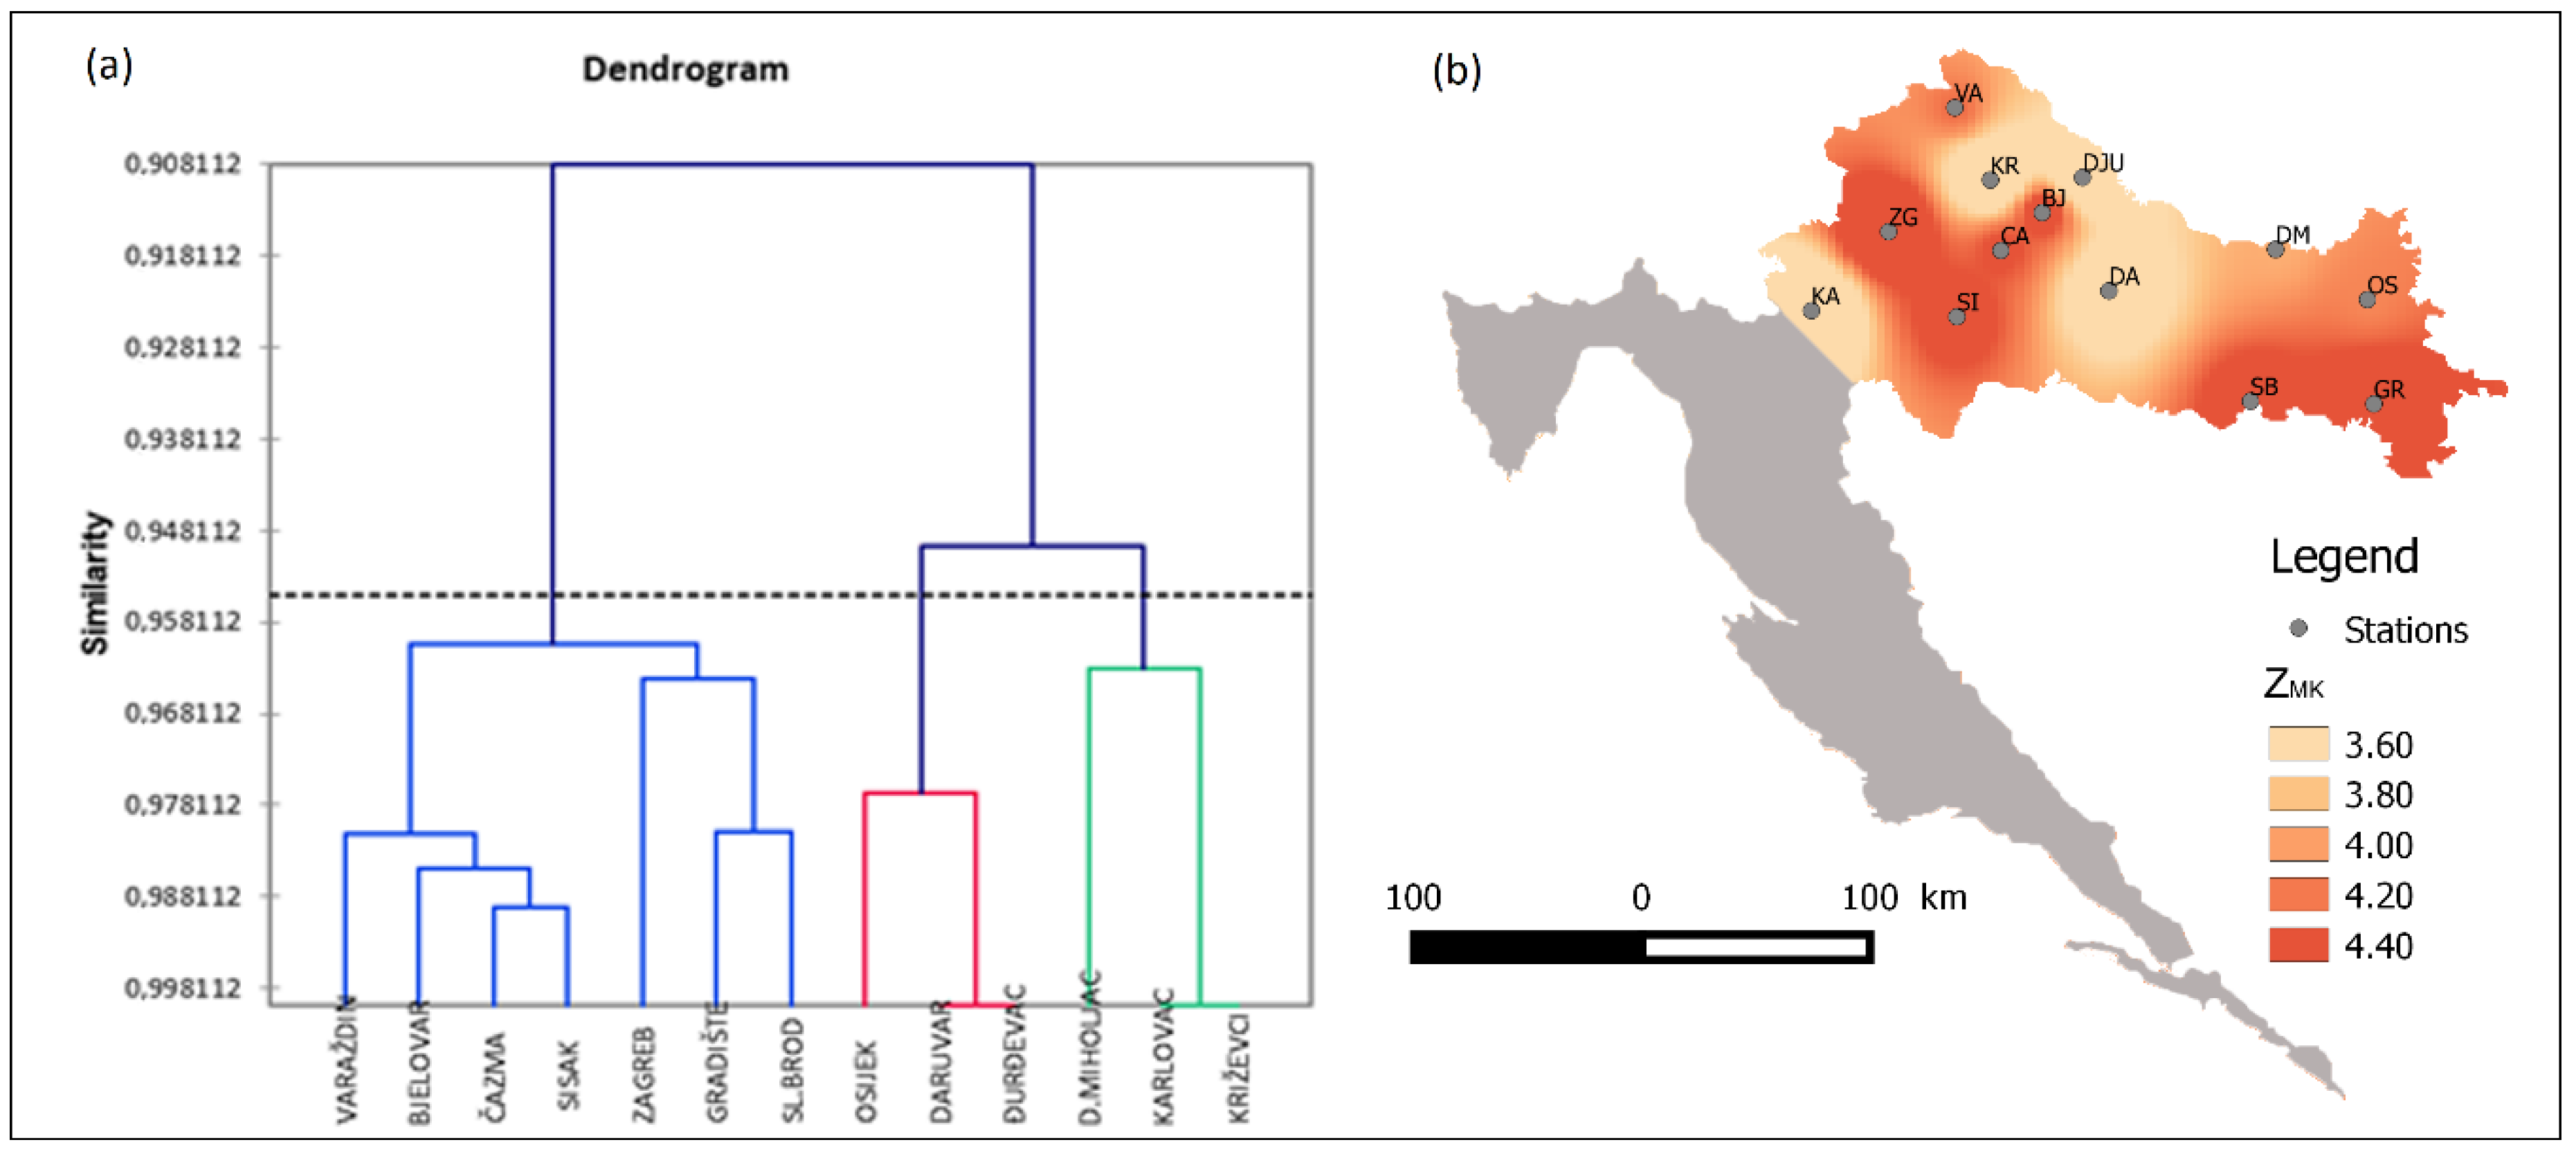
Air temperature increase is a substantial characteristic of climate change and strongly influences evapotranspiration increase and the development of dry conditions. Significant upward trends in mean annual temperatures were determined at most of the meteorological stations. Figure 7a,b show three clusters of trend significance. The most significant upward trend in precipitation occurs in the western region, especially in the higher altitude region. The largest downward trend is in the north-west region. However, the eastern region which has the lowest annual precipitation is characterised by an increasing annual precipitation trend.
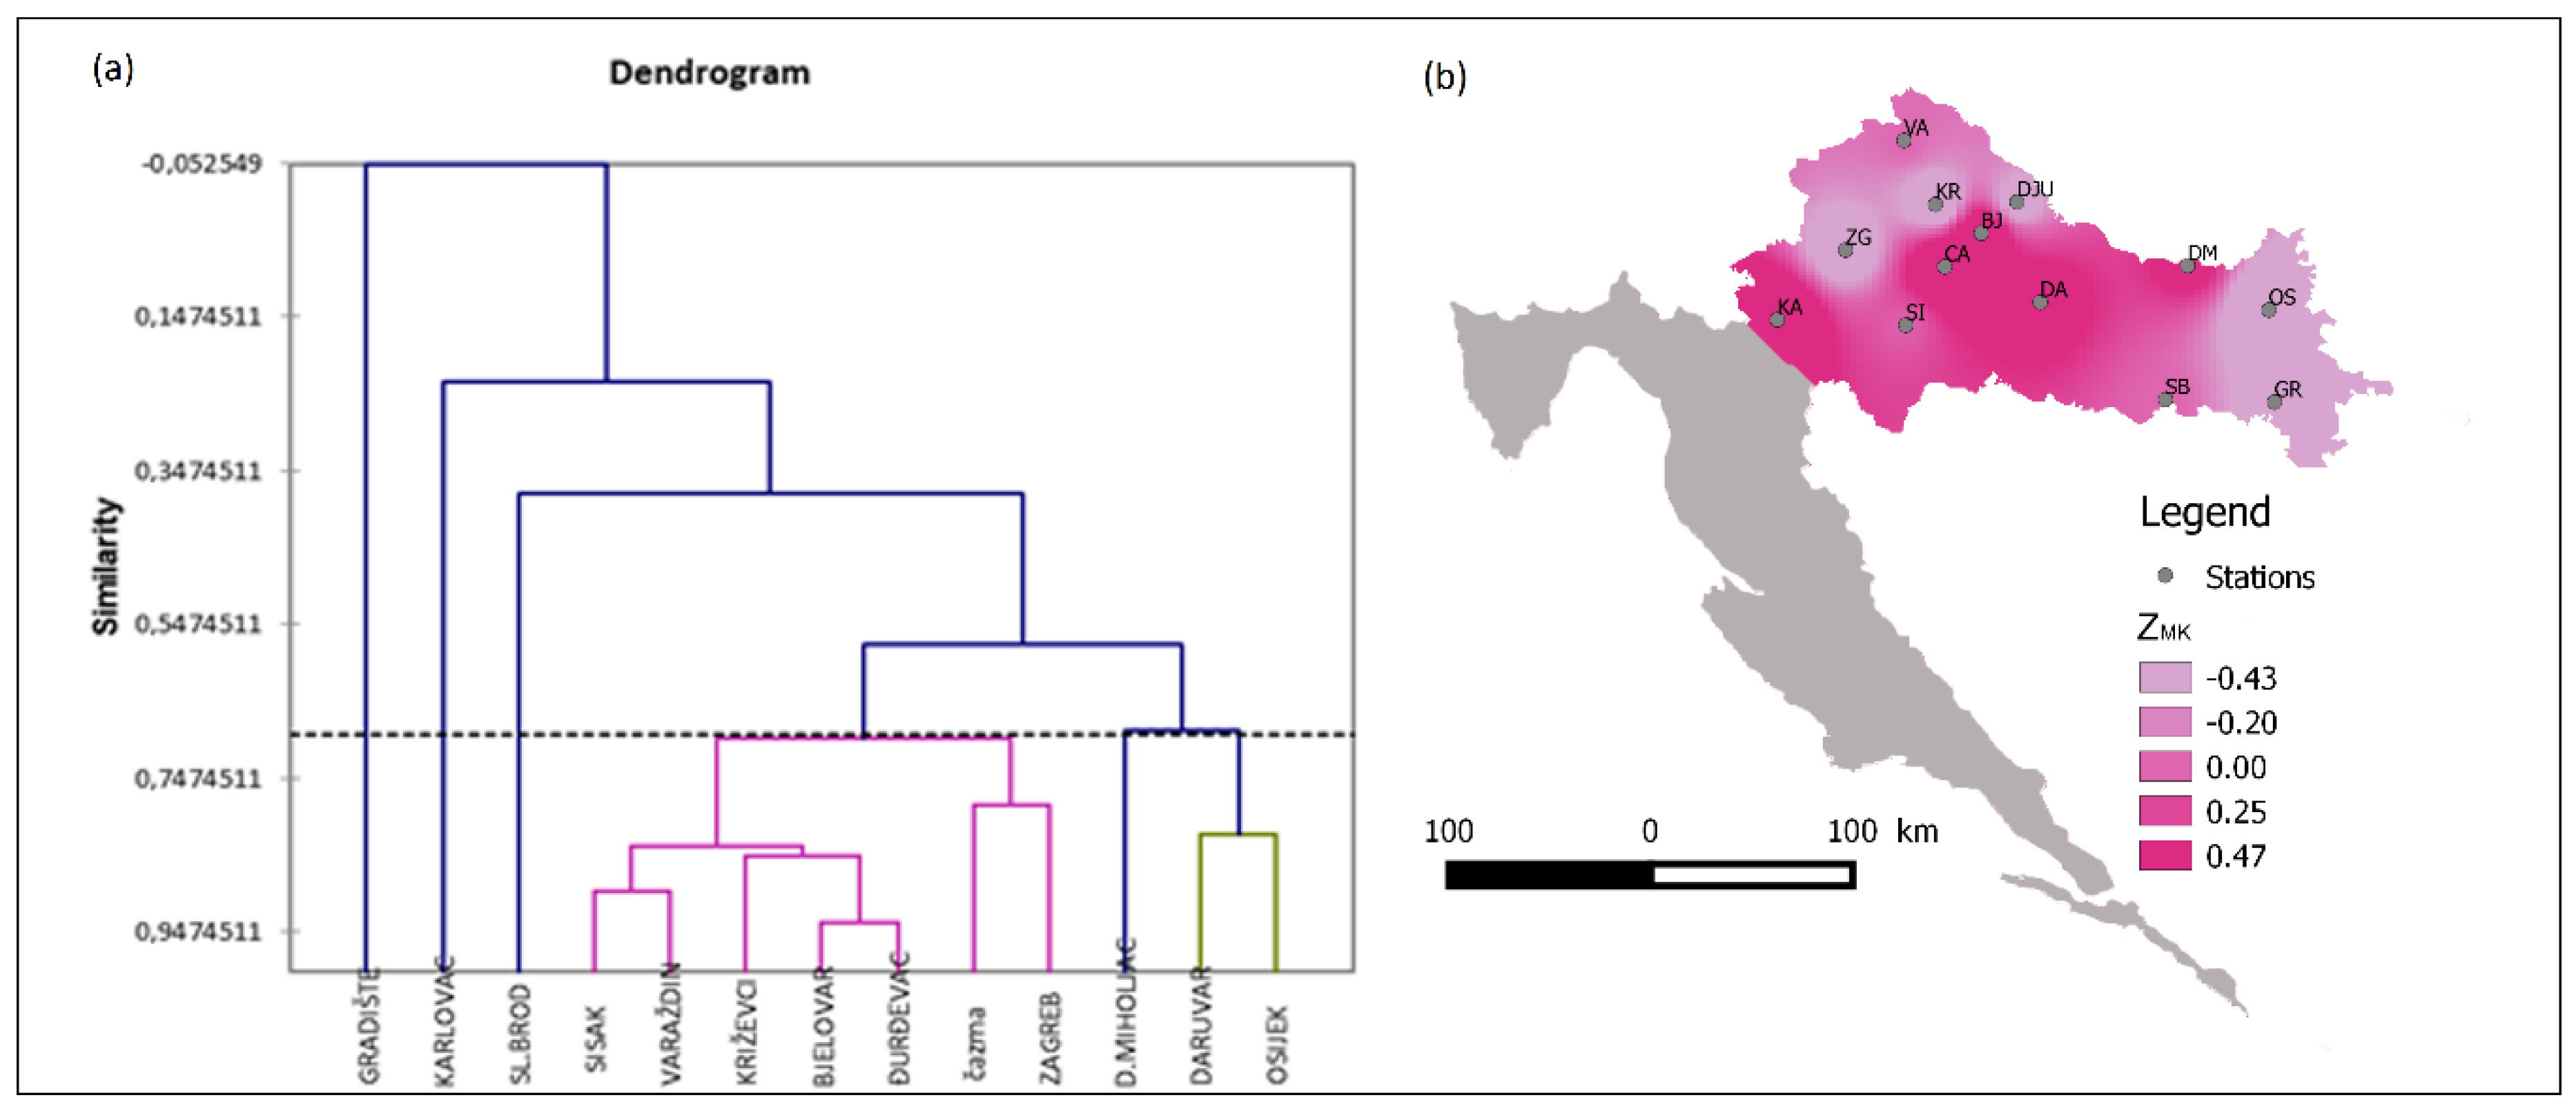
In comparison to the annual precipitation spatial variability, mean air temperature is less variable, which is confirmed by fewer clusters (Figure 7a). Consequently, spatial variability of Mann–Kendall trend coefficients of SPEI were tested. The dendrogram determined by AHC analysis shows five clusters (Figure 8a), confirming the complexity of drought. Even the significance of SPEI trends is not confirmed (Table 5). The most easterly region of the study area is highly exposed to water deficiency, due to increasing evapotranspiration caused by higher air temperatures. This process is much more influential than precipitation decrease. On the contrary, the dryness of the western region is influenced more by precipitation decrease, despite its higher values (Figure 6b, Figure 7b and Figure 8b). The central region of the study area is the least impacted—precipitation and air temperature changes are minor and drought occurrence is infrequent.
3.3. Copula Functions
Drought severity and duration for all 13 stations were compared and analysed using the copula function. Marginal distributions for every severity and duration time series were obtained. Also, correlation between severity and duration for all stations was tested with the equivalent rank order coefficient, known as Spearman’s rank correlation coefficient and Kendall’s Tau coefficient (Table 6). For severity parameter, the most appropriate marginal distribution for most of the stations is Beta4, and for duration, fatigue and Burr distributions.
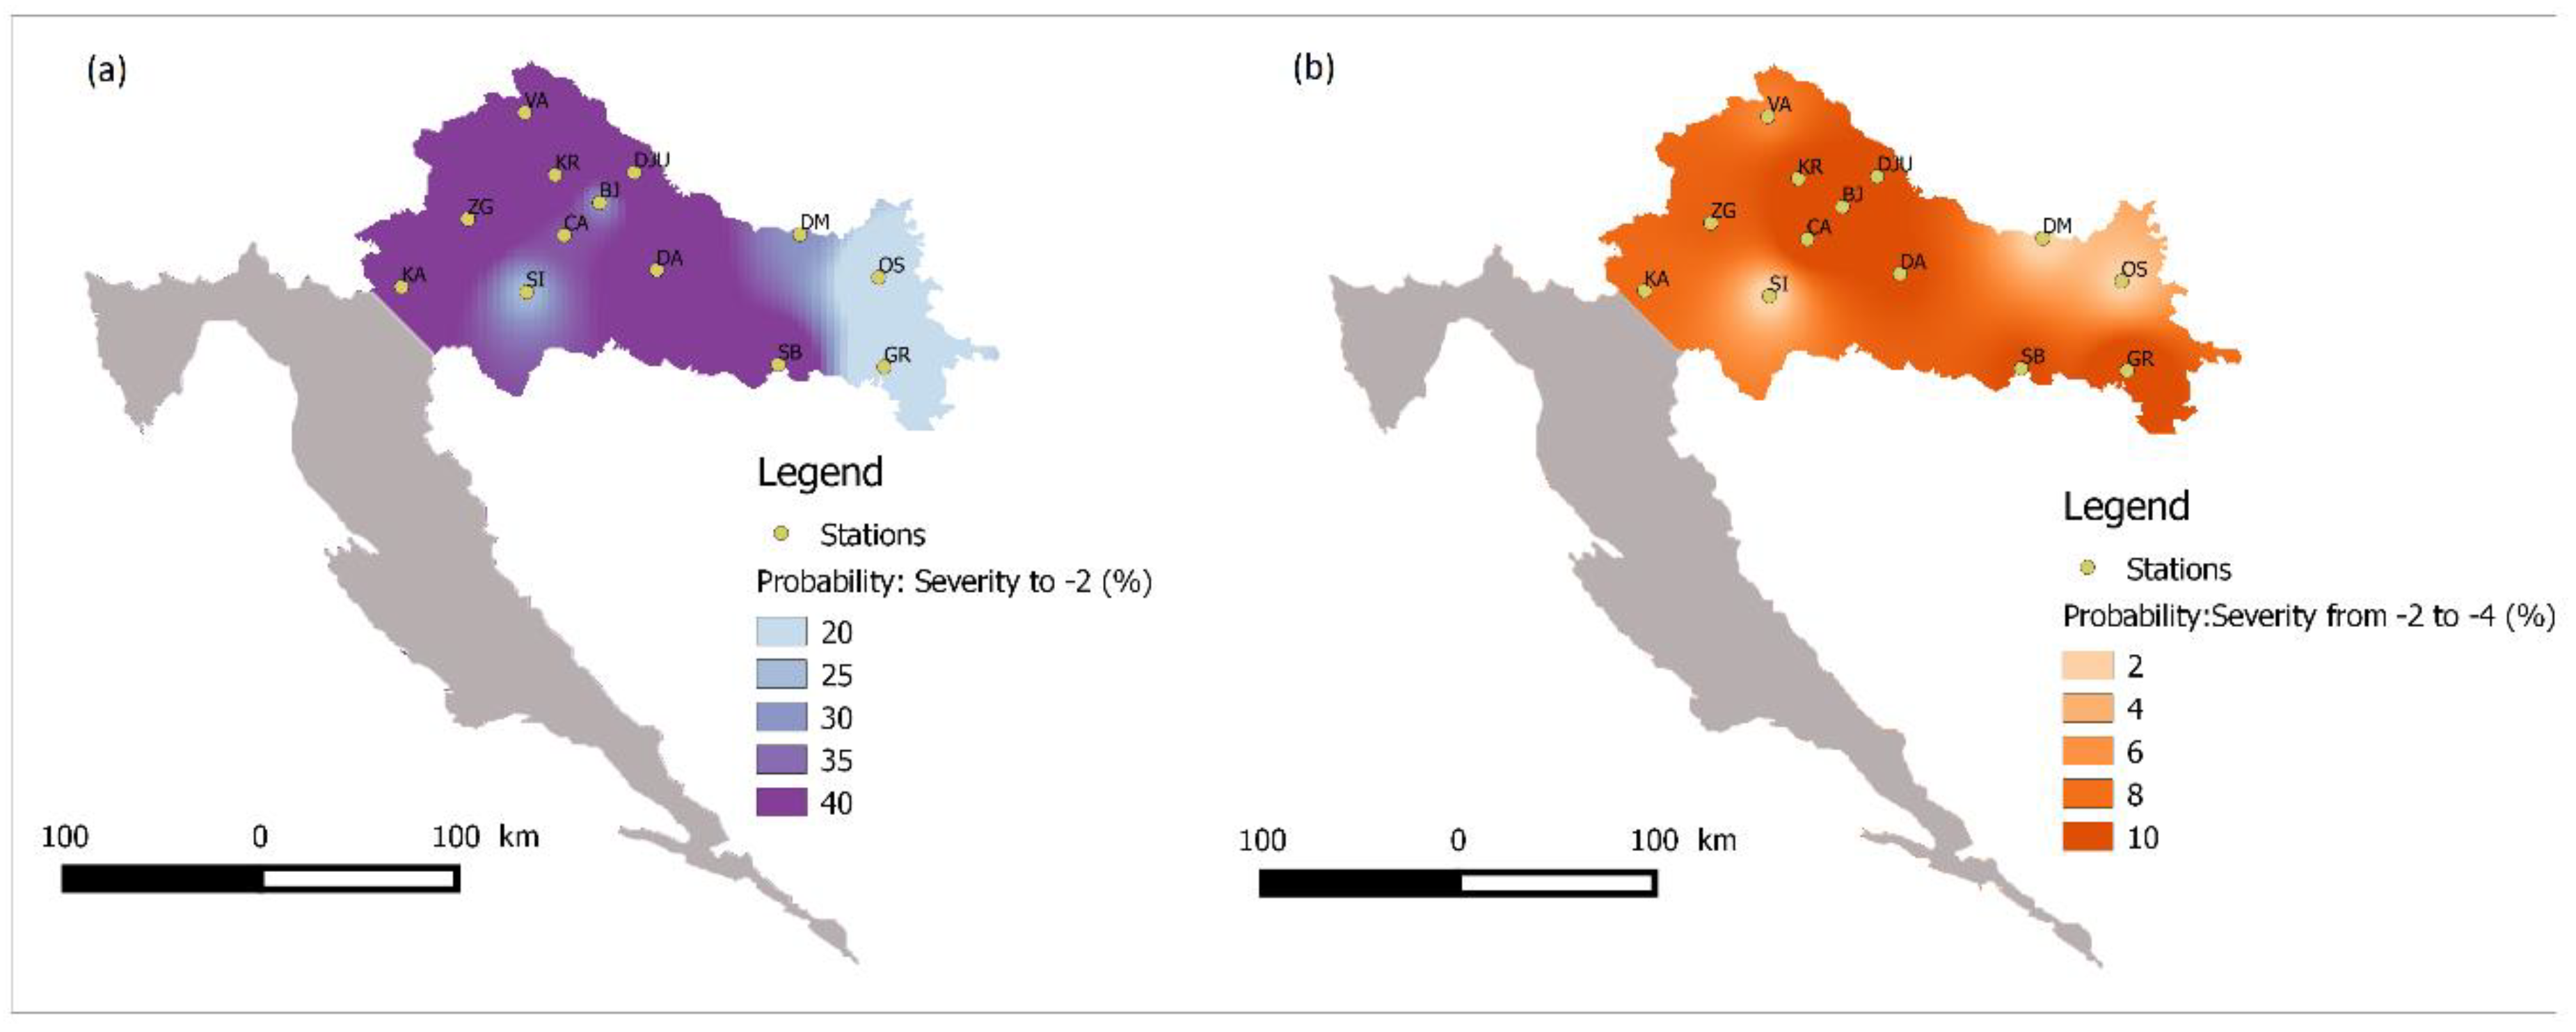
Together with chosen marginal distributions, correlation coefficients are shown in Table 6. The equivalent rank order coefficient ranges between 0.99 and 0.89. The lowest value of Kendall’s Tau coefficient was obtained for Gradište station (0.65), and the highest for Sisak station (0.91). The obtained correlation coefficients are high enough so that the copula function can used. Based on the previously mentioned criteria, for every station, the most appropriate copula function was selected for the joint distribution function of drought duration and severity (Table 6). For every station, 10,000 random pairs of severity-duration data were generated using the selected copula function in order to calculate the probability of simultaneously occurring drought with high severity and three months duration (at least). For every station, these probabilities were obtained, and results for severity up to −2 and between −2 and −4 are shown in Figure 9.
4. Discussion and Conclusions
Mean monthly and annual air temperature and precipitation, registered at 13 meteorological stations in continental Croatia from 1981 to 2018, were used for drought analysis. The study confirmed the complexity of the drought phenomenon temporally and spatially, particularly in an area situated in a transitional climate zone between the Continental and Mediterranean climate, where one climate often prevails. The analysis shows the impact of climate change, manifested as drought, but its severity, duration, and periodicity are very inconsistent. This makes water management in such areas highly complex. In this research, several statistical methods were used in order to highlight this problem. The results showed consistent precipitation behaviour on an annual basis. However, mean air temperatures have a significant upward trend throughout the study area, making this parameter responsible for the observed changes in drought occurrence. Increasing air temperature, the most important effect of climate change, is also confirmed as a driver of changes in the availability of water resources in agriculture, and the environment. The spatial distribution of droughts occurring during 1981–2018 is influenced more by increasing air temperature than by changes in precipitation regime. According to Table 4, most of the stations show an increasing trend in air temperature with the trends at α = 0.001 and α = 0.01 levels of significance. Precipitation trends have a much lower level of significance or no statistical significance at all (Table 3). Consequently, according to the results obtained in this study, the standardised precipitation evapotranspiration index (SPEI) is recommended as an applicable method for similar climate regions. The application of drought indices based only on precipitation data could lead to much lower predictions of drought severities or durations.
The application of agglomerative hierarchical clustering (AHC) on precipitation, air temperatures, and SPEI trend coefficients showed differing vulnerability climate change impacts across the study area. Spatial distribution of SPEI trend coefficients has the lowest level of homogeneity, which implies the need for more complex water management measures.
In terms of future drought vulnerability, areas with higher precipitation could be more exposed to drought. In this case, the western part of Croatia. This conclusion is important because generally countries and parts of the other countries across Europe with less precipitation are in the focus of drought analysis and concerns. The calculated probability demonstrates that a drought will occur for three months with a severity up to −2. Even an extreme drought with a severity between −2 and −4 has a much higher probability of occurrence in the region with the larger annual precipitation total. This leads to concerns about the most effective scale of research. This research supports drought analysis on a small scale, even at the catchment scale, to achieve reliable results. According to the obtained results, the physical background of drought occurrence in this region can be explained by two major impacts—global and local. A very important global climate change impact is the increasing trend in air temperatures. At the same time, variability of precipitation regime is more related to specific regional characteristics with less significant change trends. In this research, global impacts are recognized as dominant for drought frequency, severity, and duration. However, the modification role of local precipitation characteristics cannot be neglected. Finally, these results could give a new perspective on transitional climate zone as a large area effected by drought and still not in the focus of scientists.
Author Contributions
Conceptualization, L.T. and T.B.; methodology, L.T. and T.B.; data analysis, L.T., T.B., A.H. and S.Š.; writing—original draft preparation, L.T., T.B., A.H. and S.Š.; writing—review and editing, L.T. and T.B.
Funding
This research received no external funding.
Conflicts of Interest
The authors declare no conflict of interest.
References
- Lloyd-Hughes, B.; Shaffrey, L.C.; Vidale, P.L.; Arnell, N.W. An evaluation of the spatiotemporal structure of large-scale European drought within the HiGEM climate model. International. J. Climatol. 2012, 33, 2024–2035. [Google Scholar] [CrossRef] [Green Version]
- Ezenwaji, E.E.; Nzoiwu, C.P.; Chima, G.N. Analysis of Precipitation Concentration Index (PCI) for Awka Urban Area, Nigeria. Hydrol. Curr. Res. 2017, 8, 4. [Google Scholar]
- Klein Tank, A.M.G.; Können, G.P. Trends in Indices of Daily Temperature and Precipitation Extremes in Europe 1946–1990. J. Clim. 2003, 6, 3665–3680. [Google Scholar] [CrossRef]
- Solomon, S.D.; Qin, D.; Manning, M.; Chen, Z.; Marquis, M.; Averyt, K.B.; Tignor, M.; Miller, H.L. (Eds.) Climate Change 2007: The Physical Science Basis; Cambridge University Press: New York, NY, USA, 2007. [Google Scholar]
- Brunetti, M.; Buffoni, L.; Maugeri, M.; Nanni, T. Precipitation intensity trends in Northern Italy. Int. J. Climatol. 2000, 20, 1017–1031. [Google Scholar] [CrossRef]
- Alpert, P.; Ben-Gai, T.; Baharad, A.; Benjamini, Y.; Yekutieli, D.; Colacino, M.; Diodato, L.; Ramis, C.; Homar, V.; Romero, R.; et al. The paradoxical increase of Mediterranean extreme daily rainfall in spite of decrease in total values. Geophys. Res. Lett. 2002, 29, 311–314. [Google Scholar] [CrossRef] [Green Version]
- Kumar, P.V.; Bindi, M.; Crisci, A.; Maracchi, G. Detection of Variations in Air Temperature at Different Time Scales During the Period 1889–1998 at Firenze, Italy. Clim. Chang. 2005, 72, 123–150. [Google Scholar] [CrossRef]
- Costa, A.C.; Soares, A. Trends in extreme precipitation indices derived from a daily rainfall database for the South of Portugal. Int. J. Climatol. 2009, 29, 1956–1975. [Google Scholar] [CrossRef]
- Philandras, C.M.; Nastos, P.T.; Kapsomenakis, J.; Douvis, K.C.; Tselioudis, G.; Zerefos, C.S. Long term precipitation trends and variability within the Mediterranean region. Nat. Hazards Earth Syst. Sci. 2011, 11, 3235–3250. [Google Scholar] [CrossRef] [Green Version]
- Caloiero, T.; Veltri, S.; Caloiero, P.; Frustaci, F. Drought Analysis in Europe and in the Mediterranean Basin Using the Standardized Precipitation Index. Water 2018, 10, 1043. [Google Scholar] [CrossRef] [Green Version]
- Stahl, K.; Hisdal, H.; Hannaford, J.; Tallaksen, L.M.; van Lanen, H.A.J.; Sauquet, E.; Demuth, S.; Fendekova, M.; Jódar, J. Streamflow trends in Europe: Evidence from a dataset of near-natural catchments. Hydrol. Earth Syst. Sci. 2010, 14, 2367–2382. [Google Scholar] [CrossRef] [Green Version]
- Gudmundsson, L.; Tallaksen, L.M.; Stahl, K.; Clark, D.B.; Dumont, E.; Hagemann, S.; Bertrand, N.; Gerten, D.; Heinke, J.; Hanasaki, N.; et al. Comparing large-scale hydrological model simulations to observed runoff percentiles in Europe. J. Hydrometeorol. 2011, 13, 604–620. [Google Scholar] [CrossRef]
- Prudhomme, C.; Parry, S.; Hannaford, J.; Clark, D.B.; Hagemann, S.; Voss, F. How Well Do Large-Scale Models Reproduce Regional Hydrological Extremes in Europe? J. Hydrometeorol. 2011, 12, 1181–1204. [Google Scholar] [CrossRef] [Green Version]
- Kyselý, J. Trends in heavy precipitation in the Czech Republic over 1961–2005. Int. J. Climatol. 2009, 29, 1745–1758. [Google Scholar] [CrossRef]
- Cheng, S.; Huang, J. Enhanced soil moisture drying in transitional regions under a warming climate. J. Geophys. Res. Atmos. 2016, 121, 2542–2555. [Google Scholar] [CrossRef]
- Vogel, M.M.; Zscheischler, J.; Seneviratne, S.I. Varying soil moisture-atmosphere feedbacks explain divergent temperature extremes and precipitation projections in central Europe. Earth Syst. Dyn. 2018, 9, 1107–1125. [Google Scholar] [CrossRef] [Green Version]
- Vicente-Serrano, S.; Beguaria, S.; López-Moreno, J.I. A Multiscalar Drought Index Sensitive to Global Warming: The Standardized Precipitation Evapotranspiration Index. J. Clim. 2010, 23, 1696–1718. [Google Scholar] [CrossRef] [Green Version]
- Zhang, Y.; Li, Y.; Ge, J.; Li, G.; Yu, Z.; Niu, H. Correlation analysis between drought indices and terrrestrial water storage from 2002–2015 in China. Environ. Earth Sci. 2018, 77, 462. [Google Scholar] [CrossRef]
- Tirivarombo, S.; Osupile, D.; Eliasson, P. Drought monitoring and analysis: Standardised Precipitation Evapotranspiration Index (SPEI) and Standardised Precipitation Index (SPI). Phys. Chem. Earth 2018, 106, 1–10. [Google Scholar] [CrossRef]
- García-Valdecasas Ojeda, M.; Romero Jiménez, E.; Gámiz-Fortis, S.R.; Castro-Díez, Y.; Jesús Esteban Parra, M. Understanding the Drought Phenomenon in the Iberian Peninsula. In Drought (Aridity); Intechopen: London, UK, 2019; pp. 1–18. [Google Scholar]
- Zaninović, K.; Gajić-Čapka, M. Changes in components of the water balance in the Croatian Lowlands. Appl. Clim. 2000, 65, 111–117. [Google Scholar] [CrossRef]
- Gajić-Čapka, M.; Cindrić, K.; Pasarić, Z. Trends in precipitation indices in Croatia, 1961–2010. Appl. Clim. 2015, 121, 167–177. [Google Scholar] [CrossRef]
- Branković, Č.; Cindrić, K.; Gajić-Čapka, M.; Güttler, I.; Pandžić, K.; Patarčić, M.; Srnec, L.; Tomašević, I.; Vučetić, V.; Zaninović, K. Sixth National Communication of the Republic of Croatia under the UN Framework Convention on the Climate Change (UNFCCC). Clim. Chang. Impacts Adapt. Meas. 2013, 8. [Google Scholar]
- Perčec Tadić, M.; Gajić-Čapka, M.; Gačeša-Zaninović, K.; Cindrić, K. Drought Vulnerability in Croatia. Agric. Conspec. Scintificus 2014, 79, 31–38. [Google Scholar]
- Garbrecht, J.; Fernandez, P.G. Visualizationof trends and fluctuations in climatic records. Water Resour. Bull. 1994, 30, 297–306. [Google Scholar] [CrossRef]
- Bonacci, O.; Trninić, D.; Roje-Bonacci, T. Analysis of the water temperature regime of the Danube and its tributaries in Croatia. Hydrol. Process. 2008, 22, 1014–1021. [Google Scholar] [CrossRef]
- Mann, H.B. Nonparametric tests against trend. Econometrica 1945, 13, 245–259. [Google Scholar] [CrossRef]
- Kendall, M.G. Rank Correlation Methods; Charles Griffin & Company Limited: London, UK, 1962. [Google Scholar]
- Gilbert, R.O. Statistical Methods for Environmental Pollution Monitoring; Wiley: New York, NY, USA, 1987. [Google Scholar]
- Asfaw, A.; Simane, B.; Hassen, A.; Bantider, A. Variability and time series trend analysis of rainfall and temperature in northcentral Ethiopia: A case study in Woleka sub-basin. Weather Clim. Extrem. 2018, 19, 29–41. [Google Scholar] [CrossRef]
- Salmi, T.; Määttä, A.; Anttila, P.; Ruoho-Airola, T.; Amnell, T. Detecting Trends of Annual Values of Atmospheric Pollutants by the Mann-Kendall Test and Sen’s Slope Estimates—The Excel Template Application MAKESENS; Finnish Meteorological Institute: Helsinki, Finland, 2002; p. 31. [Google Scholar]
- Tadić, L.; Brleković, T. Drought and Precipitation Concentration Index (PCI) analysis in continental Croatia. In Proceedings of the 16th International Simposium Water Management & Hydraulic Engineering WMHE, Skopje, Nirth Macedonia, 3–7 September 2019. [Google Scholar]
- Liu, Y.; Chen, S.; Sun, H.; Gui, D.; Xue, J.; Lei, J.; Zeng, X.; Lv, G. Does the long-term precipitation variations and dry-wet conditions exist inthe arid areas? A case study from China. Quat. Int. 2019, 519, 3–9. [Google Scholar]
- Wang, F.; Wang, Z.; Yang, H.; Zhao, Y.; Zhang, Z.; Li, Z.; Hussain, Z. Copula-Based Drought Analysis Using Standardized Precipitation Evapotranspiration Index: A Case Study in the Yellow River Basin, China. Water 2019, 11, 1298. [Google Scholar] [CrossRef] [Green Version]
- Tadić, L.; Dadić, T.; Bosak, M. Comparison of different drought assessment methods in continental Croatia. Građevinar 2015, 671, 11–22. [Google Scholar]
- Li, B.; Zhou, W.; Zhao, Y.; Ju, Q.; Yu, Z.; Liang, Z.; Acharya, K. Using the SPEI to Assess Recent Climate Change in the Yarlung Zangbo River Basin, South Tibet. Water 2015, 7, 5474–5486. [Google Scholar] [CrossRef] [Green Version]
- Liu, X.; Liu, W. Regionalization and Spatiotemporal Variation of Drought in China Based on Standardized Precipitation Evapotranspiration Index (1961–2013). Adv. Meteorol. 2015, 2015, 950262. [Google Scholar] [CrossRef] [Green Version]
- Karmakar, S.; Simonovic, S.P. Flood Frequency Analysis Using Copula with Mixed Marginal Distributions; Project Report No: 055.2007; University of Western Ontario, Department of Civil and Environmental Engineering: London, ON, Canada, 2007. [Google Scholar]
- Klein, B.; Pahlow, M.; Hundecha, Y.; Schumann, A. Probability Analysis of Hydrological Loads for the Design of Flood Control Systems Using Copulas. J. Hydrol. Eng. 2010, 15, 360–369. [Google Scholar] [CrossRef]
- Sraj, M.; Bezak, N.; Brilly, M. Bivariate flood frequency analysis using the copula function: A case study of the Litija station on the Sava River. Hydrol. Process. 2015, 29, 225–238. [Google Scholar] [CrossRef]
Figure 1.
Study area. Meteorological station information is given in Table 1.
Figure 1.
Study area. Meteorological station information is given in Table 1.

Figure 2.
The spatial distribution of annual precipitation and mean air temperature. Meteorological stations (along with their longitude) are sorted from west to east on the x-axis.
Figure 2.
The spatial distribution of annual precipitation and mean air temperature. Meteorological stations (along with their longitude) are sorted from west to east on the x-axis.

Figure 3.
Minimum, maximum, and mean annual precipitation data of 13 analysed meteorological stations over the period 1981–2018.
Figure 3.
Minimum, maximum, and mean annual precipitation data of 13 analysed meteorological stations over the period 1981–2018.

Figure 4.
Mean annual air temperature of 13 analysed meteorological stations during the period 1981–2018.
Figure 4.
Mean annual air temperature of 13 analysed meteorological stations during the period 1981–2018.

Figure 5.
SPEI-12-month values of 13 analysed meteorological stations during the period 1981–2018.

Figure 6.
(a) Dendrogram of annual precipitation trend, (b) spatial distribution of Mann–Kendall ZMK coefficients.
Figure 6.
(a) Dendrogram of annual precipitation trend, (b) spatial distribution of Mann–Kendall ZMK coefficients.

Figure 7.
(a) Dendrogram of the mean air temperature trend, (b) spatial distribution of Mann–Kendall ZMK coefficients.
Figure 7.
(a) Dendrogram of the mean air temperature trend, (b) spatial distribution of Mann–Kendall ZMK coefficients.

Figure 8.
(a) Dendrogram of SPEI trend, (b) spatial distribution of Mann–Kendall ZMK coefficients.

Figure 9.
(a) Probability of occurrence of three months duration drought and severity up to −2, (b) probability of occurrence of 3 months duration drought and severity between −2 and −4.
Figure 9.
(a) Probability of occurrence of three months duration drought and severity up to −2, (b) probability of occurrence of 3 months duration drought and severity between −2 and −4.


Table 1.
Geographical position of the meteorological stations used in this study.
| Meteorological Station | Northern Geographical Longitude | Northern Geographical Latitude | Altitude (m a.s.l.) |
|---|---|---|---|
| Karlovac (KA) | 15°34′ | 45°30′ | 110 |
| Zagreb-Maksimir (ZG) | 16°02′ | 45°49′ | 123 |
| Varaždin (VŽ) | 16°20′ | 46°18′ | 167 |
| Sisak (SI) | 16°22′ | 45°30′ | 98 |
| Križevci (KR) | 16°33′ | 46°02′ | 155 |
| Čazma (ČA) | 16°38′ | 45°45′ | 144 |
| Bjelovar (BJ) | 16°51′ | 45°55′ | 141 |
| Đurđevac (ĐU) | 17°04′ | 46°03′ | 121 |
| Daruvar (DA) | 17°14′ | 45°36′ | 161 |
| Slavonski Brod (SB) | 17°23′ | 45°10′ | 88 |
| Donji Miholjac (DM) | 18°10′ | 45°46′ | 97 |
| Osijek (OS) | 18°34′ | 45°30′ | 89 |
| Gradište (GR) | 18°42′ | 45°09′ | 97 |
Table 2.
Limit values for the standardised precipitation evapotranspiration index (SPEI) [36].
Table 2.
Limit values for the standardised precipitation evapotranspiration index (SPEI) [36].
| SPEI Value | SPEI Classification |
|---|---|
| ≥2.00 | Extremely wet |
| 1.50–1.99 | Very wet |
| 1.00–1.49 | Moderately wet |
| −0.99–0.99 | Normal |
| −1.49–(−1.0) | Moderately dry |
| −1.99–(−1.5) | Very dry |
| ≤−2.00 | Extremely dry |
Table 3.
Homogeneity of annual precipitation series and trend significance.
| PRECIPITATION | BJ | ČA | DA | ĐU | DM | GR | KA | KR | OS | SI | SB | VŽ | ZG |
|---|---|---|---|---|---|---|---|---|---|---|---|---|---|
| Homogeneity | YES | YES | YES | YES | YES | YES | YES | YES | YES | YES | YES | YES | YES |
| Mann-Kendall Coeff. (ZMK) | 0.352 | 1.609 | 0.503 | −0.101 | 1.106 | 1.031 | 2.565 | 0.101 | 1.056 | 1.986 | 1.433 | 0.377 | 0.578 |
| Trend Significance | - | - | - | - | - | - | * (α= 0.05) | - | - | * (α= 0.05) | - | - | - |
Table 4.
Homogeneity of mean air temperature series and trend significance.
| AIR TEMPERATURE | BJ | ČA | DA | ĐU | DM | GR | KA | KR | OS | SI | SB | VŽ | ZG |
|---|---|---|---|---|---|---|---|---|---|---|---|---|---|
| Homogeneity | NO | NO | NO | NO | NO | NO | YES | NO | NO | NO | NO | NO | NO |
| Break Year | 1998 | 2005 | 2006 | 1998 | 1998 | 1999 | - | 1998 | 2005 | 1998 | 1998 | 1999 | 1998 |
| Mann-Kendall Coeff. (ZMK) | 4.802 | 4.526 | 2.741 | 4.463 | 3.910 | 4.904 | 2.414 | 5.369 | 4.123 | 4.778 | 4.749 | 4.262 | 5.431 |
| Trend Significance | *** (α= 0.001) | *** (α= 0.001) | ** (α= 0.01) | - | *** (α= 0.001) | *** (α= 0.001) | * (α= 0.05) | - | *** (α= 0.001) | *** (α= 0.001) | *** (α= 0.001) | *** (α= 0.001) | *** (α= 0.001) |
Table 5.
Homogeneity of SPEI series and trend significance.
| SPEI | BJ | ČA | DA | ĐU | DM | GR | KA | KR | OS | SI | SB | VŽ | ZG |
|---|---|---|---|---|---|---|---|---|---|---|---|---|---|
| Homogeneity | NO | NO | NO | NO | NO | NO | NO | NO | NO | NO | NO | NO | NO |
| Break Year | 2010 | 1993 | 1993 | 2000 | 1993 | 2006 | 1993 | 1999 | 2006 | 1993 | 2006 | 1999 | 2000 |
| Mann-Kendall Coeff. (ZMK) | 1.216 | 1.635 | 0.902 | −0.824 | 0.719 | −0.693 | 1.556 | −1.269 | −1.425 | 0.039 | 0 | −0.013 | −0.164 |
| Trend Significance | - | - | - | - | - | - | - | - | - | - | - | - | - |
Table 6.
Marginal distributions and copula functions for all stations.
| Station | Drought Characteristics | Marginal Distribution | Equivalent Rank Order Coefficient | Kendall’s Tau Coefficient | Copula |
|---|---|---|---|---|---|
| KA | Duration | Burr | 0.96 | 0.83 | Clayton |
| Severity | Beta4 | ||||
| ZG | Duration | JohnsonU | 0.96 | 0.83 | Clayton |
| Severity | Beta4 | ||||
| VA | Duration | Fatigue | 0.98 | 0.90 | Gumbel |
| Severity | Beta4 | ||||
| SI | Duration | Beta4 | 0.99 | 0.91 | Gumbel |
| Severity | JohnsonB | ||||
| KR | Duration | Burr | 0.94 | 0.75 | Frank |
| Severity | Beta4 | ||||
| ČA | Duration | JohnsonU | 0.96 | 0.83 | Frank |
| Severity | Beta4 | ||||
| BJ | Duration | GPD | 0.89 | 0.71 | Normal |
| Severity | Beta4 | ||||
| ĐU | Duration | GPD | 0.89 | 0.73 | Normal |
| Severity | Burr | ||||
| DA | Duration | Fatigue | 0.96 | 0.83 | Frank |
| Severity | Beta4 | ||||
| SB | Duration | Burr | 0.96 | 0.83 | Frank |
| Severity | Beta4 | ||||
| DM | Duration | Beta4 | 0.99 | 0.90 | Gumbel |
| Severity | Beta4 | ||||
| OS | Duration | Fatigue | 0.96 | 0.83 | Frank |
| Severity | Beta4 | ||||
| GR | Duration | Fatigue | 0.90 | 0.65 | Frank |
| Severity | Beta4 |
© 2019 by the authors. Licensee MDPI, Basel, Switzerland. This article is an open access article distributed under the terms and conditions of the Creative Commons Attribution (CC BY) license (http://creativecommons.org/licenses/by/4.0/).
Share and Cite
MDPI and ACS Style
Tadić, L.; Brleković, T.; Hajdinger, A.; Španja, S. Analysis of the Inhomogeneous Effect of Different Meteorological Trends on Drought: An Example from Continental Croatia. Water 2019, 11, 2625. https://doi.org/10.3390/w11122625
AMA Style
Tadić L, Brleković T, Hajdinger A, Španja S. Analysis of the Inhomogeneous Effect of Different Meteorological Trends on Drought: An Example from Continental Croatia. Water. 2019; 11(12):2625. https://doi.org/10.3390/w11122625
Chicago/Turabian StyleTadić, Lidija, Tamara Brleković, Andreja Hajdinger, and Save Španja. 2019. "Analysis of the Inhomogeneous Effect of Different Meteorological Trends on Drought: An Example from Continental Croatia" Water 11, no. 12: 2625. https://doi.org/10.3390/w11122625
Note that from the first issue of 2016, this journal uses article numbers instead of page numbers. See further details here.