Article

REUTIVAR: Model for Precision Fertigation Scheduling for Olive Orchards Using Reclaimed Water

by
Carmen Alcaide Zaragoza
1,*,
Irene Fernández García
2,
Rafael González Perea
3,
Emilio Camacho Poyato
1 and
Juan Antonio Rodríguez Díaz
1
1
Department of Agronomy, University of Córdoba, Campus Rabanales, Edif. da Vinci, 14071 Córdoba, Spain
2
Electrical Engineering Department, University of Córdoba, Campus Rabanales, Edif. da Vinci, 14071 Córdoba, Spain
3
Department of Plant Production and Agricultural Technology, School of Advanced Agricultural Engineering, University of Castilla-La Mancha, Campus Universitario, s/n, 0207 Albacete, Spain
*
Author to whom correspondence should be addressed.
Water 2019, 11(12), 2632; https://doi.org/10.3390/w11122632
Submission received: 31 October 2019 / Revised: 4 December 2019 / Accepted: 10 December 2019 / Published: 13 December 2019
(This article belongs to the Special Issue Modelling and Management of Irrigation System)

Abstract

:
Olive orchard is the most representative and iconic crop in Andalusia (Southern Spain). It is also considered one of the major economic activities of this region. However, due to its extensive growing area, olive orchard is also the most water-demanding crop in the Guadalquivir River Basin. In addition, its fertilization is commonly imprecise, which causes over-fertilization, especially nitrogen. This leads to pollution problems in both soil and water, threating the environment and the system sustainability. This concern is further exacerbated by the use of reclaimed water to irrigate since water is already a nutrient carrier. In this work, a model which determines the real-time irrigation and fertilization scheduling for olive orchard, applying treated wastewater, has been developed. The precision fertigation model considers weather information, both historical and forecast data, soil characteristics, hydraulic characteristics of the system, water allocation, tree nutrient status, and irrigation water quality. As a result, daily information about irrigation time and fertilizer quantity, considering the most susceptible crop stage, is provided. The proposed model showed that by using treated wastewater, additional fertilization was not required, leading to significant environmental benefits but also benefits in the total farm financial costs.

1. Introduction

Freshwater resources are mainly used for agricultural irrigation, accounting for more than 70% of all water withdrawals worldwide [1]. This makes agriculture especially vulnerable to drought periods. This problem is emphasized in a context of climate change since alterations in temperature and rainfall patterns and an increase in the occurrence probability of extreme events have been forecasted [2]. Consequently, in arid and semi-arid areas where irrigation agriculture is a major activity, such as Mediterranean countries, extremely high water stress is predicted [3,4]. This will lead to an increase in water demand and potential soil moisture deficit. This situation is particularly critical in Andalusia (Southern Spain), since irrigated agriculture plays a key role in its economy. Olive is the most representative and iconic crop in this region, not only for its importance in the landscape and culture, but also for being considered one of its major economic activities. However, due to its extensive area, olive orchard is the most water demanding crop in the Guadalquivir River Basin, with a water demand higher than 580 hm3/year for more than one and a half million hectares, which implies about 20% of the total agricultural water demand in that region [5]. On the other hand, olive fertilization is commonly imprecise, which causes over-fertilization, especially nitrogen. This leads to pollution problems in atmosphere, soil, and water, threating the environment and the biosystem sustainability. Thus, irrigated agriculture will need to face the challenge of ensuring production using water and fertilizers in a more sustainable way.
Strategies to improve the efficient use of water and fertilizer, increasing the irrigation districts sustainability, have been proposed. The significant development of information and communication technologies (ICTs) has also encouraged the application of these strategies. For instance, the authors of Reference [6] developed a mobile and desktop application for farmers (IrriFresa App) which incorporated the precision irrigation principles for strawberry crop. Its use in commercial farms led to significant water savings which ranged from 11% to 33%. Other authors developed ICT applications focused on irrigation and fertilization management. Thus, References [7] and [8] proposed methodologies to determine the most economic fertilizer considering the water quality of the irrigation system. However, in both works, the optimal nutrient solution, which is usually unknown by farmers, was needed as a model input. The authors of Reference [9] developed a mobile application with Android Studio IDE (integrated development environment) to determine the fertilizer quantity depending on the crop type and the irrigation system conditions. Nevertheless, this mobile application was only available for greenhouse vegetables. The Institute for Agricultural and Fisheries Research and Training (IFAPA) developed a tool for irrigation and fertigation (fertigation) scheduling for olive orchard [10]. This management tool considers average historic agroclimatic information and determines a monthly fertigation scheduling for olive orchard. However, it is only available online which, sometimes, is not functional for farmers in the day to day irrigation management. It neither considers real-time weather information nor weather forecast. This could cause an inaccurate recommendation because of climate variability.
On the other hand, in order to reduce the pressure on water resources, the use of treated water as an alternative to conventional water sources has also been addressed. Treated wastewater is defined as water arising from any combination of domestic, municipal, or industrial origin that has been processed in a wastewater treatment plant [11]. Reclaimed or reused water is formerly treated wastewater with an additional treatment which makes it suitable for reusing in different purposes, such as agriculture, landscape irrigation, or recharge of groundwater aquifers, among others [12,13]. References [14] and [15] assured that the use of this water constitutes a strategy both for the water scarcity problem and the sustainability of the irrigated agriculture improvement. After long-term research about citrus trees and horticultural crops irrigated with reclaimed water, References [16] and [17] determined that the use of reclaimed water for irrigating citrus trees and horticultural crops generates significant fertilizer savings without posing a risk for human health. Due to its importance and extensive cultivation in Mediterranean areas, different authors have studied the impacts of using reclaimed water as irrigation water in olive orchards on soil pollution [18,19], tree development [20,21], and oil quality [21,22]. They concluded that negative impacts were not found when reclaimed water was properly controlled and managed. The authors of Reference [23] compared olive crop irrigation using reclaimed water and freshwater for eight irrigation seasons. Their work showed that fertilizer applications were not required when reclaimed water was used as irrigation water since the water already satisfied the olive nutrient requirements. Their study also highlighted the importance of a regular water quality control to consider nutrients provided with the water. Therefore, the use of reclaimed water in irrigated agriculture could reduce both the intensive use of fertilizer and the associated energy and economic costs. However, special attention must be paid when reclaimed water is used for irrigation because water is already a nutrient carrier and its nutrient content is variable along the year. Nevertheless, when reclaimed water is properly managed and supported by new advances in the ICT, this non-conventional water source can become a strategic solution to the problem raised [24].
In this work, a new model which determines the precision fertigation scheduling in real-time for olive orchard, considering the particularities of applying reclaimed water, has been developed. The innovation of this model was the integration of the irrigation and fertilization olive management techniques combined with weather forecast and agroclimatic records, updated in real-time, and adapted for the specific case of irrigation with reclaimed water. This model aims to improve the irrigation system sustainability, applying nutrients according to the crop needs alone and concentrating the water application on the most critical crop stages to water stress. This model is intended for farmers and technicians to manage water and fertilizer in the most efficient way. The model has been tested in an olive orchard commercial farm located in Córdoba (Southern Spain).

2. Materials and Methods

The methodology focused on the development of a precision fertigation model for olive orchard, called REUTIVAR, using reclaimed water as water source. The model was developed considering both historical and forecast weather information, soil characteristics, hydraulic characteristics of the irrigation system, irrigation water quality, water allocation, and soil and tree nutrient status. A detailed description of the model, the required inputs, and the case study are provided below.

2.1. Model Description

The model aims to provide the optimal real-time fertigation scheduling in an easy and simple way. It is made up of four independent but interconnected modules: (1) farm characteristics, (2) climate data, (3) irrigation scheduling, and (4) fertilization scheduling (Figure 1). The model was implemented in MATLABTM (MathWorks Inc., MA, USA) [25].

2.1.1. Farm Characteristics

Data of the farm is required in this module: location, area, planting pattern, soil texture, water allocation, irrigation system (flow and spacing of emitters), irrigation scheduling, and crop nutritional status. Soil texture was obtained using the USDA (US Department of Agriculture) soil texture triangle. Subsequently, using the ROSETTA model [26], the soil moisture retention curves were calculated. Growing cycle, crop coefficient, and crop nutrient uptake were also needed, although they were embedded in the model. Water quality analyses are vital when reclaimed water is used for irrigation since the nutrient water content can be different depending on the case. Hence, water quality analyses were carried out regularly. Finally, soil nutritional status was also evaluated to improve the precision of the fertigation scheduling. This input variable was considered as an optional variable to take into account those cases in which soil nutritional status data are not available.

2.1.2. Climate Data

This module considered two aspects: historical agroclimatic data and weather forecasting data, both related to farm location. Firstly, the nearest agroclimatic station to the farm, selected from the available stations in the Agroclimatic Stations Network of the Regional Government of Andalusia [27], was determined. From this agroclimatic station, using web scraping techniques (i.e., an automated process to extract data from websites), the daily values of precipitation (P) and reference evapotranspiration (ET0) of the available entire time series were obtained. Then, the daily average values of P and ET0 were computed as well as the monthly average irrigation needs (INhistorical). INhistorical were calculated as the difference between the crop evapotranspiration (ETc) and the effective precipitation (Peff) according to Allen [28]. ETc and Peff are defined later in Section 2.1.3.
The daily weather prediction of the study area one-week forward was obtained using AEMET (Agencia Estatal de Meteorología) OpenData. AEMET OpenData is the API REST (application programming interface representational state transfer) of the Spanish State Meteorological Agency [29]. The climate data obtained were: mean temperature (°C), maximum temperature (°C), minimum temperature (°C), maximum relative humidity (%), minimum relative humidity (%), wind speed (km/h), and cloudiness index (%). From these climate variables, the value of ET0 was calculated by the FAO (Food and Agriculture Organization) Penman–Monteith equation [28]. Finally, by web scraping techniques, forecasted precipitation was obtained from eltiempo.es [30]. Both weather forecasting and historical data were used to schedule the irrigation events.

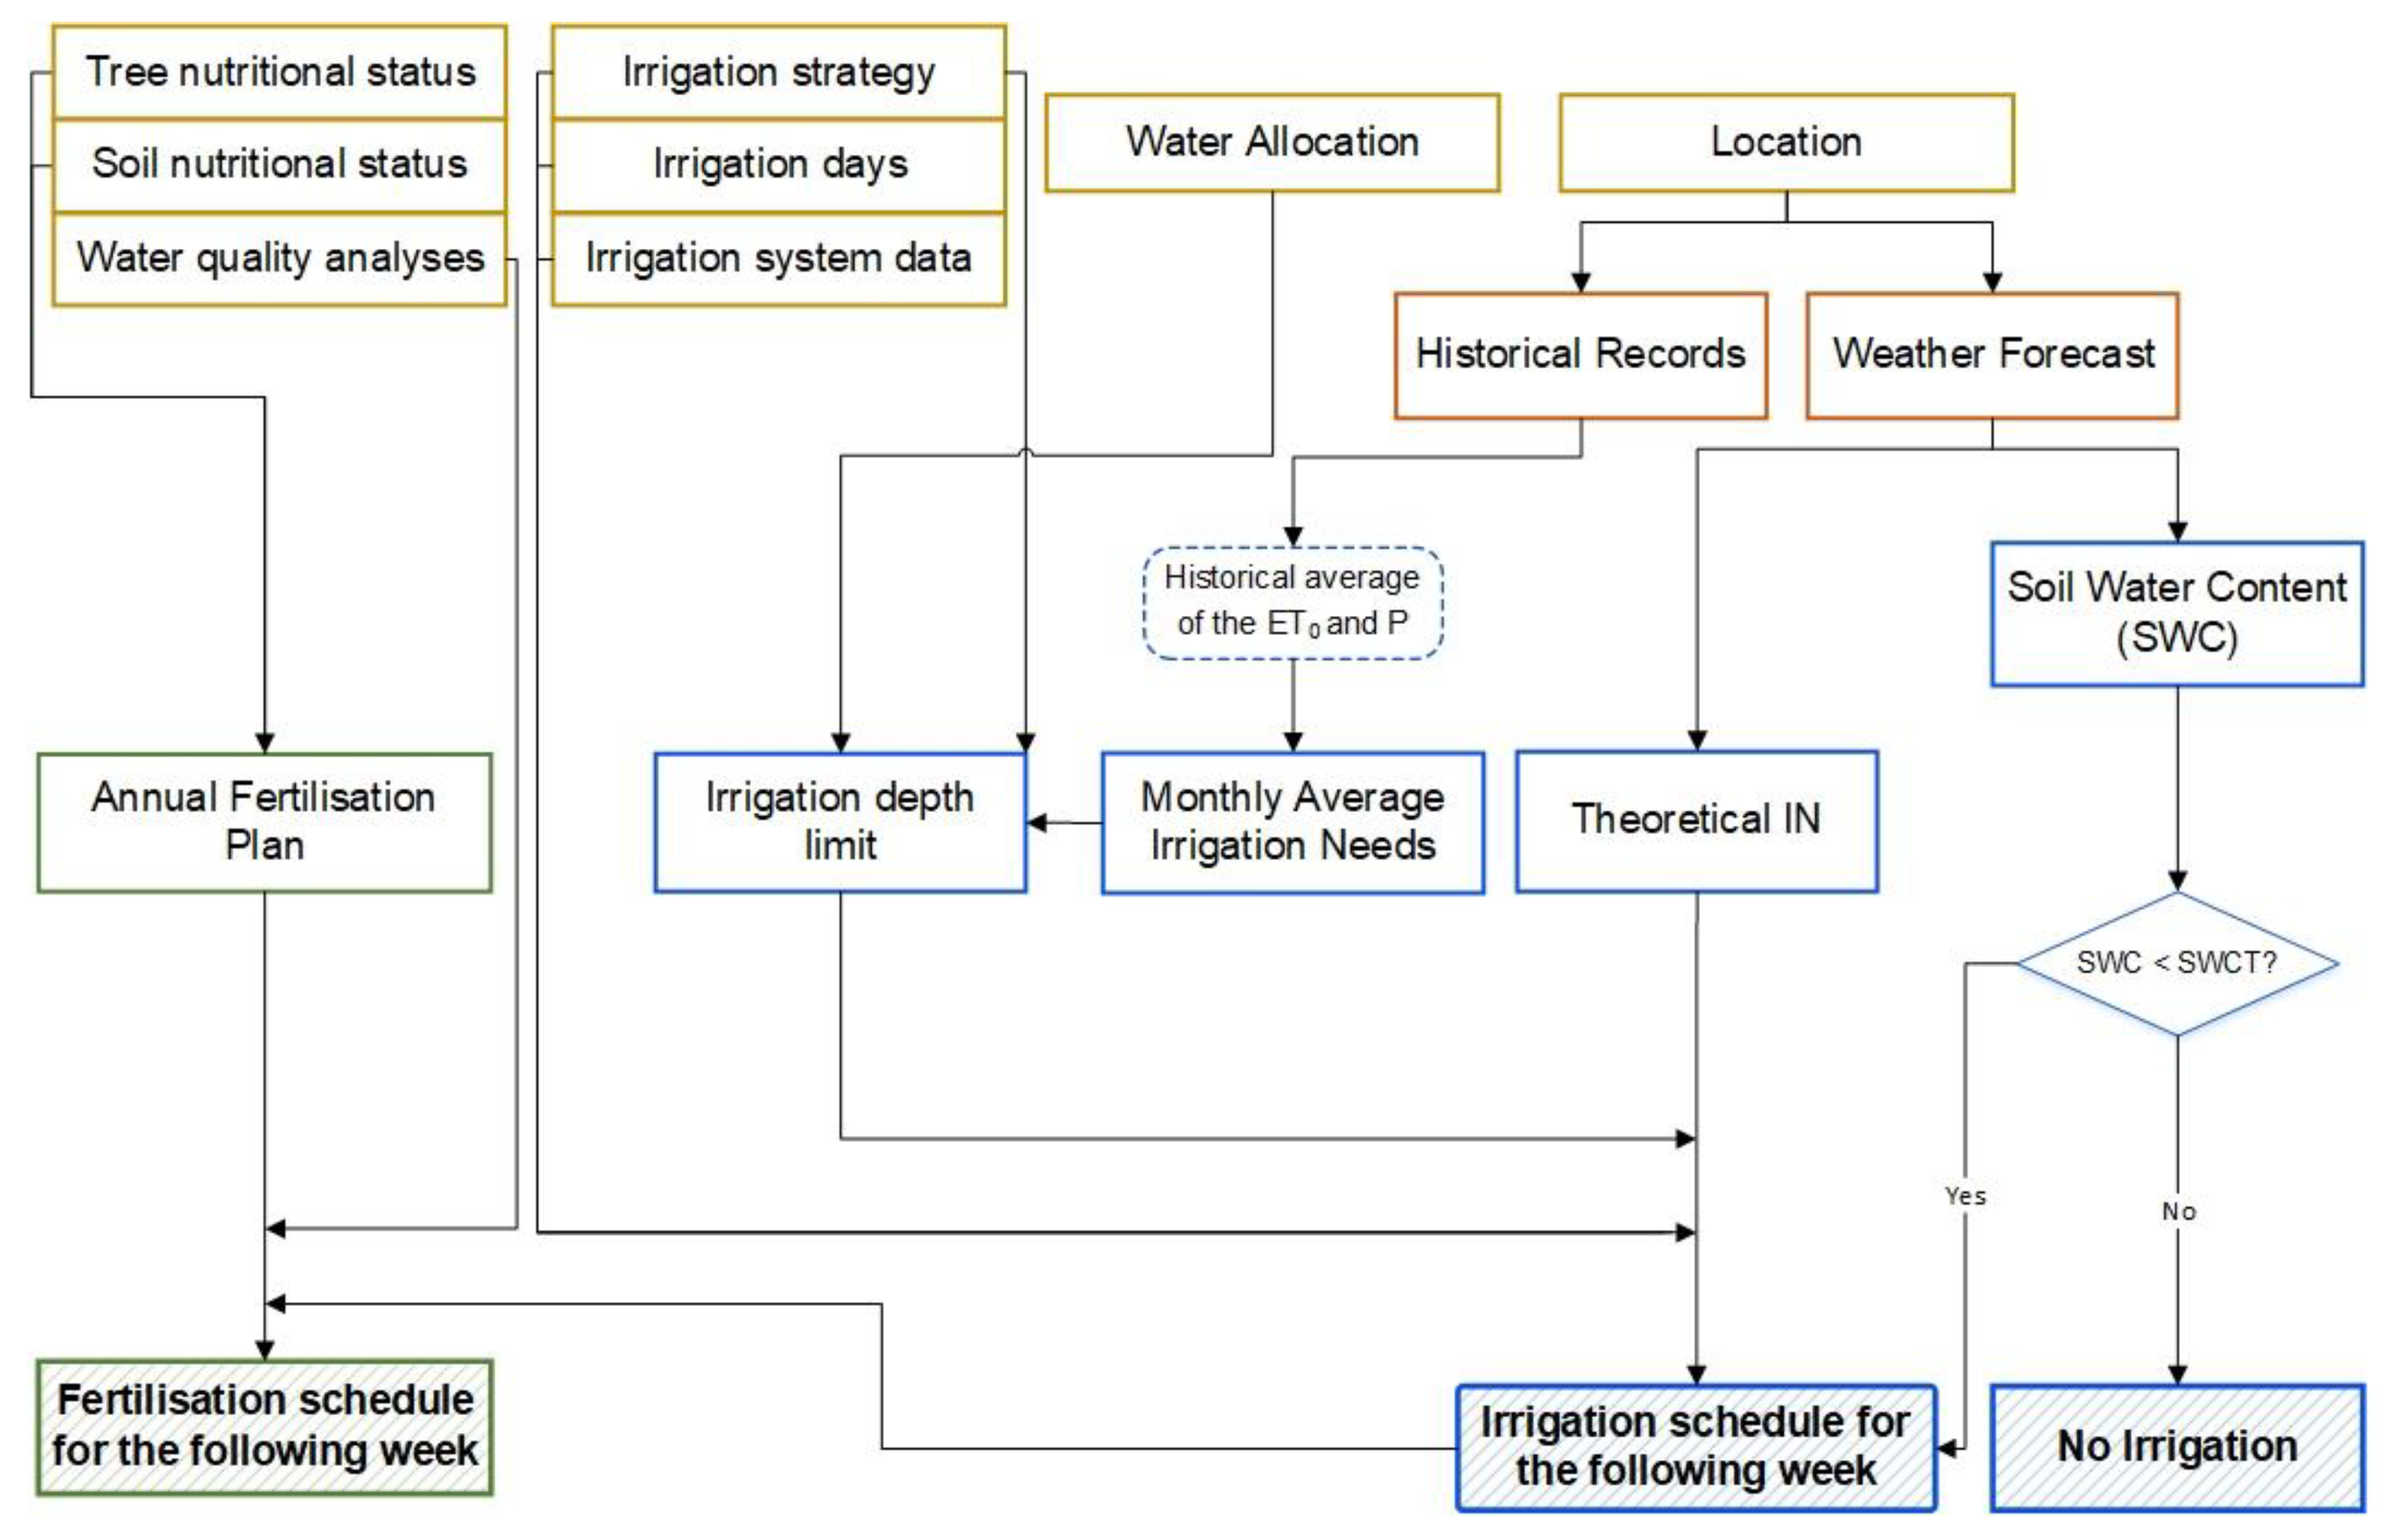
2.1.3. Irrigation Scheduling

Irrigation scheduling was determined based on theoretical daily irrigation requirements for the following week (INd). However, parameters such as monthly water thresholds, soil water content, irrigation system, and irrigation scheduling options were also considered.
Firstly, because of water scarcity problems, monthly water thresholds for irrigation (IWT) were established to ensure water availability at the most critical crop stage. IWT were determined considering the irrigation strategy and INhistorical, and the total water allocation according to the volume of reclaimed water in the treatment plant and the water allocation established by the water agency [5]. However, although the initial approach was based on historical records, the weekly irrigation recommendations were determined according to weather forecast. Therefore, fortnightly, REUTIVAR checked if the water initially scheduled, considering historical data, had been consumed, i.e., if the irrigation water applied from the beginning of the irrigation season matched to the IWT for that period. Otherwise, IWT was recalculated for the following months.
Both INhistorical and INd were calculated as the difference of ETc and Peff. The main difference between both variables is that INhistorical was calculated using historical agroclimatic data and INd using the weather forecasting. Peff, the amount of rainfall actually stored in the soil, was calculated using a fixed percentage of P [31]. In this case, it was considered a value of the 80% of P. The crop irrigation needs were calculated to refill the daily ETc, obtained by the methodology proposed by FAO [32]:
ET c = ET 0 · k c · k r
where ET0 (mm) was calculated from the weather forecast (see Section 2.1.2), kc is the crop coefficient (in this work the values proposed by Reference [33] were used, Table 1), and kr is a parameter related to the tree canopy. kr is equal to 1 for crops with more than 60% of soil cover and ranges from 0 to1 otherwise. In that case, kr is obtained by using Equation (2), proposed by Reference [34].
k r = 2 · S c / 100   for   S c 60 % k r = 1   for   S c > 60 %
where Sc (%) is the percentage of the soil covered by the canopy at midday and it is calculated as a function of the average canopy diameter, D (m), and plant density (N(tree/ha)):
S c = π · D 2 · N 400
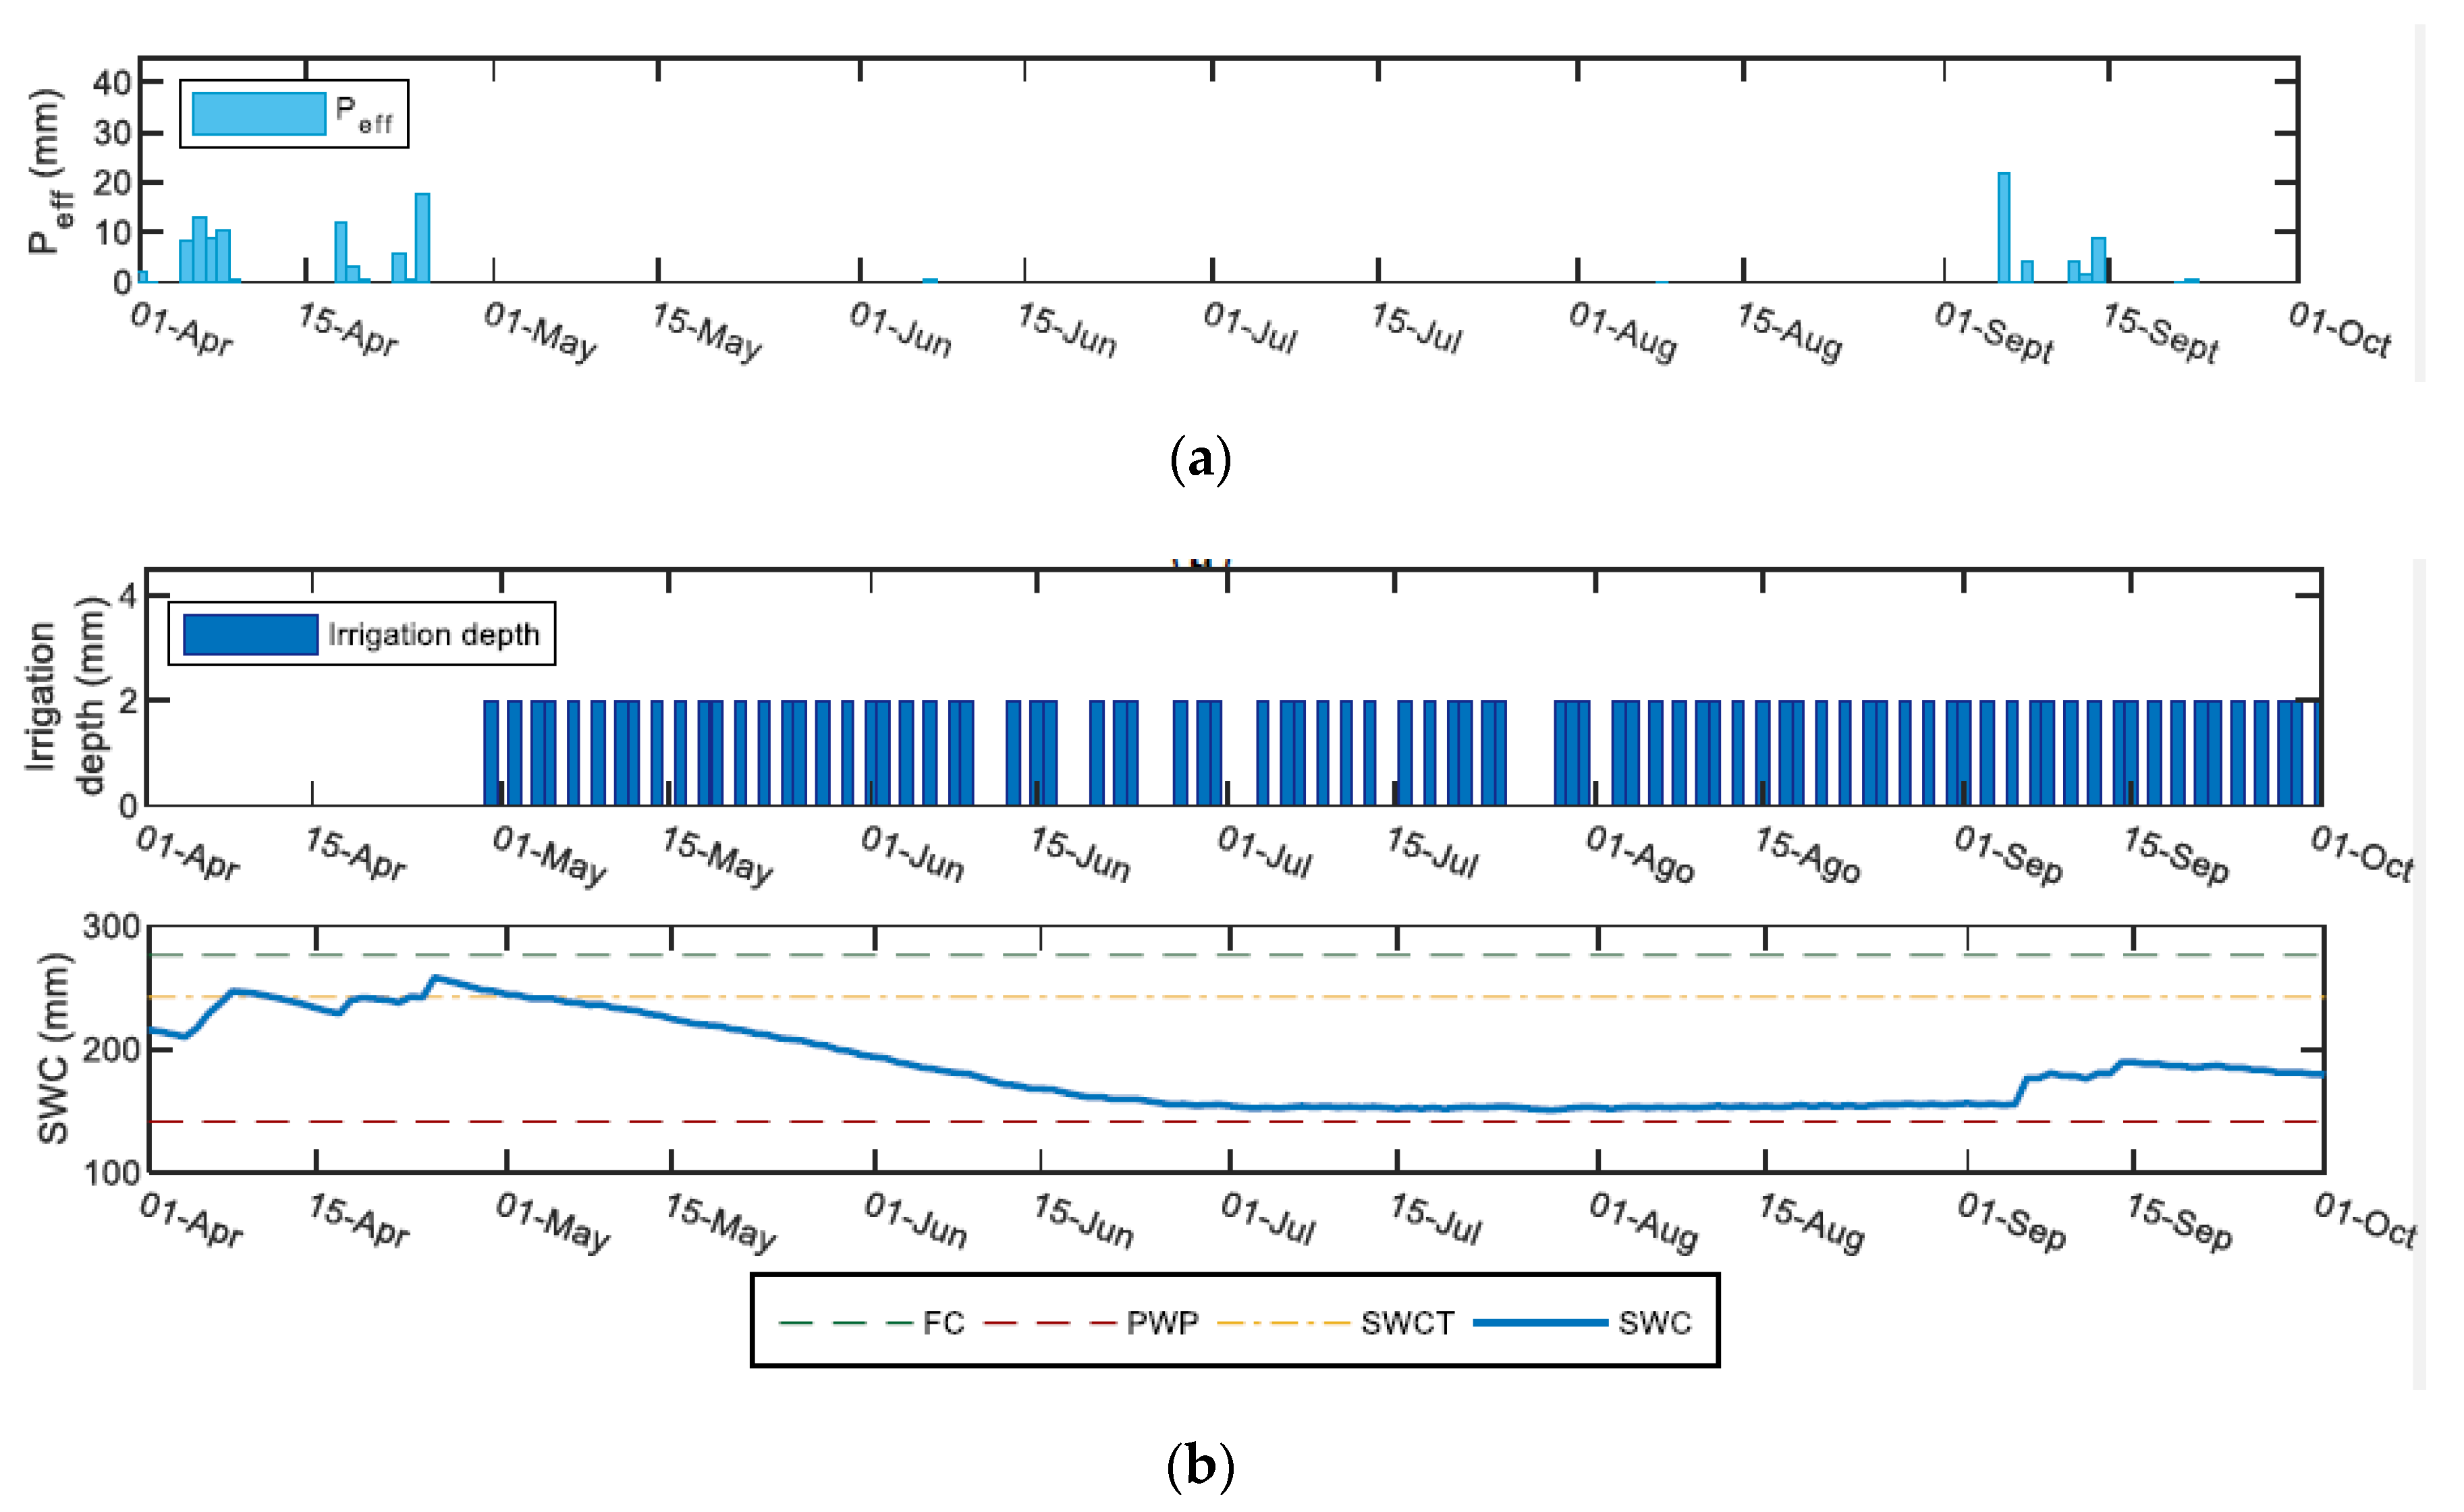
A soil water balance was used to establish the occurrence of irrigation events. This happened when soil water content was less than 25% of the field capacity value (FC). This is called soil water content threshold (SWCT) in this work. The daily soil water content (SWCd) provides information about the amount of water that the crop can extract from its root zone (Equation (4)). Daily, REUTIVAR simulated the soil water balance until that date by using historical data. Then, a soil water content prediction for the following week was conducted considering the weather forecast.
SWC d = SWC d 1 + P eff , d + IN d ET c , adj , d R d D d
where d is the irrigation day, SWCd-1 is the soil water content in the day d-1 (mm), INd is the applied irrigation depth (mm), ETc,adj is the crop adjusted evapotranspiration to take into account the crop difficulty to extract water when the soil water content diminishes (mm), Rd is the runoff (mm), and Dd is the deep percolation (mm). Both Rd and Dd are deemed null in this work, since REUTIVAR is designed for a drip irrigation system. To compute the SWC, information about soil type and rooting depth were also required.
However, the amount of water that the crop can extract from the soil is not uniformly distributed along the soil drying period and changes depending on the soil moisture. Thus, when the soil is wet, the resistance to water extraction is low, and the crop water uptake can satisfy the atmospheric water demand, i.e., water uptake equals ETc. In contrast, when the water uptake does not reach ETc, this term must be adjusted, as shown in Equation (5) [28].
ET c , adj = ET c · TAW D r TAW RAW
where TAW is the total available water (mm) calculated from Equation (6), Dr is the root zone depletion (mm), calculated as the difference between TAW and SWCd-1, and RAW is the readily available soil water in the root zone (Equation (7)).
TAW = 1000 · ( θ FC θ PWP ) · Z r
where θFC is the water content at field capacity (m3/m3), θPWP is the water content at permanent wilting point (m3/m3), and Zr is the rooting depth (m), which was considered as 1 m for the olive case.
RAW = p · TAW
where p is the fraction of TAW in which the crop can extract water without suffering water stress, and its value is also obtained from Allen [28]. In the olive case, p is considered 0.75 [33].
In addition, the model considered the days of the week the user chose to undertake irrigation to establish the irrigation volume. To do this, REUTIVAR calculated the irrigation needs for the whole week using the weather forecast. In case of internet connection or data source failure, the daily average values were considered temporally. Once connectivity was recovered, the model distributed the irrigation recommendations amongst the selected days by assigning to each of those days its correspondent volume plus the one of the following days, until the next day of irrigation (Equation (8)).
IN d = d = 1 n 1 IN d · k strategy for   IN d < ( IWT dm ) · id IN d = ( IWT dm ) · id for   IN d > ( IWT dm ) · id
where n is the next irrigation day chosen by the user, kstrategy is the applied coefficient depending on the irrigation scheduling options, dm is the number of days of the month, and id is the number of days from the current day to the next irrigation event.
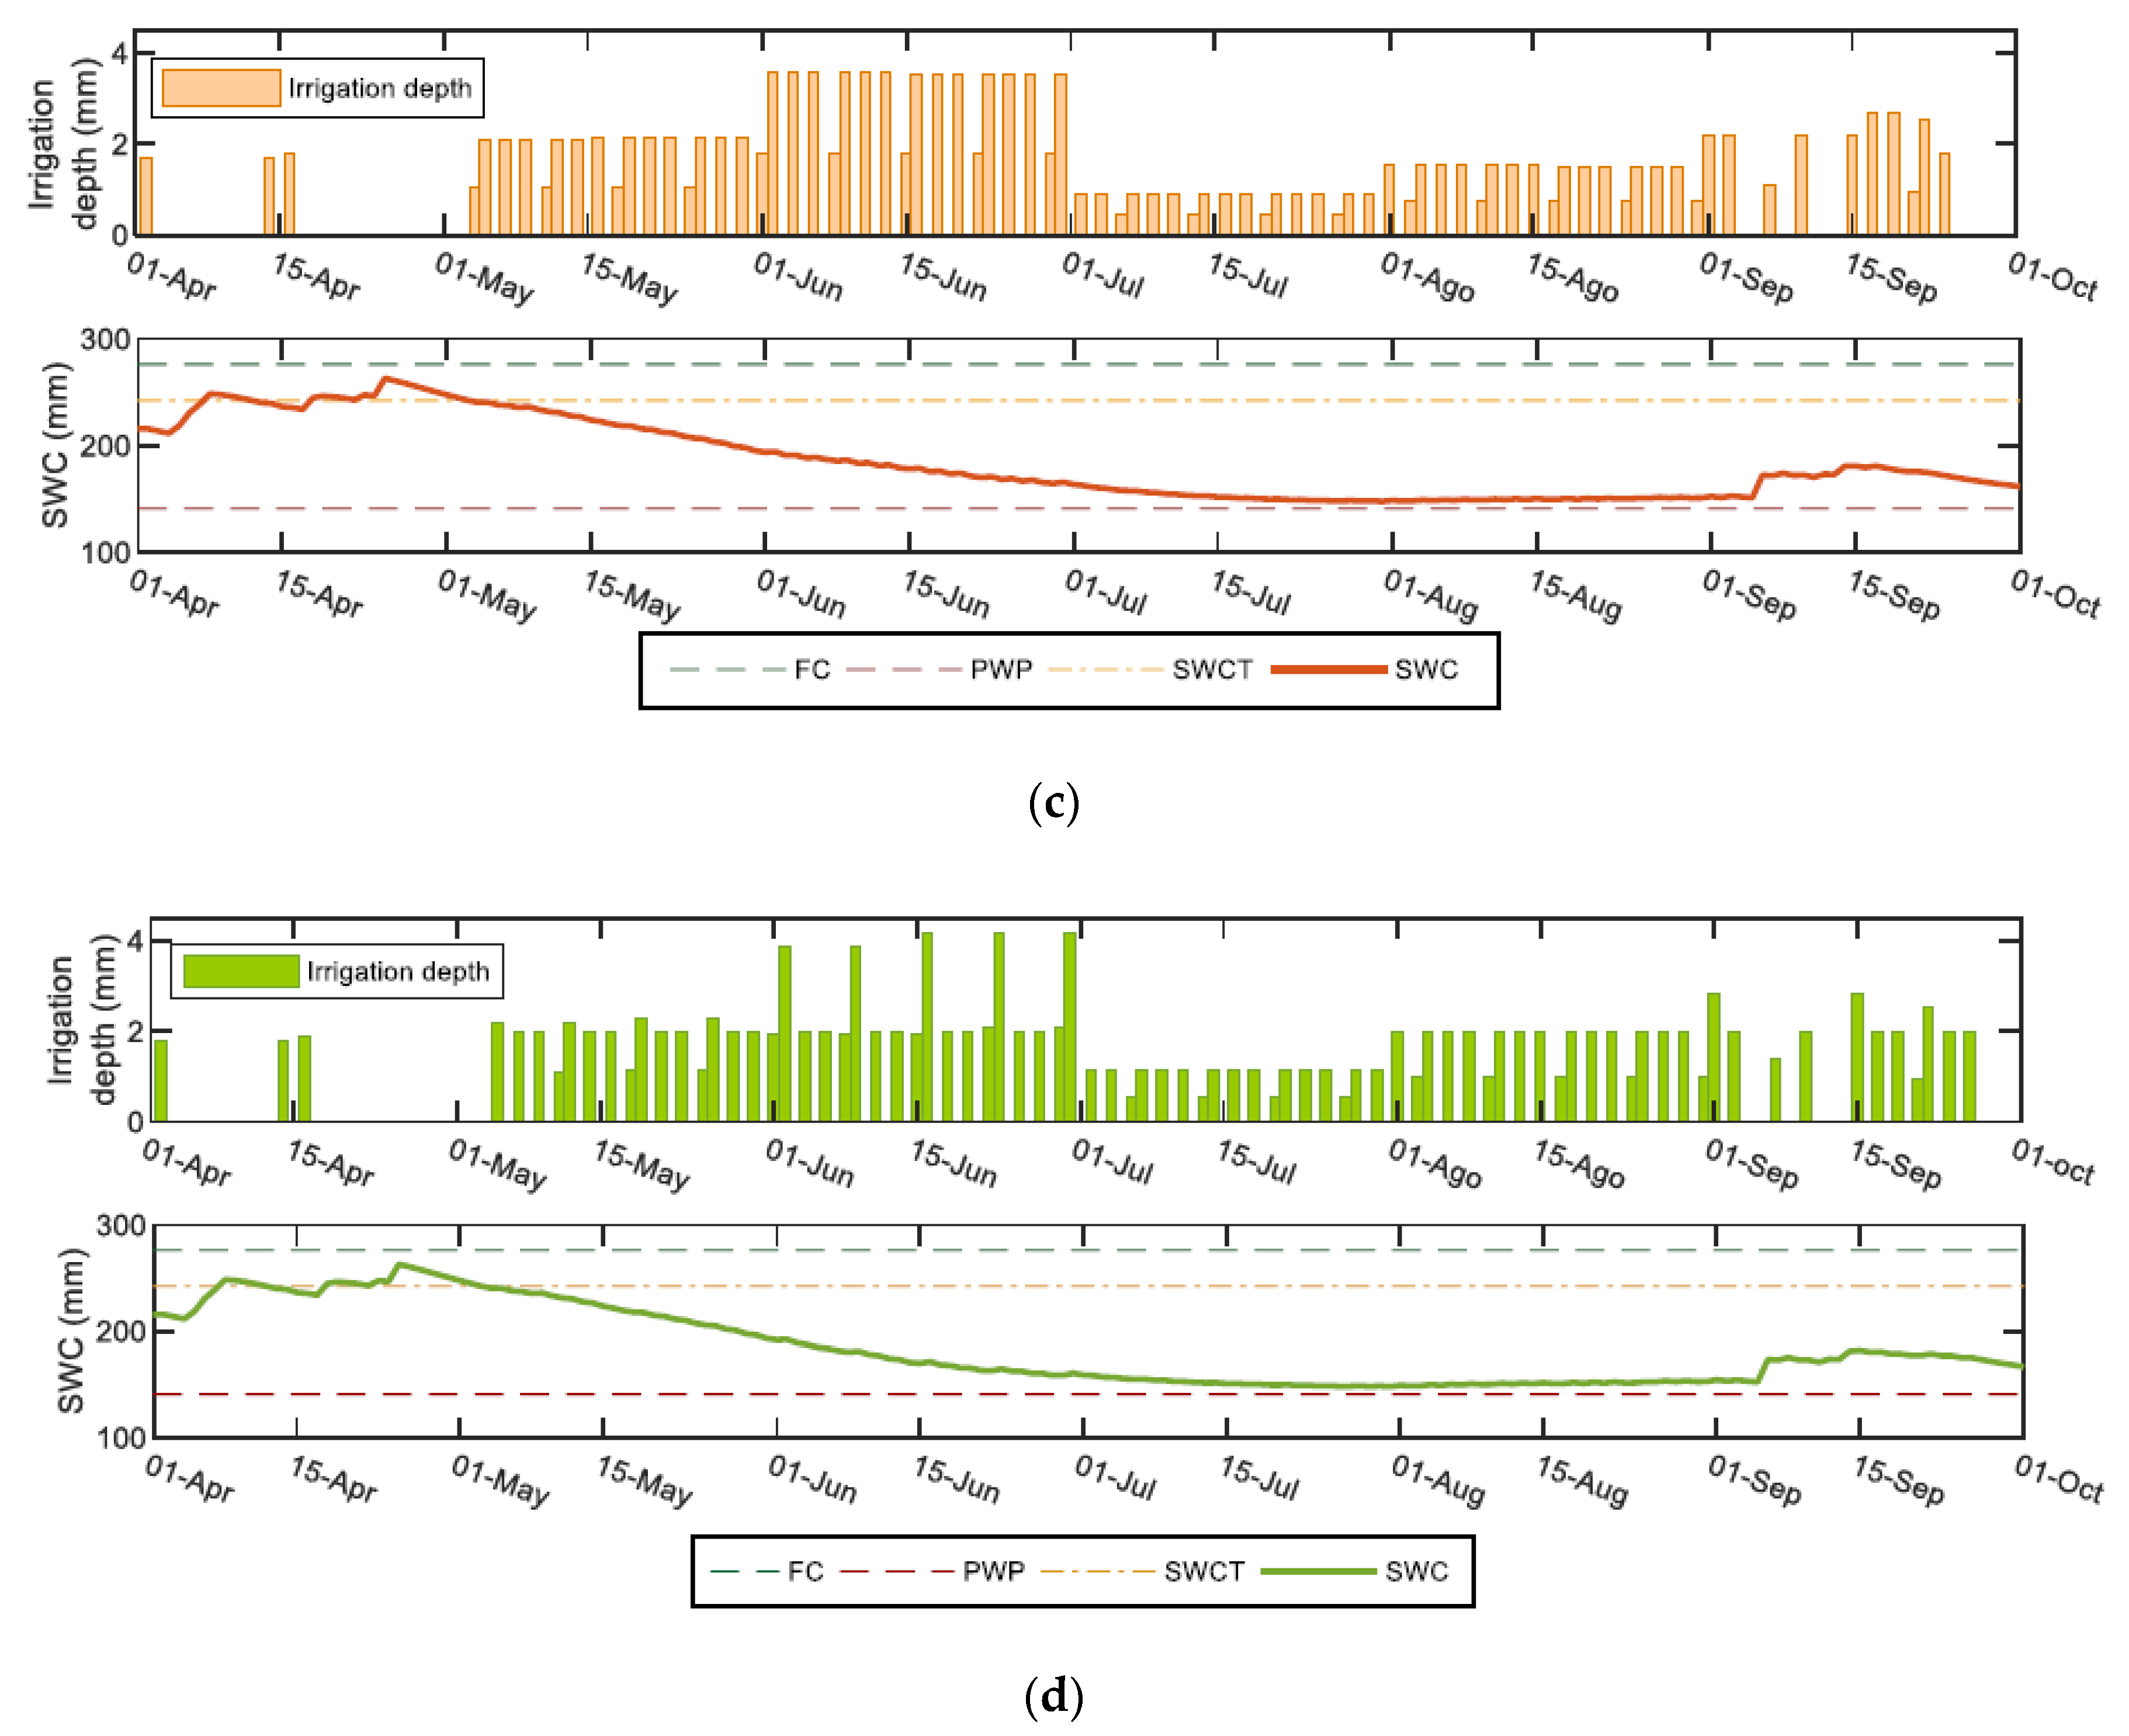
Three irrigation scheduling options were included in the model: full irrigation (FI), sustained deficit irrigation (SDI), and regulated deficit irrigation (RDI). These strategies are currently the most widespread options, as shown in Reference [35] for olive orchard. These strategies are explained in detail below.
  • FI: in this strategy, the irrigation events are scheduled to cover the total irrigation olive needs, i.e., to fully refill daily ETc. Therefore, in this case, kstrategy equals 1.
  • SDI: a percentage of the total olive crop irrigation needs is applied equally along the irrigation period. This percentage can be selected and modified manually, and it corresponds to the value of kstrategy in the previous equation.
  • RDI: a percentage of the FI is also applied but with varying the irrigation volume according to the crop phenological phase. This strategy concentrates the water stress on the least critical stage to oil production. Specifically, this period is the pit hardening, which ranges from the ending of the fruit set to the beginning of the fruit growth [36,37]. In addition, the pit hardening stage matches the summer, when transpiration efficiency is also minimal. Therefore, kstrategy is variable based on these variations.
Finally, the irrigation time (t) was determined according to Equation (9).
t d = IN d · A · 10 4 IE · q e · n e
where td is the irrigation time for the day d (h/day), A is the sector area (ha), IE is the irrigation efficiency, which was considered 0.95 for the model, qe is the emitter flow (L/h), ne is the emitter number, and 104 is the unit conversion factor. There is the possibility of limiting td according to the off-peak energy tariff hours.

2.1.4. Fertilization Scheduling

The fertilization schedule was established according to an annual plan, which varied depending on the crop uptake and the previous year nutritional status, as shown in Reference [38] for olive trees. According to this author, the nutritional status of the tree is determined by using foliar diagnosis [39]. The samples must be taken in July since from that date, the foliar nutrient content is stable. In addition, for that period, the critical nutrient level in leaves for olive are tabulated [40] (Table 2). The analysis results were compared with the leaf nutrient levels and, only in case of deficiency, fertilization applications were scheduled.
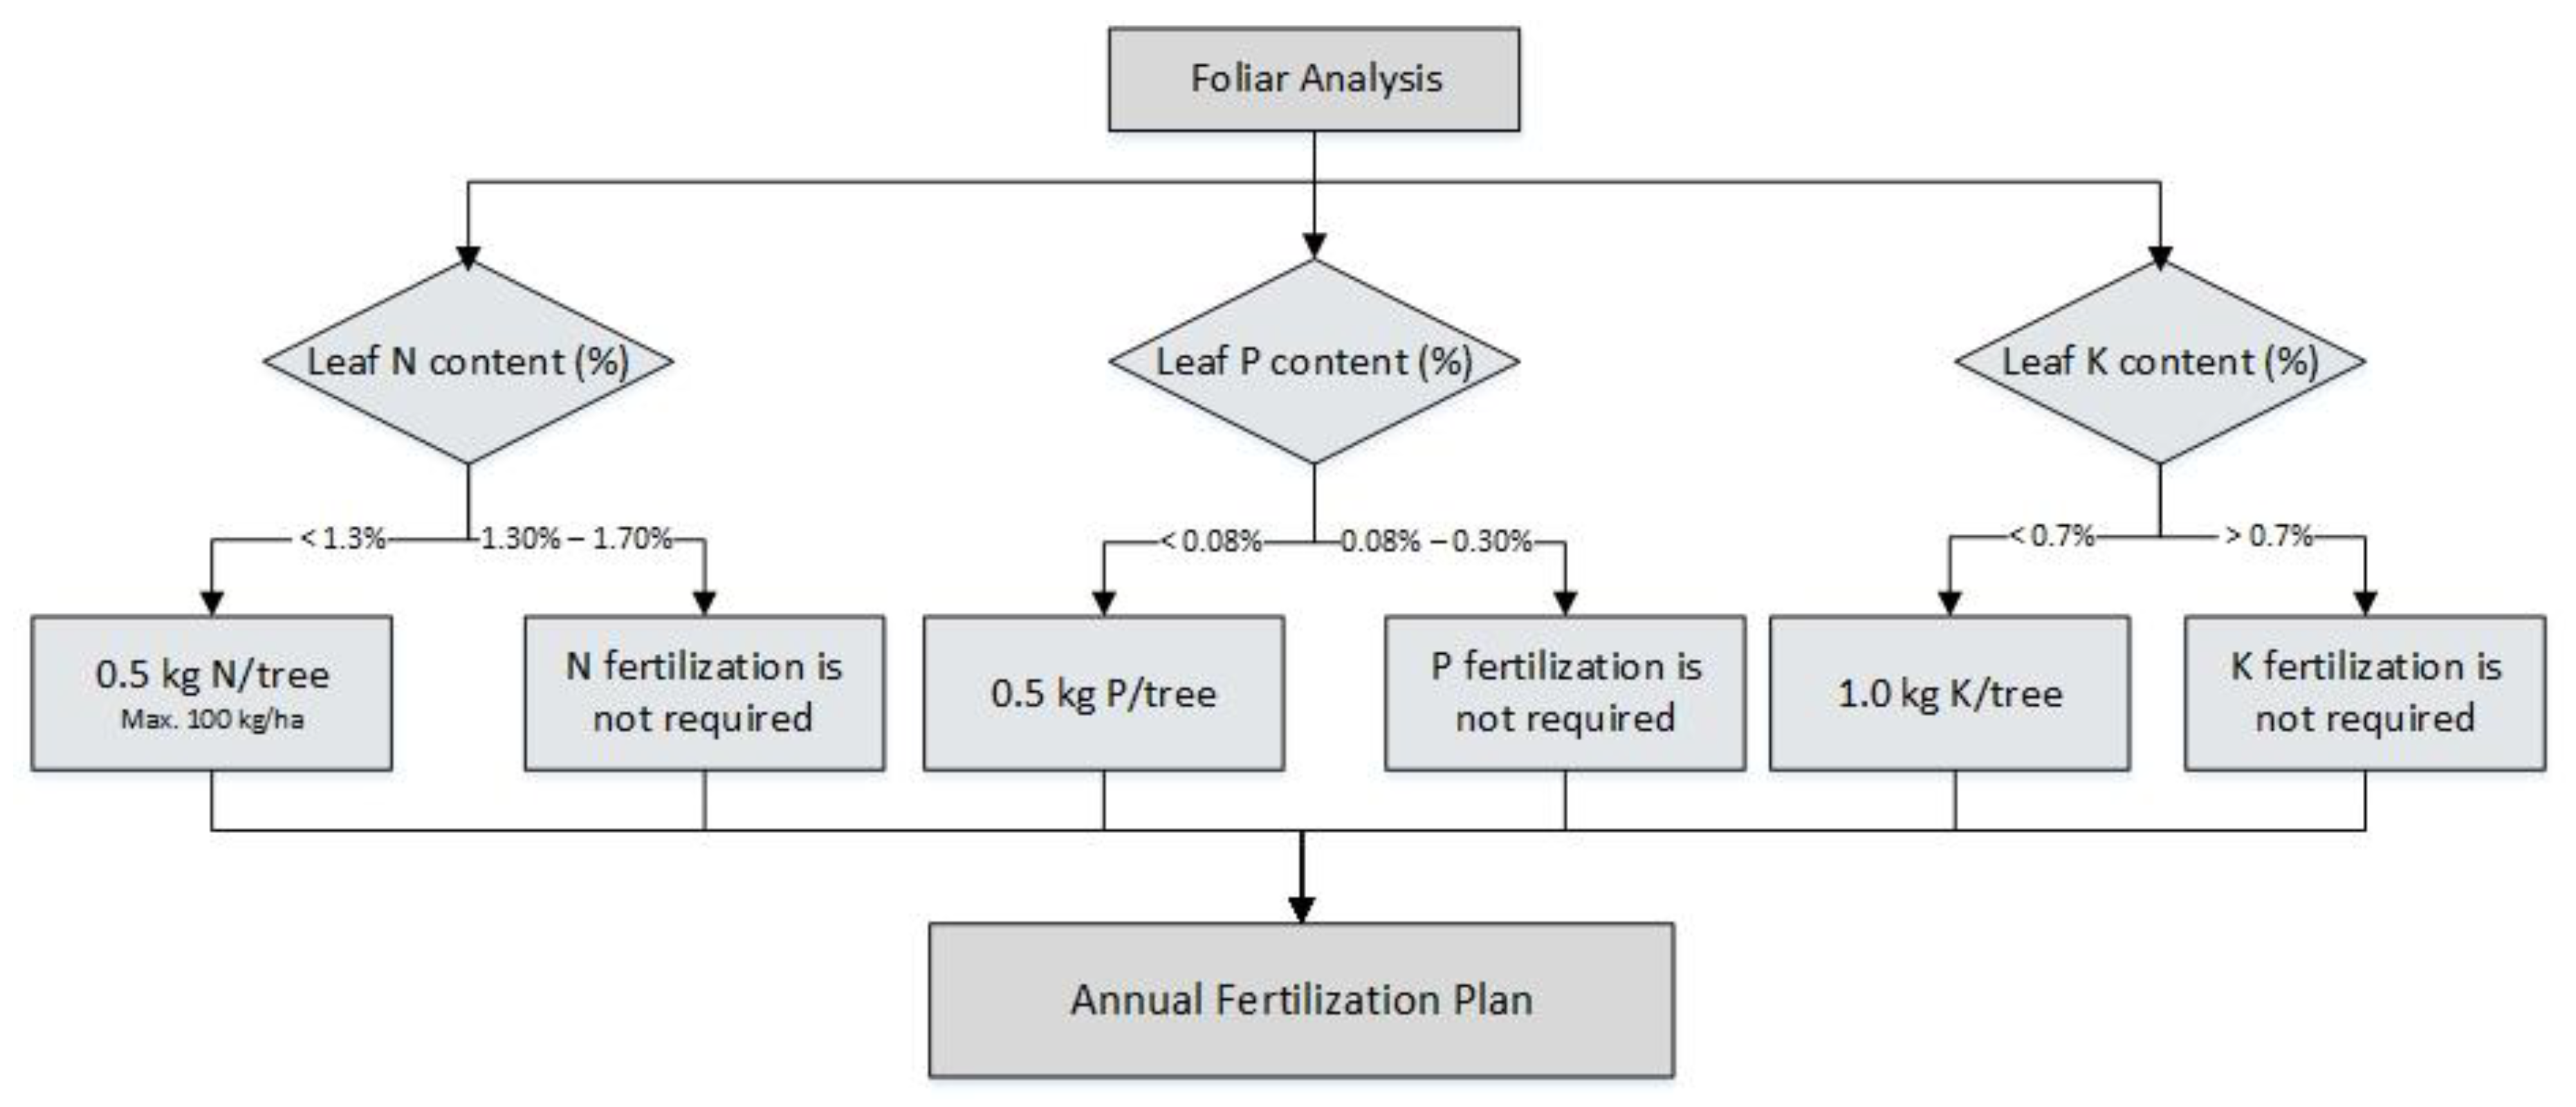
If fertilizer application was required, the total fertilizer amount was calculated according to an estimation of the annual nutrient uptake for olive crop [38]. The following year, foliar analyses were conducted again to increase or decrease the nutrient dose. A flowchart decision tree of the methodology to establish the annual fertilization plan is shown in Figure 2. For nitrogen (N), if leaf nutrient content was lower than 1.3%, the estimation of N requirements was 0.5 kg/tree. However, total N application could not exceed 100 kg/ha. For phosphorus (P), in case P leaf content was less than 0.08%, then 0.5 kg/tree were needed. Finally, for potassium (K), the estimated application was 1 kg/tree if K leaf content was less than 0.7%. The total fertilizer amount was distributed along the irrigation season depending on the crop grow cycle, following the recommendations of Reference [41] (Table 3). The nutrient requirements were met by applying N, P2O5, and K2O, which are the main components of commercial fertilizers.
The final nutrient quantity to be applied was calculated as that estimated in the annual plan minus the nutrient content determined from water quality samples. This quantity was adjusted to the irrigation schedule, i.e., the fertilizer application days always coincided with the irrigation days. Finally, the user can select between fertilizing once a week or in each irrigation event.

2.2. Graphical Interface

Finally, the model previously described was integrated in a desktop application to make its use easier. The desktop application was developed by the graphical interface development environment (App Designer) of MATLABTM version R2018a [42]. Then, it was compiled using MATLAB CompilerTM with MATLAB Runtime 9.4.

2.3. Case Study

The developed model was tested in a commercial olive orchard located in the Tintín Irrigation District (TID), Córdoba (Southern Spain). In this region, the climate is typically Mediterranean, with annual average rainfall of 590 mm, mainly in spring and autumn. The annual average temperature is 16.9 °C and the ET0 is 3 mm/day. Olive grove is the main crop (Olea europea L., cv Hojiblanca and Olea europea L., cv Nevadillo azul) spaced at 8 × 8 m and devoted to oil production. The average production of the farm is around 7000 kg/ha. The water applied in TID comes from the village sewage treatment plant. This water is stored in a reservoir where chemical and physical treatments are carried out to obtain the required water quality for reuse. The water is then distributed by subsurface drip irrigation (2.2 L/h pressure compensating drippers spaced at 1 m and installed at a depth of 40 cm). A water allocation of 1500 m3/(ha·year) is applied according to the irrigation district manager criteria. Fertilizers are applied by fertigation and also based on the farmer’s experience.

2.4. Management Scenarios

In order to test the model as well as to highlight its usefulness, five scenarios have been assessed:
  • Actual management scenario (AM). This scenario took into account the fertilization and irrigation scheduling established by the irrigation district manager. It consisted of irrigation applications during 8 h on Tuesdays, Thursdays, Saturdays, and Sundays for the entire irrigation season. Regarding fertilization, they applied 10 kg/ha of N, 6 kg/ha of P2O5, and 12 kg/ha of K2O.
  • Optimal water and fertilization management scenario (OWAF). This scenario is obtained by applying the REUTIVAR model. It considered the RDI strategy taking into account soil, water, and crop analysis to establish an optimal fertigation scheduling using historical and forecasted climatic data for the actual conditions. The irrigation days were selected according to the TID criteria, but the irrigation events’ duration was variable during the irrigation season, according to the most critical crop stages to water stress.
  • Optimal water, fertilization, and electricity cost management scenario (OWAFE). As in the previous scenario, this option considered the RDI strategy to determine the optimal irrigation and fertilization scheduling, but the electricity tariff was included. In this scenario, the optimal fertigation was scheduled only during off-peak energy tariff hours. Therefore, the irrigation days were similar to previous scenarios. The irrigation event duration was also adjusted to the crop stages. However, in contrast to OWAF, there was also a daily time limit for irrigation. This limit was 8 h during the weekdays. No limits were established on weekends and in August.
  • Actual management scenario considering a hypothetical olive nutrient deficiency (AM-ND). This scenario was the same as AM, i.e., it considered the fertigation scheduling established by the irrigation district manager, but it also simulated a hypothetical olive N, P, and K deficiency. This scenario intended to evaluate the efficiency and adequacy of the TID fertilization application strategy in case of nutrient deficiencies.
  • Optimal water, fertilization, and electricity cost management scenario considering hypothetical olive nutrient deficiency (OWAFE-ND). As in the previous scenario, this option considered a hypothetical N, P, and K deficiency to determine the optimal irrigation and fertilization scheduling in that case but considering the management of the OWAFE scenario.

3. Results and Discussion

3.1. Analysis of Soil and Nutrients in the Study Area

In the study farm, the texture and soil nutrient content, water quality, and tree nutritional status were analyzed to run the model. Regarding the soil, tests at different sites in the farm were carried out to assess soil texture, electrical conductivity, pH, and nutrient content. The soil samples were taken considering changes in the morphology, color, and slope to cover as much soil diversity as possible, as recommended by Parra [43]. Four places were selected for this purpose: two of them were located under the tree (U) and the remaining two were located between trees (B). At each place, two samples were taken at different depths, according to the type of crop. For the olive tree case, the samples were taken between 0 and 15 cm (P1) and between 15 and 30 cm (P2). In terms of assessing the nutritional status of the tree, foliar diagnosis was carried out [39], two samples of 100 leaves from 50 trees each were analyzed in July 2018 and 2019. Finally, water quality analyses were carried out monthly. The water samples were taken in the pipe between the reservoir and the pumping station. Thus, the nutrient content of the water in the model was updated fortnightly using these results.
Several analyses were carried out during the 2018 and 2019 irrigation seasons in the olive orchard farm located in TID. Table 4, Table 5, and Table 6 show the soil, foliar, and water quality analysis results, respectively.
The farm soil was defined as clay loam. From the moisture retention curves, the FC value was determined as 0.28 cm3/cm3 and the permanent wilting point (PWP) as 0.14 cm3/cm3. Finally, as for the macronutrient amount, the phosphorus (P) amount between trees was higher than under the tree. Nevertheless, the P amount contained in all the locations suggests that a P fertilization response was unlikely, especially for olive orchard. This is because P extractions are low, and this nutrient is easily reusable for olive trees. In addition, high P content could cause zinc (Zn) blockages, originating Zn deficiency in the tree. Likewise, considering the potassium (K) analysis, all the samples showed high levels of K and, consequently, the expected fertilizer response was unlikely. The nitrogen (N) levels in soil were not analyzed due to the high short-term mobility of this element in the soil.
As shown in Table 5, the amount of P and K in olive leaf were within the recommended range in the 2018 irrigation season and the values were adequate in the following year. The P leaf level remained steady for the two seasons. The K leaf content was slightly lower in the 2019 irrigation season, although it stayed within the correct range. However, for the N level, except in ‘Nevadillo azul’ variety in the 2018 irrigation season, all the leaf samples showed mildly high nitrogen content. According to Molina-Soria and Fernández-Escobar [44], a nitrogen leaf content higher than 1.7% causes impacts on flower and a decrease in oil quality. Other authors also agree with the damages that an excess of nitrogen can produce in olive, such as a decrease in the olive frost tolerance, a delay in the fruit ripening, leading to a reduction in fat yield, and also soil pollution produced by nitrogen leaching [45,46,47].
As shown in Table 6, the nitrogen content varied along the 2019 irrigation season, especially the ammoniacal nitrogen (N-NH4). The highest nitrogen concentrations occurred in May, June, and July, when nitrogen needs increase. Additionally, in May and June, the irrigation needs for olive are also larger. Therefore, when a RDI strategy is considered, the total nitrogen application must be higher. The nitrogen fluctuation highlighted the importance of a regular water quality control since the N fertilizer amount to be applied could be over or underestimated. Regarding phosphates, the amount contained in water was higher in 2018 than in 2019. During the 2019 irrigation season, the variations were not significant. However, the concentration difference between years also emphasized the relevance of water quality controls. Finally, about potassium concentration, it was only possible to take one sample because of technical problems. The K concentration in that sample was considerably high, which indicated substantial nutrient application throughout the irrigation season. The K concentration was assumed constant for the whole irrigation season.

3.2. Analysis of Management Scenarios

The model was applied for 2019 irrigation season data and the five proposed scenarios. Figure 3 shows the AM, OWAF, OWAFE, AM-ND, and OWAFE-ND irrigation schedules along the 2019 irrigation season. For AM and AM-ND, the irrigation schedule distribution was the same and, for that reason, both are represented in a single figure (Figure 3b). It also occurred for OWAFE and OWAFE-ND scenarios, which are represented in Figure 3d.
The total Peff from April to September was 123 mm (Figure 3a) and the average ET0 during the irrigation season about 4.5 mm·day−1, which can be considered as a regular year. The total water applied in the AM scenario was 1623 m3/ha for the 2019 irrigation season. It did not adjust the total water applied to the water allocation according to the irrigation district manager criteria (1500 m3/ha). This could affect the profitability of the studied irrigation district since the water use in that region is limited by the water authority, causing financial penalties in case of exceeding the established limit. However, OWAF, OWAFE, and OWAFE-ND adjusted the total water applied to this water allocation limit. In particular, OWAF applied a total of 1492 m3/ha, and OWAFE and OWAFE-ND, a total of 1497 m3/ha. The three of them concentrated the irrigation events in May, June, and September, when olive is more sensitive to water stress [36,48]. However, for the OWAF scenario, the water application distribution could be steadier since time restrictions were not considered. In contrast, OWAFE and OWAFE-ND took into account the electricity tariff existing in TID. In these scenarios, the optimal fertigation was scheduled only during off-peak hours, when power and energy are cheaper. For the TID electricity tariff, the off-peak hours included from 12 am to 8 am every day, as well as 24 h for Saturdays, Sundays, and bank holidays. This effect reduced the water application in the most water-demanding months according to the RDI strategy. Thus, the volume of water applied in May and June was lower in OWAF than in the OWAFE and OWAFE-ND scenarios.
In terms of soil water content, in all the scenarios, the water content never fell below the PWP. This could be because the soil is extremely dry and the resistance to water extraction is considerably higher when water content in soil is lower than the RAW. It was also noticed that, despite applying the scheduled irrigation in all the cases, the soil water content decreased from May to the first precipitation event in September. However, this decrease was slightly lower in OWAFE and OWAFE-ND and noticeably lower in OWAF, since more water was applied in June. This allowed the soil not to be depleted abruptly and for a shorter period of time. Despite this, in these three scenarios, the soil water content diminished considerably. This is because of the limit of water allocation, noticeably lower than the olive orchard irrigation needs. Therefore, the soil water content only increased after the first precipitation events.
Regarding fertilization needs in both OWAF and OWAFE scenarios, fertilizer application was not required according to REUTIVAR, as recommended in Reference [38]. This is because the nutrient leaf levels of the olive orchard were in the correct range, i.e., there was no nutrient deficiency. In the AM scenario, although fertilizers were not needed either, some were applied. Then, olive nutrient deficiency was forced for the AM-ND and OWFE-ND scenarios to evaluate how REUTIVAR would operate in that hypothetical situation. Table 7 shows the nutrient amount applied for all the scenarios.
The use of reclaimed water as a water source for irrigation involves the nutrient application within the water, as shown in Table 7. For this reason, regular water quality controls are essential for the proper irrigation system performance. In both OWAF and OWAFE scenarios, considering the average production of the farm, the nitrogen removal by harvest and pruning was compensated with the applied nitrogen within water irrigation in addition to the rainwater nitrogen and the organic matter mineralization [49]. More nitrogen was applied in the OWAF scenario compared to the OWAFE scenario because in June, when more water was applied in OWAF, the nitrogen content in the water was also higher. As for phosphorus, olive trees show low P extractions by harvest, and they can also reuse it. For that reason, olive orchards in that region do not usually present P deficiency problems and they do not frequently respond to P applications. Therefore, the P application within the water was enough to cover olive needs. Finally, the potassium element showed the highest concentration within the irrigation water. However, the extraction of this element is significantly high in olive trees. Hence, potassium deficiency is the major nutritional problem in olive orchard in Andalusia, playing a key role in the olive tree nutrition. Nevertheless, the K amount applied in the irrigation water covered all potassium removals for harvest. Thus, the fertilizer application was not required, which led to a reduction in the total annual farm cost and a decrease in pollution keeping the olive oil production.
In the hypothetical high nutrient deficiency situation, i.e., the AM-ND and OWAFE-ND scenarios, considering the farm area and the tree spacing, the total nutrient needs according to Reference [38] recommendations, were: 78 kg/ha of N, 78 kg/ha of P, and 156 kg/ha of K. Based on these recommendations, in the AM-ND scenario, a fertilizer deficiency was determined. In both AM and AM-ND fertilization, decisions were not based on the tree nutritional status, which can cause fatal damages to the farm, its production, and profitability. On the other hand, in the OWAFE-ND scenario, the nutrient needs were covered, which would lead to an increase in farm yield. Under this scenario, the use of reclaimed water as irrigation water would entail savings of 21%, 1%, and 31% of the N, P, and K needs, respectively.
In summary, the use of the fertigation recommendations (OWAF and OWAFE scenarios) provided by the REUTIVAR model entailed a better water distribution along the irrigation season compared to conventional practices (AM) in which water is applied without considering the most critical olive phenological stages. As for nutrient applications, an excess of nutrients was applied in the AM compared to OWAF and OWAFE scenarios, in which the nutrient content of reclaimed water is considered. Furthermore, in the hypothetical case of nutrient deficiency, since the conventional practice is not based on nutrient tree status, not enough fertilizers were applied in the AM-ND scenario. In contrast, if the model recommendation would be followed, all the nutrient requirements would be covered.

3.3. Graphical Interface

Finally, the developed model was integrated in a user-friendly graphical interface to make the daily fertigation scheduling management easier (Figure 4).
In the screen (a) of the graphical interface (Figure 4a), the user must introduce the required data to run the model: farm location, type of soil, water allocation, irrigation system characteristics, irrigation strategy, foliar analysis results, and water quality results. In this screen, the user can select between different irrigation strategy options: RDI, SDI, and FI. They can also select the days of the week they wish to irrigate and if they wish to fertilize whenever irrigation is applied or weekly. Then, all this information is stored in an internal database through the save button. The fertigation schedule for the following week is provided in the screen (b) (Figure 4b). Firstly, in this screen, a precipitation and temperature forecast for the following week is provided. Then, a simulation of the soil water content for that week is shown. At the bottom of the screen, irrigation and fertilization scheduling recommendations are provided. The irrigation scheduling is given in volume (mm) and in time units (hours), which is more functional. In addition, information about total water applied from the beginning of the irrigation season and water expected to be applied for that week are also shown. Finally, in this screen, two buttons can also be observed: the refresh button and the edit data button. The refresh button allows to manually update the real-time information of screen (b). By pushing the edit button, screen (a) reappears and the user can modify any of the data previously introduced.

4. Conclusions

A precision fertigation model using reclaimed water, REUTIVAR, was developed. REUTIVAR was validated in the 2019 irrigation season in a commercial olive orchard. To do this, five scenarios were simulated. This validation proved that REUTIVAR adjusts the established water allocation along the irrigation season, preventing additional costs to the farm. However, it also showed that this water allocation was much lower than the olive orchard irrigation needs. The scenario simulations also indicated that with the current farm characteristics, the RDI strategy could be applied, even if electricity tariff limitations were considered. This could involve important improvements in both quality and quantity of final oil production. This validation also proved that, thanks to the nutrients which the water carry, additional fertilization was not required. This implies large benefits in the environment but also in the total financial costs of the farm. On the other hand, if the hypothetical nutrient situation is assumed, the current fertigation management of the farm would not cover the nutrient needs either. This shows the importance of the nutritional crop status diagnosis to establish the fertilization decisions.
This work confirms that irrigation with reclaimed water should be managed in a more sustainable way since famers tend to overfertilize. However, following REUTIVAR’s recommendations, it is possible to save fertilizer costs with positive effects on the environment and farmer’s incomes. In addition, although the model was validated for olive orchard, REUTIVAR could be adapted to other crops, offering a useful tool to manage reclaimed water in an efficient and sustainable way.

Author Contributions

Conceptualization, J.A.R.D. and E.C.P.; methodology, C.A.Z., I.F.G., R.G.P. and J.A.R.D.; investigation, C.A.Z., J.A.R.D. and E.C.P.; resources, J.A.R.D. and E.C.P.; data curation, J.A.R.D. and E.C.P.; writing—original draft preparation, C.A.Z.; writing—review and editing, C.A.Z., I.F.G., R.G.P., J.A.R.D. and E.C.P.; visualization, C.A.Z.; supervision, J.A.R.D. and I.F.G.; project administration, J.A.R.D. and E.C.P.; funding acquisition, J.A.R.D. and E.C.P.

Funding

This work is part of the REUTIVAR (Modelo Sostenible del Olivar Mediante el Uso Aguas Regeneradas) project, co-funded by the Regional Government of Andalusia and the European Union through EARF 2014–2020.

Conflicts of Interest

The authors declare no conflict of interest.

References

  1. FAO. The Future of Food and Agriculture: Trends and Challenges; FAO: Rome, Italy, 2017; ISBN 9789251095515. [Google Scholar]
  2. Beniston, M.; Stephenson, D.B.; Christensen, O.B.; Ferro, C.A.T.; Frei, C.; Goyette, S.; Halsnaes, K.; Holt, T.; Jylhä, K.; Koffi, B.; et al. Future extreme events in European climate: An exploration of regional climate model projections. Clim. Chang. 2007, 81, 71–95. [Google Scholar] [CrossRef] [Green Version]
  3. Bisselink, B.; Bernhard, J.; Gelati, E.; Adamovic, M.; Guenther, S.; Mentaschi, L.; De Roo, A. Impact of a Changing Climate, Land Use, and Water Usage on Europe’s Water Resources: A Model Simulation Study; Publications Office of the European Union: Brussels, Belgium, 2018; ISBN 9789279802874. [Google Scholar]
  4. Maddock, A.; Samuel Young, R.; Reig, P. Ranking the World’s Most Water-Stressed Countries in 2040; World Resources Institute: Washington, DC, USA, 2015. [Google Scholar]
  5. CHG. Confederación Hidrográfica del Guadalquivir (Spanish Government) Plan Hidrológico de la Demarcación Hidrográfica del Guadalquivir; Ciclo de Planificación Hidrológica 2015–2021; Ministerio de Agricultura, Alimentación y Medio Ambiente: Madrid, Spain, 2016; pp. 2015–2021.
  6. González Perea, R.; Fernández García, I.; Martin Arroyo, M.; Rodríguez Díaz, J.A.; Camacho Poyato, E.; Montesinos, P. Multiplatform application for precision irrigation scheduling in strawberries. Agric. Water Manag. 2017, 183, 194–201. [Google Scholar] [CrossRef]
  7. Bueno-Delgado, M.V.; Molina-Martínez, J.M.; Correoso-Campillo, R.; Pavón-Mariño, P. Ecofert: An Android application for the optimization of fertilizer cost in fertigation. Comput. Electron. Agric. 2016, 121, 32–42. [Google Scholar] [CrossRef]
  8. Pagán, F.J.; Ferrández-Villena, M.; Fernández-Pacheco, D.G.; Rosillo, J.J.; Molina-Martínez, J.M. Optifer: An application to optimize fertiliser costs in fertigation. Agric. Water Manag. 2015, 151, 19–29. [Google Scholar] [CrossRef]
  9. Pérez-Castro, A.; Sánchez-Molina, J.A.; Castilla, M.; Sánchez-Moreno, J.; Moreno-Úbeda, J.C.; Magán, J.J. cFertigUAL: A fertigation management app for greenhouse vegetable crops. Agric. Water Manag. 2017, 183, 186–193. [Google Scholar] [CrossRef]
  10. Institute for Agricultural and Fisheries Research and Training (IFAPA) SERVIFAPA—Programación del Riego y la Fertilización del Olivar. Available online: https://www.juntadeandalucia.es/agriculturaypesca/ifapa/servifapa/recomendador-olivar/ (accessed on 11 October 2019).
  11. ISO 20670:2018, Water Reuse—Vocabulary. Available online: https://www.iso.org/obp/ui/#iso:std:iso:20670:ed-1:v1:en (accessed on 15 April 2019).
  12. Arizona Department of Environmental Quality Glosary of Environmental Terms. Available online: https://legacy.azdeq.gov/function/help/glossary.html (accessed on 15 April 2019).
  13. Raschid-sally, L.; Jayakody, P. Drivers and Characteristics of Wastewater Agriculture in Developing Countries: Results From a Global Assessment; IWMI: Colombo, Sri Lanka, 2009; ISBN 9789290906988. [Google Scholar]
  14. Chen, W.; Lu, S.; Jiao, W.; Wang, M.; Chang, A.C. Reclaimed water: A safe irrigation water source? Environ. Dev. 2013, 8, 74–83. [Google Scholar] [CrossRef]
  15. Ródenas, M.A.; Albacete, M. The River Segura: Reclaimed water, recovered river. J. Water Reuse Desalin. 2014, 4, 50–57. [Google Scholar] [CrossRef] [Green Version]
  16. Pedrero, F.; Alarcón, J.J.; Nicolás, E.; Intriago, J.C.; Kujawa-Roeleveld, K.; Camposeo, S.; Vivaldi, G.A. Multidisciplinary Approach on Reclaimed Water Use Projects in Agriculture. In Proceedings of the III Jornada Agua y Sostenibilidad: La Reutilización de Aguas en España y Europa. Pasado, Presente y Futuro, Murcia, Spain, 15 December 2016; pp. 1–13. [Google Scholar]
  17. Maestre-Valero, J.F.; González-Ortega, M.J.; Martínez-Álvarez, V.; Martin-Gorriz, B. The role of reclaimed water for crop irrigation in southeast Spain. Water Supply 2019, 19, 1555–1562. [Google Scholar] [CrossRef]
  18. Petousi, I.; Fountoulakis, M.S.; Saru, M.L.; Nikolaidis, N.; Fletcher, L.; Stentiford, E.I.; Manios, T. Effects of reclaimed wastewater irrigation on olive (Olea europaea L. cv. ’Koroneiki’) trees. Agric. Water Manag. 2015, 160, 33–40. [Google Scholar] [CrossRef]
  19. Segal, E.; Dag, A.; Ben-Gal, A.; Zipori, I.; Erel, R.; Suryano, S.; Yermiyahu, U. Olive orchard irrigation with reclaimed wastewater: Agronomic and environmental considerations. Agric. Ecosyst. Environ. 2011, 140, 454–461. [Google Scholar] [CrossRef]
  20. Ayoub, S.; Al-Shdiefat, S.; Rawashdeh, H.; Bashabsheh, I. Utilization of reclaimed wastewater for olive irrigation: Effect on soil properties, tree growth, yield and oil content. Agric. Water Manag. 2016, 176, 163–169. [Google Scholar] [CrossRef]
  21. Bedbabis, S.; Ferrara, G.; Ben Rouina, B.; Boukhris, M. Effects of irrigation with treated wastewater on olive tree growth, yield and leaf mineral elements at short term. Sci. Hortic. (Amst.) 2010, 126, 345–350. [Google Scholar] [CrossRef]
  22. Bourazanis, G.; Roussos, P.A.; Argyrokastritis, I.; Kosmas, C.; Kerkides, P. Evaluation of the use of treated municipal waste water on the yield, oil quality, free fatty acids’ profile and nutrient levels in olive trees cv Koroneiki, in Greece. Agric. Water Manag. 2016, 163, 1–8. [Google Scholar] [CrossRef]
  23. Erel, R.; Eppel, A.; Yermiyahu, U.; Ben-Gal, A.; Levy, G.; Zipori, I.; Schaumann, G.E.; Mayer, O.; Dag, A. Long-term irrigation with reclaimed wastewater: Implications on nutrient management, soil chemistry and olive (Olea europaea L.) performance. Agric. Water Manag. 2019, 213, 324–335. [Google Scholar] [CrossRef]
  24. Trinh, L.T.; Vu, G.N.H.; Van Der Steen, P.; Lens, P.N.L. Climate Change Adaptation Indicators to Assess Wastewater Management and Reuse Options in the Mekong Delta, Vietnam. Water Resour. Manag. 2013, 27, 1175–1191. [Google Scholar] [CrossRef]
  25. Pratap, R. Getting Started with Matlab. A Quick Introduction for Scientist and Engineers, 7th ed.; Oxford University Press: Oxford, UK, 2017. [Google Scholar]
  26. Schaap, M.G. ROSETTA model. J. Hydrol. 1999, 251, 1–4. [Google Scholar]
  27. Junta de Andalucía Estaciones Agroclimáticas de Andalucía. Available online: https://www.juntadeandalucia.es/agriculturaypesca/ifapa/ria/servlet/FrontController (accessed on 1 July 2019).
  28. Allen, R.G. FAO Irrigation and Drainage Paper Crop by. Irrig. Drain. 1998, 300, 300. [Google Scholar]
  29. Agencia Estatal de Meteorología (AEMET) AEMET OpenData. Available online: https://opendata.aemet.es/centrodedescargas/inicio (accessed on 1 May 2019).
  30. Pelmorex Corp Pelmorex Corp Weather. Available online: https://www.pelmorex.com/en/weather/ (accessed on 7 June 2019).
  31. Smith, M. Cropwat: A computer Program for Irrigation Planning and Management; FAO Land and Water Development Division: Rome, Italy, 1992. [Google Scholar]
  32. Doorenbos, J.; Pruit, W.O. Guidelines for predicting crop water requirements. FAO Irrig. Drain. 1977, 24, 15–20. [Google Scholar]
  33. Orgaz, F.; Fereres, E. El Riego. In El Cultivo del Olivo; Junta de Andalucía, Ediciones Mundi-Prensa, Eds.; Ediciones Mundi-Prensa: Madrid, Spain, 2001; pp. 285–306. [Google Scholar]
  34. Fereres, E.; Pruitt, W.O.; Beutel, J.A.; Henderson, D.W.; Holzapfel, E.; Shulbach, H.; Uriu, K. ET and drip irrigation scheduling. In Drip Irrigation Management; University of California. Div. of Agric. Sci. No. 21259; University of California: Oakland, CA, USA, 1981; pp. 8–13. [Google Scholar]
  35. Padilla-Díaz, C.M.; Rodriguez-Dominguez, C.M.; Hernandez-Santana, V.; Perez-Martin, A.; Fernández, J.E. Scheduling regulated deficit irrigation in a hedgerow olive orchard from leaf turgor pressure related measurements. Agric. Water Manag. 2016, 164, 28–37. [Google Scholar] [CrossRef] [Green Version]
  36. Rallo, L.; Cuevas, J. Fructificación y producción. In El Cultivo del Olivo; Junta de Andalucía, Ediciones Mundi-Prensa, Eds.; Ediciones Mundi-Prensa: Madrid, Spain, 2017; pp. 145–186. [Google Scholar]
  37. Orgaz, F.; Fereres, E.; Testi, L. El Riego. In El Cultivo del Olivo; Junta de Andalucía, Ediciones Mundi-Prensa, Eds.; Ediciones Mundi-Prensa: Madrid, Spain, 2017; pp. 461–490. [Google Scholar]
  38. Fernández-Escobar, R. Fertilización. In El Cultivo del Olivo; Junta de Andalucía, Ediciones Mundi-Prensa, Eds.; Ediciones Mundi-Prensa: Madrid, Spain, 2017; pp. 419–460. [Google Scholar]
  39. Fernández-Escobar, R.; Parra, M.A.; Navarro, C.; Arquero, O. Foliar diagnosis as a guide to olive fertilization. Span. J. Agric. Res. 2009, 7, 212–223. [Google Scholar] [CrossRef] [Green Version]
  40. Fernández-Escobar, R. Trends in olive nutrition. Acta Hortic. 2018, 1199, 215–223. [Google Scholar] [CrossRef]
  41. García García, C. Abonado del olivar. In Guía Práctica de la Fertilización Racional de Los Cultivos en España. Parte II. Abonado de Los Principales Cultivos en España; Ministerio de Medio Ambiente y Medio Rural y Marino: Madrid, Spain, 2009. [Google Scholar]
  42. The MathWorks, Inc. Mathworks App Designer. In MATLAB App Building; The MathWorks, Inc.: Natick, MA, USA, 2019. [Google Scholar]
  43. Parra, M.A. Suelo. In El Cultivo del Olivo; Junta de Andalucía, Ediciones Mundi-Prensa, Eds.; Ediciones Mundi-Prensa: Madrid, Spain, 2017; pp. 251–287. [Google Scholar]
  44. Molina-Soria, C.; Fernández-Escobar, R. A Proposal of New Critical Leaf Nitrogen Concentrations in Olive. Acta Hortic. 2012, 949, 283–286. [Google Scholar] [CrossRef]
  45. Fernández-Escobar, R.; Navarro, S.; Melgar, J.C. Effect of Nitrogen Status on Frost Tolerance of Olive Trees. Acta Hortic. 2010, 924, 41–45. [Google Scholar] [CrossRef]
  46. Fernández-Escobar, R.; Marin, L.; Sánchez-Zamora, M.A.; García-Novelo, J.M.; Molina-Soria, C.; Parra, M.A. Long-term effects of N fertilization on cropping and growth of olive trees and on N accumulation in soil profile. Eur. J. Agron. 2009, 31, 223–232. [Google Scholar] [CrossRef]
  47. Fernández-Escobar, R.; Antonaya-Baena, M.F.; Sánchez-Zamora, M.A.; Molina-Soria, C. The amount of nitrogen applied and nutritional status of olive plants affect nitrogen uptake efficiency. Sci. Hortic. (Amst.). 2014, 167, 1–4. [Google Scholar] [CrossRef]
  48. García, J.M.; Cuevas, M.V.; Fernández, J.E. Production and oil quality in ‘Arbequina’ olive (Olea europaea, L.) trees under two deficit irrigation strategies. Irrig. Sci. 2013, 31, 359–370. [Google Scholar] [CrossRef]
  49. García-Novelo, J.M. El Balance de Nitrógeno en el Olivar; Universidad de Córdoba: Montería, Colombia, 2006. [Google Scholar]
Figure 1. REUTIVAR Flow chart.
Water 11 02632 g001
Figure 2. Fertilization flowchart decision tree.
Water 11 02632 g002
Figure 3. (a) Seasonal distribution of daily effective precipitation for the 2019 irrigation season. (b) Seasonal distribution of daily soil water content and irrigation scheduling in the actual management (AM) and actual management scenario considering a hypothetical olive nutrient deficiency (AM-ND) scenarios. (c) Seasonal distribution of daily soil water content and irrigation scheduling in the optimal water and fertilization management (OWAF) scenario. (d) Seasonal distribution of soil water content and irrigation scheduling in the optimal water, fertilization, and electricity cost management (OWAFE) and the optimal water, fertilization, and electricity cost management scenario considering hypothetical olive nutrient deficiency (OWAFE-ND) scenarios.
Water 11 02632 g003aWater 11 02632 g003b
Figure 4. Graphical interface of the REUTIVAR model for fertigation schedule recommendations from 3 October 2019 to 9 October 2019. (a) Required data to run the precision fertigation model, (b) Irrigation and figure recommendations of the model.
Water 11 02632 g004aWater 11 02632 g004b
Table 1. Olive crop coefficient (kc) in Córdoba (Spain).
JanFebMarAprMayJunJulAugSeptOctNovDec
0.650.650.650.600.550.550.500.500.550.550.600.65
Table 2. Interpretation of nutrient content level of olive leaves taken in July, expressed as dry matter percentage according to Reference [40].
Element (%)DeficientAdequateToxic
Nitrogen (N)1.201.30–1.70>1.70
Phosphorus (P)0.050.10–0.30-
Potassium (K)0.40>0.80-
Table 3. Monthly distribution of nutrient applications on fertigation (%).
MonthNP2O5K2O
April544
May282517
June282517
July252331
August142331
Table 4. Soil analyses undertaken in September 2018 in the case study farm.
Name SampleDepth (cm)TextureP (mg/kg)K (mg/kg)
Clay (%)Silt (%)Sand (%)
U1P10–1537.826.835.414.1563
U1P215–3038.128.033.97.7454
U2P10–1534.123.542.49.9454
U2P215–3037.420.042.65.8317
B1P10–1537.228.234.623.6872
B1P215–3034.628.936.525.7794
B2P10–1532.423.743.922.8978
B2P215–3036.321.342.427.0598
Table 5. Olive foliar analyses conducted in July 2018 and 2019 in the studied areas (values expressed as dry matter percentage).
Element (%)‘Hojiblanca’‘Nevadillo azul’
2018201920182019
N2.021.801.351.81
P0.110.110.130.14
K0.920.820.880.84
Table 6. Water nutrient analysis undertaken in the case study farm during the 2019 irrigation season.
DateN-NH4 (mg/L)N-NO3 (mg/L)P-PO4 (mg/L)K (mg/L)
21 August 20181.01.51.7-
25 September 20181.51.31.2-
23 May 201910.71.80.5-
13 June 201913.01.90.4-
29 June 201912.21.70.232
9 August 20192.320.2-
9 September 20193.310.2-
Table 7. N, P, and K applications through water and fertilizers for AM, AM-ND, OWAF, OWAFE, and OWAFE-ND scenarios.
ScenarioAM/AM-NDOWAFOWAFEOWAFE-ND
NutrientNPKNPKNPKNPK
Applied with water (kg/ha)15.80.55218.30.548.015.50.448.015.50.448.0
Applied with fertilizer (kg/ha)9.92.710.200000059.973.7108.0
TOTAL25.63.262.218.30.548.015.50.448.075.074.1156.0

