Role and Impact of Hydrograph Shape on Tidal Current-Induced Scour in Physical-Modelling Environments
by
 , and
, and
Alexander Schendel
1,*, 
Mario Welzel
2,
Arndt Hildebrandt
1,
Torsten Schlurmann
1 and
Tai-Wen Hsu
3
1
Ludwig-Franzius-Institute for Hydraulic, Estuarine and Coastal Engineering, Leibniz Universität Hannover, 30167 Hannover, Germany
2
Leichtweiß-Institute for Hydraulic Engineering and Water Resources, Technische Universität Braunschweig, 38106 Braunschweig, Germany
3
Department of Harbor and River Engineering, National Taiwan Ocean University, 2 Pei–Ning Road, Keelung 20224, Taiwan
*
Author to whom correspondence should be addressed.
Water 2019, 11(12), 2636; https://doi.org/10.3390/w11122636
Submission received: 14 November 2019
/
Revised: 10 December 2019
/
Accepted: 11 December 2019
/
Published: 13 December 2019
(This article belongs to the Section Hydraulics and Hydrodynamics)
Abstract
:For physical model tests, the time-varying characteristics of tidal currents are often simplified by a hydrograph following a shape of a unidirectional current or by resolving the tidal velocity signal into discrete steps of constant flow velocity. The influence of this generalization of the hydrograph’s shape on the scouring process in tidal currents has not yet been investigated systematically, further increasing the uncertainty in the prediction of scour depth and rate. Therefore, hydraulic model tests were carried out to investigate and quantify the influence of the hydrograph shape on the scouring processes under tidal currents. Several different hydrographs including those with continuously changing velocities, constant unidirectional currents, square-tide velocities and stepped velocity time series were analyzed. Results show that the scouring process in tidal currents is characterized by concurrent sediment backfilling and displacement which can only be reproduced by hydrographs that incorporate a varying flow direction. However, if only a correct representation of final scour depths is of interest, similar scour depths as in tidal currents might be achieved by a constant, unidirectional current, provided that a suitable flow velocity is selected. The effective flow work approach was found capable to identify such suitable hydraulic loads with reasonable practical accuracy.
1. Introduction and Motivation
The reliable prediction of scour depth is of crucial interest for the economic and secure design of structures in coastal and marine waters. Its importance for the structural design and lifetime management is reflected by the considerable amount of studies dealing with the emergence and characteristics of scour around foundation structures. However, unresolved questions remain regarding the process of scouring induced by complex flow conditions that prevail in offshore or estuarine situations, such as time-varying, asymmetrical and directional tidal currents or the influence of additional vorticity introduced by wind-induced sheared current. The lack of studies on this subject may partly be attributed to the elaborate set-up and procedure of physical models as well as numerical simulations required to deal with such complex flow conditions. Either due to the lack of sophisticated laboratory facilities or due to the often profound inconsistencies of results coming from laboratory tests, complex flow situations are still seldomly taken into account for the prediction of scour development around offshore structures, despite the fact that they depict important aspects of offshore sea states. On the other hand, the influence of time-varying but unidirectional flows on the scour development around bridge piers has been addressed in several studies, most of which focused on the detrimental effects of flood events for design purposes.
Kothyari et al. [1] studied the temporal variation of scour depth around a bridge pier during unsteady clear-water flows in uniform, non-uniform and stratified sediments. The unsteady flow was simulated by the discretization of a flow hydrograph into different segments with steady flow. The scour development around bridge piers due to flood events was investigated by Chang et al. [2]. In their experiments, several triangular shaped hydrographs were generated and the influence of peak flow velocities and times to peak flow on the scour development was evaluated. The authors showed that the scour depth increases steadily during the rising limb of the hydrograph but changes only slightly during the recession period. Therefore, Lai et al. [3] focused on the temporal effect of the rising limb of a hydrograph on the progression of scour around a bridge pier. The authors proposed a method for estimating the maximum scour depth by applying the concept of scour evolution similarity and by considering the effective flow work done to the sediment. Hager and Unger [4] investigated the scour depth at bridge piers due to single-peaked flood waves under clear-water conditions both theoretically and experimentally. In their comprehensive study, Borghei et al. [5] presented results of scouring around a circular pier due to unsteady flow, which was characterized by multiple repetitions of triangular-shaped hydrographs. For hydrographs with identical duration and maximum discharge, it was found that the number of peaks had only a minor effect on the scouring depth. Finally, Pizarro et al. [6] and Link et al. [7] improved the concept of effective flow work for predicting the time-dependent scour process around bridge piers during unsteady flood waves by proposing a dimensionless, effective flow work based on a mathematical model.
Each of these studies [1,2,3,4,5,6,7] demonstrated that the temporal evolution of scour depth and scour rate is strongly controlled by the applied flow-velocity time series (i.e., by the hydrograph). Although these studies stem from a fluvial background, they thereby emphasize the importance of the hydrograph shape also for the temporal scour progression around structures in coastal and offshore waters.
However, as most of these studies focus on the influence of flood waves on the scouring process, potential backfilling and sediment displacement processes originating from reversing currents are not considered. Although tidal currents depict a decisive driving mechanism for scour development in marine conditions, most design criteria for offshore structures still rely on time-averaged estimates of unidirectional flow velocities. It is therefore all the more important to select suitable flow velocities that neither underestimate nor overpredict the scour development in unsteady tidal flows. Several studies have addressed the scour development due to tidal currents so far.
Zanke [8] carried out laboratory experiments in a closed-circuit flume on the scour development around a pile induced by unidirectional currents and waves. In those experiments, long waves were simulated by periodic alternating currents representing flow situations similar to tidal currents. Escarameia and May [9] conducted a laboratory study on the scour progression around differently shaped foundation structures in tidal-flow conditions. The tidal flow was represented by tidal half cycles of different duration and reversing flow direction. The flow velocity during each tidal half cycle was set to be either constant or varying in sinusoid form. Jensen et al. [10] carried out laboratory test to compare the scour development at piles due to unidirectional and tidal currents. Tidal currents were modelled by reversing the constant flow velocity of unidirectional reference tests every 30 min. McGovern et al. [11] studied the scour development for tidal currents by discretizing a tidal signal into three time steps with constant flow velocity. Porter et al. [12] conducted laboratory tests on the scour development through a complete spring-neap tidal cycle, where the simulated tidal signal was based on field measurements. The tidal signal was divided into 8-min-long velocity steps, resulting in 7–8 steps per tidal half cycle. Yao et al. [13] performed an experimental study on the scouring process in tidal currents by using a sinusoidal tidal current and a reversing current. The reversing current test was carried out after an equilibrium scour depth was initially generated by a unidirectional current. Most recently, Schendel et al. [14,15] performed experiments on the processes and evolution of scour around a monopile under tidal currents. To ensure an authentic representation of tidal currents, flow velocities were scaled from field measurements by continuously changing flow velocities and by bidirectionally reversing the flow direction. The results showed that backfilling processes affect the scour progression over time and the spatial extent of the scour hole compared to that in unidirectional flow.
Although all these studies indicate significant differences in the scour development between unidirectional and reversing currents, results stemming from bidirectional flow exposure partly contradict each other and are comparable only to a limited degree. Not only do the experimental setups and procedures differ but the tests also employ different methods to simplify tidal currents with time varying flow velocities; for example, in form of a “square tide” or by a step-wise adjustment of flow velocities. The role and the effects of these generalization techniques on the scour process has not yet been investigated systematically, further increasing the uncertainties in the prediction of scour induced by tidal currents.
In order to advance knowledge in this specific field of scour and erosion processes, systematic hydraulic model tests were carried out on the influence of the individual hydrograph characteristics on the dimensions of depth and rate of the induced scour. The tests focused on the investigation of the suitability of several generalization techniques to accurately represent the scouring rate, depth and backfilling processes under tidal currents and, thereby, to quantify associated uncertainties in prediction models based on different modelling techniques. Furthermore, differences due to the modelling technique were evaluated by an analytical model which takes the hydraulic loading into account by utilizing the dimensionless effective flow work.
The findings of this study might thus be particularly useful to (a) provide reference for the physical modelling of scour development under tidal currents in facilities which are not able to change flow direction or continuously adapt the flow velocity and (b) to improve the prediction of scour development in tidal current-dominated waters, which is often based on time and depth-averaged current velocity assumptions.
2. Experimental Setup and Methods
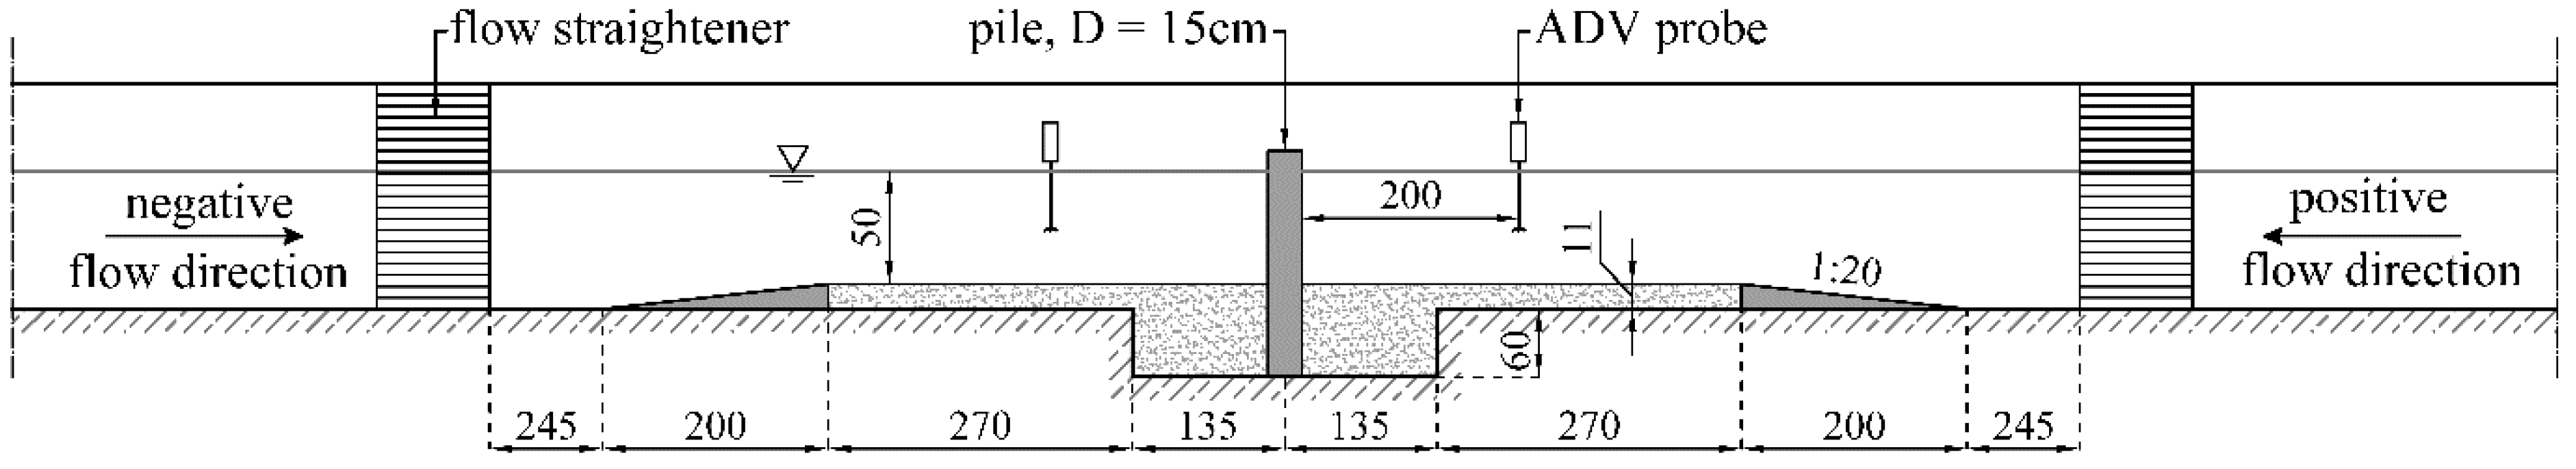
The model tests reported herein depict a supplementary series to those described in Schendel et al. [14] and Schendel et al. [15] and as such complement the previous tests by further tests on the influence of different hydrographs on the scour development in tidal currents. To allow for a proper intercomparison, the hydraulic model tests were conducted in the same facility and with a setup similar to that described in Schendel et al. [15]. As large parts of the experimental setup are identical, this chapter describes only the essential parts of the experimental setup (Figure 1 shows a schematic view of the experimental setup) and focuses on differences in test procedure and modelling of tidal currents by means of different velocity time series. More detailed information about the facility can also be found in Schendel et al. [16] and comprehensive descriptions of the experimental setup and procedure are given in Schendel et al. [14,15].
As material for the sediment bed, crystal quartz sand with a median diameter = 0.19 mm and a density of = 2.65 g/cm3 was used in all tests. The properties of the bed material are summarized in Table 1, in which is the geometric standard deviation and is the critical flow velocity of the sediment, calculated with the approach given in Melville [17]. To ensure a good compaction and to reduce entrapped air, the sand was installed in wet conditions (water level of a few millimeters on top of the profiled sand bed) and the surface was levelled prior to each test with guiding bars.
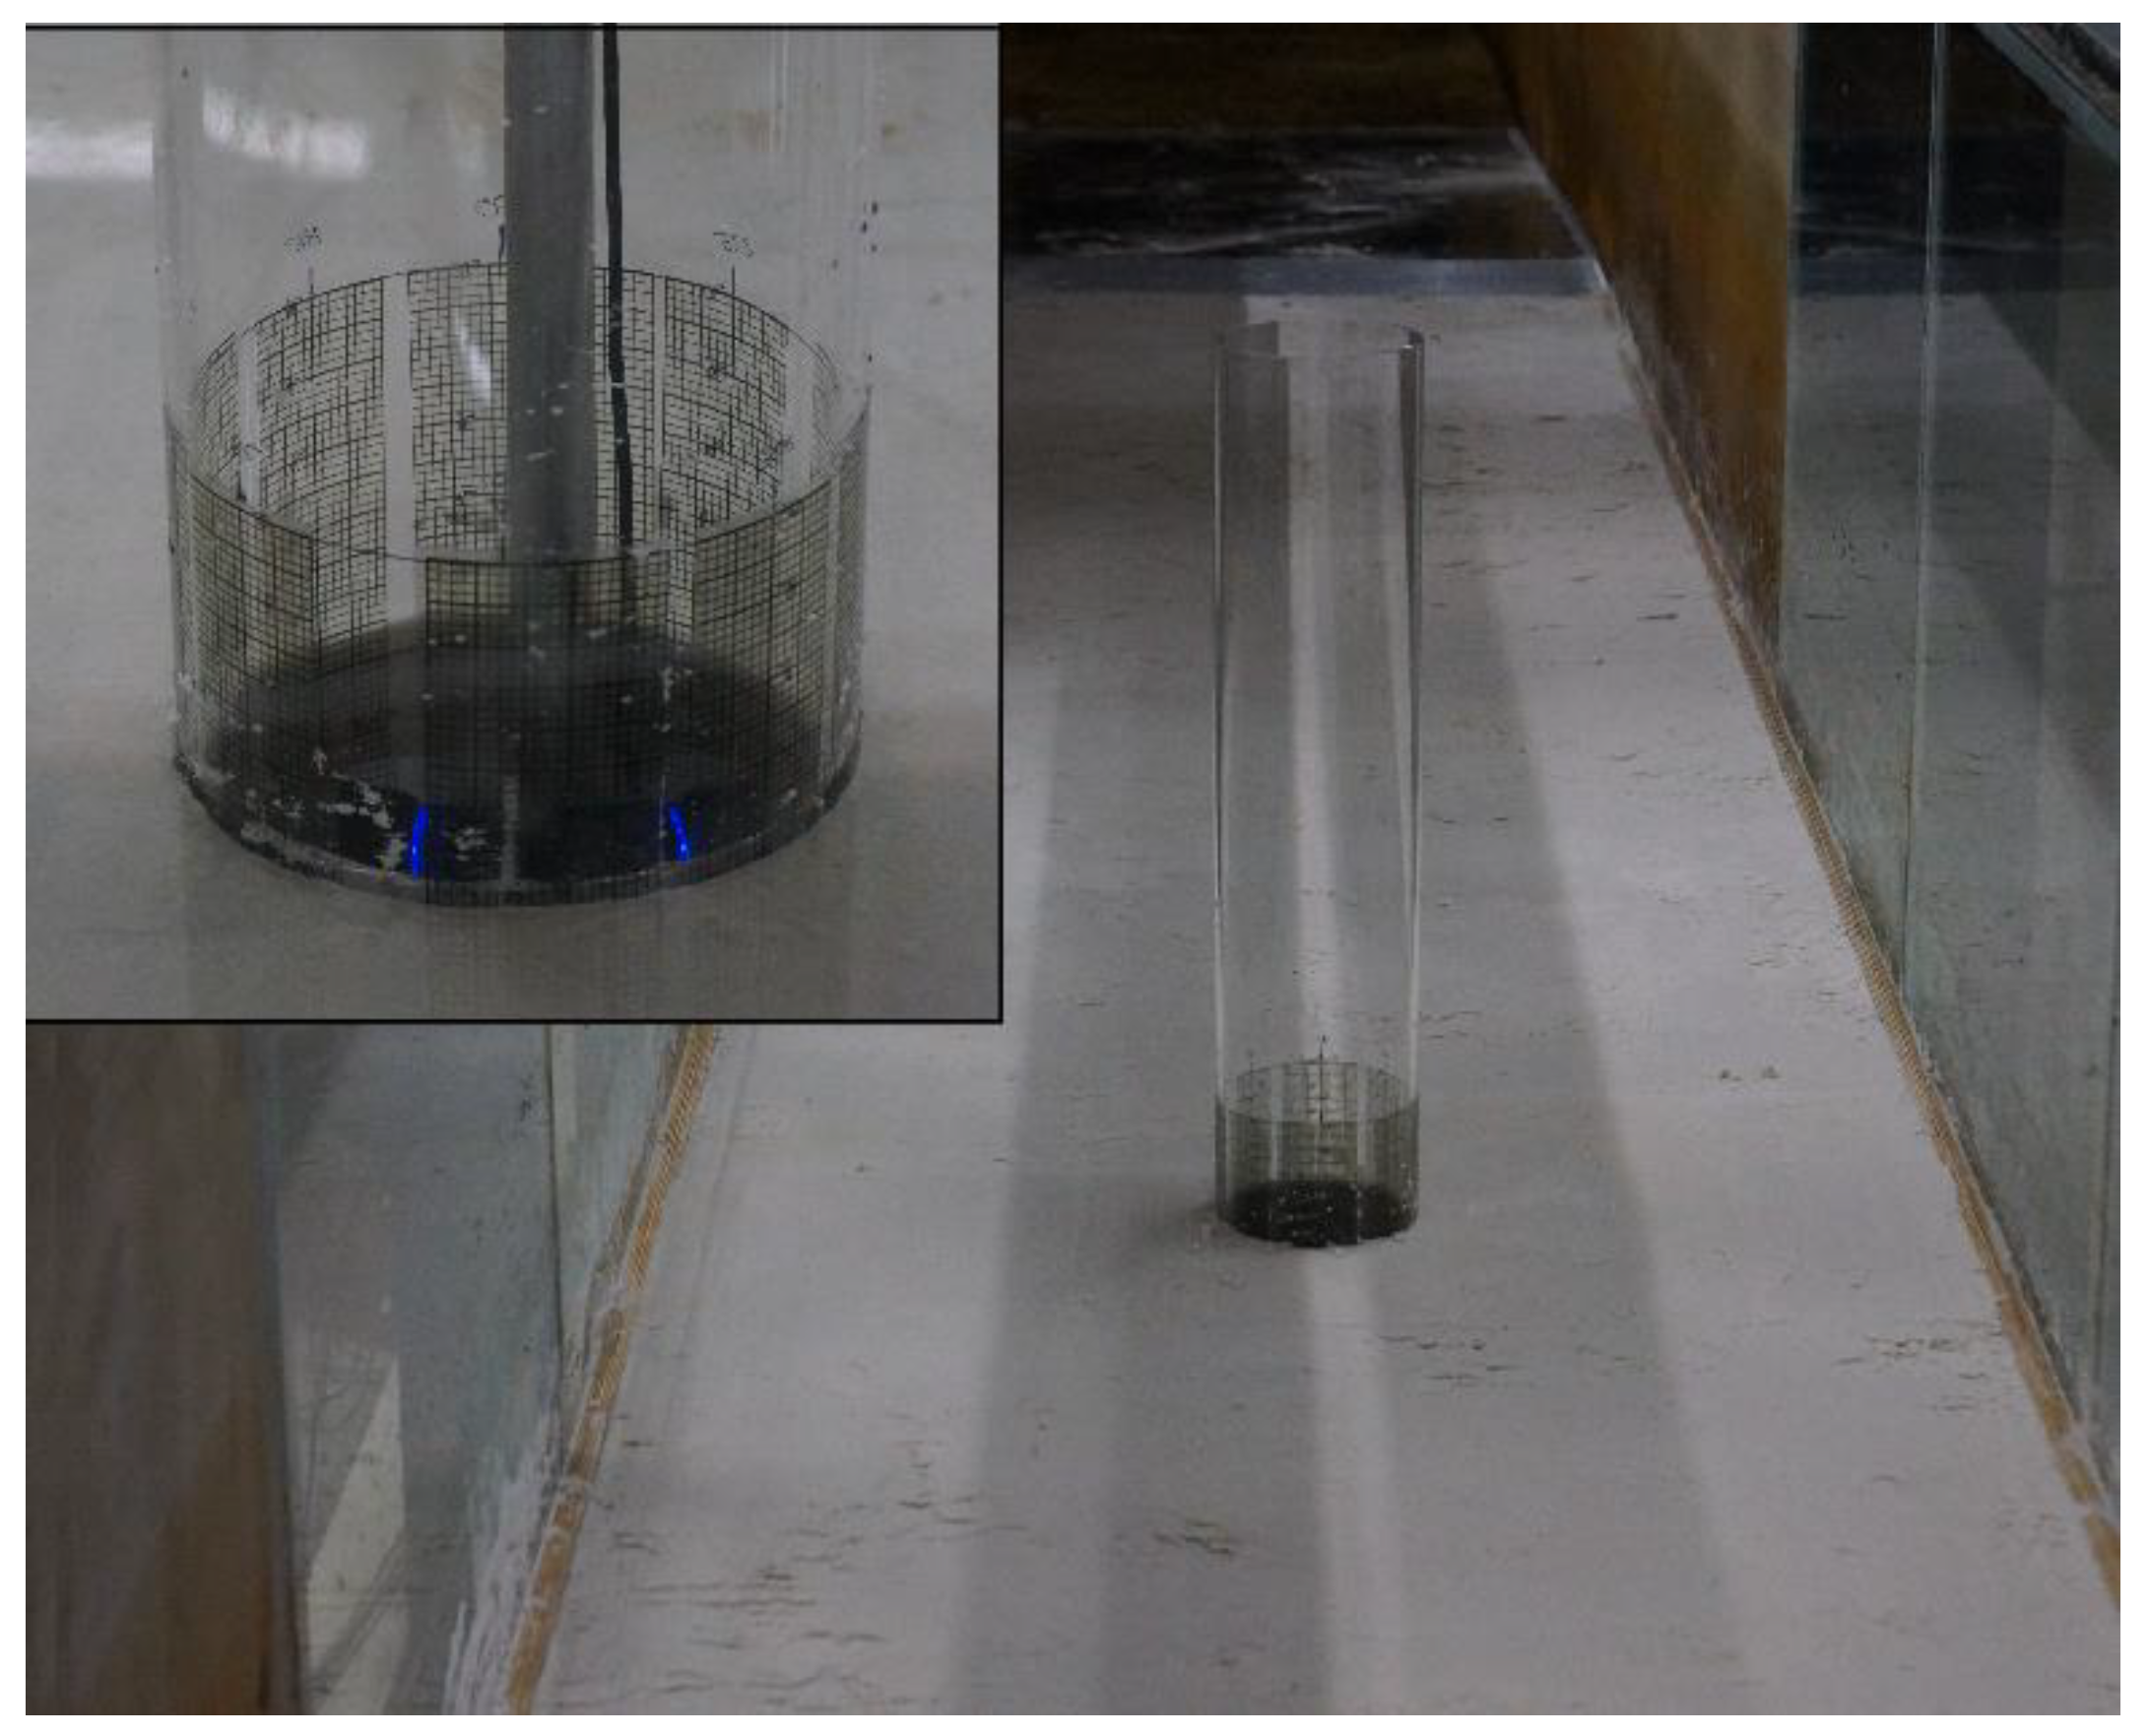
A typical monopile structure has been idealized by means of a transparent pile with circular cross-section made of acrylic glass. To mitigate blockage effects in the flow facility, an outer pile diameter of = 150 mm was selected, setting the model length scale at 1:40. The pile was positioned in the middle of the sediment bed and firmly tightened to the flume bottom. The transparent pile and its position in the sediment bed is shown in Figure 2.
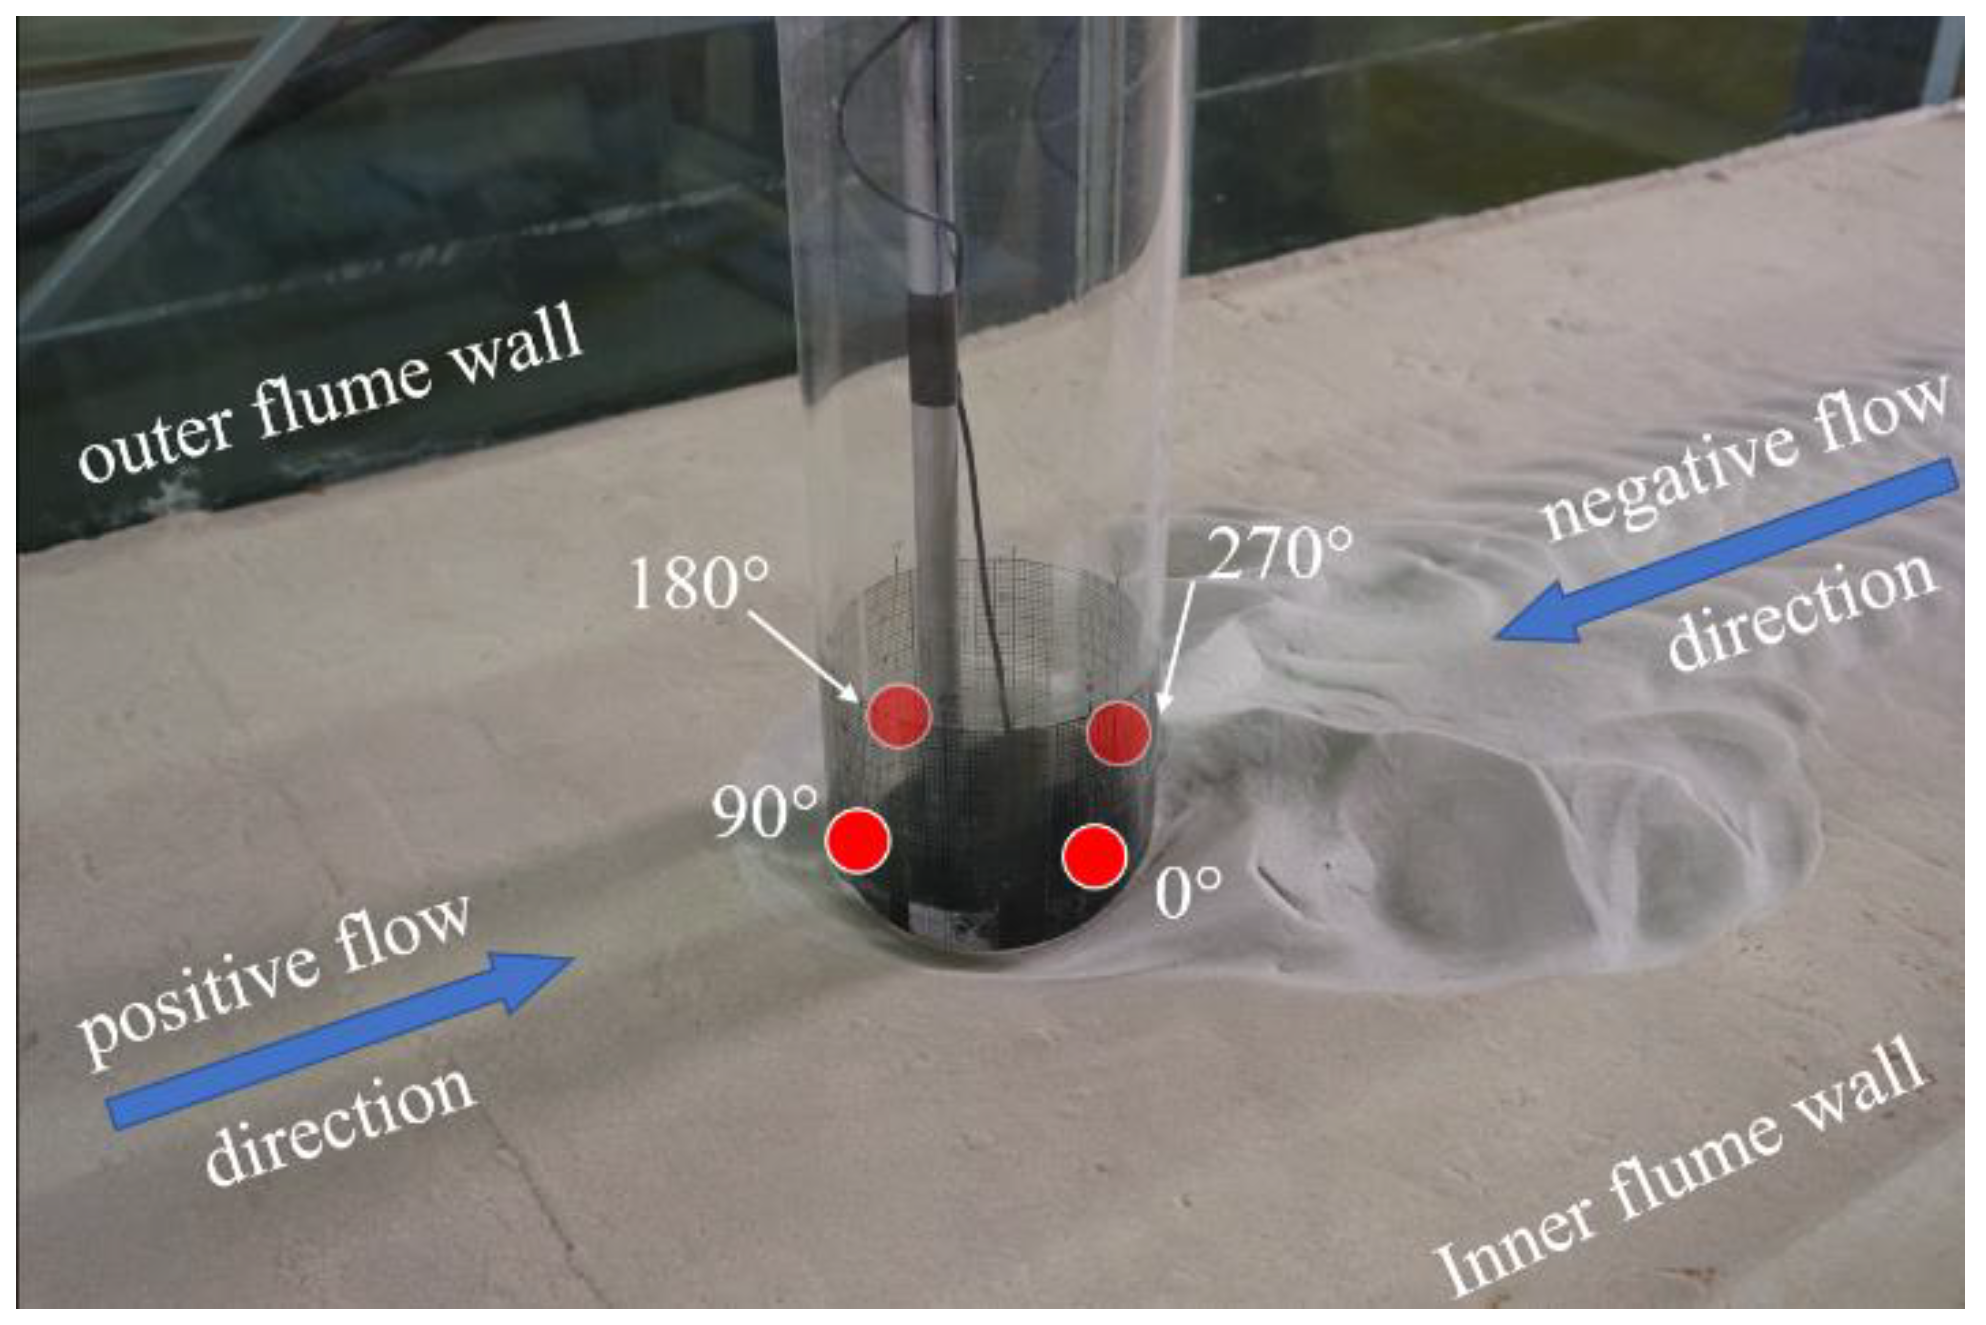
Acquisition and processing of scour data were carried out by attaching a 2.5 mm fine grid to the pile, allowing readings of scour depths in 1.25 mm intervals. The scour development was monitored by a camera placed inside the transparent pile. The camera position could be adjusted to follow the progressing scour hole on a predefined grid. Images of scour depths from the inside of the pile were recorced every 3 min. For the unidirectional baseline test (test Uni04), the interval between scour measurements was increased to 10 min after the first hour, as the scour development was not as variable as in the tests with time-varying flow conditions. Each scour measurement consisted of eight individual measurements that were successively taken in radial intervals of 45° around the piles (see Figure 3). This allowed capturing the processes of backfilling and sediment displacement during the tidal current and the accurate determination of the maximum scour depth around the pile. The maximum scour depth at a time, , was defined as the absolute maximal scour depth within the eight individual scour measurements.
Flow velocities were measured 2.0 m upstream from the pile and at half water depth by means of an Acoustic Doppler Velocimeter (ADV) probe (Vectrino II Profiler, Nortek AS, Norway) at a sample rate of 10 Hz. A distance of 2 m upstream of the pile was found to be a good compromise between the determination of a correct approach velocity and the influence of possible wake effects from the ADV. Furthermore, measurements at 10 Hz were assumed to be sufficient as no distinct turbulence measurements were intended for this study. In tests with changing flow direction, the tests were stopped after each tidal half cycle to adjust the position of the ADV probe for the reverse flow direction. The water depth was kept constant at 50 cm above the sediment bed to focus on the influence of flow direction and variable flow velocity. Potential drawbacks of a constant water level and of interrupting the tests before reversing the current direction are discussed in Schendel et al. [15] and were found to have only an insignificant influence on the sediment transport and thereby the scour development.
Generation of Tidal Hydrographs
Tidal currents are characterized by continuously and repeatedly changing flow velocities and periodically reversing flow direction with correlated changes in water levels. However, the simulation of tidal currents in physical model tests still often relies on assumptions and generalizations of the time varying aspects, e.g., by periodically reversing a constant flow velocity or by its stepwise variation [9,10,11]. To evaluate the influence of the hydrograph on the scour development over time, several different methods to simplify tidal currents were compared.
As an appropriate benchmark or time series candidate for an authentic simulation of the scouring process in tidal currents, the test Tide04 from Schendel et al. [15] was used. In Schendel et al. [15], tidal currents were scaled down from field measurement at the FINO I platform, North Sea, to consider the temporal asymmetry of a tidal current between ebb and flood. Thereby, the characteristic aspects of continuously changing flow velocities and direction of a tidal current were adopted to laboratory scales. Furthermore, test Tide04 consisted of eight consecutive tidal half cycles, which represented a 48-h long time window during a spring phase. Applying Froude’s scaling law for the selected model length of 1:40, the duration of each tidal half cycle was scaled down to approx. 60 min. The maximum peak flow velocity within test Tide04 was 0.45 m/s, so that the flow intensity transitioned from clear-water to live-bed conditions and back within each tidal half cycle. The tidal current was generated by discretizing the tidal signal into 95 s long velocity steps, i.e., one step for every given data point of the field measurements.
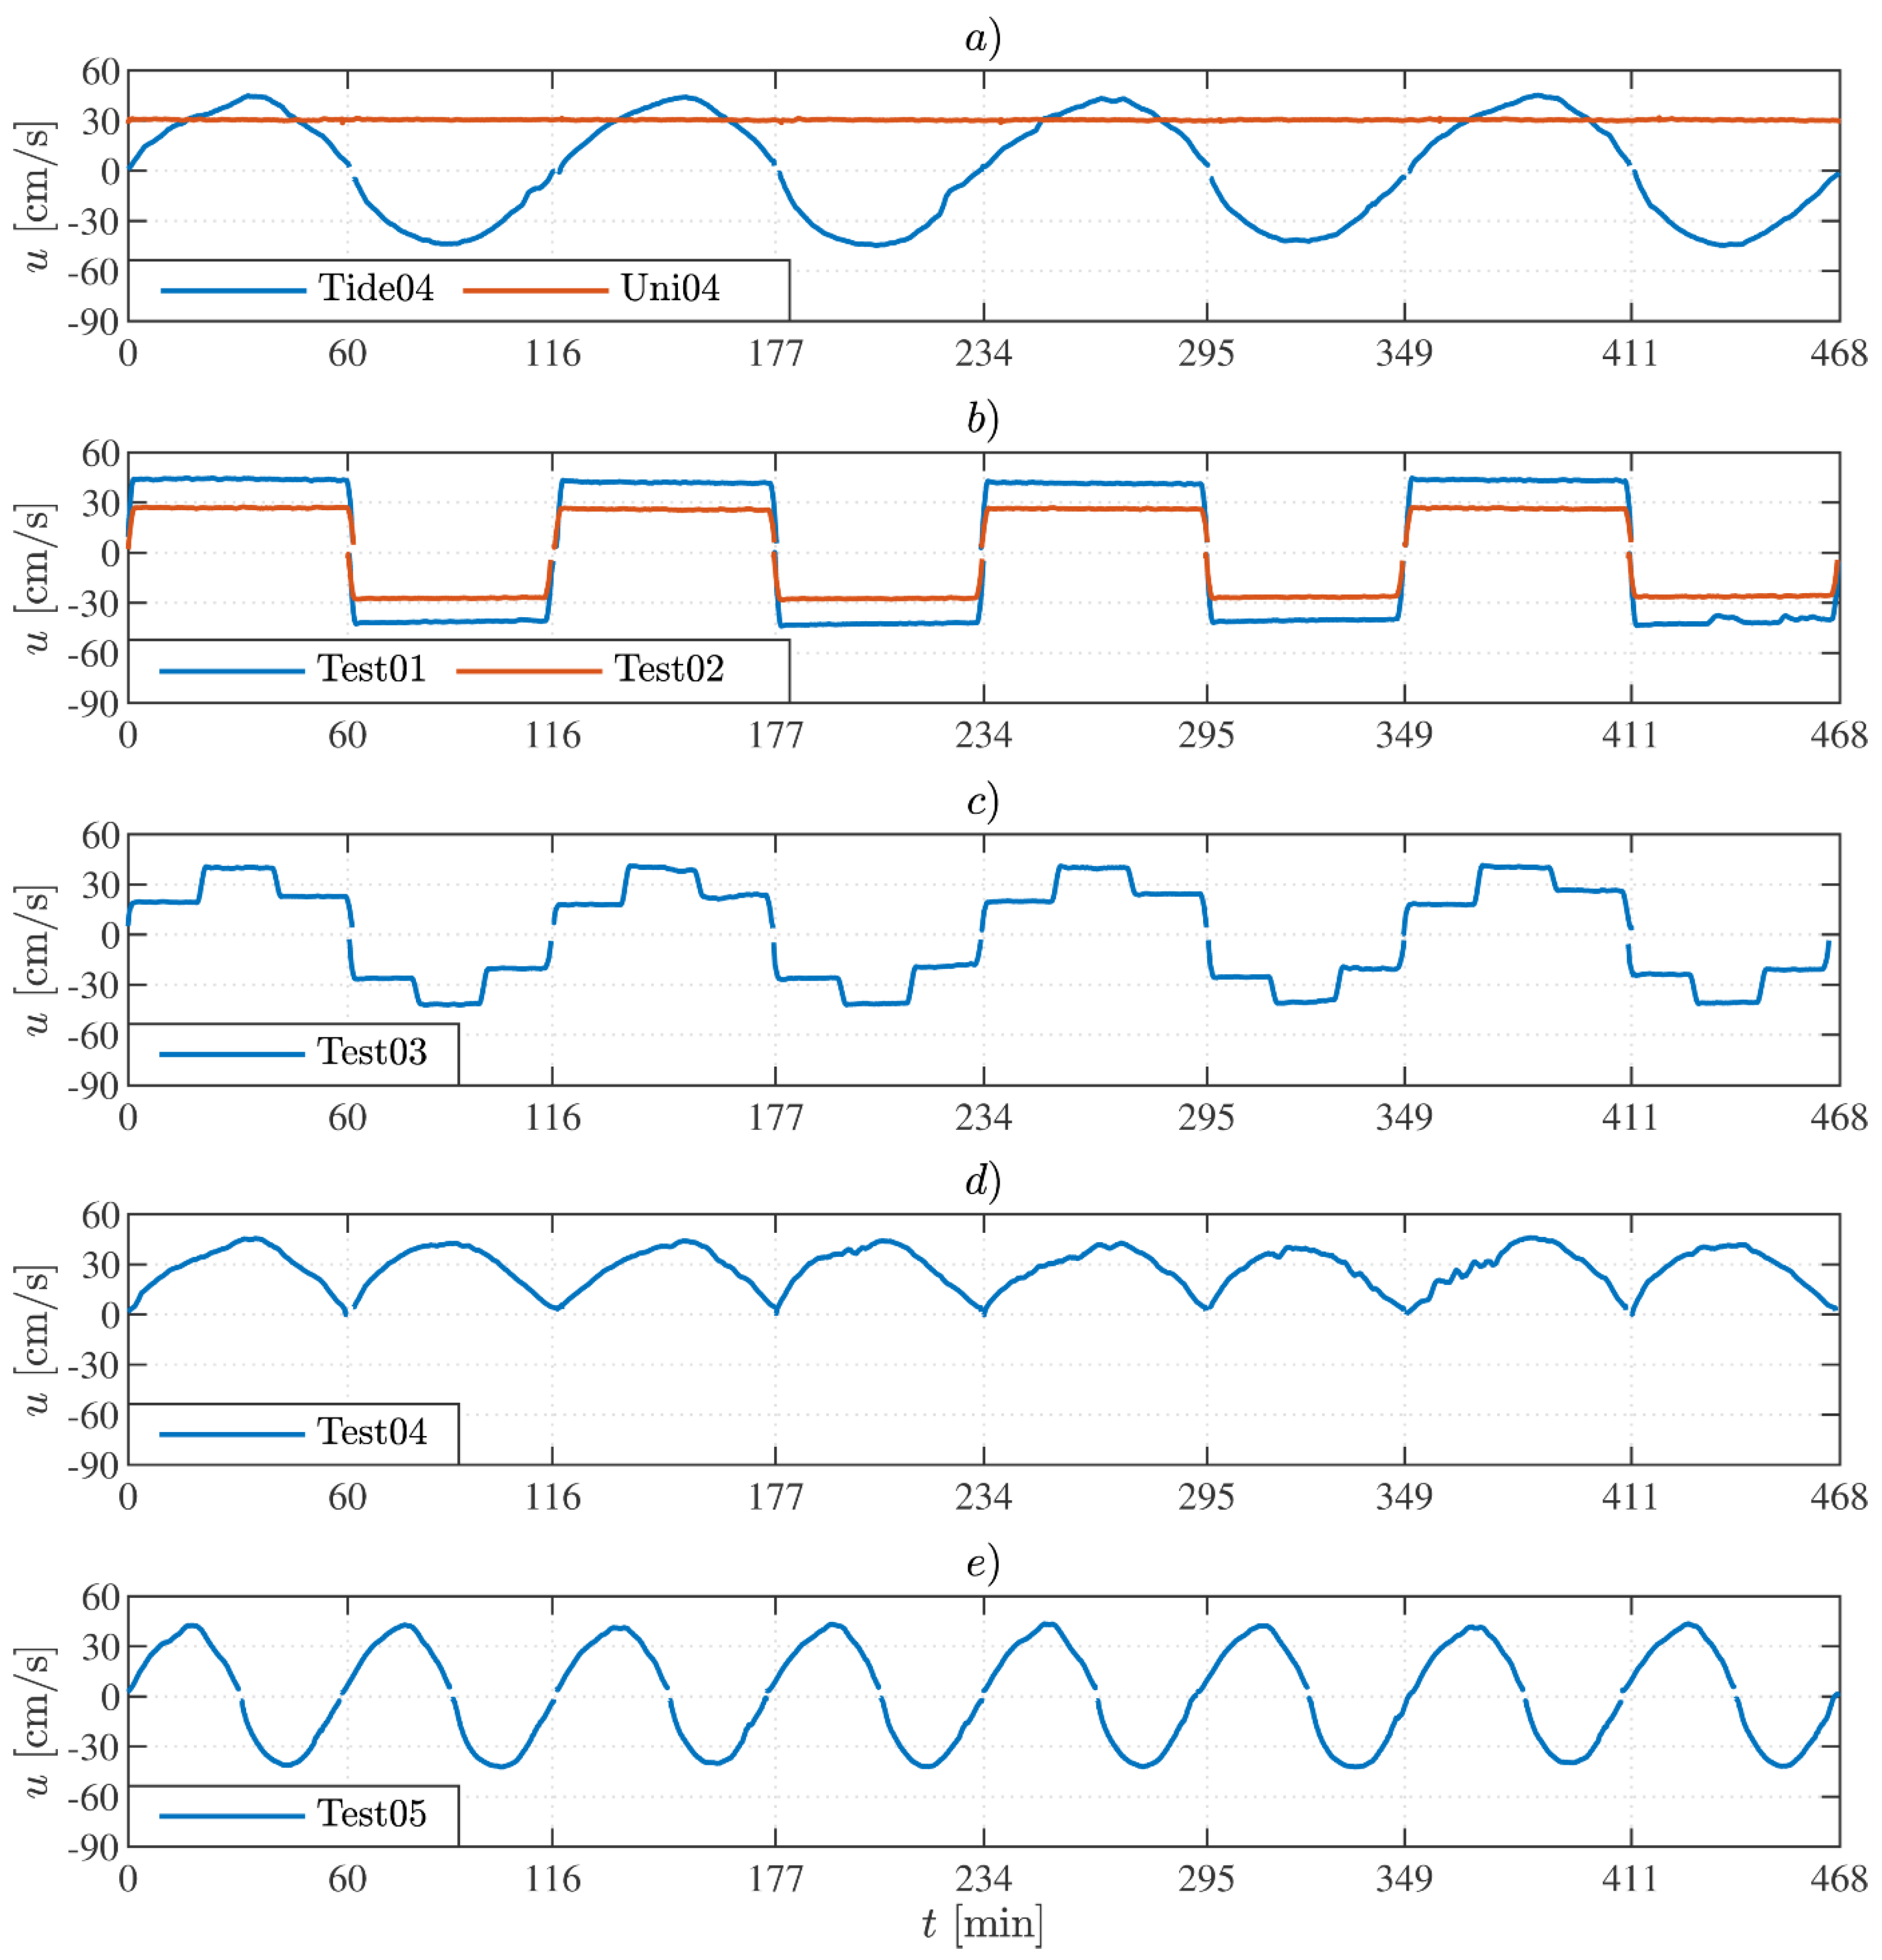
Schendel et al. [15] found that a good approximation of final scour depths in tidal currents by means of a constant flow velocity can be provided if the constant flow velocity is similar to the true root mean square (RMS) value of the tidal velocity signal. Based on this finding, and to focus on the influence of flow direction, continuity of flow velocity change and flow acceleration on the scour progression, several tests with different hydrographs but similar time averaged flow velocities were conducted. The individual hydrographs are illustrated in Figure 4 and the differences between them in terms of velocity time series and method of generation are explained in detail in the following:
- Uni04 (Figure 4a) from Schendel et al. [15]: test with a unidirectional and constant flow velocity. The comparison between tests Tide04 and Uni04 is aimed at giving valuable insights in the differences of scour development stemming from directional aspects and, thereby, assess the level of uncertainty of scour prediction approaches in which tidal currents are substituted with unidirectional currents. The constant flow velocity was based on the RMS flow velocity of test Tide04 and was calculated by:where is the mean streamwise velocity integrated over the period of a tidal half cycle and is the number of half cycles.
- Test01 and Test02 (Figure 4b): the tidal current of Tide04 was generalized by means of the most simplifying flow pattern, i.e., reversing a constant flow velocity every tidal half cycle. The constant flow velocity in each tidal half cycle was either equal to the peak (Test01) or the RMS (Test02) flow velocity of the corresponding half cycle in Tide04. The result was a “square-shaped” time series of the flow velocity similar to those applied by Jensen et al. [10], Margheritini et al. [18] or Yao et al. [13]. In addition to test Uni04, these tests were targeted towards assessing the effect of the hydrograph’s shape on the time-dependent scour progress and scour rate. While the reversal of flow direction is considered, the velocity time series of tests Test01 and Test02 differed significantly from that of Tide04. The tidal current in Tide04 was sinusoidally shaped with periods of high and low flow acceleration. On the other hand, Test01 and Test02 induced a constant hydraulic load on the sediment bed in each tidal half cycle.
- Test03 (Figure 4c): for this test, each tidal half cycle of Tide04 was resolved into only three time steps with constant flow velocity. The flow velocity for each time step was determined by taking root mean square values of the flow velocity for each third of the corresponding half cycle of test Tide04. Consequently, the duration of each time step was approx. 20 min. This method is similar to that approach of McGovern et al. [11], who also discretized tidal half cycles by three time steps of constant velocity. However, in contrast to McGovern et al. [11], none of the three velocity steps represents transitional flow conditions. Instead, the first and last velocity step depict clear-water and the middle step live-bed conditions in this study. If compared to Test01 and Test02, Test03 aims at deepening the understanding on how the scouring process and rate is controlled by the continuity of the flow field exposure induced by the depicted hydrograph.
- Test04 (Figure 4d): a velocity time series identical to that of Tide04 was produced, with the exception that the negative velocities in the ebb half cycles of the tidal signal were flipped towards the positive flow direction, i.e., mimicking a unidirectional flow with sinusoidal tidal half cycles. Thereby, a hydrograph with matching flow velocities and flow acceleration was generated but without the influence of flow direction reversal on the scour development. With the flow reversal being the only difference to Tide04, Test04 allowed a focus on the influence of flow reversal on the scour development.
- Test05 (Figure 4e): to assess the influence of half cycle duration, i.e., tidal period, on the scour development, a time series with a half cycle duration of only 30 min, instead of 60 min as in all other tests, was produced in Test05. This was achieved by reducing the duration of velocity steps from 95 s in Tide04 to 47 s in Test05. The amplitude of flow velocities remained identical, resulting in overall higher flow accelerations during a half cycle than in Tide04 with potential consequences for the boundary layer development and bed shear stresses. To allow a fair comparison of final scour depths at the end of the tests, the eight half cycles were repeated once, doubling the number of half cycle to 16 and extending the duration of Test05 to the same length as the previous tests.
Table 2 summaries the test conditions including the final scour depths at the end of each test, the time scale and the dimensionless effective flow work of which a description is given later in this paper.
3. Results and Discussion
3.1. Scouring Processes around the Pile due to Time-Varying and Reversing Flow
As described in Schendel et al. [15], the scour development during test Tide04 was affected by constantly varying sediment infilling from the edges of the scour hole and by displacement processes taking place within the scour hole. In line with the change of flow direction, sediment was transported along the side of the pile from the upstream to the downstream side during each tidal half cycle. As a consequence, an imbalance of scour depths formed around the pile, particularly pronounced between the streamwise sides of the pile. In order for the scour depth to increase above the level in the previous tidal half cycle, this imbalance of scour depths first had to be equalized. This observation resembles a decisive deviation from the sediment transport processes induced by unidirectional current, regardless of whether the flow velocities are time-varying or not. Certainly, the amount of infilling around the pile is affected by the general sediment mobility, i.e., whether live-bed or clear-water conditions are present, and by the size and frequency of ripples migrating into the scour hole. But since modelling deficiency is understood to effect the scour development in tidal and unidirectional currents to the same degree, it can be expected that the additional imbalance of scour depth due to the change in flow direction leads to slower scour rates in tidal currents compared to unidirectional currents.
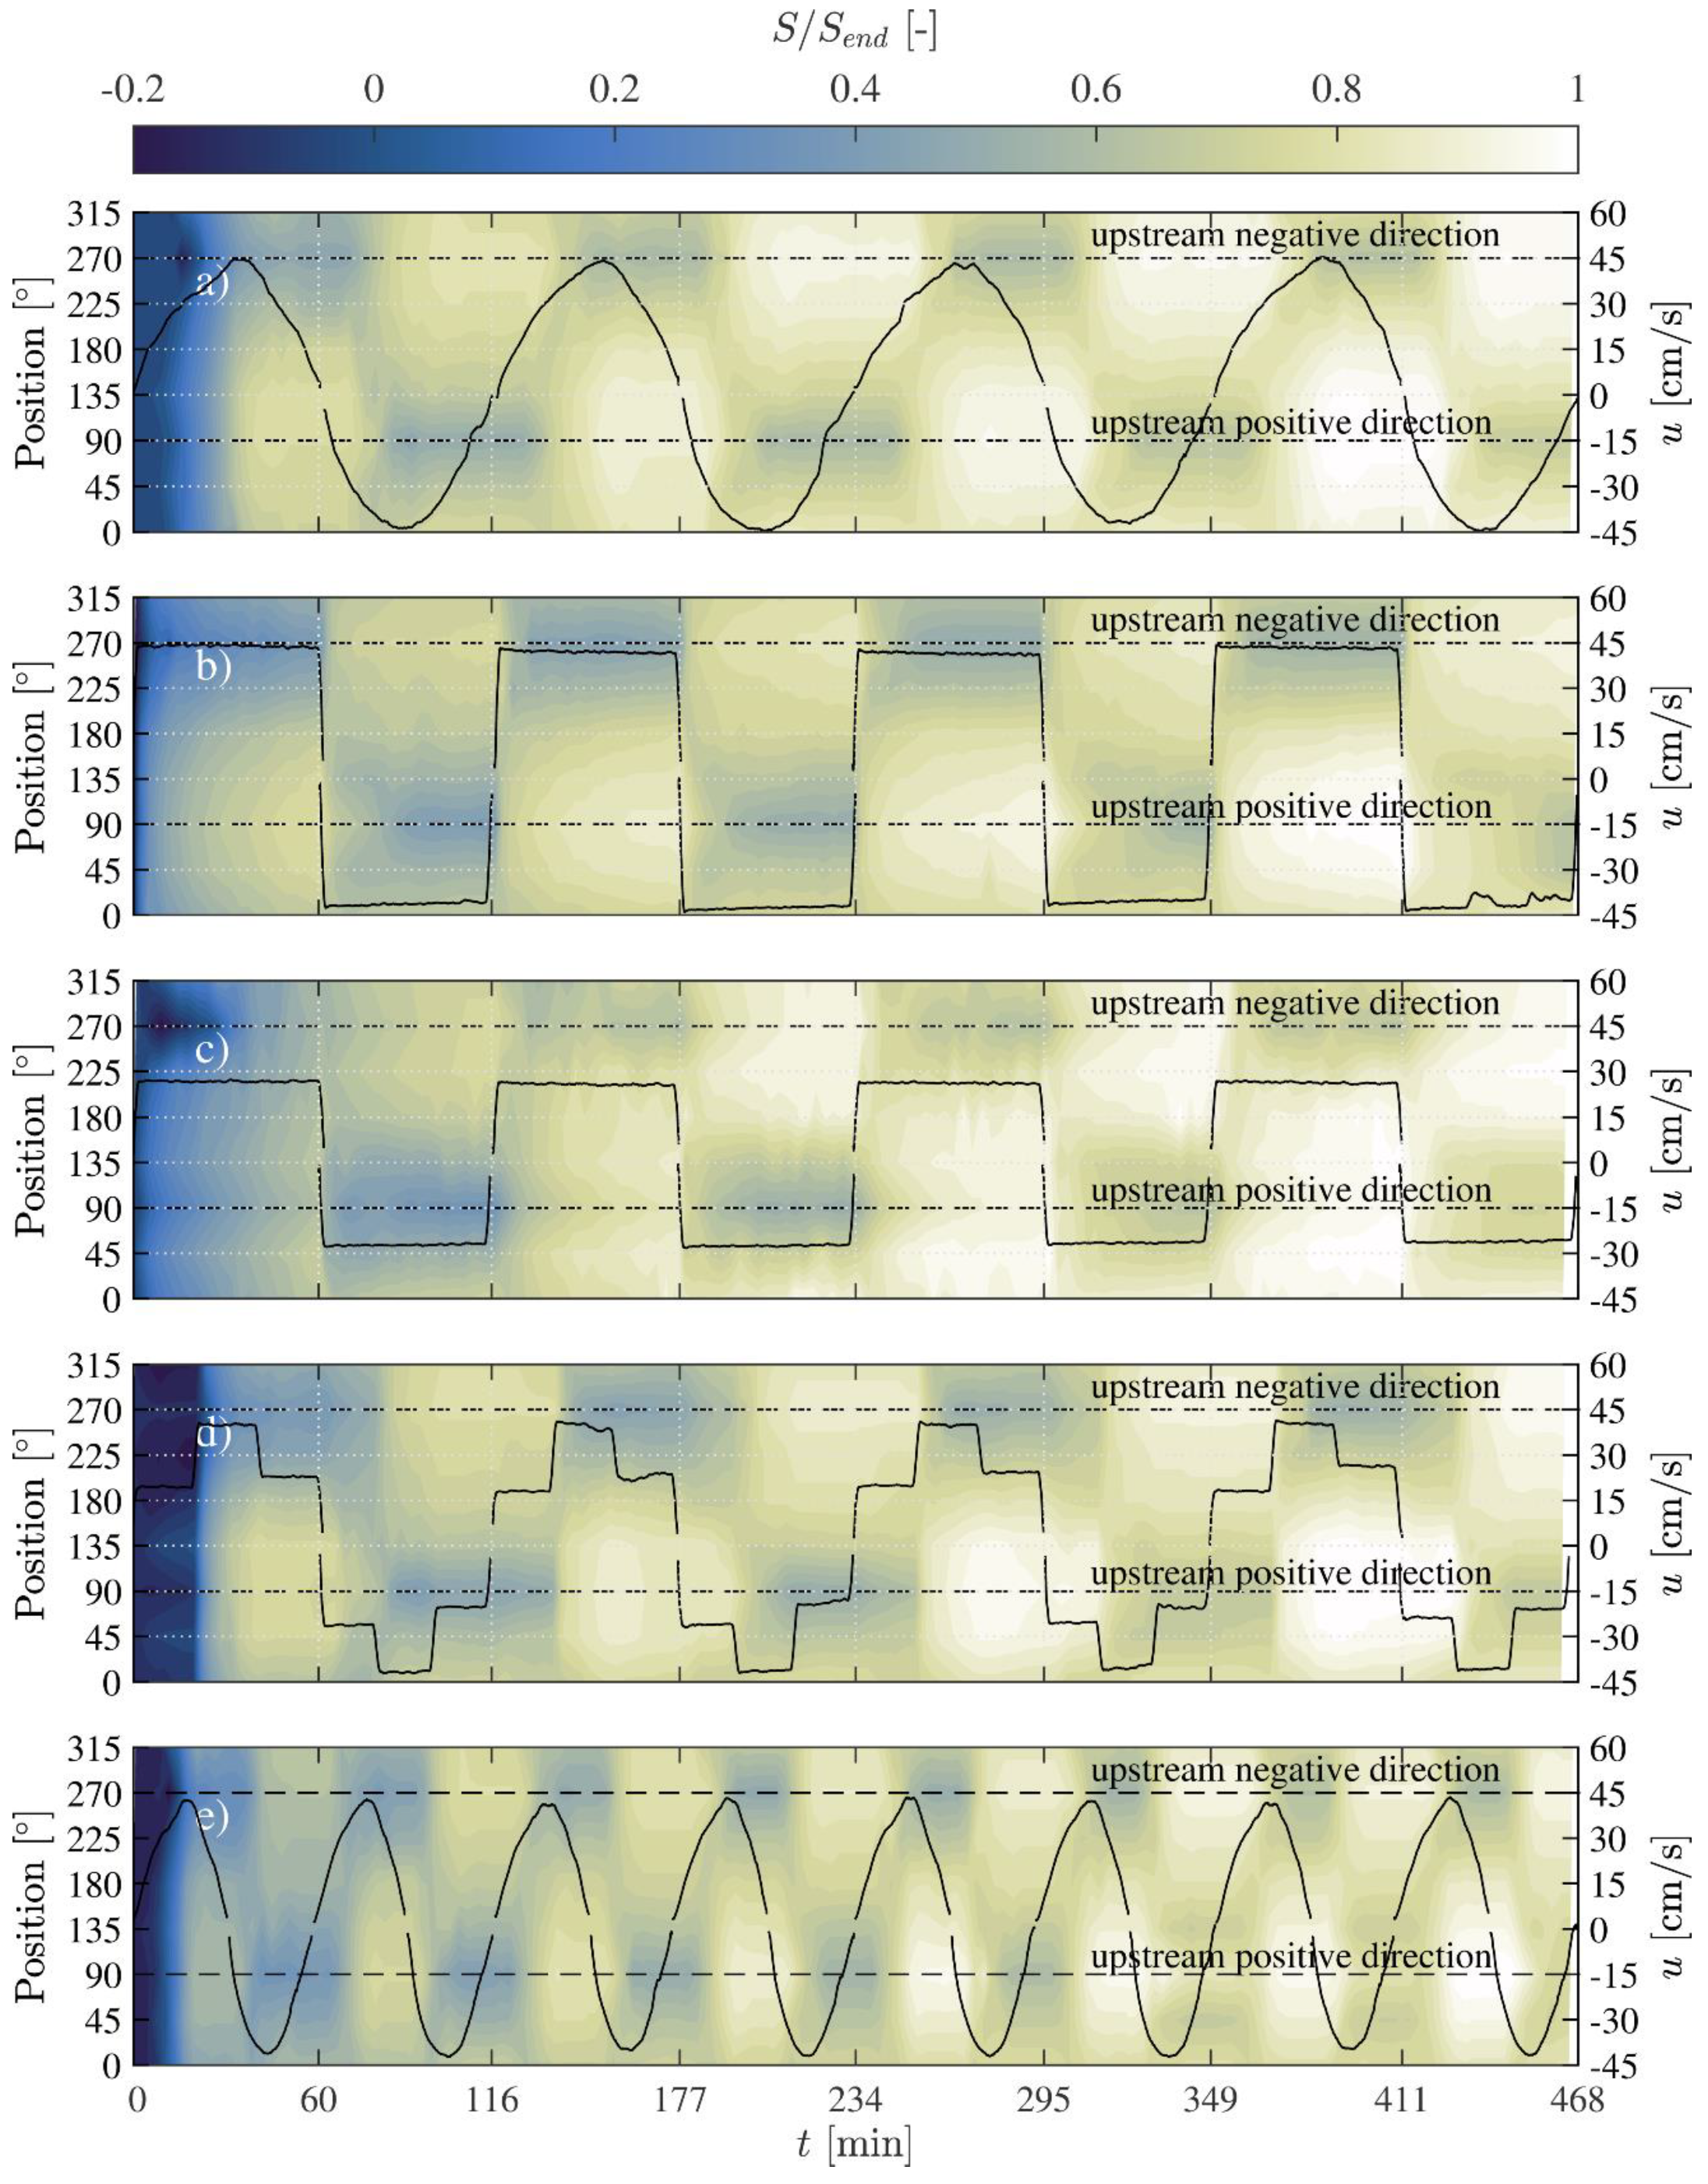
Figure 5 and Figure 6 illustrate the described sediment displacement processes and variability of scour depth around the pile with changing flow velocity and direction by interpolating the measured scour depths around the pile to a scour pattern. Acquired data and graphical representation thereof epitomize the scour depths at all positions around the pile at every time step over the entire test duration. For reference, the hydrograph of each test is included in Figure 5 and Figure 6 as an overlay. Furthermore, scour depths are normalized by the final scour depth at the end of each test, , to allow an easier comparison of scour progression between all tests. The streamwise positions at the pile at 90° and 270° (cp. Figure 3) are marked by dashed lines. While Figure 5 includes all tests with changing flow direction, Figure 6 compares the two tests in which a unidirectional current was generated.
The scouring process induced by the tidal current in test Tide04, as shown in Figure 5a, stopped significantly before the flow velocity fell below its critical value ( = 0.295 m/s) again during the descending branch of the tidal half cycle. For most half cycles, the scour development slowed down significantly after the peak velocity was reached and eventually remained at the depth obtained here. This scour behavior is in accordance with observations from Chang et al. [2] and Link et al. [7], who showed that the scour depth changes only slightly during the recession period of a flood wave. Therefore, Figure 5a reveals a periodically returning scheme of aborted scouring at times of changing flow direction, and a resumption with the next tidal half cycle once half of the sediment’s critical flow velocity was exceeded. With every change of flow direction, the position of the maximum scour depth propagated to the new upstream side of the pile, inverting the imbalance of scour depths between the streamwise positions.
Figure 5b shows the scour development caused by the reversal, but over the period of a tidal half cycle constant flow of Test01. In contrast to Tide04 (Figure 5a), the scour depth increased steadily during each tidal half cycle, and without exhibiting phases of stagnating scour progression whilst the flow direction is changing. Because flow velocities larger than the critical value were reached almost instantly within a tidal half cycle, the scouring process started right at the beginning of a tidal half cycle without any delays as they were observed in Tide04. Thus, as expected, the scour development in Test01 within a tidal half cycle resembled that in a unidirectional current very clearly. On the other hand, and in accordance with test Tide04, sediment infilling reduced the scour depth on the former upstream side of the pile once the flow direction changed. Thereby, a slight reduction of maximum scour depth at the start of a tidal half cycle was given. In addition, similar to test Tide04, propagation of maximum scour depth between the exact streamwise sides of the pile with reversing flow direction was evident.
The development of scour depths in Test02 (Figure 5c) deviated from this scheme, although the hydrograph resembled that of Test01, apart from the amplitude of the constant flow velocity. In Test02, the maximum scour depth was not periodically shifting between the exact streamwise positions. Instead, the maximum scour depth emerged at 45° angles (lateral) to the direction of approaching flow. Therefore, the process looked similar to the very early stage of a scour development in unidirectional currents, where the position of scour initiation is located at these very positions (Ettema [20]). Given the limited duration of a tidal half cycle (approx. 60 min), the time for the scour hole to converge into just one might not have been enough before the flow direction changed. A similar behavior was also observed by Schendel et al. [14] for scour induced by tidal currents in clear-water conditions.
As depicted in Figure 5d, the scour progression during a tidal half cycle was not as steady in Test03 as in test Tide04. While the scour depth increased only slightly during the velocity first step, it increased rapidly after the flow velocity increased with the second velocity step. During the third velocity step the scour depth either stagnated or slightly decreased (e.g., during the third tidal half cycle). This scouring behavior might be expected, as the clear-water conditions of the first and last velocity step obviously contribute little to the scour development. Also, considering the previously described scour development in Test01 and Test02, it can be seen that the scour progression under a given velocity step of the stepwise hydrograph is similar to that under steady and unidirectional flow. These findings are consistent with those of Chang et al. [2] who compared the progression of scour depths within segments of a stepwise hydrograph to that in an equivalent steady current. Yet, the scour pattern induced by the stepwise change of flow velocity in Test03 was overall very similar to the one under the tidal current in Tide04. The same applies to Test05 (shown in Figure 5e), in which the scour progression over time and the sediment displacement around the pile in an individual half cycle was very similar to that in test Tide04. Of course, due to the compressed half cycles, the potential time window is reduced, in which flow velocities larger than the critical value can contribute to the scouring process. Consequently, scour depth increased less during a half cycle than in test Tide04.
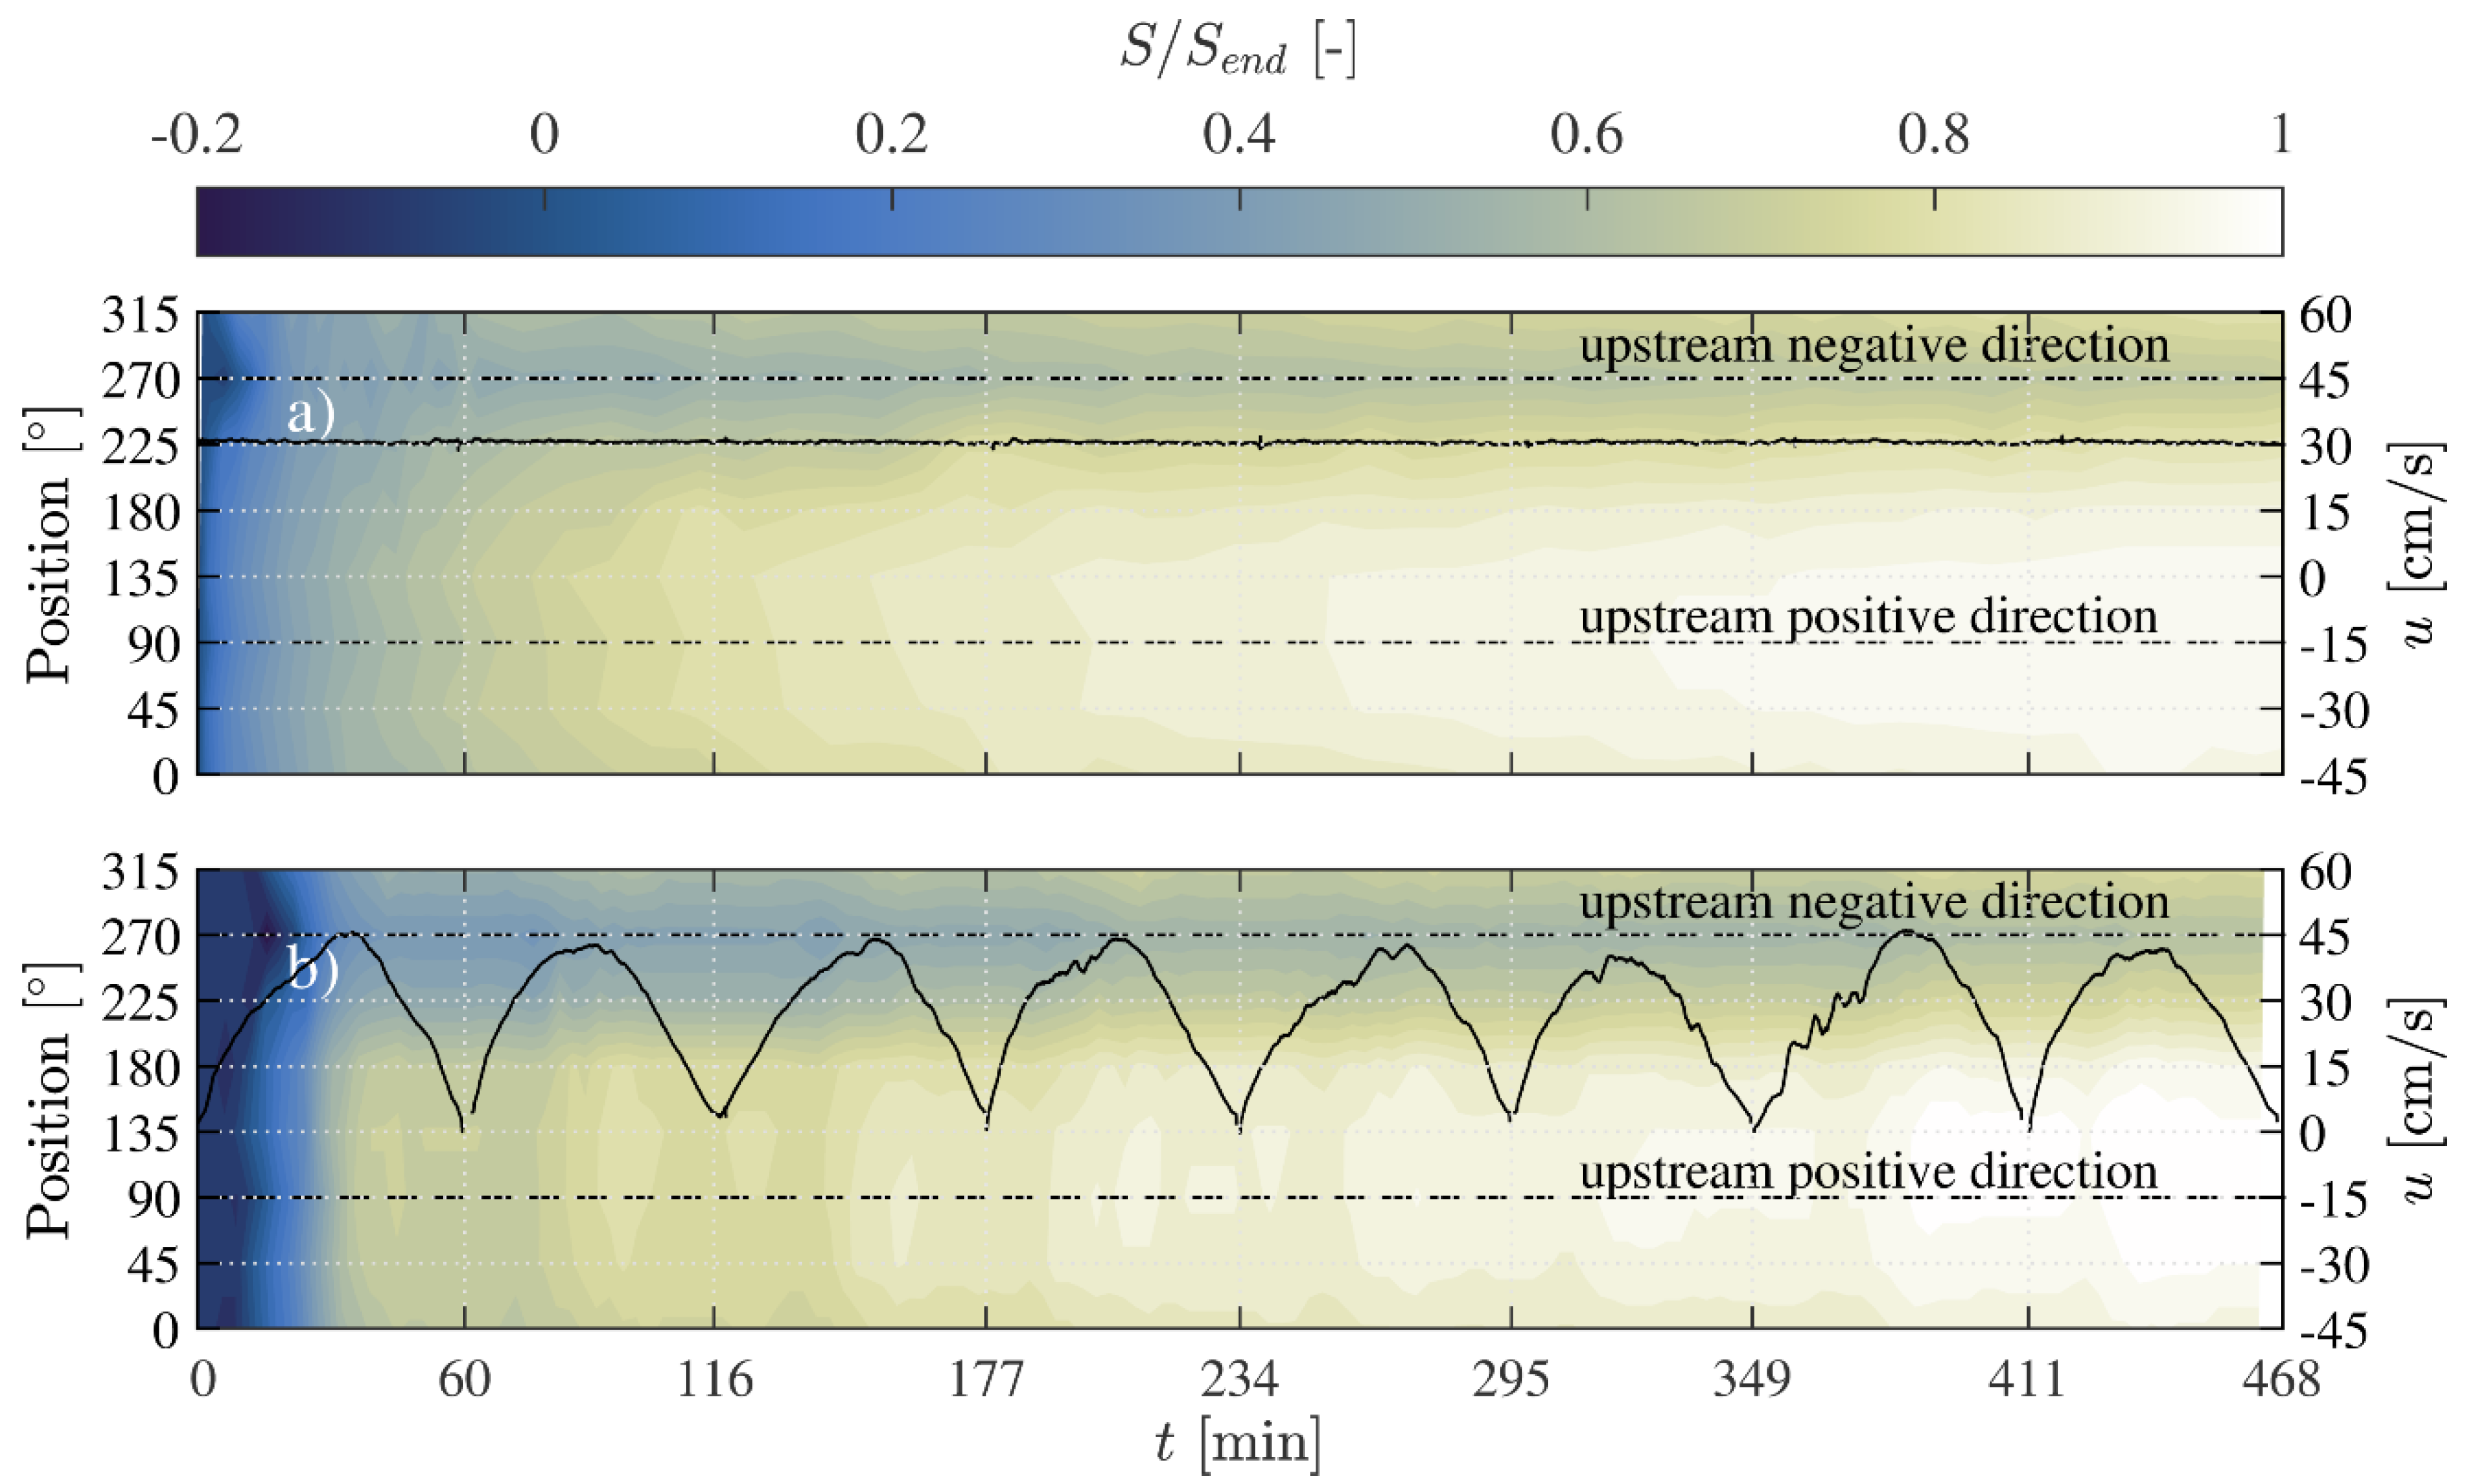
Furthermore, Figure 6 shows the scour pattern for tests with unidirectional flow condition. Figure 6b presents the scour development for Test04, which is markedly different from those in Figure 5. Considering the unidirectional approach of this test, it is not surprising that the maximum scour depth developed at the upstream side of the pile and remained in that position throughout the duration of the test. Resembling the scour development in a unidirectional, constant flow as depicted in Figure 6a for test Uni04, no periodical change of the position of maximum scour depth was observed. Furthermore, while the increase of scour depth stagnated during the falling limb of the tidal half cycle no sediment infilling processes between the tidal half cycles were measured. Therefore, it is at least questionable if the approach applied in Test04 is suitable to represent the scouring processes induced by a tidal current.
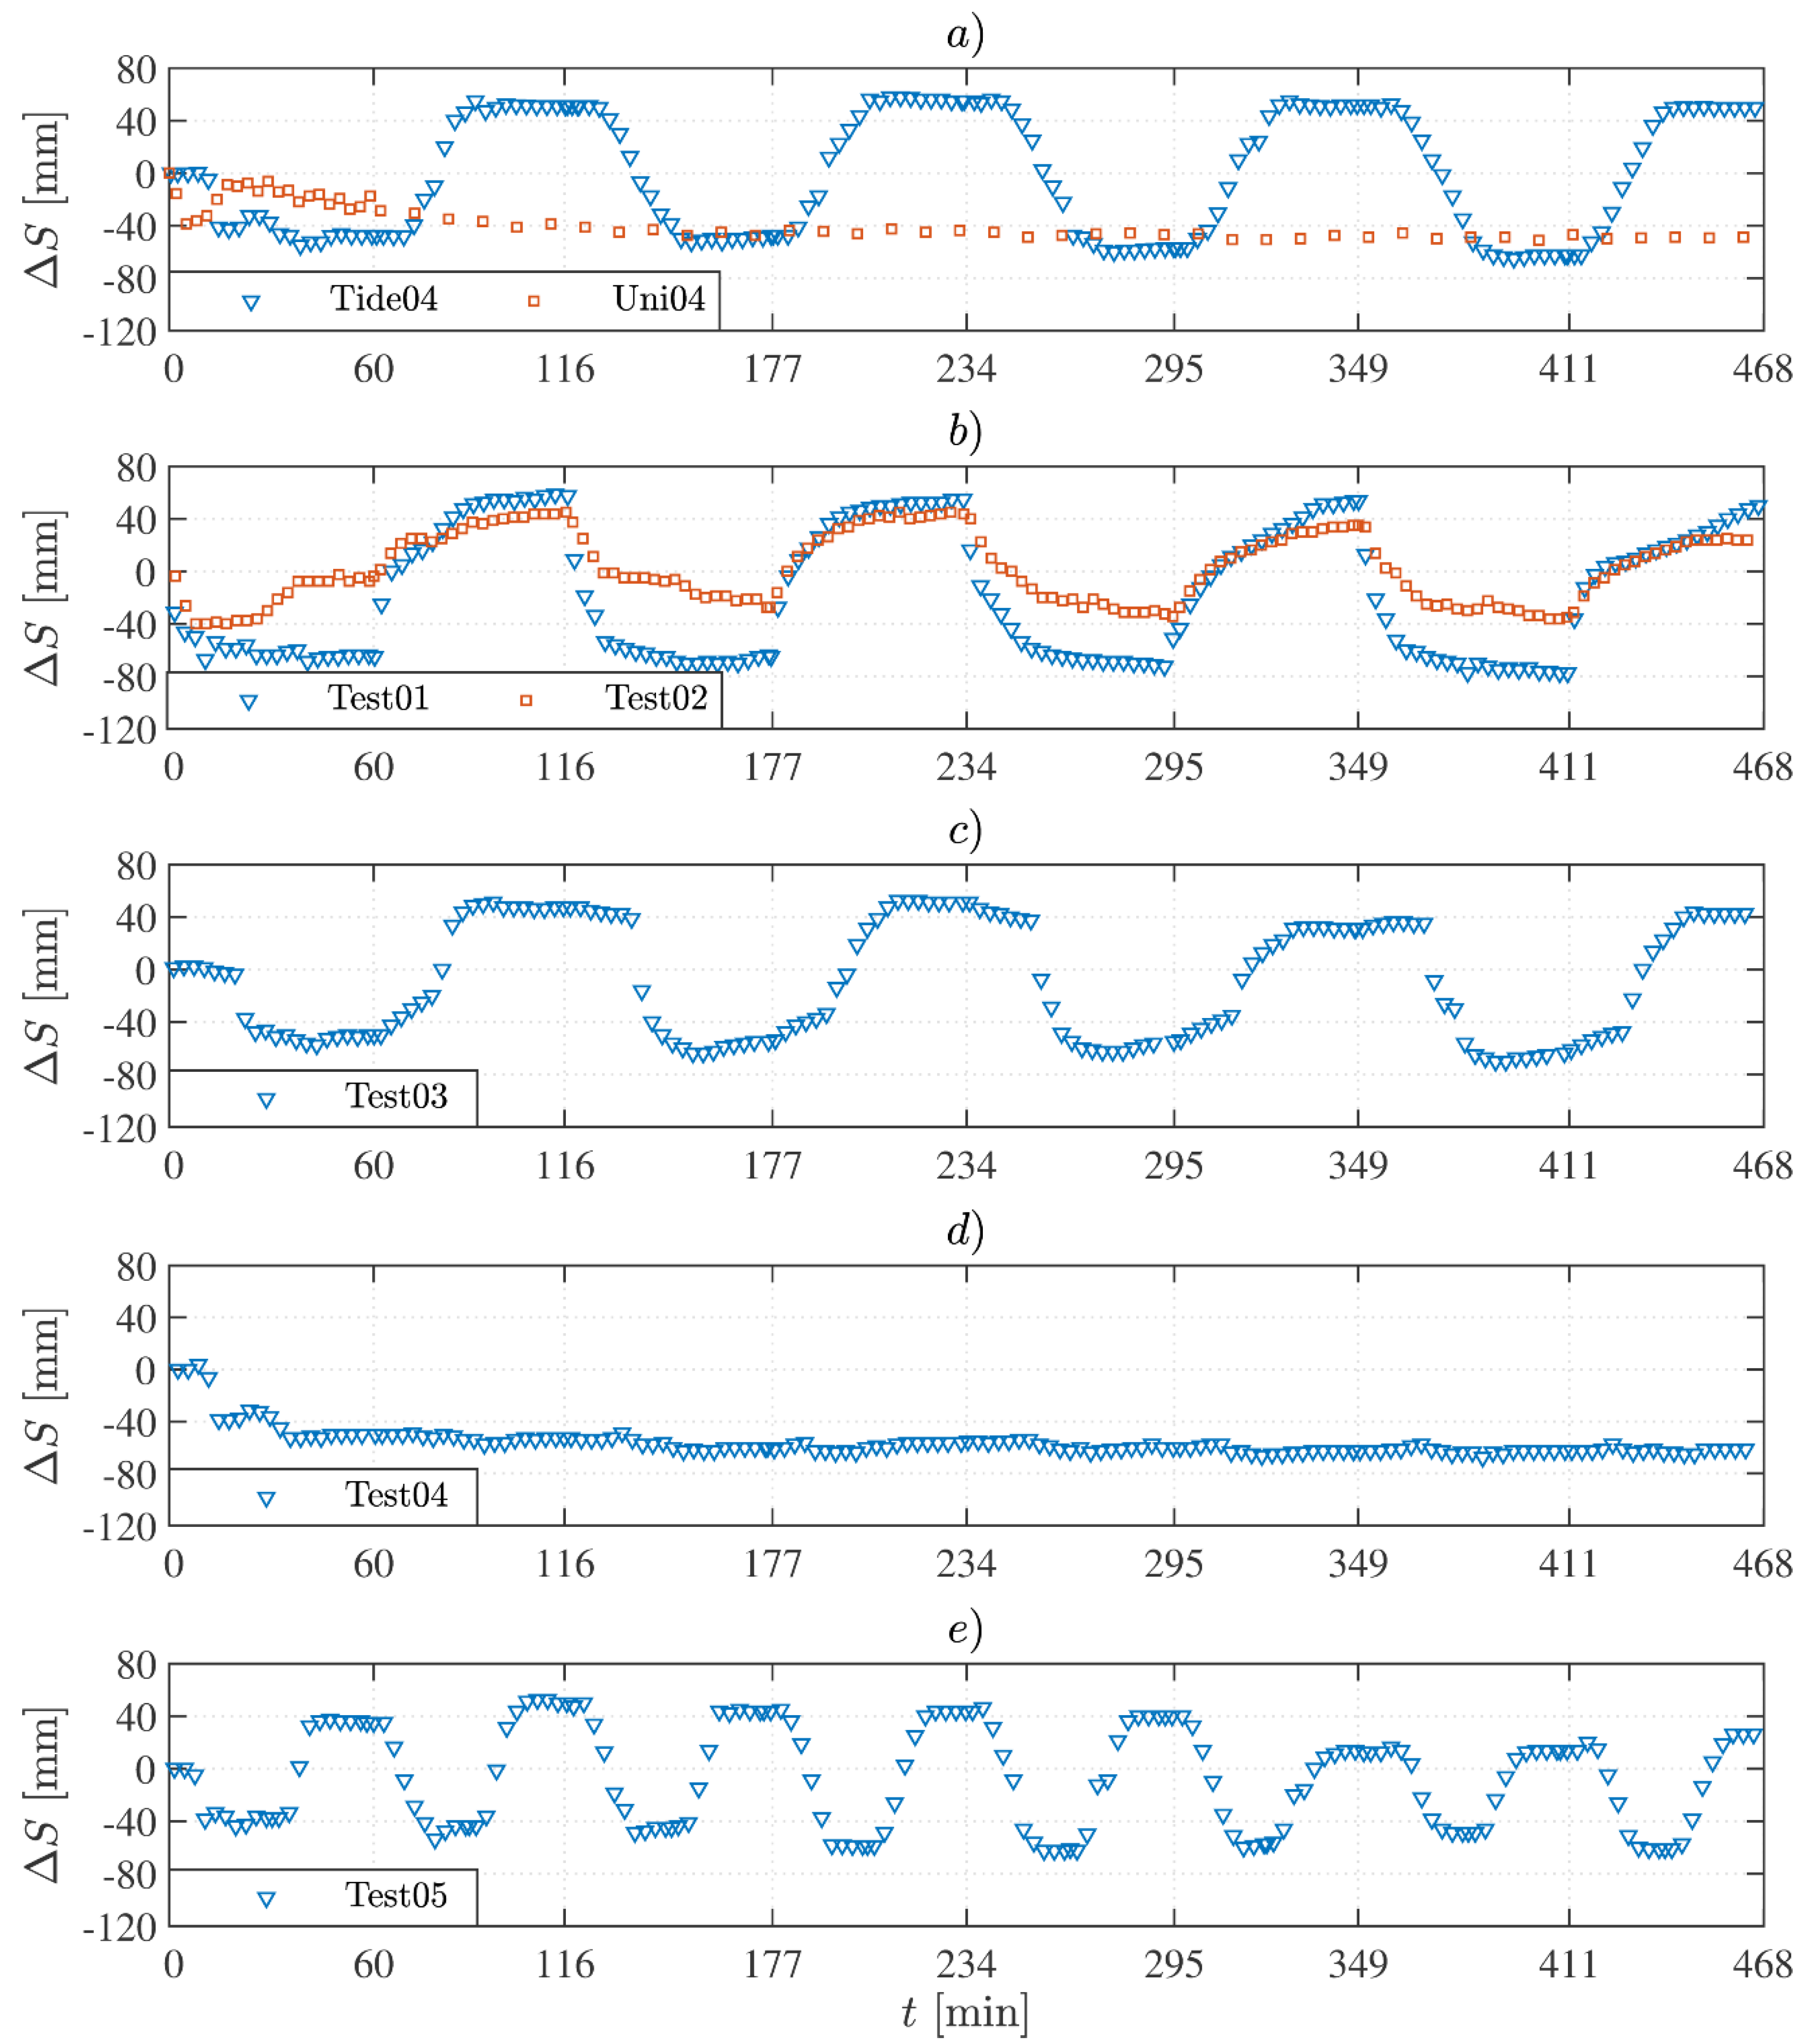
To further elucidate the infilling and the resumption of the scouring process with each tidal half cycle, Figure 7 depicts the time-varying differences in scour depth in the vicinity of the pile by relating the scour depths at the streamwise positions. The difference in scour depth is given in absolute values and is represented by the parameter :
Negative values of in Equation (2) indicate greater scour depths on the initial upstream side of the pile (90°) while positive values refer to larger scour depths on the initial downstream side (270°).
As a result of the reversing tidal current in Tide04, significant differences in terms of scour depths between the streamwise sides of the pile developed (Figure 7a). After the first half cycle, the amplitude of scour depth variation remained almost constant. The overall maximum difference in scour depth of 65 mm was measured during the 7th half cycle (the last “flood” cycle). Eventually, differences in scour depth between the streamwise sides of the pile were obtained that were even larger than the differences measured under the unidirectional flow of test Uni04 (minimum of −51 mm). With the constant flow velocity being based on the RMS value of the tidal reference flow, a similar total load (compare in Table 2) should have been exerted to the sediment by both currents. Yet, the peak flow velocities in test Tide04 were larger than the constant flow velocity of test Uni04. Although the peak flow velocities only contributed to the scouring process for a relative short duration, this might have been long enough to produce larger scour depth imbalances every tidal half cycle than by the unidirectional current in test Uni04.
Figure 7b compares the differences in scour depth of Test01 and Test02. Obviously, the differences between the upstream and downstream side of the pile were not as distinct during Test02 as during Test01. This might be expected considering the significantly smaller flow velocities in Test02 than in Test01. In Test01, a maximum difference of more than 77 mm between the streamwise sides was measured, which is larger than that in the reference test Tide04. In addition, throughout Test01, larger imbalances of scour depth occurred during the “flood” (positive flow velocities) half cycles, starting with the first tidal half cycle. The reason for this might be the slightly larger peak velocities of the flood half cycles compared to the ebb half cycles. In the reference test Tide04, peak velocities were slightly higher during flood cycles than during ebb cycles. This discrepancy in flow velocity was compensated by the fact that the mean flow velocities (calculated as the root mean square, RMS) were actually slightly larger during the ebb cycle than during the flood cycle. As the constant flow velocities of Test01 were, however, only based on the peak values, a discrepancy in flow velocity between both flow directions incurred, which in turn led to an imbalance of scour depths and streamwise differences thereof. Contrastingly, larger differences in scour depth during the ebb cycles than during the flood cycles could be observed in Test02. However, as pointed out earlier, maximum scour depths did not always occur at the exact streamwise location in Test02, so that differences between other positions around the pile might be even larger. From this it can be seen that using just the peak or the RMS flow velocity for the segments of constant flow velocity might result in a misrepresented amount of sediment infilling and displacement with potential consequences on the scouring rate and depth (as shown later in this paper).
As depicted in Figure 7c, the stepwise change of flow velocities in Test03 led again to a scouring process that was very similar to that in test Tide04. A small distinction in the time development of scour depth differences between Test03 and Tide04 resulted from the immediate onset of scouring with the beginning of a tidal half cycle. Whereas in Tide04, the scour processes within a tidal half cycle started after a small delay, i.e., after the critical flow velocity was exceeded. As in test Tide04, the overall maximum difference in scour depth of 70 mm was measured during the 7th half cycle. McGovern et al. [11] also carried out scour measurements at multiple positions around the pile. In their tests, in which tidal half cycles were discretized by three velocity steps, maximum scour depth formed at the lateral sides of the pile and remained there until the end of the test. Towards the end of their tests, i.e., after four half cycles, scour depths around the pile approached each other. In stark contrast to the results presented in Figure 7c, a difference in scour depth between the streamwise sides of only 5 mm (0.025D) remained. However, in McGovern et al. [11] maximum flow intensities of = 1.24 were generated, whereas in Test03 of this study flow intensities of = 1.42 were reached.
Without any large fluctuations, the streamwise scour depth imbalance in Test04 (Figure 7d) developed similar to that in test Uni04 (Figure 7a) and, thus, resembled that induced by a unidirectional and constant flow. Interestingly, the maximum amplitude of scour depth differences ( of −68 mm) was even larger than that in test Uni04 and as about the same size as in test Tide04. Again, that might be attributed to peak flow velocity in Test04 that are larger than the constant flow velocity of test Uni04.
Finally, Figure 7e shows the differences of the streamwise scour depths for Test05. Here, the differences increased over the course of the first four half cycles and reduced after nine half cycles. While the build-up of differences at the beginning of the test might be linked to the shorter half cycle duration, the reduction of differences at the end of the test might be stemming from the increased number of load cycles. As the scour depth increased with ongoing time, the influence of the incoming flow on the scouring process decreased so that less sediment was moved within the scour hole and the differences in scour depths were converging. This might imply a dependency of the position of the maximum scour depth on the number of tidal half cycles. However, Schendel et al. [15] also conducted a long duration test and found that scour depths still varied in resonance with the flow direction even after 21 half cycles. Furthermore, the maximum amplitude of scour depth imbalance is similar to that of Tide04, although differences during the flood cycles are slightly more pronounced in Test05 than in Tide04.
In summary, it can be stated that the characteristic sediment infilling processes and the periodical change of the position of the maximum scour depth around the pile could not be reproduced by unidirectional currents, whether they are steady or unsteady. Future studies focusing on the description of scouring processes under tidal influence should therefore consider a change of flow direction. Using the results of test Tide04 as reference, the scouring process was best approximated by a hydrograph with stepwise changing flow velocities. Hydrographs in the shape of a “square tide” did produce scour depth imbalances around the pile that are similar to that in test Tide04. Within a tidal half cycle, however, the evolution of scour depths resembled that of unidirectional instead of tidal currents. Also, Test01 and Test02 show the difficulty of selecting a constant flow velocity that is able to mimic the scouring process of a specific tidal current.
3.2. Time Development and Scouring Rate of Maximum Scour Depth
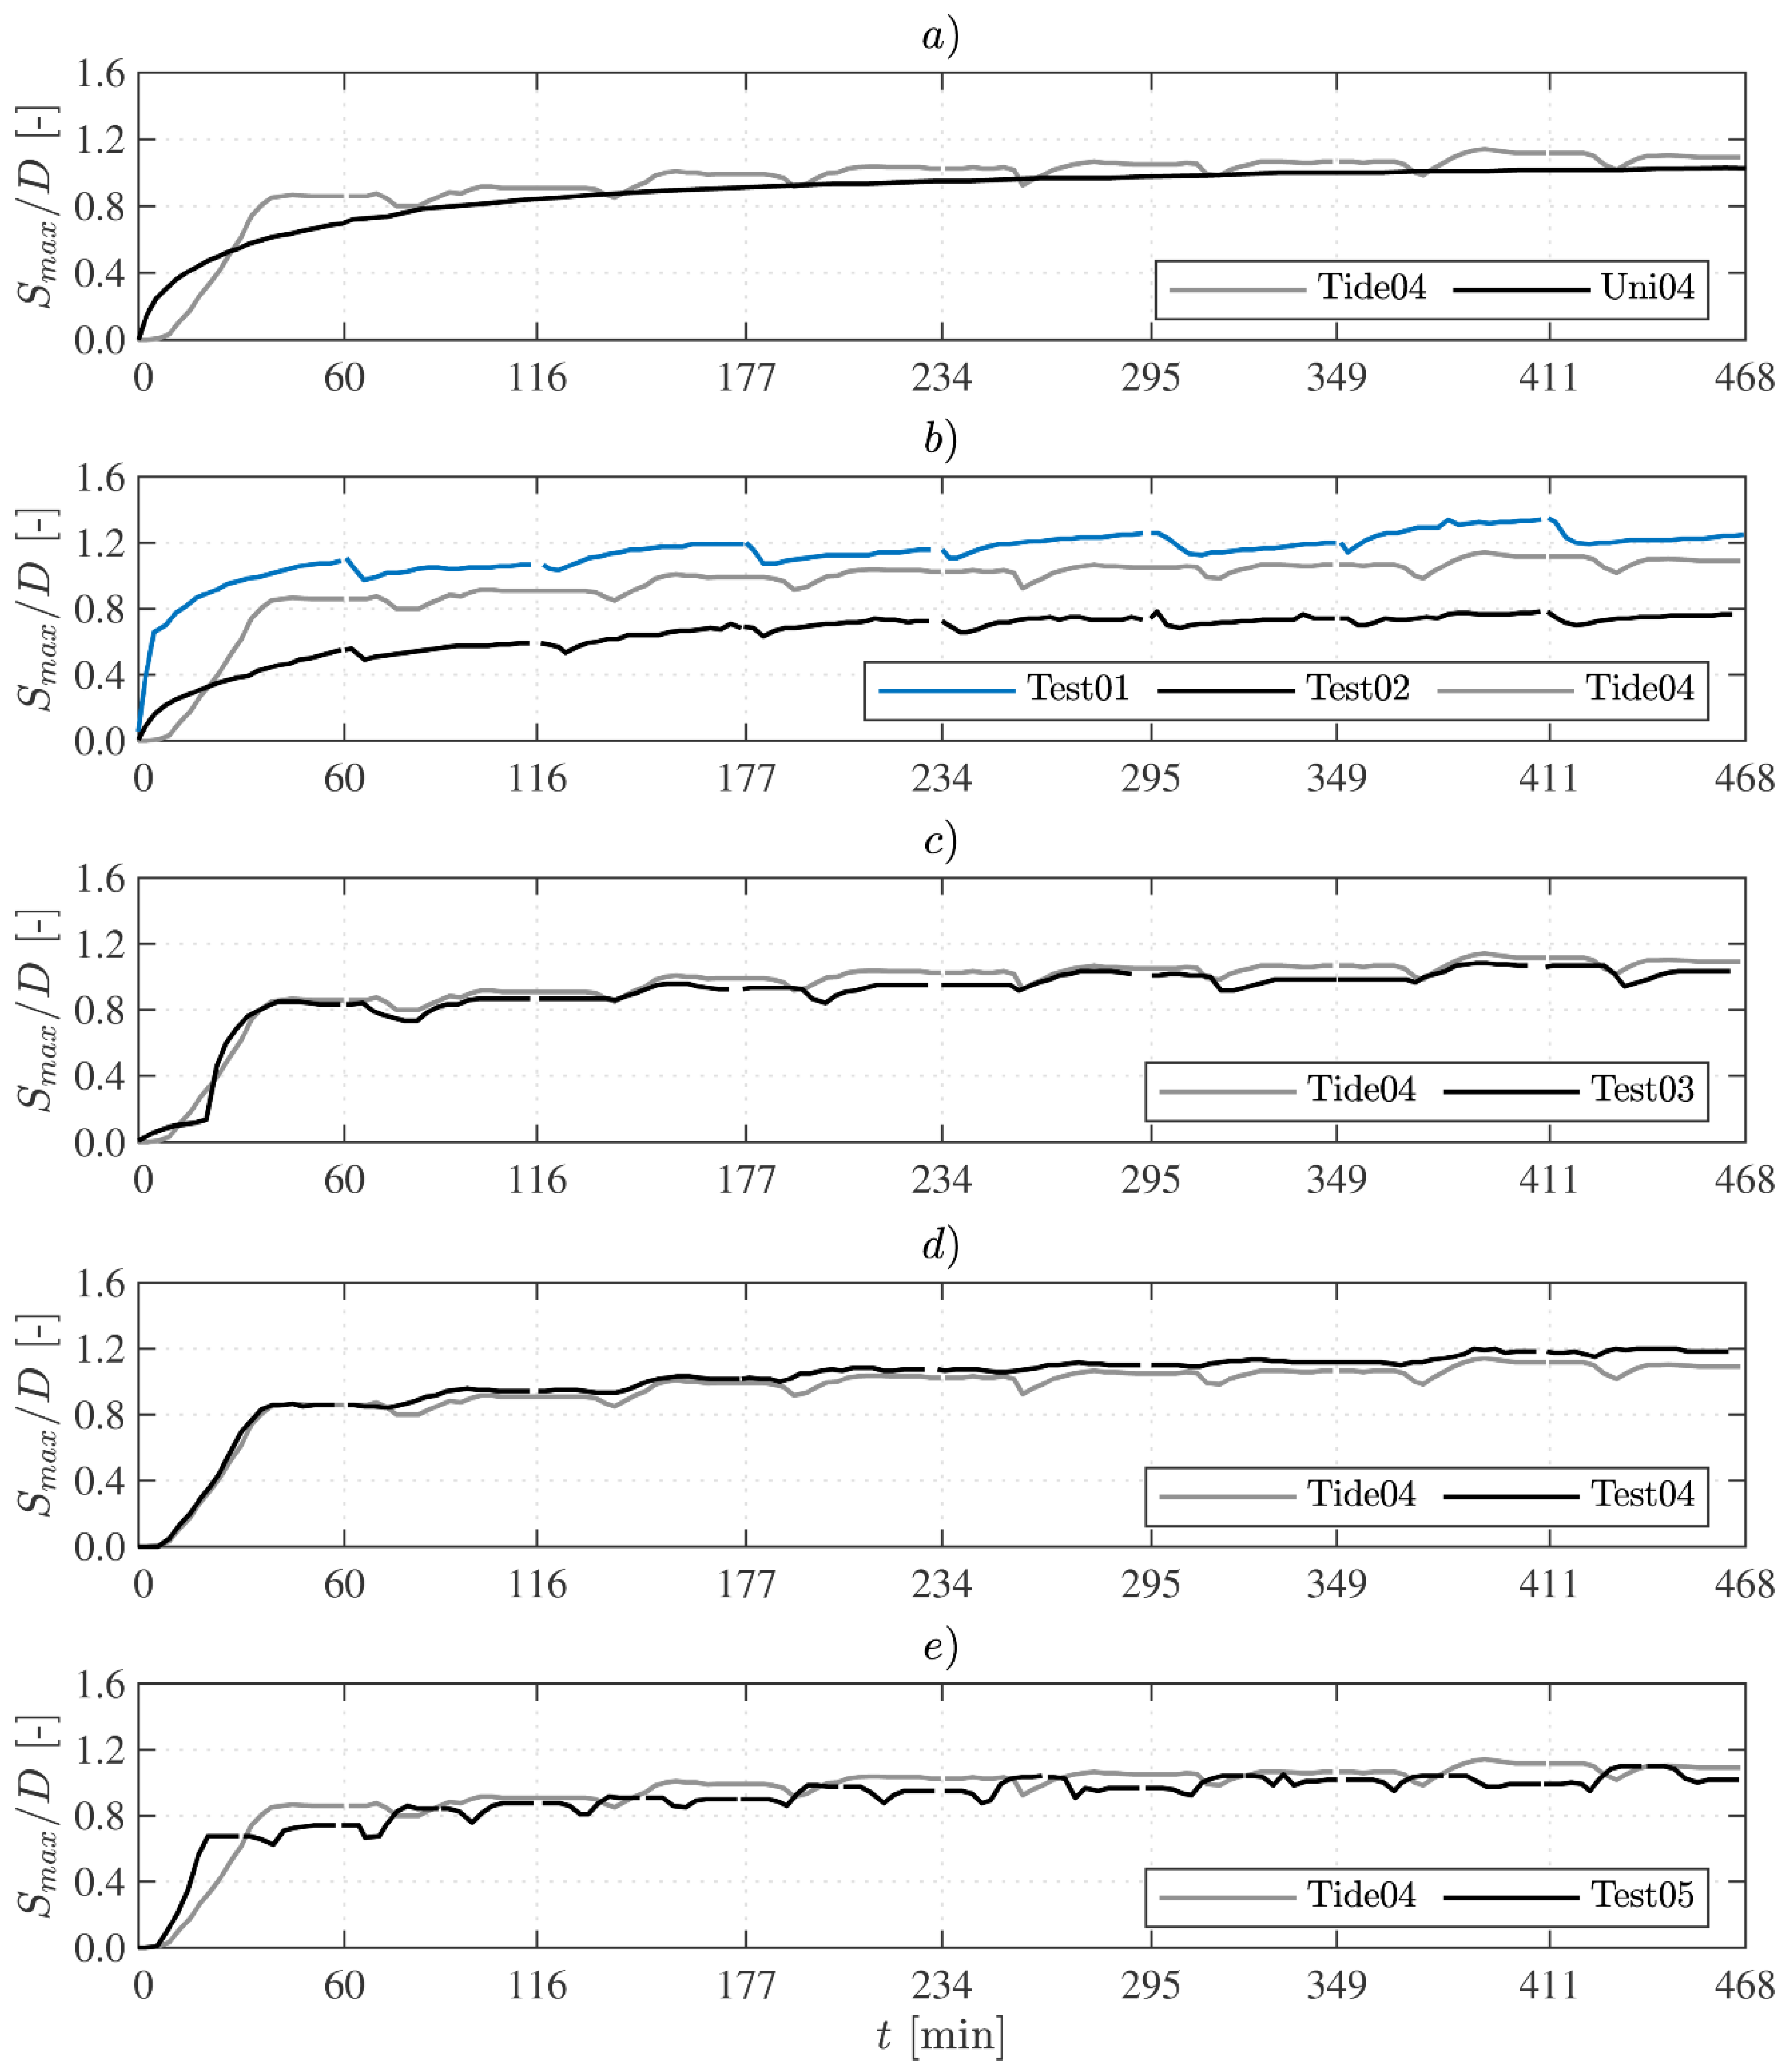
The temporal development of the maximum scour depth for each test is presented in Figure 8 (final scour depths are given in Table 2). Under the unidirectional current of test Uni04 (Figure 8a), scour depths were continuously and asymptotically increasing towards an equilibrium scour depth as expected. In contrast, the time development of the maximum scour depth under the tidal flow in test Tide04 was characterized by phases of stagnating and decreasing scour depth. With each new tidal half cycle, the maximum scour depth was decreasing due to infilling processes but increased again over the length of a half cycle. Figure 8a also reveals the large contribution of the first tidal half cycle to the final scour depth. While the increase of scour depth over time was slightly faster in test Tide04 than in test Uni04, most of the difference is scouring rate can be attributed to the first tidal half cycle, in which the scouring process developed slowly at first but accelerated quickly with increasing flow velocity.
The final scour depths were quite similar (164 mm compared to 154 mm), indicating that a unidirectional current whose constant flow velocity is based on the RMS value of the tidal signal might actually produce final scour depths that are to a certain degree comparable to those of the tidal current.
Although based on the RMS value of the velocity time series of Tide04, the scour development in Test02 significantly underestimated the scour depths of test Tide04. In addition, the scour development in Test02 showed less infilling between tidal half cycles, resulting in a clearly less fluctuating progression of scour depths over time. Compared to test Uni04, in which a similar constant flow velocity was applied, significant shallower scour depths were obtained. While in Test02 a final scour depth of only = 115 mm was measured, a final scour depth of 154 mm was obtained in test Uni04, which marks a difference in scour depth of 34%. Thus, compared to the scour development in unidirectional currents, flow reversal leads to a significant reduction in scour depth. This result agrees with that described by Escarameia and May [9], but it is contrary to the findings of Jensen et al. [10] and Yao et al. [13] who both found the square tide to induce slightly larger scour depths than the unidirectional current.
On the other hand, the scouring process was much faster and significantly larger final scour depths were measured for Test01, in which the constant current velocity was based on the maximum peak velocity of the tidal signal. Moreover, the reduction of scour depths at the beginning of ebb half cycles due to sediment infilling was not completely equalized, resulting in a reduction of the maximum scour depth during the ebb half cycles. Therefore, using the RMS value of a tidal velocity signal as a reference value for a constant flow to approximate tidal current induced scour depths seems to be a suitable approach only if the constant flow is unidirectional but not if it is reversing.
The development of maximum scour depths of test Tide04 was very well reproduced by the stepwise changing flow velocity of Test03. During the important first tidal half cycle in particular, the development of the maximum scour depth was almost congruent with that of the reference test Tide04. Infilling processes between half cycles were also very well reflected. The differences in scour development between test Tide04 and Test03 were mainly introduced during the ebb cycles, in which the scour depth in Test03 never reached the same level as in the preceding flood half cycle.
In general, the scour development of Tide04 was also well reproduced by Test04. However, as the flow direction was not reversed in Test04 no infilling processes were provoked at the beginning of a new half cycle, leading to a larger final scour depth eventually. As the exact same flow velocities were generated in Test04 and in test Tide04, only the missing reversal of flow direction can be the reason for the increase of the final scour depth.
As depicted in Figure 8e, the scour development in Test05 deviated from that in Tide04 particularly during the first half cycle. Due to the larger flow acceleration in Test05, the scour depth was initially increasing faster than in test Tide04. However, as the period of the first half cycle was halved, the scour process stopped earlier than in Tide04, resulting in a much smaller scour depth after the first tidal half cycle compared to Tide04. After the first half cycle, the scour process followed the same scheme as in test Tide04, showing very pronounced fluctuations of scour depth between half cycles due to occurring infilling and sediment displacement processes. Consequently, the offset of scour depth at the end of the first half cycle between Test05 and Tide04 could not be equalized in the further course of the Test05. Therefore, it might be assumed that the period of the first half cycle depicts a crucial factor regarding the time development of the scouring process in reversing tidal currents.
Furthermore, Figure 9 illustrates the initial physical scour processes in each experimental configuration and depicts the scour rate over time as the gradient of the maximum scour depth between individual measurements. As most of the differences in scour depth progression between the individual test cases can be attributed to the initial phase, Figure 9 focuses on the scour rate differences in the first two half cycles only (equal to about 116 min). Following the continuous increase of flow velocity in test Tide04 (Figure 9a), the scouring rate in the first half cycle slowly increased once the half of the critical flow velocity was reached. The maximum scouring rate was reached at the time of the peak flow velocity. Subsequently, scouring rates rapidly fell towards zero. After the change of flow direction, infilling indicated by negative scouring rates took place at the beginning of the second half cycle. Although the first two tidal half cycles had very similar flow velocities, scouring rates during the second half cycle were considerably smaller than in the first one. The pre-existing scour hole as well as the required flow exposure to equalize the previously imprinted scour depth imbalances around the pile clearly decelerated the scour progression in the second tidal cycle.
The scouring rate of test Uni04 on the other hand, also depicted in Figure 9a, steadily decreased over time after it had started from a high initial value at the beginning of the test. For a unidirectional current this decline of scouring rate is expected as it follows the deepening of the scouring hole. In Test01 and Test02, as shown in Figure 9b and Figure 9c, respectively, the scouring process also started with a large scouring rate that over the course of the first half cycle diminished steadily. In contrast to test Uni04, negative scouring rates at the transition to the second half cycle again indicate a temporary decrease of scour depth due to sediment infilling. The development of scouring rates for Test03 in Figure 9d confirms the impression given by Figure 5 that the scouring process within each segment of the stepwise hydrograph resembles that in unidirectional currents. In addition, Figure 9d shows a sudden and large increase in scouring rate from the first to the second velocity step. Thereafter, almost no change in the scour rate was visible, indicating a constant scour depth during the third velocity step. Thus, the distribution of scouring rates over the course of the first half turned out to be remarkably different compared to that in Tide04, although the scour depth at the end of the first half cycle was almost identical in both tests (cp. Figure 5c).
As expected, the temporal development of scouring rates in Test04 (Figure 9e) during the first half cycle was almost identical to that of Tide04. However, no negative scouring rates were observed during the second half cycle that would indicate infilling as the flow was unidirectional only. Following the periodic change of flow velocity and direction in Test05, Figure 9f indicates a returning scheme of large scouring rates at times of peak flow velocities and negative scouring rates once the flow direction changed. Moreover, the reduction of tidal cycle period led to higher flow acceleration and, thus, increased scouring rates compared to Tide04.
Therefore, the results in Figure 9 illustrate that the governing processes leading to scouring in the vicinity of the structure are clearly controlled by the flow exposure induced through the hydrograph. Furthermore, the scouring rate occurs to be dependent on the preceding scour development. The same load during the second half cycle did not yield the same scouring rate because a deep scour hole has already developed previously. In addition, even negative scouring rates indicating a temporary reduction of scour depths emerge when flow directions change. The scouring rates in a tidal current can, thus, only be accurately mimicked by a hydrograph with continuously changing flow velocity and reversing flow direction.
As an additional reference value for the scouring rate, the time scale is given in Table 2. The time scale is calculated as the integrated scour depth over time, an approach also applied by Fredsøe et al. [21], Fuhrmann et al. [22] or Welzel et al. [23]:
with as the time needed to develop the final scour depth .
This approach was given preference over the more widely used exponential approach of Sumer et al. [24] to account for the unsteady increase of scour depth in tidal currents. The ratio of time scales between the individual test cases resembled remarkably the impression given by the development of the maximum scour depth over time presented in Figure 8. The largest time scale to yield a terminal local scour bathymetry and, thus, the slowest progression towards the final scour depth was calculated for Test04. As shown in Figure 8d, the scour depth in Test04 continued to grow even at the end of the test, implying that the scouring process was indeed far from reaching an equilibrium state. In contrast, the scour development in test Tide04 was clearly levelling off after the same test duration. Furthermore, the smallest time scale was determined for Test01. While the scour depth development was largely fluctuating until the end of the test, the scour depth increased rapidly within the first half cycle.
3.3. Assessment and Prediction of Scour Depth Using the Effective Flow Work
In order to evaluate whether the differences between the tests in terms of scour depths and rate are solely a result of the hydrographs’ shape or not, a further look at the overall hydraulic load is taken in this section. To describe and to predict the unsteady scour development in currents with time-varying hydrographs, Pizarro et al. [6] and Link et al. [7] utilized the dimensionless effective flow work . The effective flow work describes the exerted work by the flow on the sediment bed around a pile and is expressed as a function of the effective flow velocity, which corresponds to the excess velocity above the incipient scour condition . Thereby, the effective flow work represents a means to link the scour development in unsteady flows directly to the exposed velocity time series. According to [6], the dimensionless, effective flow work at a pile is given as:
The parameter represents the reference velocity, which is given by:
with as the specific weight of the sediment, the density of water and as the acceleration due to gravity.
Furthermore, is the reference time given by:
with as the reference length:
In Equation (4), the scour process is initiated as soon as half of the critical flow velocity is reached, as suggested by Breusers et al. [25]. Eventually, this leads to the Dirac–Delta function :
Pizarro et al. [6] found that for constant hydraulic conditions the relation between scour depth and effective flow work is unique, i.e., that a given value of will produce one specific scour depth. Furthermore, according to Pizarro et al. [6] and Link et al. [7], final normalized scour depths and can be related by an exponential function in the form of:
where , and are fitting coefficients.
In Pizarro et al. [6] and Link et al. [7], the effective flow work approach was used to describe the scour development in unsteady but unidirectional currents and exclusively under clear-water conditions. So far, the suitability of to describe also the scour progression in tidal currents, which are characterized by periodic backfilling processes stemming from reversing flow directions, has neither been directly addressed nor investigated systematically. In order to calculate for currents with changing flow direction, Equation (4) was adjusted by replacing with its absolute value .
The effective flow work exerted in all tests in comparison to the final scour depth and the time scale is illustrated in Figure 10. Here, the effective flow work, final scour depths and time scales are normalized by their corresponding value for test Tide04, to directly point out the differences to the reference test.
Scour depths and time scale generally correlate well with , i.e., an increase of corresponds to an increase of the final scour depths and to a decrease of time scales. Although the time averaged flow velocity was similar in most of the tests, Figure 10 also reveals significantly different values of . Therefore, one might argue that the measured differences of scour depths (up to 29.8% compared to test Tide04) and time scales (up to 31.6%) might partly be a result of different hydraulic loads as given by and not only a consequence of differently shaped hydrographs. However, while generally correlates well with the final scour depths of this study, an entirely unique relation between both parameter as has been argued by Pizarro et al. [6] and Link et al. [7] is not given. For example, the tests Uni04, Test03 and Test05 had very similar final scour depths ( = 154.4 mm, 155 mm and 152.5 mm respectively), which however were caused by rather different effective flow works (= 1.71, 4.03 and 4.51 × 10³). Considering the tests Tide04 and Test04, the reason for the missing unique relation between and might indeed be attributable to the changing flow direction and its consequences for the scour development. In Test04, a larger final scour depth was measured than in test Tide04 despite a lower calculated effective flow work. Since the reversal of the flow direction depicts the only substantial difference between the two tests, the difference in final scour depths must stem from the temporary backfilling of the scour hole at the beginning of the following tidal half cycle. The results in Figure 10 thus indicate the difficulty of the effective flow work approach in its present form to accurately account for segments of the hydrograph in which the flow does not contribute to the deepening of the scour depth but instead to the required equalization of scour depths around the pile.
Figure 11 shows the normalized scour depths as a function of the dimensionless effective flow work . In addition to the results from the present study, Figure 11 includes data points from Schendel et al. [15] for hydrographs in the shape of Tide04 (“tidal flow”) and Uni04 (“unidirectional flow”). Together with the additional data points taken from Schendel et al. [15], the measured values could still be fitted well to a single regression curve in the form of Equation (9), despite a missing uniqueness between scour depth and as mentioned earlier. The fitting was performed by a nonlinear least square function within MATLAB®, obtaining the fitting coefficients = 1.5250, = − 0.1170 and = 0.2843 with coefficient of determination of = 0.97. Equation (9) (with instead of ) might thus be used to estimate the final scour depths in unidirectional as well as tidal currents, independently from the shape of the hydrograph that was used to mimic the tidal currents in laboratory experiments.
To validate Equation (9) with literature data, a comparison of predicted and measured scour depth is given in Figure 12. As studies on tidal current induced scour with detailed information on the velocity time series are rare, the comparison relies on studies regarding the scouring process in unsteady (but unidirectional) flow. Often, a comparison between experimental obtained data from literature is complicated as the scour depth might be affected by different model and scale effects. As pointed out by Pizarro et al. [6], the scouring process around a pile in unsteady currents depends mainly on the dimensionless grain parameter, the relative density, as well as the relative flow depth and the relative roughness .
With respect to a potential influence on the scour depth, the studies included in Figure 12 only differ in terms of the relative roughness. As proposed by Pizarro et al. [6] and following the approach of Lee and Sturm [26], both independent data sets in Figure 12, [6] and [27], have been adjusted to account for scaling effects due to the differences in relative roughness. Almost all data points lay within a 25% error margin, verifying the capability of Equation (9) to also predict final scour depths in unsteady unidirectional flows, at least with an adequate accuracy. Thereby, Equation (9) further extends the approach given by Pizarro et al. [6] to unsteady hydrographs with reversing flow direction, i.e., tidal flow situations.
Schendel et al. [15] proposed a simple approach to quantify the differences in final scour depth given by a unidirectional or a tidal flow loading as a function of the flow intensity. Due to its simplicity, this approach provides relevance to practical applications and can be used by planners as a tool to predict scour depth in tidal currents around piles, especially if only limited flow data are available. The approach proposed with Equation (9) and Figure 11 goes one step further and allows a more distinct prediction of scour depths due to tidal currents, with the condition that detailed flow velocity time series (hydrographs) are available to the planner.
4. Conclusions
In this study, the role and impact of the generalization of multiple different hydrographs with reversing flow direction on the depth and rate of scour around a pile was evaluated for uni- and bidirectional flow conditions. The study aimed at providing explanations for contradicting statements in the literature regarding the scouring process due to tidal currents, and thereby, at reducing uncertainties in the prediction of scour depth around structures placed in tidal current affected waters. In addition, the findings of this study might be used as reference for the planning of physical model tests as well as for the calibration or validation of numerical models dealing with tidal current induced scour. The accuracy of the different hydrographs to mimic a tidal current induced scouring process was assessed by contrasting the scouring process over time, the scouring rate and final scour depths to tidal tests conducted by Schendel et al. [14,15]. In their tests, a largely authentic representation of the scouring process was obtained by appropriately scaling down flow velocities from field measurements. The main conclusions of this study can be summarized as follows:
- The scouring process in tidal currents can only be described accurately by hydrographs that incorporate varying flow directions, as unidirectional currents are not able to reproduce the characteristic backfilling and displacement processes. These processes, however, mark a decisive difference to the typical scouring process in unidirectional flow as they lead to negative scour rates and consequently significantly affect the scour development over time.
- To reduce the effort of physical modelling, the tidal current-induced scouring process might be represented with a reasonable accuracy by a stepwise adjustment of flow velocities. On the other hand, a “square-tide” approach with constant flow velocities during each tidal half cycle is only suitable to a limited extent, as scouring rates significantly differ from those in tidal currents with continuously varying flow velocity.
- Despite obvious differences in the temporal evolution of scour depth and rate, the results also indicate that final scour depths similar to those of the reference case can be achieved by different hydrograph shapes, provided that the overall hydraulic load is carefully selected.
- The effective flow work approach was found capable to identify such suitable hydraulic loads. While the relation between the effective flow work and the final scour depths was not completely unique, due to difficulties of to account for periods with sediment backfilling, it still might be used to predict the scour depth in tidal currents with reasonable practical accuracy. For this, an approach by Equation (9) and Figure 11 is proposed, which can be used to quantify differences in scour depth stemming from studies in which different hydrographs were used to simulate a tidal current.
The results of this study can thus be used to assess the results of previous studies that utilize one of the described modelling techniques and, consequently allow a further improvement of scour prediction for foundation structures in tidal current dominated waters. In addition, the findings of this study can be of great importance for the physical modelling of tidal currents in facilities which are not able to change flow direction or continuously adapt the flow velocity.
Author Contributions
Concept development, A.S. and A.H.; Investigation including conducting the laboratory tests, developing the methodology and carrying out the analysis of results, A.S. and M.W.; writing—original draft preparation and visualization, A.S.; writing—review and editing, M.W., A.H., T.S. and T.-W.H.; supervision, T.S. and T.-W.H.; project administration, A.H.; funding acquisition, T.S.
Funding
The authors gratefully acknowledge the support of the German Federal Ministry for Economic Affairs and Energy within the funded project “Giga-Wind Life” (BMWI: 0325575A). The publication of this article was funded by the Open Access Fund of the Leibniz Universität Hannover.
Acknowledgments
Furthermore, the authors thank Y. Hashemi, C. Schierl and M. Sultygov for their support in conducting the laboratory experiments and the Federal Maritime and Hydrographic Agency of Germany (BSH) for providing tidal field data from the FINO 1 platform within the RAVE (research at alpha ventus) initiative. A. Schendel was also supported by the Centre of Excellence of Ocean Engineering at the National Taiwan Ocean University in Keelung, Taiwan.
Conflicts of Interest
The authors declare no conflict of interest.
Notation
| , , | = fitting coefficients; |
| = pile diameter; | |
| = grain size for which 16% of the material by weight is finer; | |
| = grain size for which 50% of the material by weight is finer; | |
| = grain size for which 84% of the material by weight is finer; | |
| = Froude number; | |
| = acceleration due to gravity; | |
| = water depth; | |
| = number of tidal half cycles; | |
| = pile Reynolds number; | |
| = scour depth; | |
| = final scour depth at the end of a test; | |
| = maximum scour depth at a time; | |
| = specific gravity of the sediment; | |
| = time scale of scour applied by integration; | |
| = reference time; | |
| = time; | |
| = time to development final scour depth ; | |
| = stream-wise component of flow velocity; | |
| = critical approach flow velocity; | |
| = mean flow component of stream-wise velocity averaged over the duration of a tidal half cycle; | |
| = reference flow velocity; | |
| = maximum flow component of stream-wise velocity within tidal currents; | |
| = mean flow component of stream-wise velocity within tidal currents; | |
| = time-averaged flow component of stream-wise velocity; | |
| = dimensionless effective flow work; | |
| = normalised scour depth; | |
| = reference length; | |
| = difference in scour depth at the pile between streamwise positions; | |
| = maximum value of the Shields parameter; | |
| = density of water; | |
| = density of sediment; | |
| = geometric standard deviation of the sediment; |
References
- Kothyari, U.C.; Garde, R.J.; Ranga Raju, K.G. Temporal variation of scour depth around circular bridge piers. J. Hydraul. Eng. 1992, 118, 1091–1106. [Google Scholar] [CrossRef]
- Chang, W.-Y.; Lai, J.-S.; Yen, C.-L. Evolution of scour depth at circular bridge piers. J. Hydraul. Eng. 2004, 130, 905–913. [Google Scholar] [CrossRef]
- Lai, J.-S.; Chang, W.-Y.; Yen, C.-L. Maximum local scour depth at bridge piers under unsteady flow. J. Hydraul. Eng. 2009, 135, 609–614. [Google Scholar] [CrossRef]
- Hager, W.H.; Unger, J. Bridge pier scour under flood waves. J. Hydraul. Eng. 2010, 136, 842–847. [Google Scholar] [CrossRef] [Green Version]
- Borghei, M.S.; Kabiri-Samani, A.; Banihashem, S.A. Influence of unsteady flow hydrograph shape on local scouring around bridge pier. Proc. Inst. Civ. Eng. Water Manag. 2012, 165, 473–480. [Google Scholar] [CrossRef]
- Pizarro, A.; Ettmer, B.; Manfreda, S.; Rojas, A.; Link, O. Dimensionless effective flow work for estimation of pier scour caused by flood waves. J. Hydraul. Eng. 2017, 143, 06017006. [Google Scholar] [CrossRef]
- Link, O.; Castillo, C.; Pizarro, A.; Rojas, A.; Ettmer, B.; Escauriaza, C.; Manfreda, S. A model of bridge pier scour during flood waves. J. Hydraul. Res. 2017, 55, 310–323. [Google Scholar] [CrossRef]
- Zanke, U. Kolke am Pfeiler in richtungskonstanter Strömung und unter Welleneinfluß. Mitt. Franzius Inst. Wasserbau Küsteningenieurwesen 1982, 54, 381–416. (In German) [Google Scholar]
- Escarameia, M.; May, R.W.P. Scour Around Structures in Tidal Flows; Report SR 521; HR Wallingford: Wallingford, UK, 1999. [Google Scholar]
- Jensen, M.S.; Høgedal, M.; Frigaard, P. Offshore Wind Turbines Situated in Areas with Strong Currents; Report No. 6004RE01ER1; Offshore Centre Danmark: Esbjerg, Denmark, 2006. [Google Scholar]
- McGovern, D.J.; Ilic, S.; Folkard, A.M.; McLelland, S.J.; Murphy, B. Time development of scour around a cylinder in simulated tidal currents. J. Hydraul. Eng. 2014, 140, 04014014. [Google Scholar] [CrossRef]
- Porter, K.E.; Simons, R.P.; Harris, J.M. Laboratory investigation of scour development through a spring-neap tidal cycle. In Proceedings of the 7th International Conference on Scour and Erosion, Perth, Australia, 2–4 December 2014; pp. 667–677. [Google Scholar]
- Yao, W.; An, H.; Draper, S.; Cheng, L.; Zhao, M.; Jesudoss, J.S.; Tang, G. Experimental study of local scour around piles in tidal currents. In Proceedings of the 20th Australasian Fluid Mechanics Conference, Perth, Australia, 5–8 December 2016. [Google Scholar]
- Schendel, A.; Hildebrandt, A.; Schlurmann, T. Experimental study on the progression of scour around a monopile in unidirectional and tidal currents. In Proceedings of the 6th International Conference on the Application of Physical Modelling in Coastal and Port Engineering and Science (Coastlab16), Ottawa, ON, Canada, 10–13 May 2016. [Google Scholar]
- Schendel, A.; Hildebrandt, A.; Goseberg, N.; Schlurmann, T. Processes and evolution of scour around a monopile induced by tidal currents. Coast. Eng. 2018, 139, 65–84. [Google Scholar] [CrossRef]
- Schendel, A.; Goseberg, N.; Schlurmann, T. Erosion stability of wide-graded quarry-stone material under unidirectional current. J. Waterw. PortCoast. Ocean Eng. 2016, 142, 04015023. [Google Scholar] [CrossRef] [Green Version]
- Melville, B.W. Pier and abutment scour: An integrated approach. J. Hydraul. Eng. 1997, 123, 125–136. [Google Scholar] [CrossRef]
- Margheritini, L.; Martinelli, L.; Lamberti, A.; Frigaard, P. Scour around monopile foundation for offshore wind turbine in the presence of steady and tidal currents. In Proceedings of the International Conference on Coastal Engineering, ICCE, San Diego, CA, USA, 3–8 September 2006; pp. 2330–2342. [Google Scholar]
- Soulsby, R.; Clarke, S. Bed Shear-Stresses Under Combined Waves and Currents on Smooth and Rough Beds; Technical Report 137; HR Wallingford: Wallingford, UK, 2005. [Google Scholar]
- Ettema, R. Scour at Bridge Piers; Report No. 216; University of Auckland: Auckland, New Zealand, 1980. [Google Scholar]
- Fredsøe, J.; Sumer, B.M.; Arnskov, M.M. Time scale for wave/current scour below pipelines. Int. J. Offshore Polar Eng. 1992, 2, 13–17. [Google Scholar]
- Fuhrmann, D.R.; Cüneyt, B.; Sumer, B.M.; Jacobsen, N.G.; Fredsøe, J. Numerical simulation of wave-induced scour and backfilling processes beneath submarine pipelines. Coast. Eng. 2014, 94, 10–22. [Google Scholar] [CrossRef]
- Welzel, M.; Schendel, A.; Hildebrandt, A.; Schlurmann, T. Scour development around a jacket structure in combined waves and current conditions compared to monopile foundations. Coast. Eng. 2019, 152, 103515. [Google Scholar] [CrossRef]
- Sumer, B.M.; Christiansen, N.; Fredsøe, J. Time scale of scour around vertical pile. In Proceedings of the 2nd International Offshore and Polar Engineering Conference, San Francisco, CA, USA, 14–19 June 1992. [Google Scholar]
- Breusers, H.N.C.; Nicollet, G.; Shen, H.W. Local scour around cylindrical piers. J. Hydraul. Res. 1977, 15, 211–252. [Google Scholar] [CrossRef]
- Lee, S.; Sturm, T. Effect of sediment size scaling on physical modeling of bridge pier scour. J. Hydraul. Eng. 2009, 135, 793–802. [Google Scholar] [CrossRef]
- López, G.; Teixeira, L.; Ortega-Sánchez, M.; Simarro, G. Estimating final scour depth under clear-water flood waves. J. Hydraul. Eng. 2014, 140, 328–332. [Google Scholar] [CrossRef]
Figure 1.
Experimental setup in side-view. Dimensions in centimeter, not to scale. Adapted from [15].
Figure 1.
Experimental setup in side-view. Dimensions in centimeter, not to scale. Adapted from [15].

Figure 2.
Image of transparent pile with measurement grid.

Figure 3.
Positions of scour measurement around the pile.

Figure 4.
Flow-velocity time series (hydrographs) of streamwise flow velocity for (a) tests Tide04 and Uni04, (b) Test01 and Test02, (c) Test03, (d) Test04 and (e) Test05.
Figure 4.
Flow-velocity time series (hydrographs) of streamwise flow velocity for (a) tests Tide04 and Uni04, (b) Test01 and Test02, (c) Test03, (d) Test04 and (e) Test05.

Figure 5.
Scour progression over time depicted as interpolated pattern of scour depths around the pile for (a) Tide04, (b) Test01, (c) Test02, (d) Test03 and (e) Test05.
Figure 5.
Scour progression over time depicted as interpolated pattern of scour depths around the pile for (a) Tide04, (b) Test01, (c) Test02, (d) Test03 and (e) Test05.

Figure 6.
Scour progression over time depicted as interpolated pattern of scour depths around the pile for (a) Uni04, (b) Test04.
Figure 6.
Scour progression over time depicted as interpolated pattern of scour depths around the pile for (a) Uni04, (b) Test04.

Figure 7.
Development of differences in scour depth between the streamwise directions, 90° and 270°, over time in absolute values. Negative values indicate larger scour depth on the initial upstream side of the pile, whereas positive values indicate larger scour depth on the initial downstream side.

Figure 8.
Development of maximum scour depth over time. Comparison of test Tide04 with (a) Uni04, (b) Test01 and Test02, (c) Test03, (d) Test04 and (e) Test05.
Figure 8.
Development of maximum scour depth over time. Comparison of test Tide04 with (a) Uni04, (b) Test01 and Test02, (c) Test03, (d) Test04 and (e) Test05.

Figure 9.
Physical scour rate of maximum scour depth over time for the first two tidal half cycles.

Figure 10.
(a) Relative effective flow work against final scour depth with respect to test Tide04. (b) Relative effective flow work against time scale with respect to test Tide04.
Figure 10.
(a) Relative effective flow work against final scour depth with respect to test Tide04. (b) Relative effective flow work against time scale with respect to test Tide04.

Figure 11.
Normalized final scour depth as a function of dimensionless effective flow work.

Figure 12.
Comparison of predicted and measured final scour depths. Dashed lines indicate 25% deviation.
Figure 12.
Comparison of predicted and measured final scour depths. Dashed lines indicate 25% deviation.


Table 1.
Properties of bed material, in which represents the grain size for which x% of the material by weight is finer.
Table 1.
Properties of bed material, in which represents the grain size for which x% of the material by weight is finer.
| (kg/m3) | (mm) | (mm) | (mm) | (-) | (m/s) | |
|---|---|---|---|---|---|---|
| Quartz sand | 2650 | 0.12 | 0.19 | 0.25 | 1.4 | 0.295 |
Table 2.
Experimental conditions with as the time averaged streamwise flow velocity. , and are based on , which is the maximum flow velocity within a test. The Shields parameter is calculated based on the bed shear stress approach by Soulsby and Clarke [19].
Table 2.
Experimental conditions with as the time averaged streamwise flow velocity. , and are based on , which is the maximum flow velocity within a test. The Shields parameter is calculated based on the bed shear stress approach by Soulsby and Clarke [19].
| Test | ||||||||||
|---|---|---|---|---|---|---|---|---|---|---|
| (m/s) | (m/s) | (−) | (−) | (−) | (−) | (−) | (min) | (mm) | (min) | |
| Tide04 1 | 0.29 | 0.45 | 1.53 | 0.126 | 6.8 × 10⁴ | 0.203 | 6.06 | 467 | 163.8 | 61.47 |
| Uni04 1 | 0.31 | 0.31 | 1.05 | 0.060 | 4.7 × 10⁴ | 0.140 | 1.71 | 481 | 154.4 | 65.58 |
| Test01 | 0.41 | 0.45 | 1.53 | 0.126 | 6.8 × 10⁴ | 0.203 | 15.2 | 467 | 187.5 | 42.05 |
| Test02 | 0.26 | 0.28 | 0.95 | 0.049 | 4.2 × 10⁴ | 0.126 | 0.53 | 467 | 115.0 | 70.99 |
| Test03 | 0.28 | 0.42 | 1.42 | 0.110 | 6.3 × 10⁴ | 0.190 | 4.03 | 465 | 155.0 | 61.39 |
| Test04 | 0.28 | 0.46 | 1.56 | 0.132 | 6.9 × 10⁴ | 0.208 | 5.02 | 466 | 177.5 | 74.34 |
| Test05 | 0.27 | 0.44 | 1.49 | 0.121 | 6.6 × 10⁴ | 0.199 | 4.51 | 467 | 152.5 | 54.81 |
1 Reference tests from Schendel et al. [15].
© 2019 by the authors. Licensee MDPI, Basel, Switzerland. This article is an open access article distributed under the terms and conditions of the Creative Commons Attribution (CC BY) license (http://creativecommons.org/licenses/by/4.0/).
Share and Cite
MDPI and ACS Style
Schendel, A.; Welzel, M.; Hildebrandt, A.; Schlurmann, T.; Hsu, T.-W. Role and Impact of Hydrograph Shape on Tidal Current-Induced Scour in Physical-Modelling Environments. Water 2019, 11, 2636. https://doi.org/10.3390/w11122636
AMA Style
Schendel A, Welzel M, Hildebrandt A, Schlurmann T, Hsu T-W. Role and Impact of Hydrograph Shape on Tidal Current-Induced Scour in Physical-Modelling Environments. Water. 2019; 11(12):2636. https://doi.org/10.3390/w11122636
Chicago/Turabian StyleSchendel, Alexander, Mario Welzel, Arndt Hildebrandt, Torsten Schlurmann, and Tai-Wen Hsu. 2019. "Role and Impact of Hydrograph Shape on Tidal Current-Induced Scour in Physical-Modelling Environments" Water 11, no. 12: 2636. https://doi.org/10.3390/w11122636
Note that from the first issue of 2016, this journal uses article numbers instead of page numbers. See further details here.