Article

Solar Septic Tank: Next Generation Sequencing Reveals Effluent Microbial Community Composition as a Useful Index of System Performance

by
Stephanie Connelly
1,*,†,
Tatchai Pussayanavin
2,3,†,
Richard J. Randle-Boggis
1,
Araya Wicheansan
2,
Suparat Jampathong
2,
Ciara Keating
1,
Umer Z. Ijaz
1,
Willian T. Sloan
1 and
Thammarat Koottatep
2
1
Division of Infrastructure and Environment, James Watt School of Engineering, University of Glasgow, Glasgow G12 8LT, UK
2
School of Environment, Resources and Development, Asian Institute of Technology, Pathumthani 12120, Thailand
3
Faculty of Science, Ramkhamhaeng University, Bangkok 10240, Thailand
*
Author to whom correspondence should be addressed.
Joint first authors.
Water 2019, 11(12), 2660; https://doi.org/10.3390/w11122660
Submission received: 21 November 2019 / Revised: 11 December 2019 / Accepted: 12 December 2019 / Published: 17 December 2019
(This article belongs to the Section Wastewater Treatment and Reuse)

Abstract

:
Septic tanks are widely deployed for off-grid sewage management but are typified by poor treatment performance, discharge of polluting effluents and the requirement for frequent de-sludging. The Solar Septic Tank (SST) is a novel septic tank design that uses passive heat from the sun to raise in-tank temperatures and improves solids degradation, resulting in a cleaner effluent. Treatment has been shown to exceed conventional systems, however, the underlying biology driving treatment in the system is poorly understood. We used next generation sequencing (Illumina Miseq (San Diego, CA, USA), V4 region 16S DNA) to monitor the microbiology in the sludge and effluent of two mature systems, a conventional septic tank and an SST, during four months of routine operation in Bangkok, Thailand, and evaluated the ecology against a suite of operating and performance data collected during the same time period. Significant differences were observed between the microbiome of the sludge and effluent in each system and the dominant taxa in each appeared persistent over time. Furthermore, variation in the microbial community composition in the system effluents correlated with effluent water quality and treatment performance parameters, including the removal of chemical and biochemical oxygen demand and the concentration of fecal and total coliforms in the effluent. Thus, we propose that a wide-scale survey of the biology underlying decentralised biotechnologies for sewage treatment such as the SST could be conducted by sampling system effluent rather than sampling sludge. This is advantageous as accessing sludge during sampling is both hazardous and potentially disruptive to the anaerobic methanogenic consortia underlying treatment in the systems.

1. Introduction

Across the global north and south alike, septic tanks are amongst the most widely used household-scale sewage management systems employed in the absence of centralised sewerage networks [1]. The septic tank design targets low-cost treatment of sewage primarily by separation of the solid and liquid fractions of the waste and passive anaerobic digestion (AD) of retained solids [2]. Post separation, the liquid fraction may be discharged to the environment, typically after a retention of only 1–2 days when serving combined grey and blackwater sources. Retained solids, by design, accumulate over time. In so doing, accumulated solids gradually serve to reduce effective tank volume, liquid retention time and indeed, treatment efficiency until, at some ill-defined fill-level, the tank is deemed ‘full’ and requires costly de-sludging [3]. As such, septic tanks are associated with highly variable performance, polluting and often pathogenic effluents and ongoing and unpredictable maintenance costs [1,4,5,6]. Indeed, whilst serving an estimated one in four households in the US [7] and Europe [1] and the majority of urban households in South East Asia [8], failure rates in septic tank systems are estimated to be in the range of 20–80% [3,7].
The Solar Septic Tank (SST) is an emerging technology that aims to engineer the biology in septic systems to enhance the degradation of solids and increase the quality of effluent [6]. The SST has a central chamber that is heated via a low-cost coil to 50–60 °C using passive solar heat collection (Figure 1). Prior to discharge, liquid effluent passes through the central chamber, promoting partial pasteurization and resulting in a 3–5 log-fold reduction in the number of E. coli present in the effluent [6]. Further, heat from the central chamber is passively transferred to the rest of the tank to increase tank temperature, promoting enhanced microbial degradation of both soluble compounds and retained solids.
Pilot operation of SST systems in the field supports the intuition that temperature increase within the mesophilic range increases the rate of biodegradation [6]. However, as with any anaerobic treatment technology, there are a range of additional anthropogenic and environmental factors that will affect the biology and consequently, degradation rates in anaerobic digesters. These include: wastewater composition [9,10,11], hydraulic and organic loading rates [12,13,14,15,16], nitrogen and phosphorous availability [17,18], and trace element availability [19,20,21]. It is increasingly understood that if we are to engineer the biology in AD systems, we must improve our understanding of the biology in relation to process performance and tease out the identity of organisms that indicate both optimal and failing performance [22]. Yet, observation of the biology in septic systems remains rare relative to the wealth of the literature on industrial-scale AD. We argue that the adoption of a microbial management rationale with respect to the operation of the small-scale, yet tremendously widely used, AD processes in septic tank systems is not just desirable but is essential if we are to effectively manage operation and avoid failures. For example, characterizing the variability in the microbiology underlying the AD processing that occurs in septic tanks could allow us to anticipate when the technologies will operate within acceptable bounds. However, determining reliable microbial performance indices will require an extensive study of many functioning septic tanks. Profiling the biology with molecular methods and correlating it with the operating conditions and the performance of a large number of spatially distributed systems is expensive and time consuming. Thus, prior to embarking on a major study, it is prudent to explore the microbial communities associated with a conventional septic tank (CT) and with the better-performing SST. Here, we employed environmental monitoring, next generation amplicon sequencing (V4 region 16S DNA, Illumina Miseq) and multivariate statistics to:
  • Qualitatively assess microbial community composition and persistence in the sludge and effluent from each of the CT and SST, operated under near-identical conditions, over a four-month time period;
  • Associate microbial community composition in the CT and SST with system operation and performance;
  • Assess the sampling locations in each system that most usefully explain performance variability. This will help guide the sampling strategy for an extensive study.

2. Materials and Methods

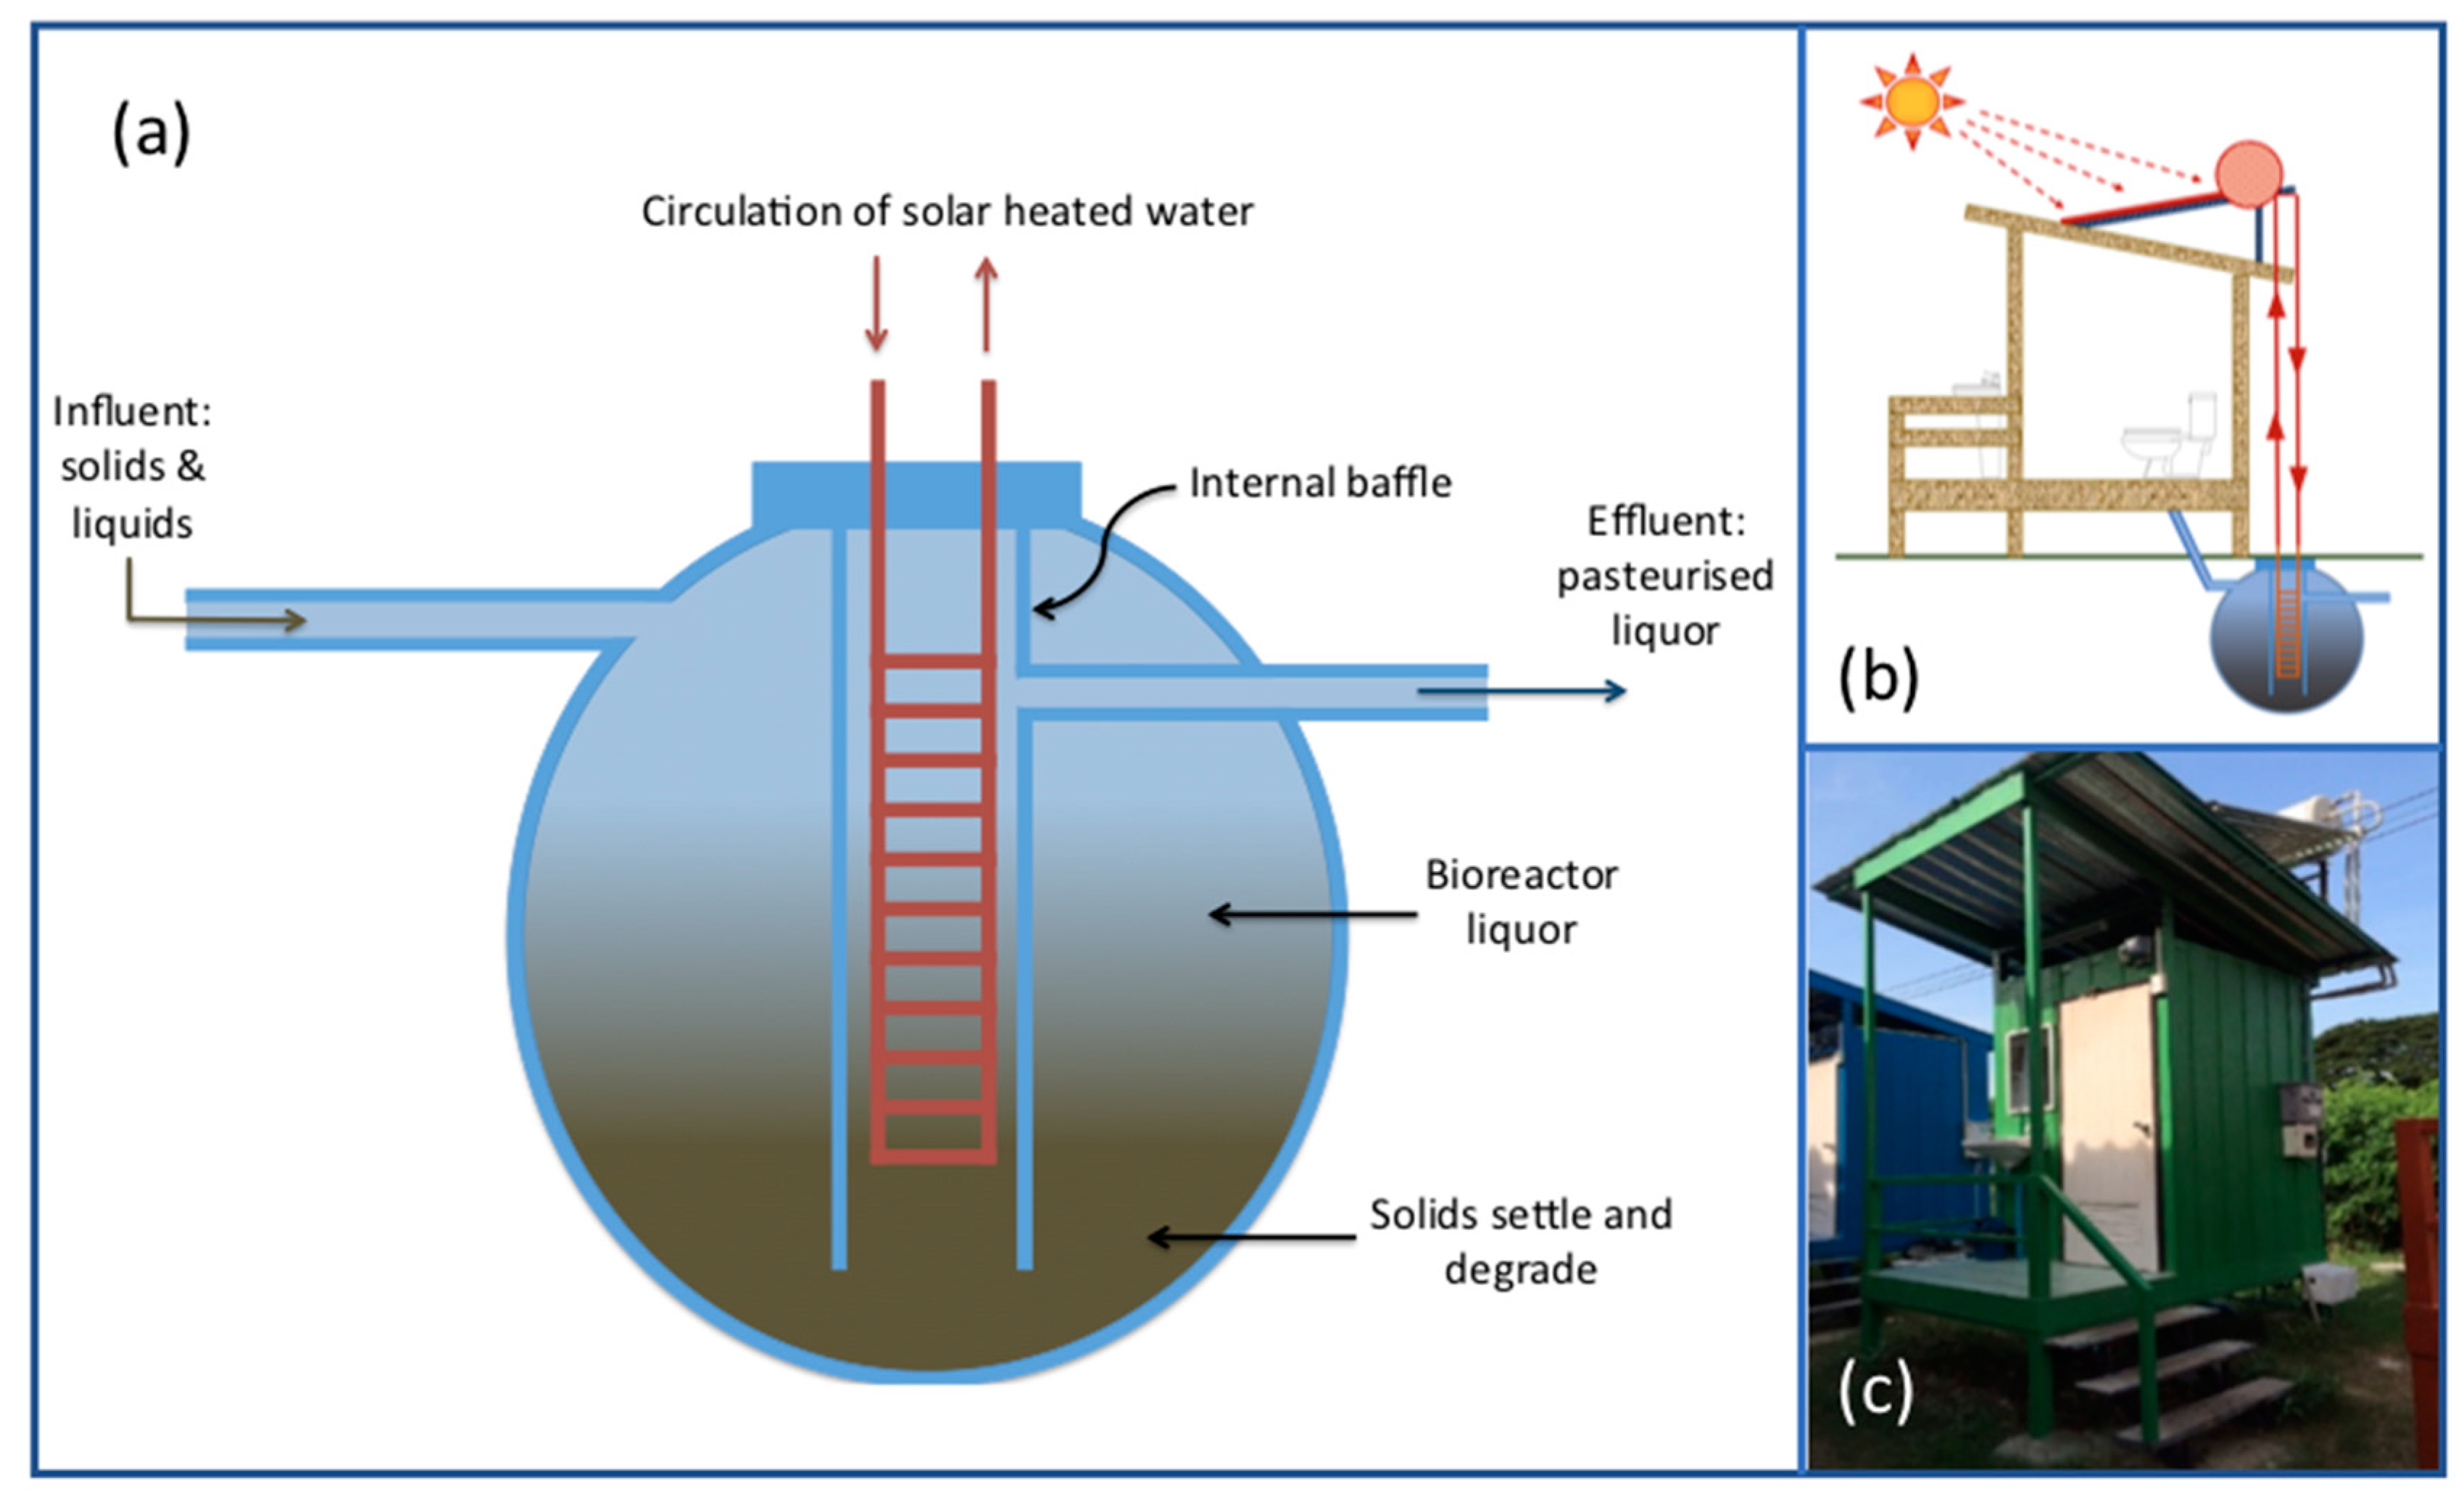
2.1. SST and CT System Design

Two septic tank systems were monitored; an SST (Figure 1) and a CT (Supplementary Materials Figure S1) installed and operated at a field test site in Khlong Luang, Thailand, for the treatment of domestic sewage. Each system is used as the primary sanitation facility for a household of 6 people and both were operated continuously, without emptying or desludging, for 2 years prior to commencement of the sampling campaign reported here. Both tanks have a 1000 L total working volume and discharge by overflowing, after receiving inflow from flushing of the toilet and are used to treat black water only. Each tank is buried with the upper surface (lid) at ground level, and so exposed to atmospheric temperatures; the bottom of the tank sits 1.5 m beneath ground level. The primary difference between the two test systems is that the SST includes a central chamber containing a heated copper coil (Figure 1a) connected to a passive solar heat collection system installed on the roof of the toilet block served by the SST (Figure 1b,c). Effluent from the SST passes through this heated central chamber with the intention that exposure to heat effects a reduction in pathogens prior to discharge by partial pasteurization. The systems were monitored during operation for a four-month period (July–November 2017).

2.2. Sampling

Influent, effluent and sludge samples were drawn biweekly for four months to enable a time series comprising physical and chemical monitoring data describing operation and performance of each system. Influent samples were taken by disconnecting the inflow to the septic tanks via a sampling valve for a period of 24 h in which wastes generated were collected in sealed bucket. The bucket contents were homogenised and three 1 L samples collected in storage bottles for downstream processing. As sampling of influent meant limiting flow to the septic tanks for 24 h, sludge and effluent samples were taken prior to influent samples to ensure the sludge and effluent samples were representative of the system under normal operating conditions. Effluent samples were taken by flushing the toilet once to clear the outflow pipe of residual material before collecting effluent in a 10 L bucket from the outflow pipe during a second flush. The effluent was mixed and three 1 L samples collected in 1 L glass bottles for downstream processing. To sample sludge, the lid at the top of the tank was opened and a submersible pump inserted and used to homogenise tank contents by mixing. Once mixed, tubing (2 cm internal diameter) was inserted to the tank and connected to an external vacuum pump (Sacco, Model SC-1A) to draw a 2 L sample into a plastic beaker. The beaker contents were mixed by stirring and four 50 mL sub-samples were taken in centrifuge tubes of which three were used for biological characterisation and one for physical and chemical monitoring. All samples were stored on ice for approximately two hours during transport to the laboratory. To enable time series describing system ecology, on return to the laboratory, three 30 mL sub-samples of effluent were taken and together with sludge samples, were stored at −20 °C until processed for DNA extraction. Influent samples were not processed for molecular characterisation in this study as obtaining biologically representative influent samples was not possible using our sampling method without significant disturbance to system operation. The remaining sample volumes which were used for physical and chemical monitoring were stored at 4 °C to be processed during the following two days. Given a lack of published precedent on heterogeneity of microbial communities in the sludge and effluent of septic systems, additional samples of sludge and effluent from the SST were taken to enable determination of variability in the microbial community associated with our sampling methods and to investigate the influence of DNA extraction method used on the microbial communities observed (Supplementary Materials 2).

2.3. Environmental Operation and Performance Monitoring

Ambient temperature at the test-site was recorded hourly using temperature sensors (PT-100 type HDP/7, SWK Technology, Chainat, Thailand) installed above ground. The in-tank temperature of the SST was recorded hourly using a temperature sensor positioned in the centre of the tank (PT-100 type HDP/7). Flow rate through each system was measured using an analogue flow meter (GMK, Asahi, Samut Prakan, Thailand). All other measurements were made bi-weekly on samples of influent and effluent from each system type to coincide with sampling of the sludge and effluent microbial communities and were measured according to the “Standard Methods for the Examination of Water and Wastewater” (APHA, AWWA and WEF, 2012). Chemical oxygen demand (COD), soluble COD (sCOD), total solids (TS), total suspended solids (TSS), total volatile solids (TVS) and biochemical oxygen demand (BOD) were measured to indicate carbon and solids loading in the system. Nutrient profiles were determined by measurement of Total Kjeldhal Nitrogen (TKN) measured using the Kjeldhal method, ammonia (NH3) concentration was determined by distillation and total phosphate (TP) concentration was measured using digestion and a stannous chloride indicator. E coli and total coliforms were measured using multiple tube fermentation procedures.

2.4. DNA Extraction

Frozen samples were thawed on ice. Three sub-samples of sludge and effluent at each time point were processed to generate technical triplicates with the exception of effluent samples at time points T1-3 which were processed in duplicate due to low sample volumes drawn at those times points. The 50 mL sludge samples were centrifuged at 5000 rpm for 10 min and the supernatant discarded. The remaining material was mixed and 2 g sub-samples aliquoted to 50 mL tubes. The aliquots were manually homogenised by grinding using a sterile glass rod for approximately 1 min. Effluent samples (30 mL) were centrifuged at 5000 rpm for 10 min, the supernatant was discarded, and the pellets used for DNA extraction.
DNA extraction was by a modified phenol:chloroform extraction method [23] as outlined in Keating et al. [24]. In brief, 0.25 g of the homogenised sludge or whole effluent pellet was transferred to a sterile Lysing Matrix E tube (MP Biomedical) prior to adding 250 μL of 5% cetyl trimethylammonium bromide (CTAB) extraction buffer and 250 μL of phenol-chloroform-isoamyl alcohol (25:24:1; pH 8) and processed without the use of phase-lock tubes. The integrity of the genomic DNA extracted from each sample was assessed using agarose gel electrophoresis and the DNA concentration was quantified using a Qubit v2.0 fluorometer (Life Technologies, Darmstadt, Germany). Negative controls were produced using 20 μL of nuclease-free water (Qiagen, Venlo, The Netherlands) per extraction and all other steps followed as per the extraction protocol.

2.5. Amplicon Library Preparation

Amplicon libraries were prepared for each sample (including the negative controls) using Golay barcoded primers targeting the V4 region of 16S DNA [25] but with an additional degeneracy on the forward primer for improved detection of Archaea as described previously [26]. E. coli DNA was used as a PCR positive control. Samples were assigned a unique barcode pair and amplification conducted in triplicate for each sample using the polymerase chain reaction (PCR) as follows: initial denaturation at 95 °C for five minutes; followed by 25 cycles of denaturation at 95 °C for 20 s, annealing at 62 °C for 15 s and extension at 72 °C for 40 s; and final elongation at 72 °C for one minute. The amplified samples were size-fragmented by gel electrophoresis (120V, 60 min) and size-selected using a Zymoclean™ Gel DNA Recovery kit (Zymo Research, Irvine, CA, USA). An equimolar 16S V4 library (2.8 ng/µL) was sequenced at the Earlham Institute (Norwich, UK) using a MiSeq DNA sequencer and V3 reagent kit (Illumina Inc., Hayward, CA, USA).

2.6. Bioinformatics and Statistical Analysis

Low-quality ends were removed from raw reads using Sickle (https://github.com/najoshi/sickle) with a phred quality threshold of 20. Paired-ends were merged using PANDAseq [27] with a 10 bp minimum overlap and unmerged singletons were removed. Sequences with ≥97% similarity were clustered and chimeras removed using VSEARCH [28]. Sequences were mapped to reference Operational Taxonomic Units (OTUs) using USEARCH [29]. OTUs were assigned taxonomies using Tax4Fun [30] and the SILVA 123 database. Rarefaction curves were used to estimate the degree of saturation achieved by sequencing with respect to species (OTU) richness. All statistical analyses used relative abundances calculated for each OTU or taxa in a given sample and included relatively abundant OTUs and taxa only (relative abundance >1%). Analyses were carried out with samples grouped as one of four sample types (SST Effluent, SST Sludge, CT Effluent and CT sludge). Community dissimilarity was estimated within and between sample types at OTU level using PCoA (Bray–Curtis dissimilarity) and significance was assayed using permANOVA (10,000 permutations). Significant differences in phylum and OTU relative abundances between sample types were tested for using ANOVA. Correlations between phyla relative abundances and environmental data were tested for using Pearson’s product moment correlation coefficient. P-values <0.05 and correlation coefficients (r) < −0.7 and > 0.7 were considered significant for all statistical tests. Where ANOVAs were performed, the samples between which significant differences exist were established using Tukey’s HSD post-hoc tests. Data processing was performed in python (Python Software Foundation, v. 2.7.15) and statistical analyses in R (R Core Team, 2012, v. 3.4.3). Raw sequence data are publicly accessible at https://www.ncbi.nlm.nih.gov/sra/PRJNA544293.

3. Results

3.1. Operation and Performance

The mean operating temperature (Table 1) of the SST (42.7 +/− 4.9 °C) was significantly higher (p <0.001) than that of the CT (37.2 +/− 4.5 °C in the CT) which is consistent with the inclusion of the solar heating system in the SST, although suggests that the core temperature in the SST was below target (50–60 °C). This may relate to diurnal temperature fluctuations in the SST arising from natural diurnal changes in solar radiation, which we propose should be investigated in future studies of this system. Volumetric, organic and solids loading rates (Table 1) were significantly higher (p < 0.001) in the SST than the CT. Difference in volumetric loading arose from more frequent use of the toilet served by the SST. Difference in COD (Table 1) into each system is less readily understood, especially as BOD (Table 1) into each system was not significantly different but suggests that chemicals were used in cleaning the toilet served by the SST during the sampling period. The nutrient profile of the influent (Table 1) of each system was relatively similar except for input of nitrogen as ammonia which was significantly lower (p < 0.01) in the SST than in the CT.
With respect to system performance (Table 2), both systems exhibited relative stability (low standard deviation relative to the mean) in treatment efficiency (TS, TVS, TSS, BOD, tCOD, sCOD removal (%) and effluent water quality (TS, TVS, TSS, BOD, TCOD, sCOD (mg/L) whilst nutrient removal (TP, TKN, NH3-N (%) was more variable in each case. The SST, however, was observed to exhibit a significantly better performance (treatment efficiency and effluent water quality) than the CT with respect to TS, TVS, TSS, BOD, tCOD and sCOD (Table 2) in spite of reduced hydraulic retention time arising from increased volumetric load. Thus, the better performance of the SST strengthens the case for improving understanding of the underlying biology with a view to enacting microbial management to reliably improve treatment in septic tanks.

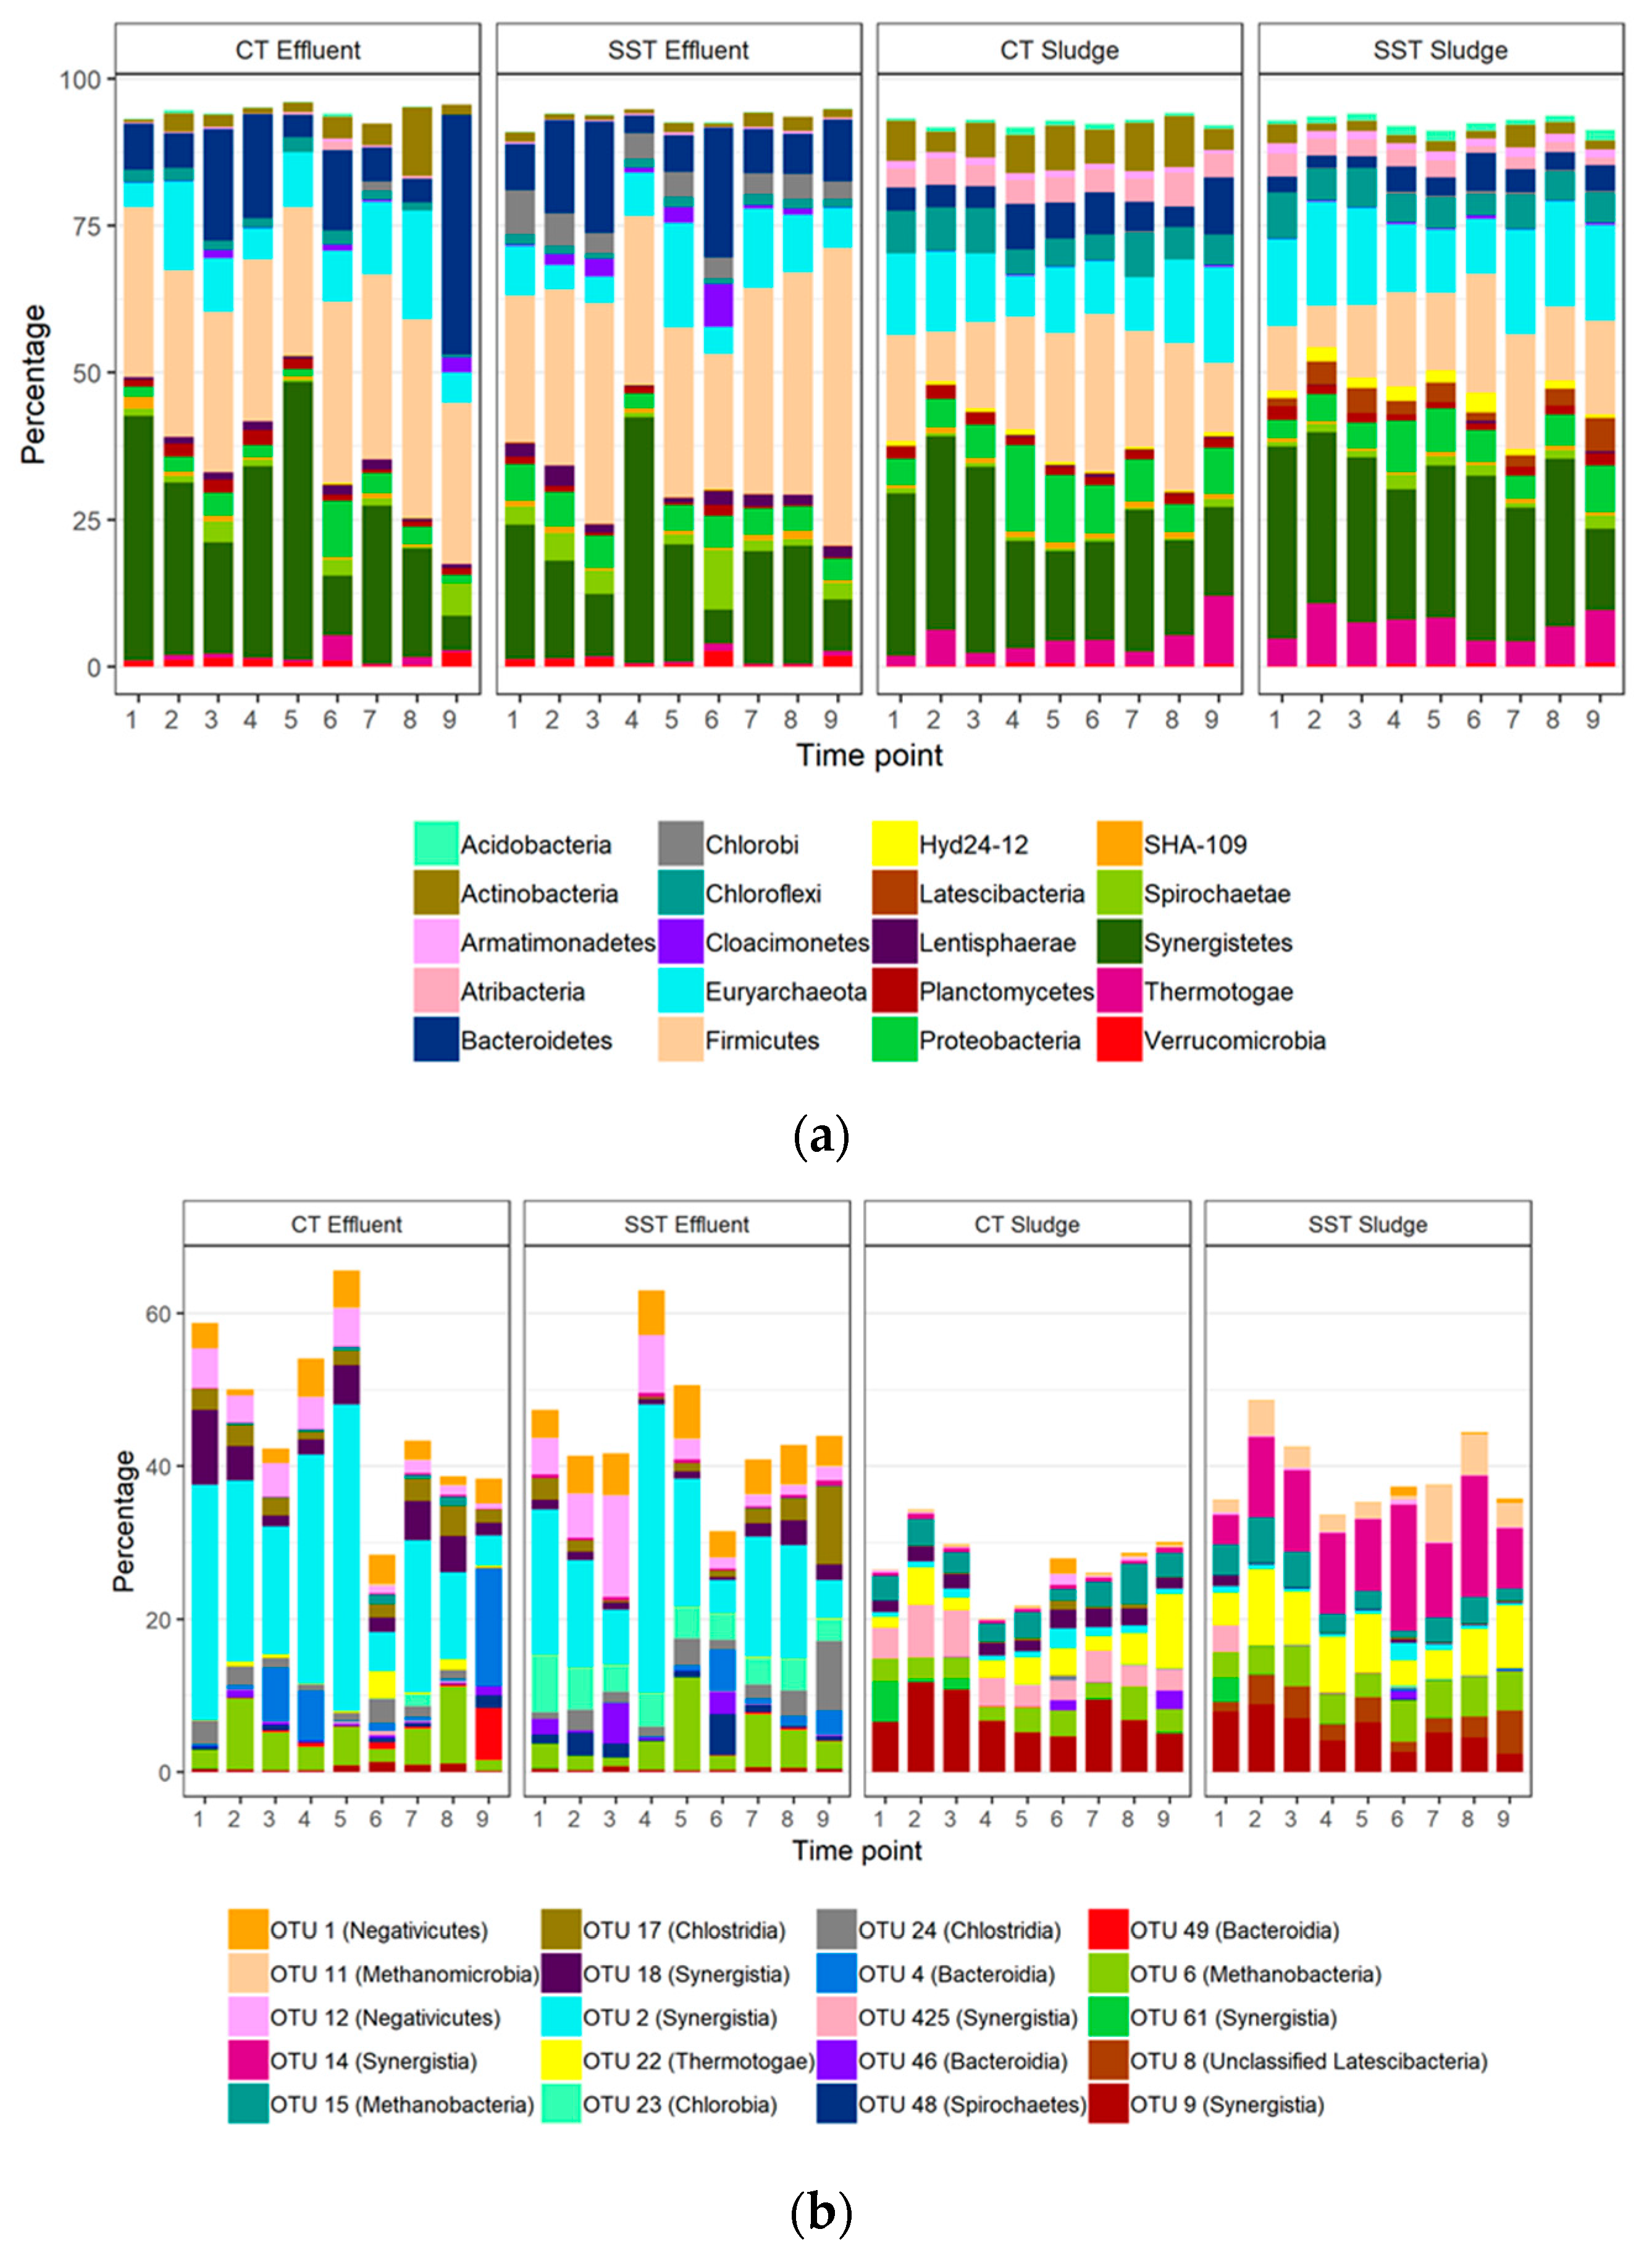
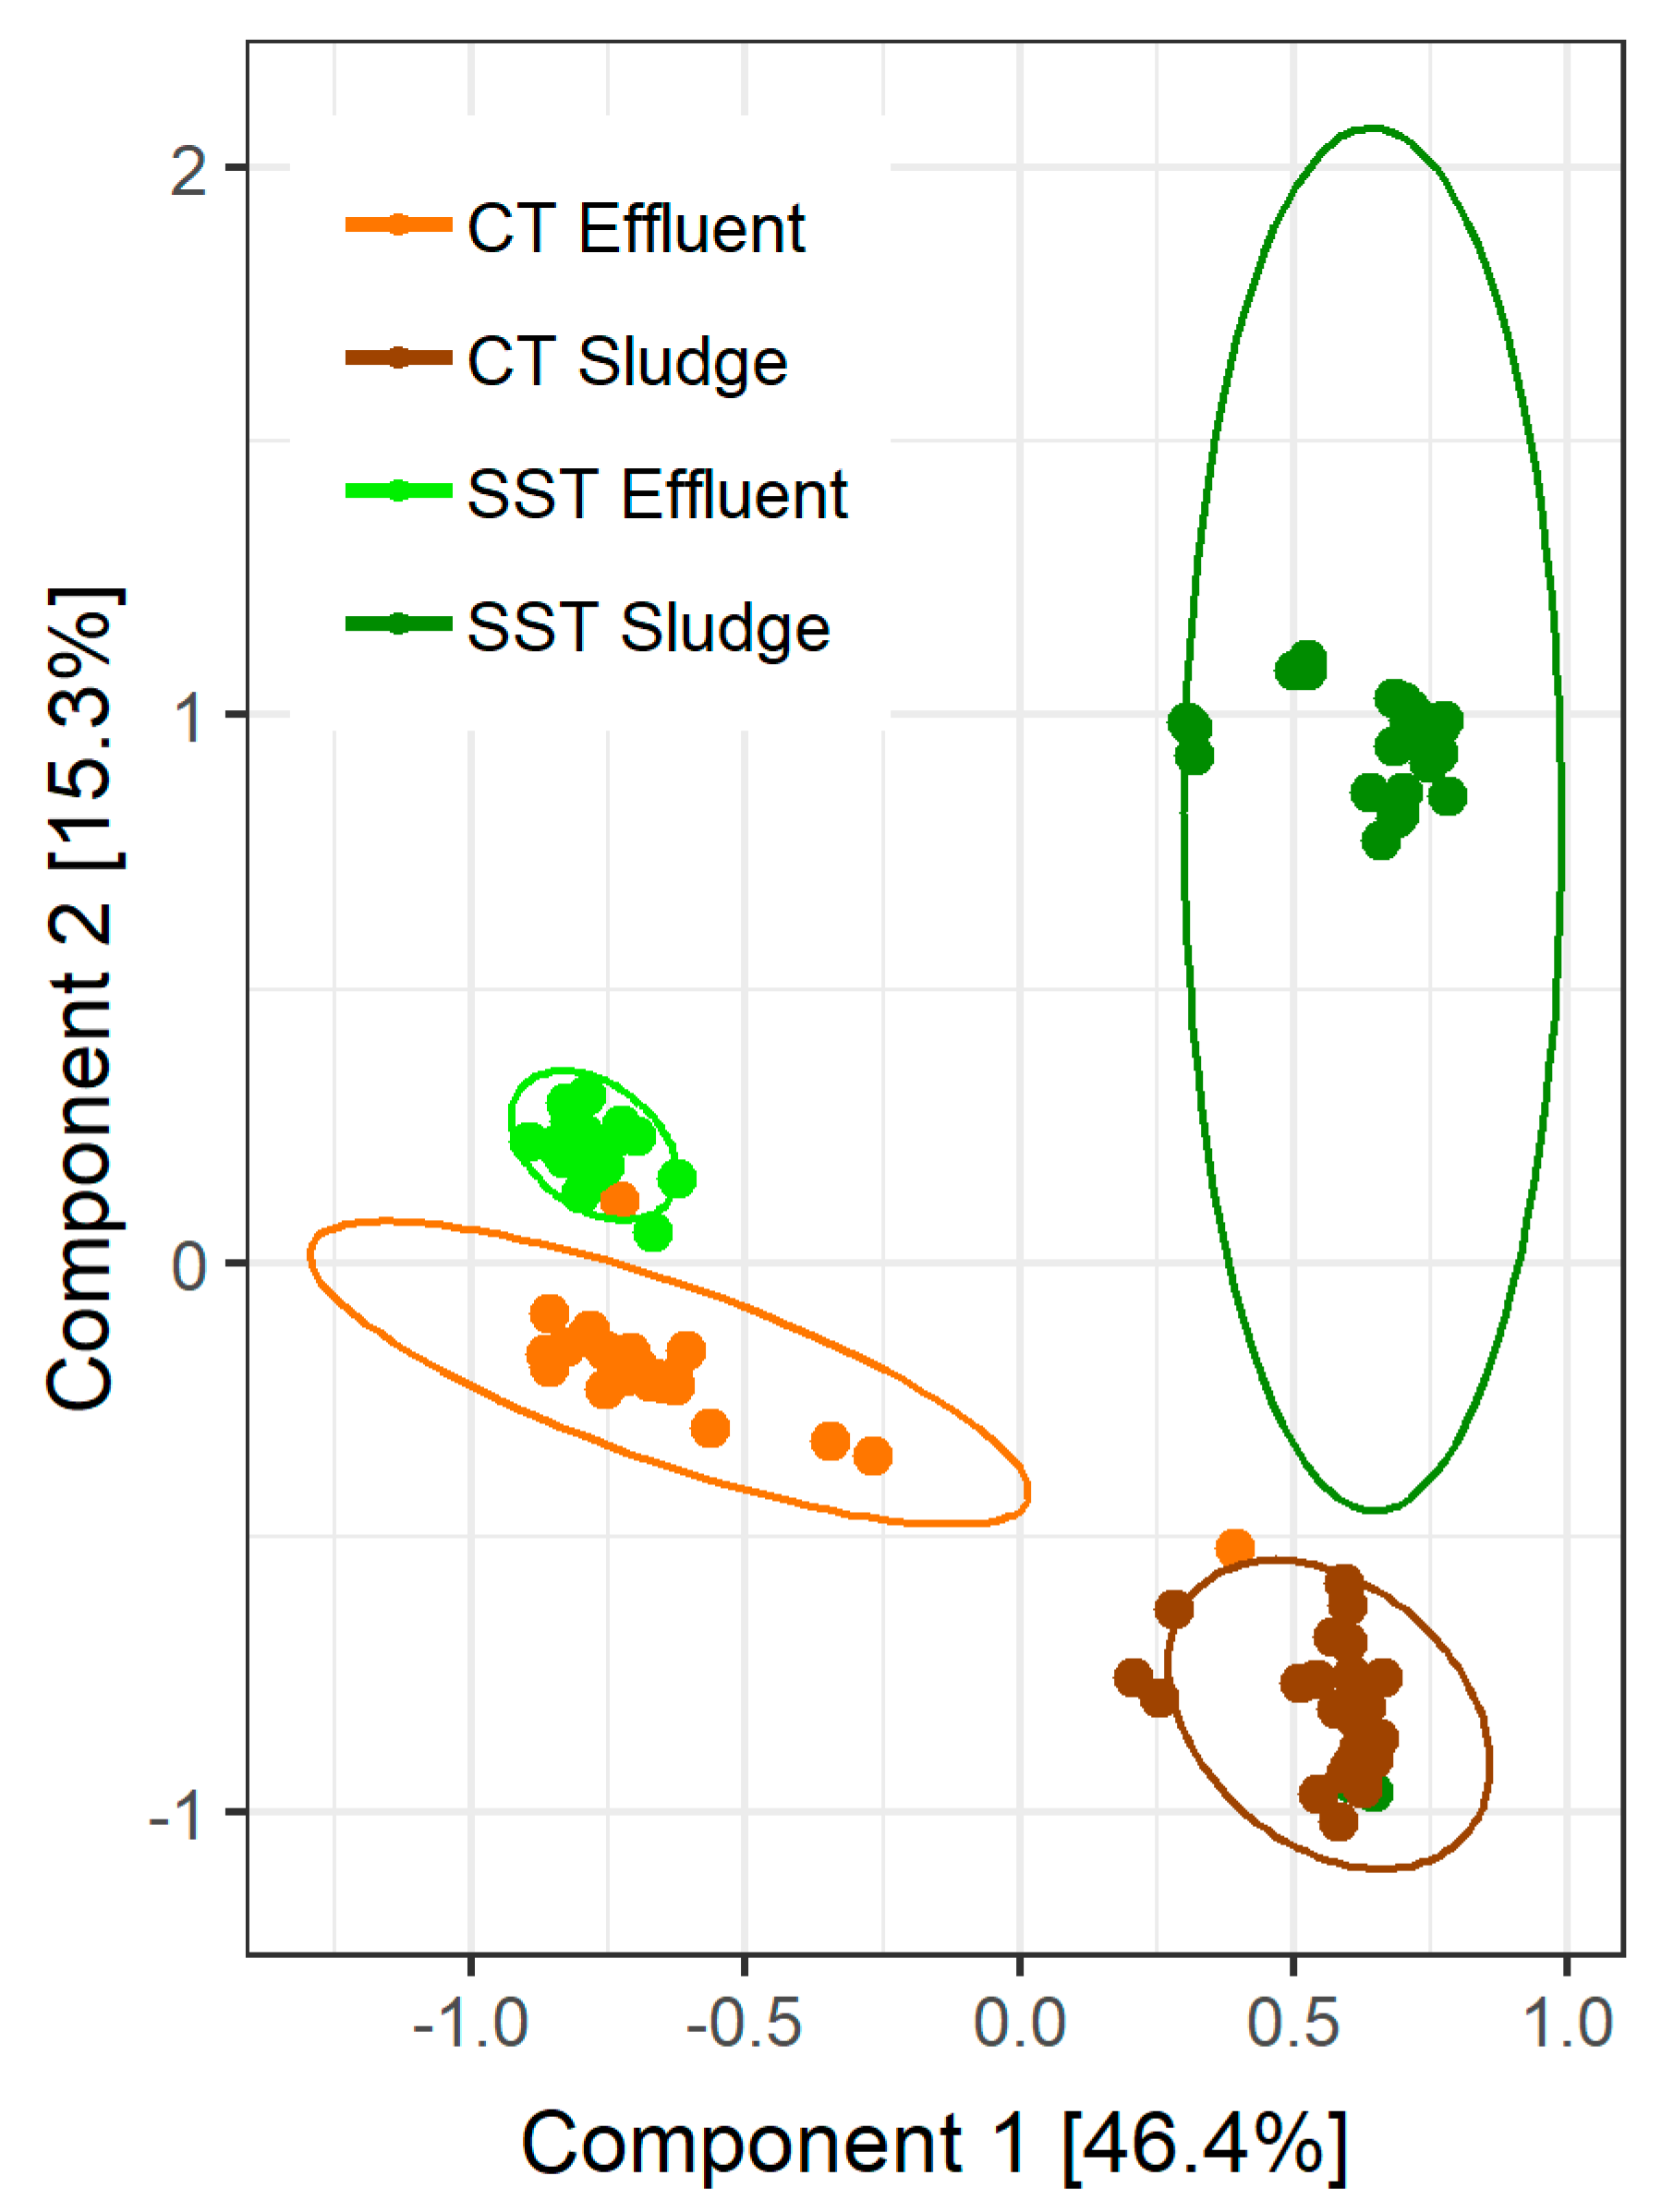
3.2. Microbial Community Composition and Sampling Variability

12,525,626 paired-end reads were returned, totaling 3.1 × 10⁹ bases and with a mean sample read count of 62,628 ± 16,405. The minimum read count was 5604. The mean phred quality score was 34.50 ± 0.65, and 86.7% of bases had a phred score of 30 or greater. Merging of paired-end reads generated 5,768,993 sequences for analysis after singletons were removed. Using 97% similarity to group and assign sequences to an OTU, we identified 5327 separate OTUs. Reads 273 ± 212 were observed in the negative control (0.4% of the mean read count). As such, no adjustment was made to sample sequences with respect the negative control. OTUs were assigned to 64 known phyla; 5.3% of OTUs were unassigned at phylum level. Rarefaction curves indicate that saturation with respect to species (OTU) richness was approached but not reached for each sample in the time series (Supplementary Materials 3), thus, only relatively abundant OTUs and taxa (relative abundance >1%) were included in the analysis. The sampling variability study revealed that the DNA extraction method influenced the observed microbial community composition in effluent but that differences were consistent within samples (Supplementary Materials 2 Figures S5 and S6). Community compositions revealed in effluent samples were found to be less variable within sample batches than sludge samples (Supplementary Materials 2 Figures S6a and S7). Thus, should sample number be a limiting factor in a wider sampling campaign due to cost for example, effluent samples may be a better choice of sample material than sludge.

3.3. Microbial Community Composition within and between Samples

Across the sample set, 25 phyla and 115 OTUs were determined to be relatively highly abundant (relative abundance >1% in each sample). At phylum level, both systems appeared to support microbial communities that were stable and in which the most relatively abundant phyla persisted in time in both sludge and effluent samples (Figure 2a). Amongst bacterial populations, the phylum Synergistetes was similarly relatively dominant in both the sludge and effluent of each (CT sludge: 22.0 ± 7.5%; SST sludge: 25.7 ± 6.2%; CT effluent: 25.8 ± 15.3%; SST effluent: 19.2 ± 11.0%) whilst the phylum Firmicutes was relatively more dominant in the effluent (CT sludge: 18.4 ± 6.3%; SST sludge: 14.2 ± 4.8%; CT effluent: 29.0 ± 6.4%; SST effluent: 33.6 ± 8.4%) of each system (Figure 2a). The phylum Euryarchaeota, which comprises all classes of methanogenic Archaea, was relatively highly abundant in both the sludge and effluent of each system (CT sludge: 11.8 ± 3.6%; SST sludge: 14.8 ± 4.3%; CT effluent: 9.8 ± 5.2%, SST effluent: 9.1 ± 4.7%, Figure 2a). Thus, each system appeared to be underpinned by microbial communities that had the potential to support complete degradation of organics by methanogenic anaerobic digestion.
Inspection of the dominant community at OTU level revealed that the stability and persistence of dominant phyla appeared to be underpinned by the stability and persistence of the most relatively abundant OTUs present in each sample type and in each system (Figure 2). However, differences in microbial community composition and structure between system type and sample type was more distinct at the OTU level than at the phylum level (Figure 2). In effluent samples, dominance of the phylum Synergistetes was underpinned by a single OTU (OTU 2, Figure 2b), which was significantly more abundant (p < 0.001) in effluent than sludge samples of each system type (Supplementary Materials 4). By contrast, the relative abundance of organisms of the phylum Synergistetes in sludge samples was associated with a broader diversity of OTUs. Of the phylum Synergistetes in CT sludge, OTUs 9, 18 and 425 were significantly more abundant than in the effluent (p < 0.001, Supplementary Materials 4) and in SST, sludge OTUs 9 and 14 were significantly more abundant that in effluent (p < 0.001, Supplementary Materials 4). OTUs 12, 17, 24 and 48 of the phylum Firmicutes were relatively highly abundant in each system type but were significantly more abundant in effluent samples than in sludge samples from each system (p < 0.005 in each in case except OTU 24 in CT which showed no significant difference, Supplementary Materials 4). Of the phylum Euryarchaeota, OTU 6 of the class Methanobacteria, comprising hydrogenotrophic and formate utilising methanogens [31], was relatively highly abundant in both the sludge and effluent of each system. In sludge samples OTU 15 of the class Methanobacteria was relatively highly abundant in both system types, whist OTU 11 of the class Methanomicrobia and genus Methanosaeta, comprising acetate utilising methanogens including those with optimal growth rates above 35 °C [31], was significantly more abundant in the SST sludge than in CT sludge (p < 0.001, Supplementary Materials 4). Thus, the improved treatment performance observed in the temperature-controlled SST may be associated with a more metabolically balanced methanogenic consortia. Community dissimilarity between samples of each type is confirmed at OTU level amongst the 100 most relatively abundant OTUs using Bray-Curtis as a metric (Figure 3) and the dissimilarity is determined as significant (permANOVA, f = 67.33, p < 0.001).

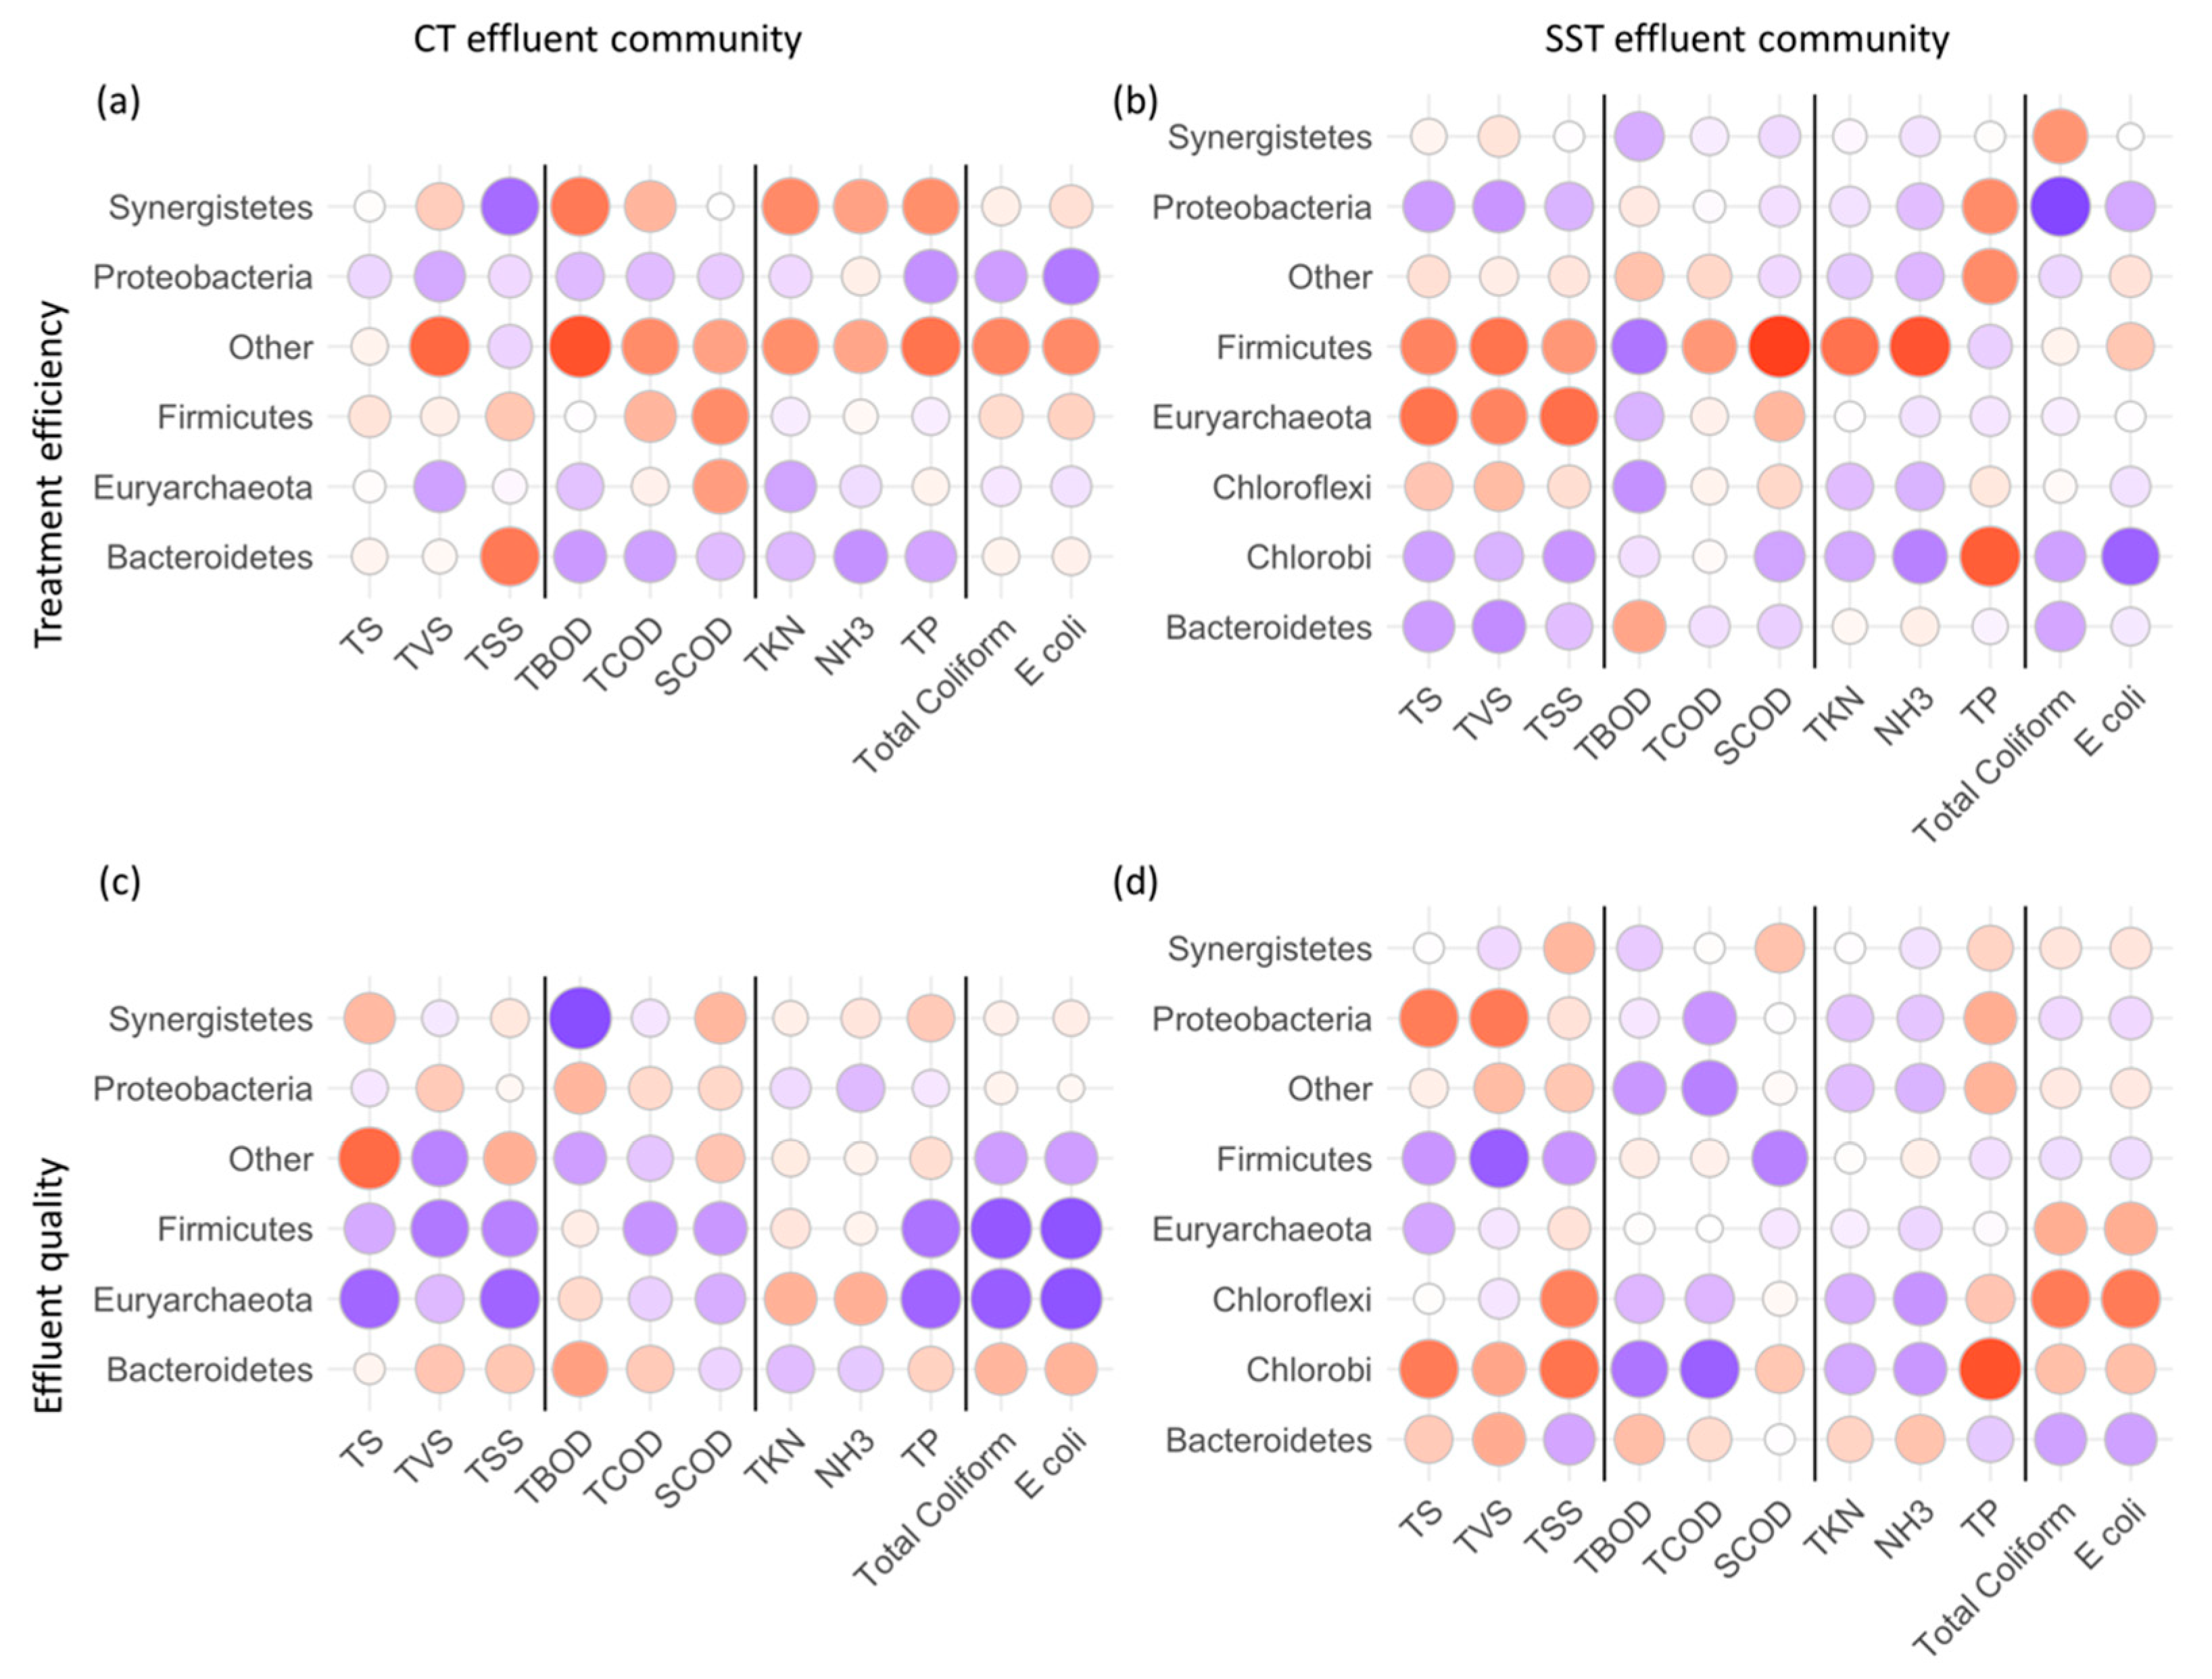
3.4. Correlating System Operation and Microbial Composition in Sludge and Effluent Samples

In each system, a greater number of phyla in sludge samples were observed to correlate with system operation than in effluent samples (Supplementary Materials 5). In the effluent of each system, a positive correlation was observed between loading rates (volumetric, organic and solids) and the relative abundance of Firmicutes and Euryarchaeota in system effluent; however, no consistent relationship was observed between those phyla in the sludge of each system and loading rates (Supplementary Materials 5). In sludge samples from each system, strong positive correlations were observed between system temperature and the relative abundance of the phyla Firmicutes and Bacteroidetes (Supplementary Materials 5); organisms in these phyla are associated with hydrolysis in full-scale anaerobic digestion [32,33]. Thus, assuming that the microbial community in the retained sludge is predominantly responsible for driving treatment in each system, the capacity to increase temperature in the SST could enable improved breakdown of solids, as was observed in this study, by temperature-associated selection of those phyla.

3.5. Microbial Taxa in Effluent Indexing Treatment Efficiency and Effluent Water Quality

Whilst a greater number of correlations were determined between operating condition and phyla in sludge samples, a number of strong correlations were identified between performance indicators and phyla in effluent samples (Figure 4). The relative abundance of five dominant phyla in the effluent (Synergistetes, Proteobacteria, Firmicutes, Bacteroidetes and Euryarchaeota) was observed to correlate with treatment efficiency of both systems (Figure 4a,b). An additional two phyla, Chlorobi and Chloroflexi, uniquely correlated with treatment efficiency in the SST (Figure 4b). Common to both systems, the change in abundance of Proteobacteria correlated strongly and positively with E. coli and total coliform removal efficiency and the phylum Firmicutes correlated strongly and negatively with sCOD removal efficiency. With respect treatment efficiency in the SST only, Chlorobi correlated strongly and positively with E. coli removal efficiency and Firmicutes and Euryarchaeota correlated strongly and negatively with TS, TSS and TVS removal efficiencies. Interestingly, if we compare the correlation in the abundances of the Chlorobi and the Firmicutes with all of the variables that measure treatment efficiency in the SST, the trends are diametrically opposed; that is, when one phlya is positively correlated with a variable the other is negatively correlated. We propose that there were sufficient data available to confirm such trends, that monitoring of (by example) Chlorobi and Firmicutes as paired ‘indices’ could be deployed as a proxy measure of treatment efficiency in the SST.
With respect effluent water quality for each system type, the same sub-set of phyla correlated with water quality parameters as for treatment efficiency (Figure 4c,d). In many instances, the correlation trend reversed as high removal efficiencies were associated with low concentrations of measured contaminants in the systems’ effluent. For example, in the SST, strong positive correlation of Proteobacteria with E. coli removal (Figure 4b) is reciprocated with strong negative correlation with E. coli counts in system effluent (Figure 4d). Similarly, positive correlations between Chlorobi and TS, TSS and TVS removal in the SST (Figure 4b) are reciprocated with negative correlation with respect to TS, TSS and TVS concentrations in system effluent (Figure 4d). The switch from negative to positive correlation between a given taxa and treatment efficiency and the same taxa and water quality is not observed across the board, however, the data set presented is small, and performance was relatively stable during the period of monitoring. Tentatively then, the data suggest that a broader survey of a greater number of septic tanks over a longer time period could reveal indicator microbes associated with both treatment efficiency and effluent water quality and that paired indices could be identified to add confidence if used as monitoring parameters.

4. Discussion

Microbiology in small-scale AD: Culture independent methods that enable interrogation of the underlying biology in large-scale AD technologies are widely recognised for their potential to deliver better process management [34,35], yet these methods have rarely been applied to septic tanks. However, we propose that the lack of effort given to understanding septic tank microbiology is remiss given that these systems are used to treat as much as 25% of domestic black water generated in the global north [1,7], and significantly more in urban South East Asia [8]. The appetite amongst researchers to systematically study septic tank microbiology is, perhaps, dulled by two factors: the prospect of having to sample many tanks to draw conclusions; and the knowledge that no control is exercised in septic tank operation. Extensive sampling using molecular methods comes at a cost; whilst the cost of sequencing continues to decline [36], the costs associated with the labour of sample preparation and data processing persist [36,37]. The lack of control means that inputs of carbon, nutrients and even chemical contaminants to septic systems can be highly variable and thus, it could be speculated that the microbiology will too, be highly variable. Our study revealed that the biology underlying the systems we observed was robust and that key phyla and species (OTUs) persisted over time. That key organisms identified were persistent even in light of minimal process control in the systems studied is, we believe, a promising finding with respect to identification of organisms indexing performance and the expense of an extensive study is warranted.
Microbial management of septic systems: It would require an extensive study of septic tanks to develop the robust relationships between operating conditions, the underlying biology and system performance that could inform microbial management strategies. Yet, even within the small dataset presented here, enticing differences were observed between the biology underpinning the CT and SST systems. Notably, in contrast to the CT, in the temperature-controlled SST the sludge both hydrogenotrophic and acetotrophic methanogens appeared relatively highly abundant, suggesting that improved performance might be associated with a functionally more balanced methanogenic consortia. In addition, correlation between temperature and the relative abundance of putatively hydrolytic organisms of the phyla Firmicutes and Bacteroidetes suggests that temperature control in septic systems could be manipulated to select beneficial microbial communities to increase the treatment efficiency of solids and hence, reduce the frequency of tank emptying. More broadly, amongst relatively abundant phyla revealed by sequencing samples from both systems, Bacteroidetes, Synergistetes, Chloroflexi and Proteobacteria, have been identified as part of a ‘core microbiome’ in large-scale anaerobic digesters [38], suggesting that whilst scale is greatly reduced here, key players in AD processes may be common across scales. Thus, our study demonstrates value in improving understanding of the function of septic systems as a means of implementing microbial management on a small scale and in the application of molecular methods as a means of doing so. We recognise that the molecular methods applied here are not without limitation. Using the V4 region of the 16S rRNA gene to characterise ecology we limit our capacity to ‘see’ organisms lacking the target sequence, we cannot distinguish active organisms from those whose DNA persists whilst activity may not, and, quantification is relative rather than absolute. In spite of this, our results are promising and bode well for targeted application of a broader range of methods including omics approaches and quantitative PCR to reveal relationships between system function, performance and management.
Implications for the field: The contribution of spread of contaminants to the environment arising from widespread use of poorly managed septic systems is likely underestimated and as such, development of improved management and monitoring schemes is imperative [1]. This, in-turn, makes well-funded scientific studies of small-scale AD essential. The results obtained here cement the case for a broader survey of both SSTs in the field and for application of molecular methods to the study of septic tanks. For both the SST and CT studied, sludge sampling was an invasive process that required accessing and removing the lids of the tanks and performing in-tank mixing using a pump system before drawing sludge samples. This is likely to cause significant disturbance to the microbial community in the sludge bed and almost certainly resulted in intrusion of air into what appears to be an anaerobic system. Thus, determining that microbial indices of treatment efficiency and discharge water quality were identifiable in the effluent of the system suggests that larger-scale studies might focus sampling efforts on the more readily accessible microbial communities that comprise the discharge from septic tanks. This is a significant finding for others aiming to undertake similar studies which we believe are vital if we are to protecting soil and aquatic ecosystems from anthropogenic pollution from septic systems.

Supplementary Materials

The following are available online at https://www.mdpi.com/2073-4441/11/12/2660/s1.

Author Contributions

The study was Conceptualized by S.C., T.P., C.K., R.J.R.-B., T.K. and W.T.S. Sampling, environmental measurements and initial molecular work was conducted T.P., A.W. and S.J. Sequencing library preparation was conducted by R.J.R.-B. with input from S.C. and C.K. Bioinformatics was conducted by R.J.R.-B. using a pipeline developed by U.Z.I. Data analysis was conducted by S.C., T.P., C.K., A.W., S.J. and R.J.R.-B. S.C. wrote the original manuscript which was reviewed and edited by all authors. Funding acquisition was by S.C., U.Z.I., W.T.S. and T.K. with input from C.K.

Funding

The research was funded by the Engineering and Physical Sciences Research Council (EPSRC), UK, grant numbers EP/P029329/1 and EP/K038885/1, and by the Bill & Melinda Gates Foundation, Seattle, WA, grant number OPP1029022.

Conflicts of Interest

The authors declare no conflict of interest.

References

  1. Withers, P.J.A.; Jordan, P.; May, L.; Jarvie, H.P.; Deal, N.E. Do septic tank systems pose a hidden threat to water quality? Front. Ecol. Environ. 2014, 12, 123–130. [Google Scholar] [CrossRef]
  2. Manual, D. Onsite Wastewater Treatment and Disposal Systems; EPA: Washington, DC, USA, 1980.
  3. May, L.; Place, C.; O’Malley, M.; Spears, B. The Impact of Phosphorus Inputs From Small Discharges on Designated Freshwater Sites; Natural England Commissioned Reports, Number 170, Natural England - GOV.UK: London, UK, 2015. [Google Scholar]
  4. Meuler, S.; Paris, S.; Hackner, T. Membrane bio-reactors for decentralized wastewater treatment and reuse. Water Sci. Technol. 2008, 58, 285–294. [Google Scholar] [CrossRef] [PubMed]
  5. Appling, D.; Habteselassie, M.; Radcliffe, D.; Bradshaw, J. Preliminary study on the effect of wastewater storage in septic tank on E. coli concentration in summer. Water 2013, 5, 1141–1151. [Google Scholar] [CrossRef]
  6. Polpraserta, C.; Koottatepb, T.; Pussayanavinb, T. Solar septic tanks: A new sanitation paradigm for Thailand 4.0. Sci. Asia 2018, 44, 39–43. [Google Scholar] [CrossRef]
  7. US Environmental Protection Agency. Onsite Wastewater Treatment Systems Manual; US EPA: Washington, DC, USA, 2002.
  8. Kjellén, M.; Pensulo, C.; Nordqvist, P.; Fogde, M. Global review of sanitation system trends and interactions with menstrual management practices. In Report for the Menstrual Management and Sanitation Systems Project; Proj Report-2011; Stock Environ Institute: Stockholm, Sweden, 2011. [Google Scholar]
  9. Liu, C.; Li, H.; Zhang, Y.; Si, D.; Chen, Q. Evolution of microbial community along with increasing solid concentration during high-solids anaerobic digestion of sewage sludge. Bioresour. Technol. 2016, 216, 87–94. [Google Scholar] [CrossRef] [Green Version]
  10. Fitamo, T.; Treu, L.; Boldrin, A.; Sartori, C.; Angelidaki, I.; Scheutz, C. Microbial population dynamics in urban organic waste anaerobic co-digestion with mixed sludge during a change in feedstock composition and different hydraulic retention times. Water Res. 2017, 118, 261–271. [Google Scholar] [CrossRef] [Green Version]
  11. Lee, C.; Kim, J.; Hwang, K.; O’Flaherty, V.; Hwang, S. Quantitative analysis of methanogenic community dynamics in three anaerobic batch digesters treating different wastewaters. Water Res. 2009, 43, 157–165. [Google Scholar] [CrossRef]
  12. Ziganshin, A.M.; Schmidt, T.; Lv, Z.; Liebetrau, J.; Richnow, H.H.; Kleinsteuber, S.; Nikolausz, M. Reduction of the hydraulic retention time at constant high organic loading rate to reach the microbial limits of anaerobic digestion in various reactor systems. Bioresour. Technol. 2016, 217, 62–71. [Google Scholar] [CrossRef]
  13. Schmidt, T.; Ziganshin, A.M.; Nikolausz, M.; Scholwin, F.; Nelles, M.; Kleinsteuber, S.; Pröter, J. Effects of the reduction of the hydraulic retention time to 1.5 days at constant organic loading in CSTR, ASBR, and fixed-bed reactors—Performance and methanogenic community composition. Biomass Bioenergy 2014, 69, 241–248. [Google Scholar] [CrossRef]
  14. Kundu, K.; Sharma, S.; Sreekrishnan, T.R. Changes in microbial communities in a hybrid anaerobic reactor with organic loading rate and temperature. Bioresour. Technol. 2013, 129, 538–547. [Google Scholar] [CrossRef]
  15. Rincón, B.; Borja, R.; González, J.M.; Portillo, M.C.; Sáiz-Jiménez, C. Influence of organic loading rate and hydraulic retention time on the performance, stability and microbial communities of one-stage anaerobic digestion of two-phase olive mill solid residue. Biochem. Eng. J. 2008, 40, 253–261. [Google Scholar] [CrossRef]
  16. Goux, X.; Calusinska, M.; Lemaigre, S.; Marynowska, M.; Klocke, M.; Udelhoven, T.; Benizri, E.; Delfosse, P. Microbial community dynamics in replicate anaerobic digesters exposed sequentially to increasing organic loading rate, acidosis, and process recovery. Biotechnol. Biofuels 2015, 8, 122. [Google Scholar] [CrossRef] [PubMed] [Green Version]
  17. Koster, I.W.; Lettinga, G. The influence of ammonium-nitrogen on the specific activity of pelletized methanogenic sludge. Agric. Wastes 1984, 9, 205–216. [Google Scholar] [CrossRef]
  18. Belostotskiy, D.E.; Ziganshina, E.E.; Siniagina, M.; Boulygina, E.A.; Miluykov, V.A.; Ziganshin, A.M. Impact of the substrate loading regime and phosphoric acid supplementation on performance of biogas reactors and microbial community dynamics during anaerobic digestion of chicken wastes. Bioresour. Technol. 2015, 193, 42–52. [Google Scholar] [CrossRef]
  19. Karlsson, A.; Einarsson, P.; Schnürer, A.; Sundberg, C.; Ejlertsson, J.; Svensson, B.H. Impact of trace element addition on degradation efficiency of volatile fatty acids, oleic acid and phenyl acetate and on microbial populations in a biogas digester. J. Biosci. Bioeng. 2012, 114, 446–452. [Google Scholar] [CrossRef]
  20. Westerholm, M.; Müller, B.; Isaksson, S.; Schnürer, A. Trace element and temperature effects on microbial communities and links to biogas digester performance at high ammonia levels. Biotechnol. Biofuels 2015, 8, 154. [Google Scholar] [CrossRef] [Green Version]
  21. Cai, Y.; Hua, B.; Gao, L.; Hu, Y.; Yuan, X.; Cui, Z.; Zhu, W.; Wang, X. Effects of adding trace elements on rice straw anaerobic mono-digestion: Focus on changes in microbial communities using high-throughput sequencing. Bioresour. Technol. 2017, 239, 454–463. [Google Scholar] [CrossRef]
  22. Carballa, M.; Regueiro, L.; Lema, J.M. Microbial management of anaerobic digestion: Exploiting the microbiome-functionality nexus. Curr. Opin. Biotechnol. 2015, 33, 103–111. [Google Scholar] [CrossRef]
  23. Griffiths, R.I.; Whiteley, A.S.; O’Donnell, A.G.; Bailey, M.J. Rapid method for coextraction of DNA and RNA from natural environments for analysis of ribosomal DNA-and rRNA-based microbial community composition. Appl. Environ. Microbiol. 2000, 66, 5488–5491. [Google Scholar] [CrossRef] [Green Version]
  24. Keating, C.; Chin, J.P.; Hughes, D.; Manesiotis, P.; Cysneiros, D.; Mahony, T.; Smith, C.J.; McGrath, J.W.; O’Flaherty, V. Biological phosphorus removal during high-rate, low-temperature, anaerobic digestion of wastewater. Front. Microbiol. 2016, 7, 226. [Google Scholar] [CrossRef] [Green Version]
  25. Caporaso, J.G.; Lauber, C.L.; Walters, W.A.; Berg-Lyons, D.; Huntley, J.; Fierer, N.; Owens, S.M.; Betley, J.; Fraser, L.; Bauer, M.; et al. Ultra-high-throughput microbial community analysis on the Illumina HiSeq and MiSeq platforms. ISME J. 2012, 6, 1621. [Google Scholar] [CrossRef] [PubMed] [Green Version]
  26. Connelly, S.; Shin, S.G.; Dillon, R.J.; Ijaz, U.Z.; Quince, C.; Sloan, W.T.; Collins, G. Bioreactor Scalability: Laboratory-Scale Bioreactor Design Influences Performance, Ecology, and Community Physiology in Expanded Granular Sludge Bed Bioreactors. Front. Microbiol. 2017, 8, 664. [Google Scholar] [CrossRef] [PubMed]
  27. Masella, A.P.; Bartram, A.K.; Truszkowski, J.M.; Brown, D.G.; Neufeld, J.D. PANDAseq: Paired-end assembler for illumina sequences. BMC Bioinform. 2012, 13, 31. [Google Scholar] [CrossRef] [PubMed] [Green Version]
  28. Rognes, T.; Flouri, T.; Nichols, B.; Quince, C.; Mahé, F. VSEARCH: A versatile open source tool for metagenomics. Peer J. 2016, 4, e2584. [Google Scholar] [CrossRef] [PubMed]
  29. Edgar, R.C. Search and clustering orders of magnitude faster than BLAST. Bioinformatics 2010, 26, 2460–2461. [Google Scholar] [CrossRef] [Green Version]
  30. Aßhauer, K.P.; Wemheuer, B.; Daniel, R.; Meinicke, P. Tax4Fun: Predicting functional profiles from metagenomic 16S rRNA data. Bioinformatics 2015, 31, 2882–2884. [Google Scholar] [CrossRef]
  31. Zabranska, J.; Pokorna, D. Bioconversion of carbon dioxide to methane using hydrogen and hydrogenotrophic methanogens. Biotechnol. Adv. 2018, 36, 707–720. [Google Scholar] [CrossRef]
  32. Liu, C.; Wachemo, A.C.; Tong, H.; Shi, S.; Zhang, L.; Yuan, H.; Li, X. Biogas production and microbial community properties during anaerobic digestion of corn stover at different temperatures. Bioresour. Technol. 2018, 261, 93–103. [Google Scholar] [CrossRef]
  33. Azman, S.; Khadem, A.F.; van Lier, J.B.; Zeeman, G.; Plugge, C.M. Presence and Role of Anaerobic Hydrolytic Microbes in Conversion of Lignocellulosic Biomass for Biogas Production. Crit. Rev. Environ. Sci. Technol. 2015, 45, 2523–2564. [Google Scholar] [CrossRef]
  34. Vanwonterghem, I.; Jensen, P.D.; Ho, D.P.; Batstone, D.J.; Tyson, G.W. Linking microbial community structure, interactions and function in anaerobic digesters using new molecular techniques. Curr. Opin. Biotechnol. 2014, 27, 55–64. [Google Scholar] [CrossRef]
  35. Koch, C.; Müller, S.; Harms, H.; Harnisch, F. Microbiomes in bioenergy production: From analysis to management. Curr. Opin. Biotechnol. 2014, 27, 65–72. [Google Scholar] [CrossRef] [PubMed]
  36. Sboner, A.; Mu, X.J.; Greenbaum, D.; Auerbach, R.K.; Gerstein, M.B. The real cost of sequencing: Higher than you think! Genome Biol. 2011, 12, 125. [Google Scholar] [CrossRef] [PubMed]
  37. Muir, P.; Li, S.; Lou, S.; Wang, D.; Spakowicz, D.J.; Salichos, L.; Zhang, J.; Weinstock, G.M.; Isaacs, F.; Rozowsky, J.; et al. The real cost of sequencing: Scaling computation to keep pace with data generation. Genome Biol. 2016, 17, 53. [Google Scholar] [CrossRef] [PubMed] [Green Version]
  38. Rivière, D.; Desvignes, V.; Pelletier, E.; Chaussonnerie, S.; Guermazi, S.; Weissenbach, J.; Li, T.; Camacho, P.; Sghir, A. Towards the definition of a core of microorganisms involved in anaerobic digestion of sludge. ISME J. 2009, 3, 700. [Google Scholar] [CrossRef] [PubMed] [Green Version]
Figure 1. Schematic (a) illustrates the principle of the solar heating applied to the SST in contrast to the CT which operates at ambient temperature and without an internal baffle. Schematic (b) illustrates the installation of the SST at the field test site, showing the buried septic tank and the solar collection unit on the roof of the served toilet block seen in the photograph (c).
Water 11 02660 g001
Figure 2. The mean relative abundance of the 20 most abundant (a) phyla and (b) OTUs in CT and SST effluent and sludge at each time point sampled. OTU class listed in parentheses. Samples were taken every two weeks from 4 July through to 8 November 2017 (T1-T9).
Water 11 02660 g002
Figure 3. A PCoA of the OTU community dissimilarities between CT and SST effluent and sludge across T1-T9 plotted for relatively abundant OTUs (relative abundance >1%) and explaining 51.7% of the total variance with Bray–Curtis dissimilarity. Ellipses indicate 95% confidence intervals. All sample groups are significantly distinct (permANOVA, 10,000 permutations: f = 67.33, p < 0.001).
Water 11 02660 g003
Figure 4. Pearson’s product moment correlations coefficients between the relative abundance of dominant phyla (relative abundance >1%) in the effluent microbial communities and: (a) treatment efficiency in CT effluent; (b) treatment efficiency in SST effluent; (c) water quality in CT effluent; and (d) water quality in SST effluent. Data from time points 1 to 8. Environmental parameters are grouped into solids, oxygen demands, chemicals and organisms.
Water 11 02660 g004
Table 1. Operating conditions for the CT and SST over T1-8. Values are means ± 1 standard deviation. P-value results derived from T-tests.
ParameterCT InfluentSST InfluentP-Value
Temperature (°C) *37.2 ± 4.542.7 ± 4.9<0.001
Wastewater flowrate (L/d)72.1 ± 32.193.7 ± 48.1<0.001
Organic loading rate (kg/d)0.14 ± 0.060.47 ± 0.53<0.001
Solid loading rate (kg/d)0.12 ± 0.060.24 ± 0.14<0.001
TS (mg/L)1895 ± 4142550 ± 10150.153
TVS (mg/L)1210 ± 2942088 ± 9330.048
TSS (mg/L)1032 ± 5451834 ± 9530.083
TBOD (mg/L)734 ± 345800 ± 3690.719
TCOD (mg/L)1823 ± 5826093 ± 67310.116
SCOD (mg/L)671 ± 253683 ± 1870.917
TKN (mg/L as N)394 ± 86375 ± 970.690
NH3 (mg/L as N)312 ± 73196 ± 770.008
TP (mg/L as P)40 ± 1734 ± 250.604
Total coliform (MPN per 100mL)3.40 × 10⁷ ± 5.45 × 1071.03 × 107 ± 1.94 × 1070.279
E.coli (MPN per 100mL)1.03 × 10⁷ ± 1.8471.26 × 107 ± 1.90 × 1070.814
* Parameters were measured from influent material, with the exception of temperature, which was measured within the septic tank for the SST and ambient temperature was used for the CT.
Table 2. Treatment efficiency for the CT and SST over T1-8. Values are means ± 1 standard deviation. P-value results derived from T-tests.
ParameterCT EffluentCT Removal Efficiency (%)SST EffluentSST Removal Efficiency (%)P-Value
TS (mg/L)967 ± 16948 ± 5564 ± 16073 ± 160.006
TVS (mg/L)433 ± 10662 ± 17172 ± 6289 ± 70.004
TSS (mg/L)158 ± 9284 ± 563 ± 1896 ± 3<0.001
TBOD (mg/L)181 ± 8470 ± 22138 ± 11275 ± 280.660
TCOD (mg/L)534 ± 25470 ± 11359 ± 27589 ± 90.002
SCOD (mg/L)223 ± 14664 ± 18171 ± 7473 ± 150.329
TKN (mg/L as N)366 ± 493 ± 22296 ± 2917 ± 230.261
NH3 (mg/L as N)341 ± 34−14 ± 26287 ± 32−66 ± 650.065
TP (mg/L as P)34 ± 74 ± 2925 ± 6−62 ± 1990.378
Total coliform *,*9.11 × 10⁴ ± 1.11 × 1052.33 ± 1.09 *1.73 × 104 ± 2.84 × 1042.79 ± 0.95 *0.399
E. coli *,*8.47 × 10⁴ ± 1.14 × 1052.01 ± 1.11 *1.73 × 104 ± 2.84 × 1043.02 ± 0.69 *0.054
* log reduction. *,* MPN per 100 mL.

