Photolytic Degradation of Tetracycline in the Presence of Ca(II) and/or Humic Acid


1
College of Resources and Environmental Sciences, China Agricultural University, Beijing 100193, China
2
College of Environmental Sciences and Engineering, Peking University, The Key Laboratory of Water and Sediment Sciences, Ministry of Education, Beijing 100871, China
3
Department of Civil & Environmental Engineering, National University of Singapore, 1 Engineering Drive 2, Singapore 117576, Singapore
*
Author to whom correspondence should be addressed.
Water 2020, 12(8), 2078; https://doi.org/10.3390/w12082078
Submission received: 30 June 2020
/
Revised: 15 July 2020
/
Accepted: 20 July 2020
/
Published: 22 July 2020
(This article belongs to the Special Issue AOP Processes for Organics Removal in Water and Wastewater)
Abstract
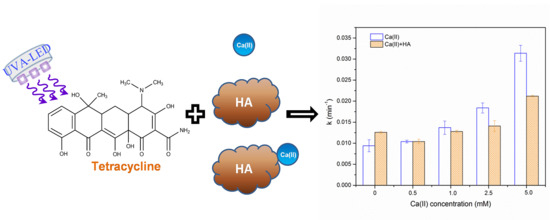
:Photolytic degradation of tetracycline (TC) was investigated in mono- and binary solute systems of Ca(II) and humic acid (HA) under UVA light emitting diode (UVA-LED) light irradiation. TC photolysis proceeded via pseudo-first-order reaction kinetics. The presence of Ca(II) significantly accelerated the degradation rate constants of TC, with the highest value at 0.0314 ± 0.0019 min−1 when the Ca(II) concentration was 5.0 mM. The promoted degradation was attributed to complexation of TC with Ca(II), which increased the light absorption. Absorbance and fluorescence measurements revealed that the strong complexation between TC and Ca(II) likely occurred via the C11 and C12 oxygen groups in the phenolic-diketone moiety of TC in nearly neutral solutions. The formation of HA-Ca(II) complex was found in the binary solute system of HA and Ca(II). Thus, the promotional effect of Ca(II) on photolysis was diminished by HA addition. The largest reduction of 32.5% in rate constants was observed with the highest Ca(II) concentration. Scavenger studies revealed that TC could undergo direct photolysis and self-sensitization by 1O2. These results suggest that the coexistence of HA and Ca(II) greatly influences the fate of TC in natural waters, which has important implications for understanding the behavior of antibiotics coexisting with other metal species and ligands.
1. Introduction
Tetracycline (TC) is one of the broad-spectrum antibiotics used as human and veterinary medicine and growth promotor in livestock and aquaculture [1,2]. After medication, a significant fraction (more than 70%) of TC is excreted from the body via urine and feces in the pharmaceutically active form [3]. As a result, TC has been frequently detected in animal wastewater [4], municipal wastewater [5,6], surface water [7,8] and groundwater [9,10] at ng/L to μg/L levels. The widespread occurrence of antibiotics poses potential threats to human health and ecosystem due to their toxicity and the accumulation of antibiotic resistance [11,12].
Photolytic degradation is an important pathway for TC in natural waters since TC is susceptible to light [13,14,15]. TC is an amphoteric molecule with multiple electron-rich O and N functional groups, which contribute to their strong tendency to complex with metals [16]. Thus, complexation plays an important role in affecting the photoreactivity of TC in natural waters, where different metal species are ubiquitously present. For example, the presence of Cu(II), Mn(II), and Fe(III) ions could significantly promote oxidative transformation of TC even without light irradiation, which was induced by complexation [17,18]. Under simulated sunlight, photolytic degradation kinetics of TC was enhanced in the presence of Ca(II) and Mg(II) ions due to the formation of Ca(II)- and Mg(II)-TC complexes [19,20]. These complexes could facilitate direct photolysis [19] and self-sensitized oxidation [20] of TC.
Humic acid (HA), as a common component in natural waters, can also strongly affect photolytic degradation of organic pollutants [15,21,22]. Some studies have shown that the presence of HA could promote photolytic degradation of TC by stimulating the generation of reactive oxygen species (ROS), such as hydroxyl radical (•OH), singlet oxygen (1O2), and superoxide (O2•−) [14,23,24]. However, HA could inhibit photolytic degradation of TC at higher HA concentrations due to the competitive light absorption and radical quenching [23,24]. In addition, HA has strong affinity toward metal ions due to its heterogeneous structure of acidic functionalities [25,26]. Therefore, HA is likely to compete with TC for metal ions when they exist simultaneously in natural waters. The occupation of metal species by HA is expected to affect the influence of metal ions on photolytic degradation. However, to the best of our knowledge, the investigation on the role of coexisting HA and metals in photolytic degradation of TC is lacking.
The objective of this study was to evaluate the effects of Ca(II) and/or HA on photolytic degradation of TC. The newly emerging UV light emitting diode (UV-LED) was used as an alternative light source to the conventional mercury lamps because it is space-saving, energy-efficient, resistant to physical shock, and it has a longer life time [22,27]. Particular attention was paid to the effect of coexisting Ca(II) and HA on degradation kinetics and reaction mechanisms of TC. The formation of TC-Ca(II) and HA-Ca(II) complexes was verified by absorbance and fluorescence measurements. The role of ROS in TC photolytic degradation was clarified by scavenger studies. The results are useful to provide a better understanding of the environmental transformation of antibiotics in natural waters.
2. Materials and Methods
2.1. Materials
Tetracycline (TC, ≥98%), formic acid (98%), and furfuryl alcohol (FFA, 99%) were supplied by Sigma-Aldrich (Singapore). HPLC grade acetonitrile and methanol were obtained from Fisher Scientific (Waltham, MA, USA). Purified water used for all solutions was provided by a Milli-Q water purification system (Millipore Synergy 185, Billerica, MA, USA). Calcium chloride anhydrous powder (CaCl2) was supplied by Merck (Darmstadt, Germany). HA was purchased from Sigma-Aldrich (Buchs, Switzerland). The HA stock solution was prepared by stirring the HA solution overnight followed by filtration through a 0.45 μm membrane. The total organic carbon (TOC) concentration was 110.4 mg C/L for the HA stock solution determined by a TOC-VCSH analyzer (Shimadzu, Kyoto, Japan).
2.2. Photolytic Experiments
Photolytic experiments were conducted using the previously developed UVA-LED system [15]. Briefly, eighteen UVA-LED lamps (3 W, peak wavelength 365 nm, SET, inc, USA) were used as the light source and the light intensity was set as 4 mW/cm2. The working solution of TC (200 mL, 500 μg/L) was added in a 325 mL Pyrex crystallizing dish, which was placed under the UVA-LED system at a 2 cm distance. Aliquots of Ca(II) and HA stock solutions were spiked into the experimental solutions to achieve desired concentrations for each experiment and/or analysis. The solutions containing Ca(II) and HA were magnetically stirred for 30 min before adding TC. To clarify the contribution of different active species to TC removal, a series of scavengers were spiked into solutions prior to photolytic reactions: (i) 100 mM methanol, an aqueous •OH radical scavenger (k = 1.0 × 10⁹ M−1s−1) [28] or (ii) 0.15 mM FFA, a chemical trap for 1O2 (k = 1.2 × 10⁸ M−1s−1) [29]. The pH values of the solutions were adjusted to 6.00 ± 0.10 with 0.1 M HCl or NaOH. TC solutions with Ca(II) and/or HA were magnetically stirred under darkness for 30 min prior to irradiation. Aliquots were taken from the reaction solutions at time intervals of 5 min. All experiments were conducted in triplicates.
2.3. Analytical Methods
TC was quantified by a Shimadzu 8030 Series (Kyoto, Japan) high performance liquid chromatography (HPLC) in tandem with a triple quadrupole mass spectrometer (MS) following our previous method [15]. Briefly, the mobile phases were water (0.1% formic acid)/acetonitrile mixture (70/30, v/v %) at a flow rate of 0.25 mL/min. A positive ionization mode was used for isolation of m/z 410.
The absorption spectra of TC/HA solutions were collected on a UV-Vis spectrometer (DR5000, Hach, Loveland, CO, USA). The excitation-emission matrix (EEM) and synchronous fluorescence (SyF) spectra of TC/HA solutions were recorded on a fluorescence spectrometer (Model Cary Eclipse, Varian, Santa Clara, CA, USA). The fluorescence spectrometer used a xenon excitation source, and slits were set to 5 nm for both excitation and emission. The excitation ranges were 200–450 and 200–550 nm while the emission ranges were 400–700 and 350–650 nm, for TC and HA, respectively. SyF spectra of TC/HA solutions for excitation wavelengths ranging from 200 to 700 nm were recorded using a constant offset (Δλ = 70 nm for TC and Δλ = 30 nm for HA) between excitation and emission wavelengths.
2.4. Absorbance Data Processing
To clarify the influence of Ca(II) on UV-Vis absorbance and EEM fluorescence of TC/HA, changes in UV-Vis absorbance (ΔAbs) at varying Ca(II) concentrations were calculated by Equation (1) (the absorbance of Ca(II) is negligible):
where Abs(TC/HA + Ca(II)) and Abs(TC/HA) are the UV-Vis absorbance of the TC/HA solutions in the presence and absence of Ca(II), respectively.
ΔAbs = Abs(TC/HA + Ca(II)) − Abs(TC/HA)
Variations in EEM fluorescence (ΔEEM) of TC upon Ca(II) addition were calculated by Equation (2) (the fluorescence of Ca(II) is negligible):
where EEM(TC + Ca(II)) and EEM(TC) are the EEM fluorescence of the TC solutions in the presence and absence of Ca(II), respectively.
ΔEEM = EEM(TC + Ca(II)) − EEM(TC)
3. Results and Discussion
3.1. Photolytic Degradation of TC in the Presence of Ca(II)
3.1.1. Effect of Ca(II) on Degradation Kinetics
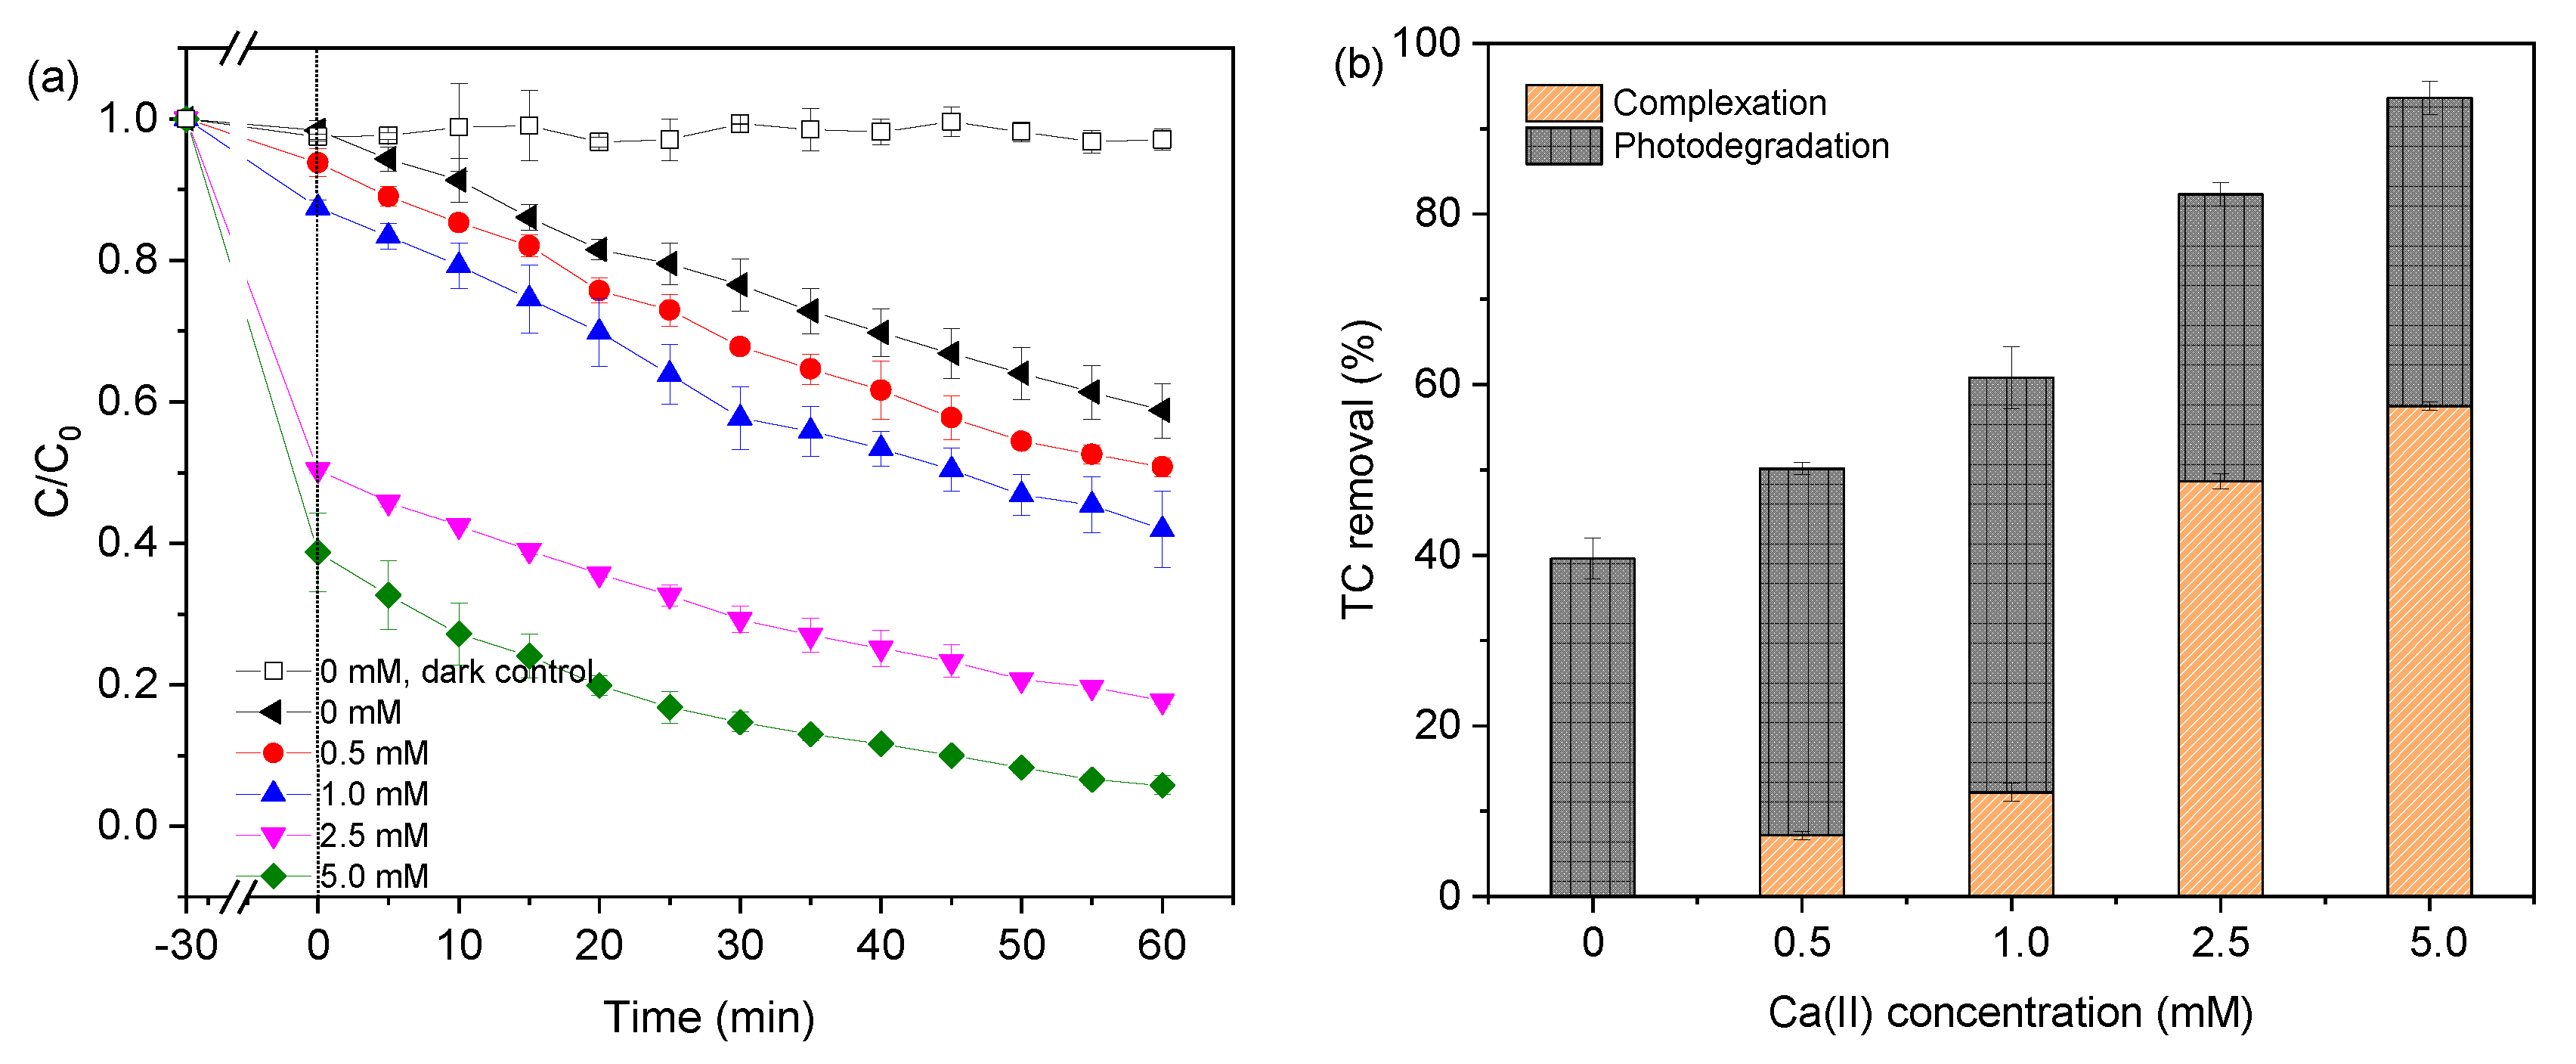
TC was stable under darkness without Ca(II) (Figure 1a), indicating that hydrolysis of TC was negligible. Photolytic degradation of TC was then investigated with increasing Ca(II) concentrations, from 0 to 5.0 mM. The solutions containing TC and Ca(II) were stabilized under darkness for 30 min prior to irradiation. As seen from Figure 1a, TC concentration was decreased after 30 min of stabilization (t = 0) in the presence of Ca(II), due to the complexation of TC and Ca(II).
Figure 1b shows the contributions of complexation and photolytic degradation to the overall removal of TC. The total TC removal was increased from 50.2% to 93.6%, with increasing Ca(II) concentrations from 0.5 to 5.0 mM. The enhanced removal of TC at higher Ca(II) concentrations was facilitated by the formation of TC-Ca(II) complex, which reduced the free TC in the solution and affected the underlying photolytic degradation as well [20]. As seen from Figure 1b, the contribution of complexation to the total TC removal was greatly increased with increasing Ca(II) concentrations. At low Ca(II) concentrations (0.5 and 1.0 mM), the complex formation contributed less than 15% to the total TC removal. However, the removal due to complexation played a more significant role at higher Ca(II) concentrations, reaching 48.6% and 57.5% with 2.5 and 5.0 mM Ca(II), respectively. These results were consistent with a previous finding that complexation of TC and Ca(II) was facilitated at higher Ca(II) to TC ratio [30].
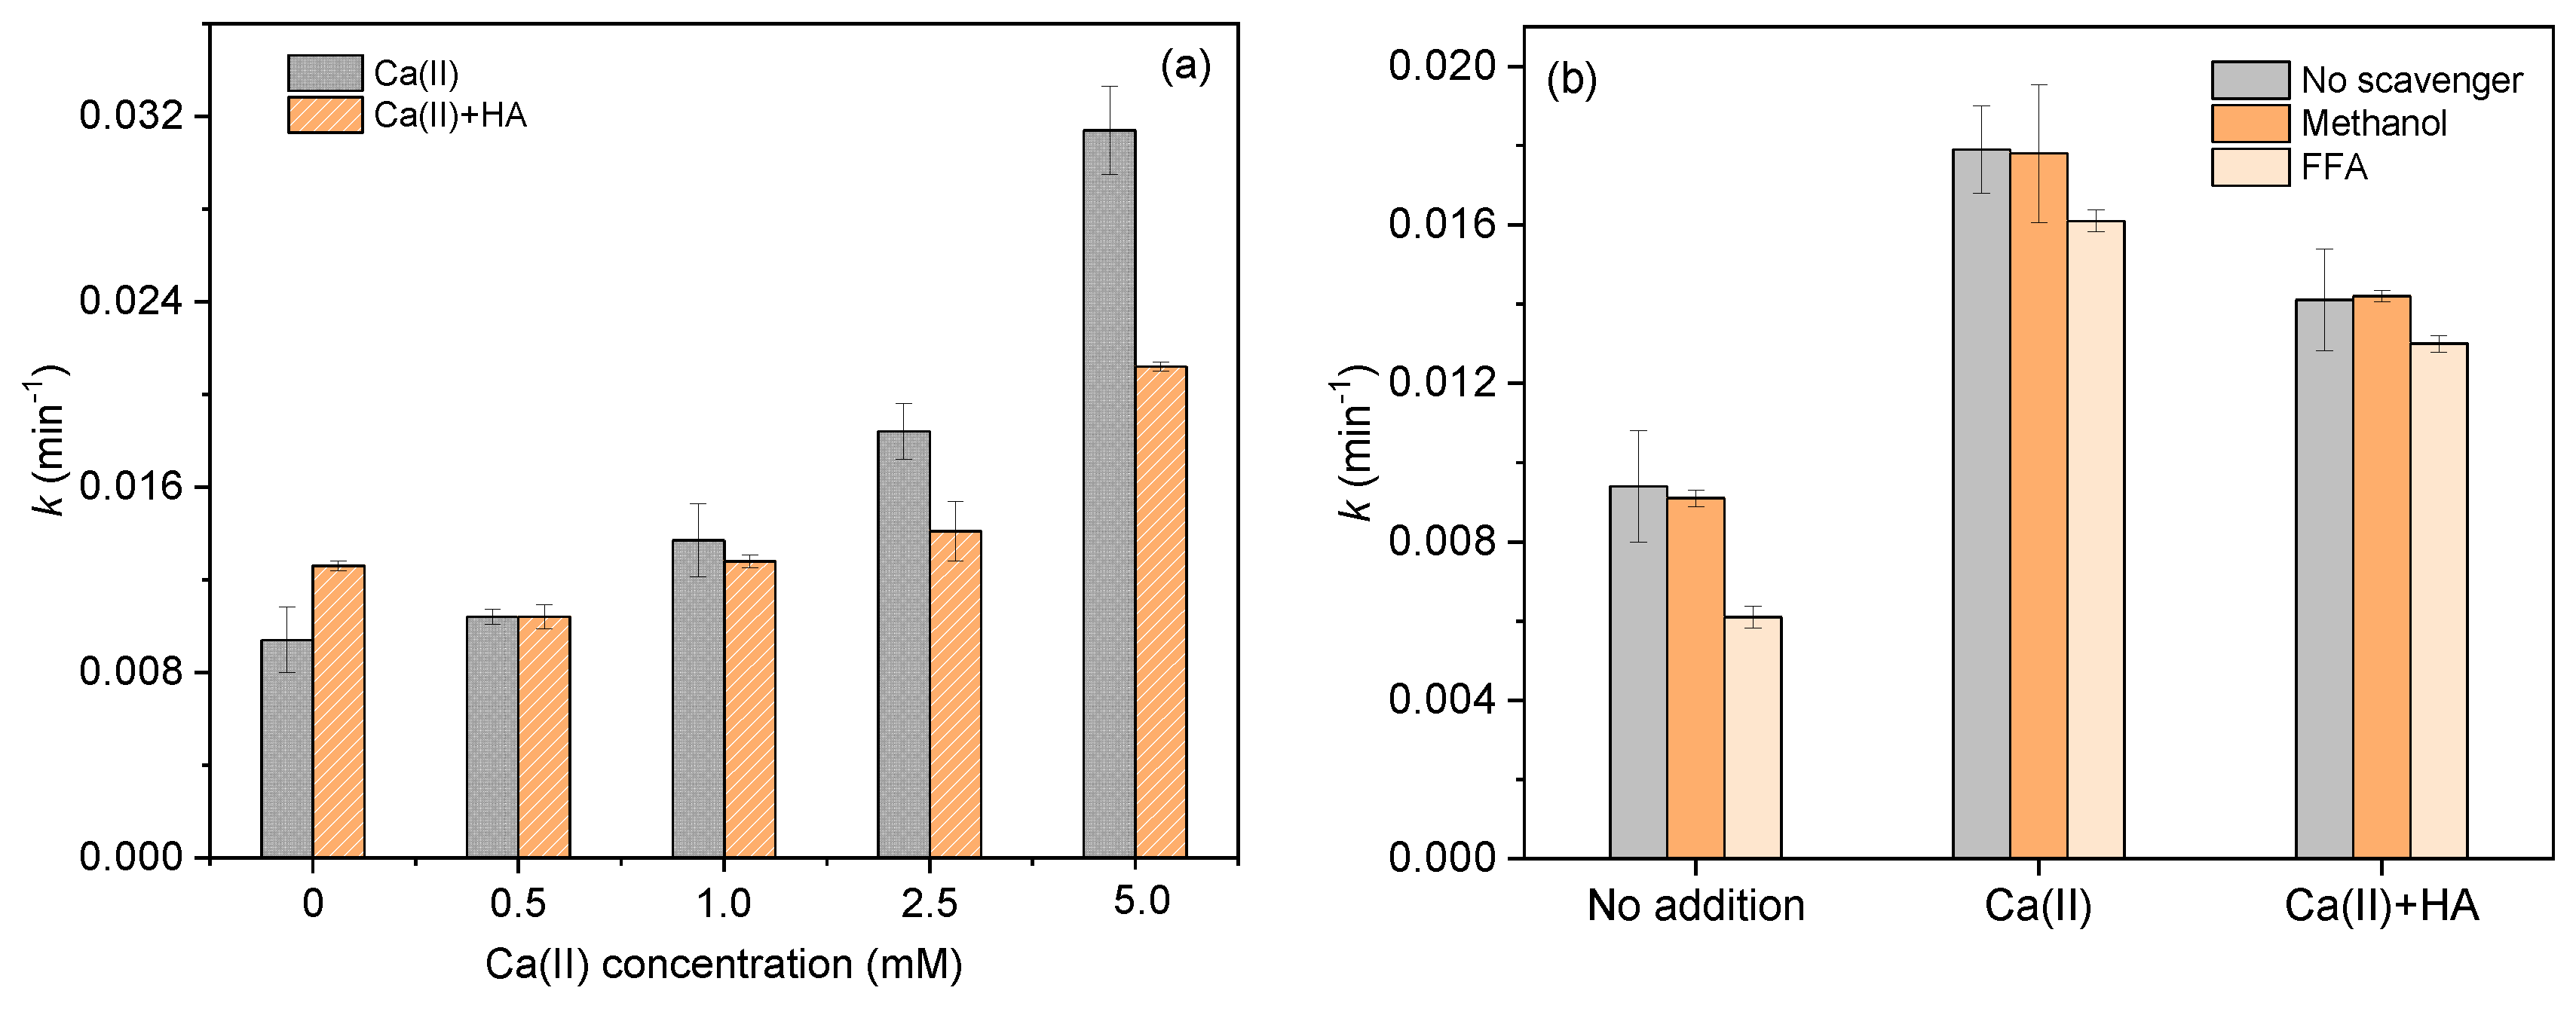
Upon UVA-LED irradiation, photolytic degradation of TC could be well fitted by the pseudo-first-order kinetic model (R2 > 0.985). The pseudo-first-order rate constants, k (min−1), were calculated from the plots of ln(C/C0) versus the irradiation time (min). As shown in Figure 2a, k values showed a significant enhancement with increasing Ca(II) concentration. It was promoted up to three times in the presence of 5.0 mM Ca(II), compared to that without Ca(II) addition. The enhancement in photolytic degradation could be attributed to the formation of TC-Ca(II) complex [19,20].
3.1.2. Participation of Reactive Species
To clarify the contribution of different reactive species in TC removal, scavenger studies were performed by adding methanol (•OH scavenger) or FFA (1O2 trap) to solutions during the photolytic reactions. In the absence of Ca(II), no obvious change in photolytic degradation rates of TC was observed with the addition of methanol (Figure 2b). These results indicated that •OH-induced oxidation was negligible in TC photolytic degradation. Photolytic degradation rates of TC were slightly decreased with the addition of FFA, suggesting that TC underwent photo-sensitized oxidation by 1O2. Moreover, the addition of these scavengers could not completely inhibit the photolytic degradation of TC, which suggested that direct degradation of TC probably played an important role in TC photolysis. The proposed degradation mechanism is consistent with previous reports [13]. Similar reaction mechanisms were observed in the mono-solute system of Ca(II) (Figure 2b). The contribution of •OH was ruled out since methanol did not kinetically affect TC degradation. The addition of FFA slightly decreased the photolytic degradation rate constants of TC, which indicated that self-sensitized oxidation by 1O2 could occur in the presence of Ca(II) [20,31].
3.1.3. Characterization of TC-Ca(II) Complex
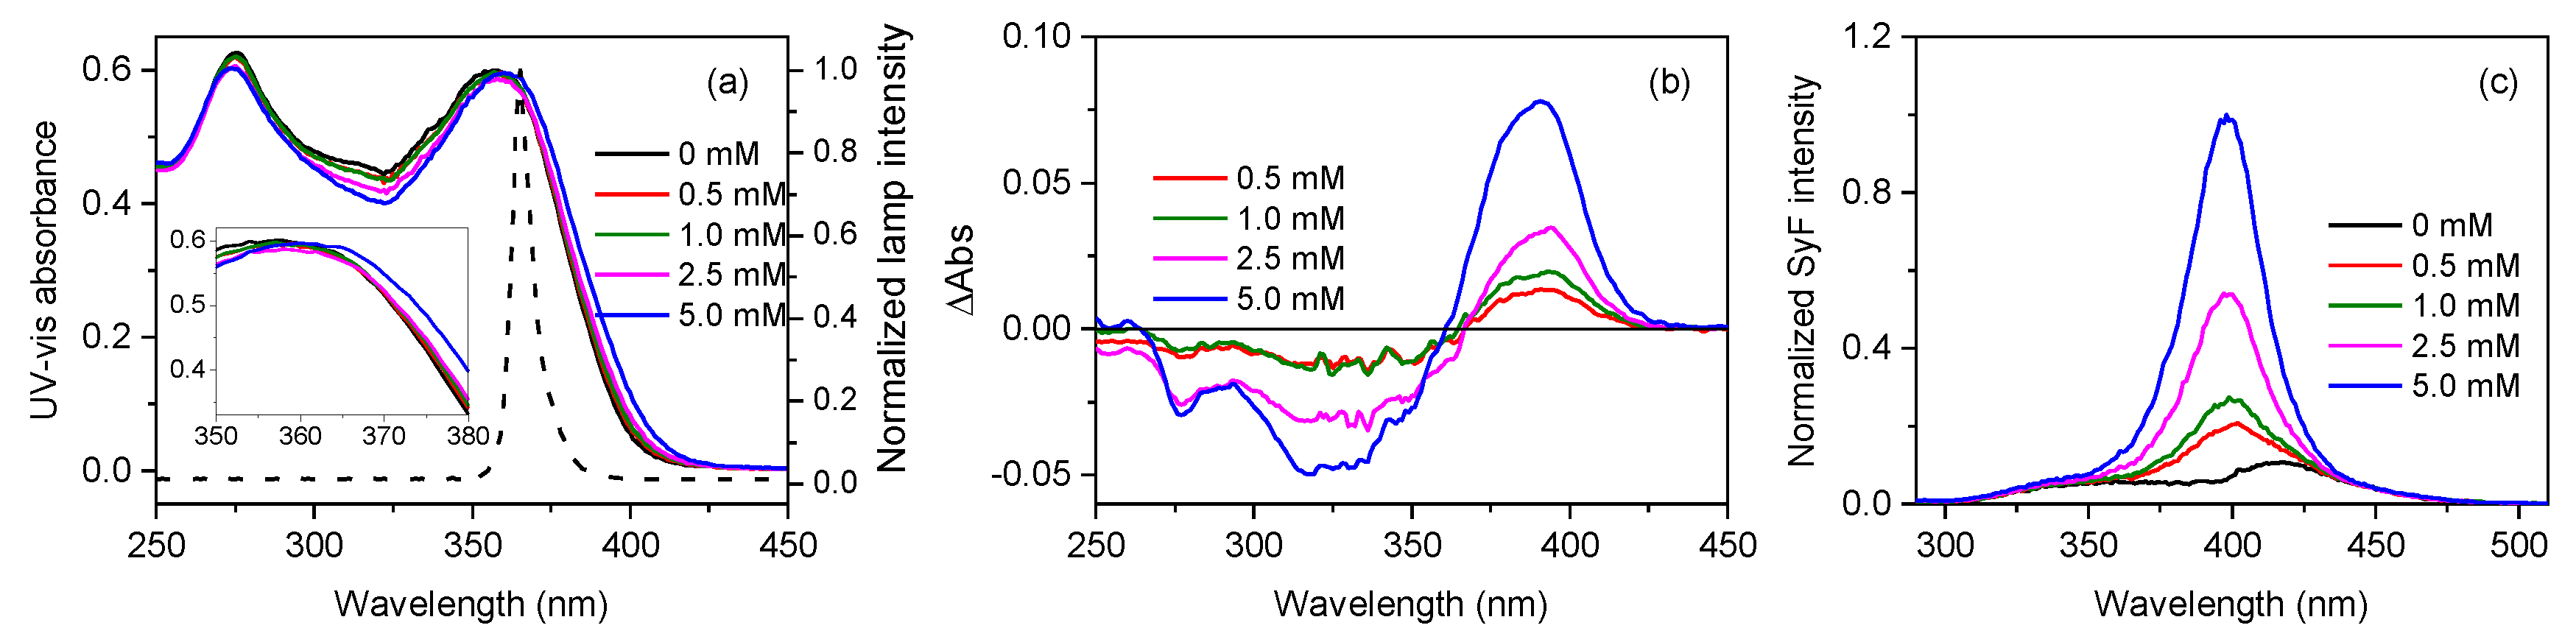
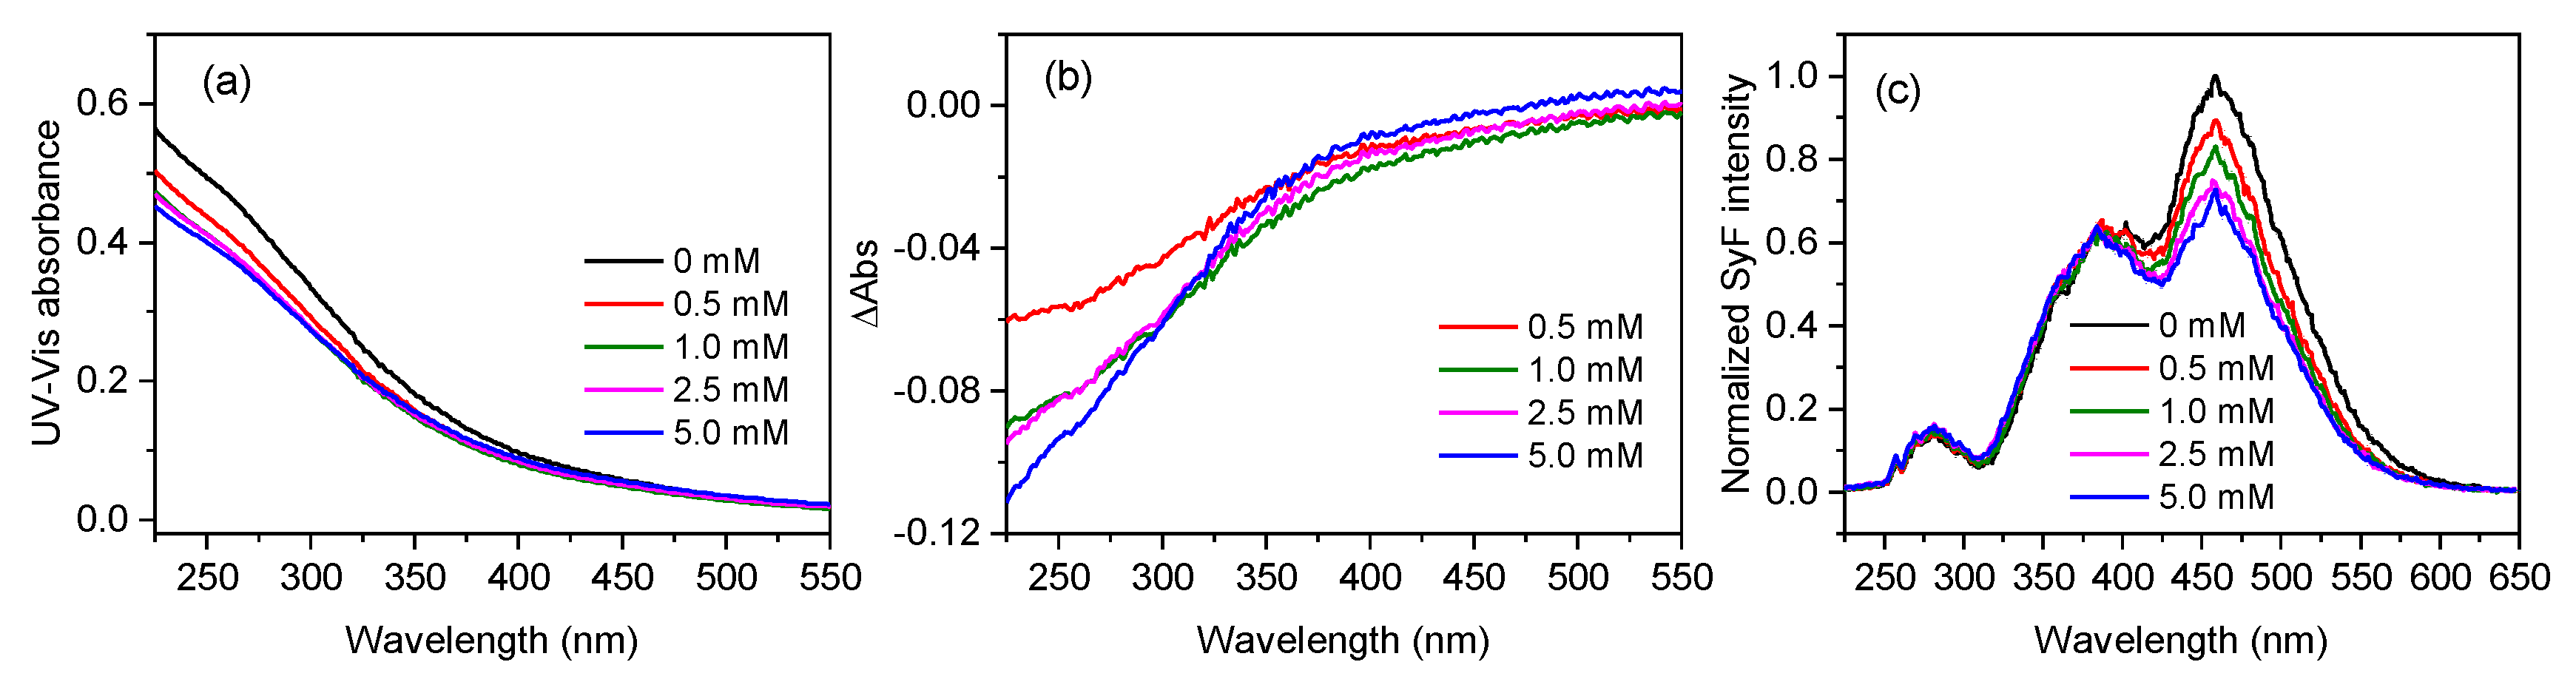
The formation of TC-Ca(II) complex was confirmed by measuring variations of UV-Vis absorbance spectra of TC before and after Ca(II) addition. As seen from Figure 3a, the absorbance of TC showed a strong bathochromic shift with increasing Ca(II) concentrations, in the range of the emission spectrum of the UVA-LED lamp (355–385 nm). This result suggested that the formation of TC-Ca(II) complex increased the magnitude of light absorption. As a result, photolytic degradation of TC could be enhanced [19].
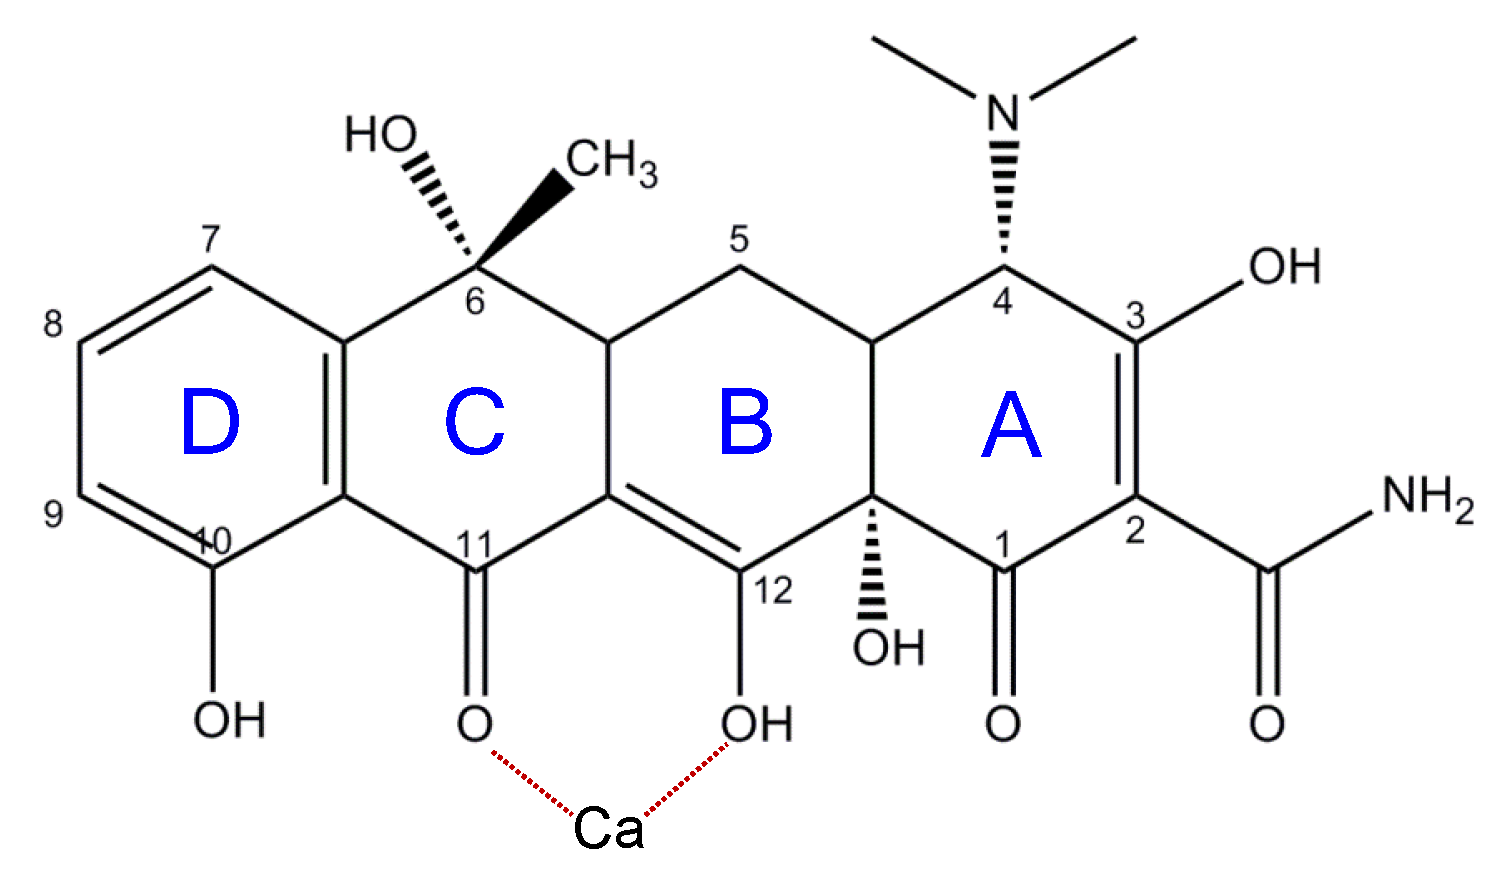
Figure 3b shows the UV-Vis absorbance change (ΔAbs) of TC at increasing Ca(II) concentrations. The ΔAbs increased significantly at 370–390 nm. According to the literature, the tricarbonylamide (A-ring) in TC molecules (Figure 4) contributes to the absorption band of 250–300 nm only while the phenolic-diketone (BCD-ring, Figure 4) contributes to the absorption bands of 250–300 nm and 340–380 nm [16,17]. The observed increase in the 370–390 nm absorption was consistent with the increased degradation rate constants of TC by Ca(II). In contrast, the absorption at 250–300 nm did not follow the degradation trend of TC with Ca(II). Therefore, this result suggests that the BCD-ring is likely the crucial binding site for Ca(II). At pH 6, TC occurs primarily as zwitterionic and negatively charged forms, thus TC probably binds Ca(II) via the oxygen atom of hydroxyl group at site 12 and carbonyl group at site 11 (Figure 4) [16].
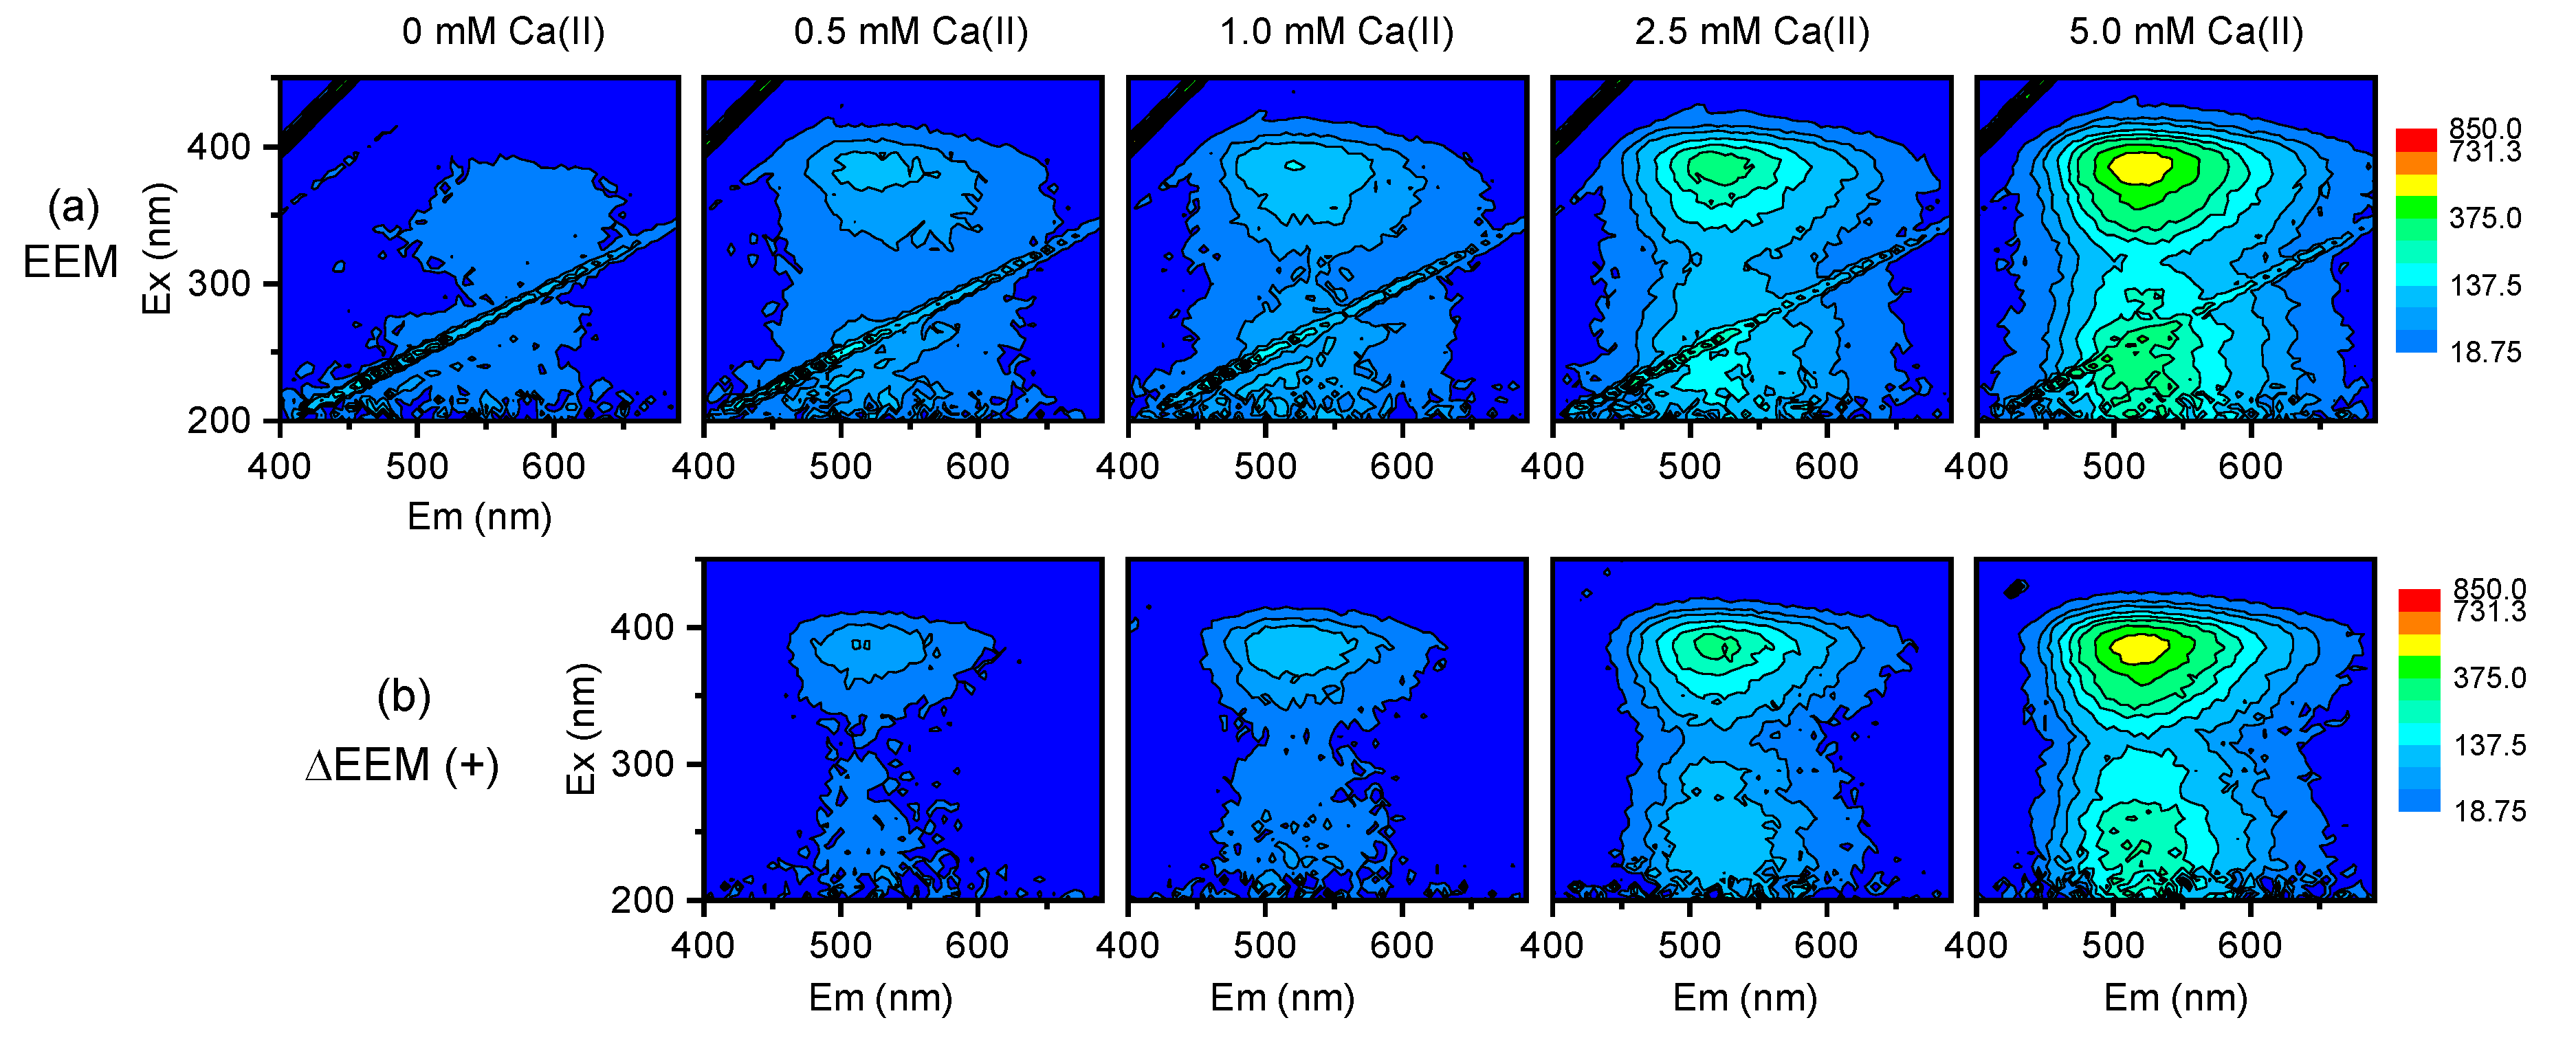
The conformational changes of TC were evaluated by EEM fluorescence before and after the addition of Ca(II) (Figure 5). As suggested by the literature, A-ring is assumed to be non-fluorescent and BCD-ring represents the fluorophore of TC [16]. Thus, the fluorescence emission of TC is dependent on the changes in BCD-ring. As seen from Figure 5, TC exhibited two characteristic peaks, with peak maxima located at λex/λem pairs of 235/515 nm and 385/515 nm, respectively. The intensity of these two peaks was remarkably enhanced with increasing Ca(II) concentrations, especially for the higher excitation peak. The increased fluorescence confirmed the chelation of Ca(II) with TC [32]. Thus, the TC-Ca(II) complex with strong fluorescence could be easily activated to excited states for degradation. Additionally, SyF measurements were carried out to provide information about the molecular environment in the vicinity of the chromophore molecules. As seen from Figure 3c, the excitation wavelength of the SyF peak maxima showed a moderate blue shift from 417 to 398 nm with increasing Ca(II) concentrations. This blue-shift indicated that the conformation of TC had changed and the hydrophobicity was increased due to Ca(II) binding [33].
3.2. Photolytic Degradation of TC in the Presence of Ca(II) and HA
3.2.1. Effect of Coexisting Ca(II) and HA on Degradation Kinetics
Our previous study showed that the addition of HA from 0 to 5.0 mg C/L slightly accelerated the TC degradation kinetics, since HA acted as a photosensitizer through the generation of •OH [15]. The facilitated formation of •OH radical in the presence of HA could be resulted from the energy transfer from triplet excited state HA (3HA*) to 3O2 [15]. In this study, the effects of coexisting HA and Ca(II) on photolytic degradation of TC were conducted by varying Ca(II) concentrations from 0 to 5.0 mM with a fixed HA concentration at 5.0 mg C/L. In the binary system of HA and Ca(II), TC loss due to Ca(II) complexation was not significantly affected by HA addition. However, TC photolytic degradation rate constants were promoted with increasing Ca(II) concentrations (Figure 2a). The rate constants were increased from 0.0104 ± 0.0005 to 0.0212 ± 0.0002 min−1, corresponding to 0.5 and 5.0 mM Ca(II) addition, respectively.
Compared with that in the mono-system of Ca(II), the k values by HA addition consistently dropped at all Ca(II) concentrations studied (Figure 2a). The results demonstrated that HA addition could diminish the acceleration effect of Ca(II) on TC degradation due to its competitive affinity toward Ca(II). The formation of HA-Ca(II) complex could result in the decrease in the free Ca(II) concentration available for TC complexation. The suppression was more evident at the higher Ca(II) concentrations (Figure 2a). In particular, when the Ca(II) concentration was 5.0 mM, the presence of HA resulted in the ‘‘enhancement effect’’ of Ca(II) on the TC degradation rate constant decreasing by 32.5%. Compared with that in the mono-system of HA, the k value slightly decreased with 0.5 mM Ca(II) because the positive effect of both HA and Ca(II) was suppressed due to the formation of HA-Ca(II) complex. However, the k values were increased at the higher Ca(II) concentrations when the ‘‘enhancement effect’’ of Ca(II) dominated in the reaction.
3.2.2. Participation of Reactive Species
In the binary system of Ca(II) and HA, the addition of methanol did not affect photolytic degradation (Figure 2b). Since methanol is a commonly used •OH scavenger, this result suggests that the contribution of •OH to TC removal is negligible in the binary system of Ca(II) and HA during photolytic degradation. The addition of FFA slightly suppressed photolytic degradation of TC (Figure 2b), indicating that the self-sensitized oxidation by 1O2 could occur. Therefore, direct photolysis and self-sensitization by 1O2 could concurrently contribute to TC removal. The proposed degradation mechanism is similar to that observed in the mono-solute system of Ca(II).
3.2.3. Characterization of HA-Ca(II) Complex
The UV-Vis absorption spectra of HA were recorded at different concentrations of Ca(II) (Figure 6a). A subsequent addition of Ca(II) from 0 to 5.0 mM decreased the UV-Vis absorbance of HA. Negative values of ΔAbs were observed and they were decreased with increasing Ca(II) concentrations in the low-wavelength region (Figure 6b). Similar findings were reported in the Ca(II) and SRHA (Suwannee River HA) system [26]. These changes of HA chromophores indicated the formation of HA-Ca(II) complex. As suggested by earlier studies [26,34], the absorption in the range of 250–280 nm is likely to be associated with the deprotonation of carboxylic groups in natural organic matter (NOM). The changes of absorbance in the low-wavelength region thus indicate the involvement of carboxylic groups in Ca(II) binding [25].
The fluorescent changes of HA were recorded by the SyF (Figure 6c) measurement with and without Ca(II) addition. The SyF spectra of HA showed three characteristic peaks. The first peak between 250 and 300 nm is ascribed to proteins and/or amino acids. The second and the third peaks appear at wavelengths of ~400 and ~460 nm and are attributed to fulvic-like and humic-like NOM, respectively [35,36]. With increasing concentrations of Ca(II), the peak corresponding to HA was obviously suppressed, indicating the formation of a stable complex [25]. The complexation reaction between HA and Ca(II), considering the formation of 1:1 complex can be represented by (charges omitted) [37,38]:
and the corresponding conditional equilibrium constant (K) is given by:
HA + Ca = HA − Ca
K = [HA − Ca]/([HA][Ca])
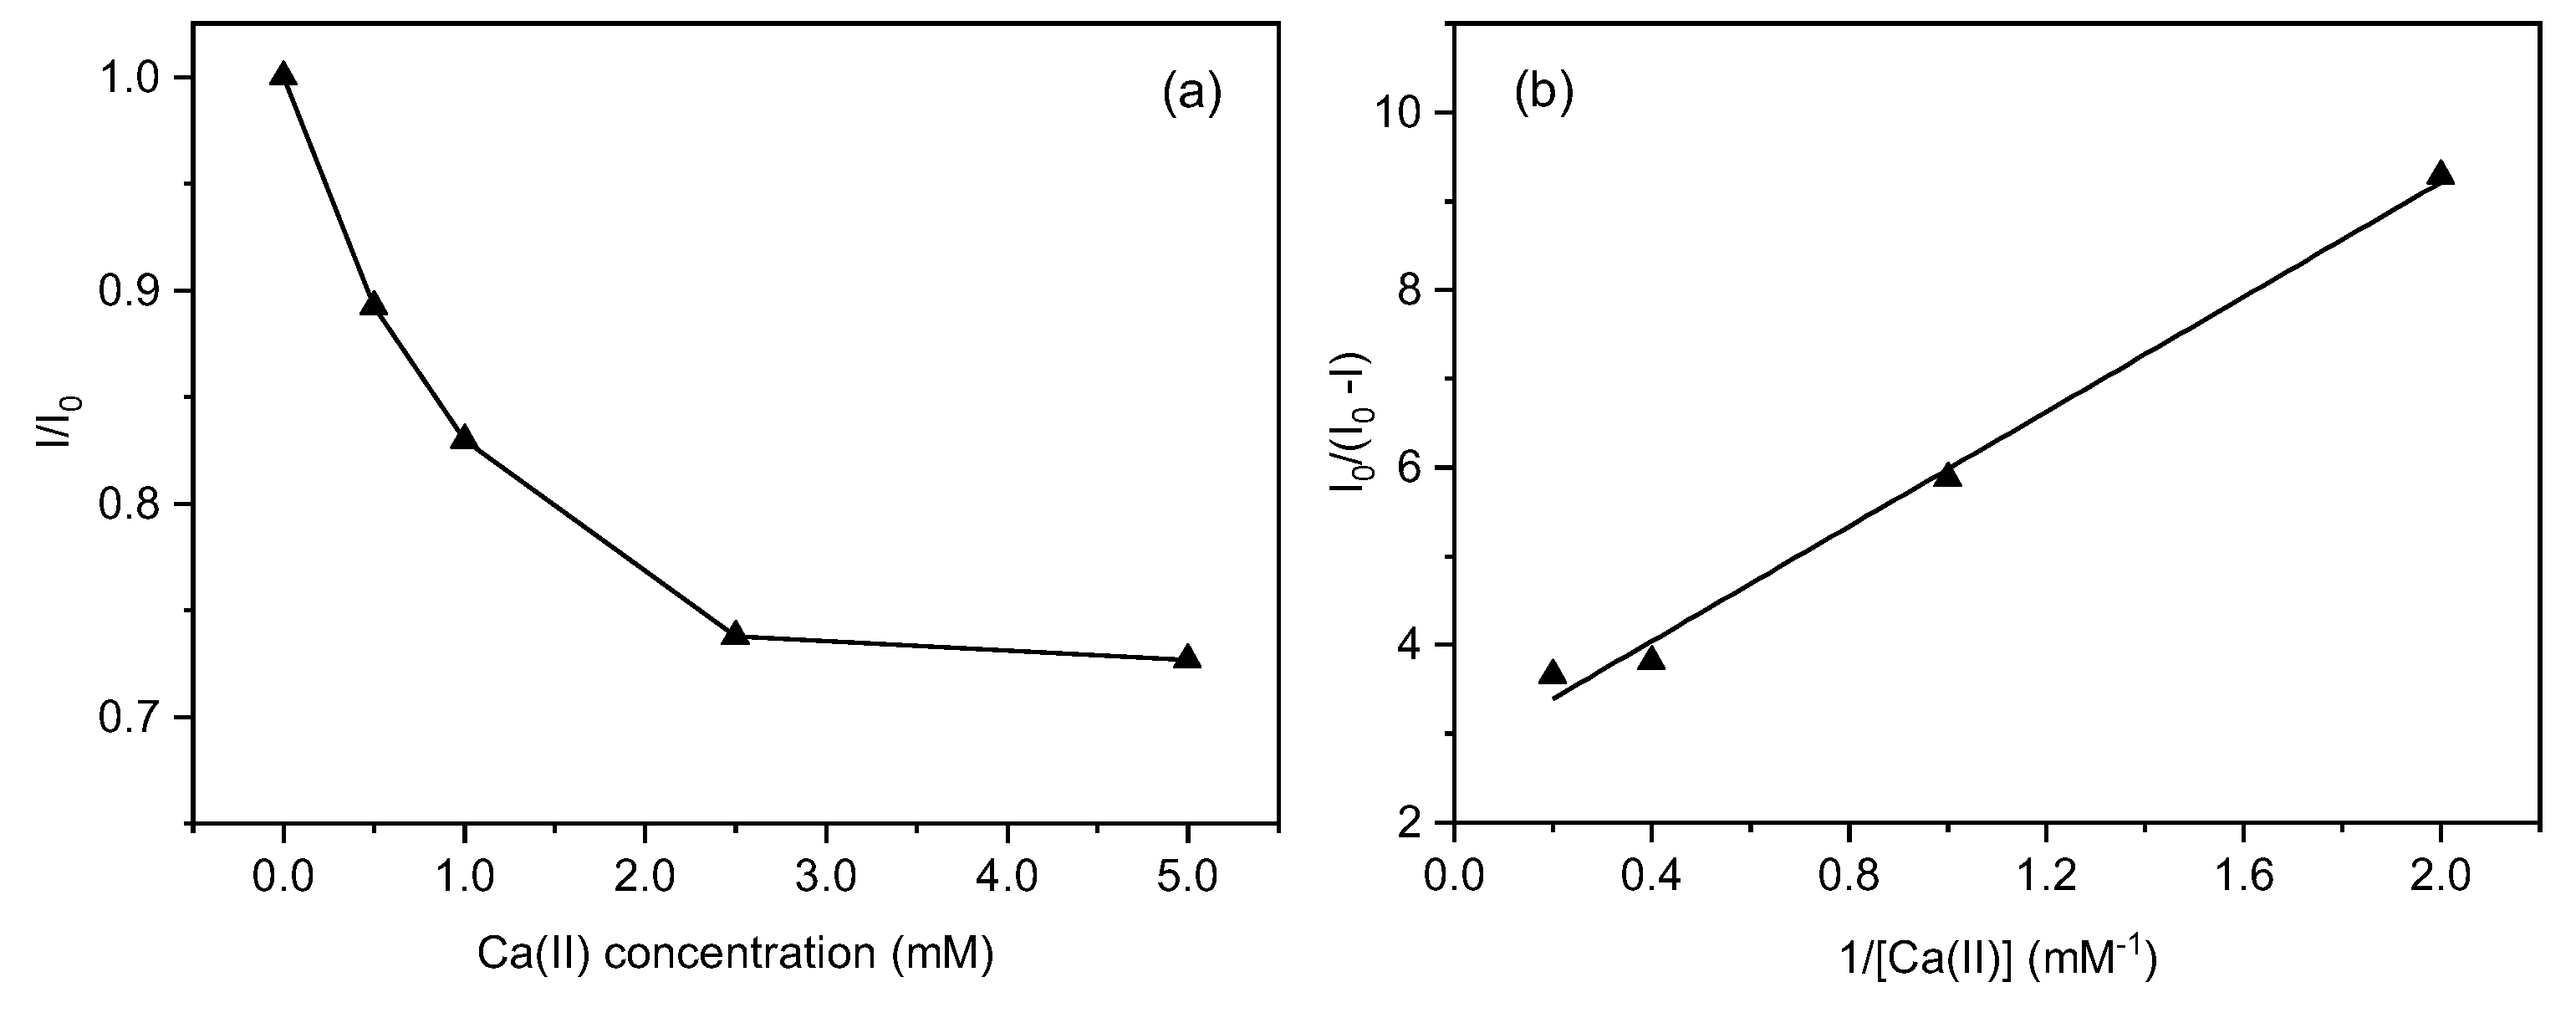
The fluorescence quenching of HA with various concentrations of Ca(II) can be described by the modified Stern-Volmer Equation [39]:
where I0 and I are the fluorescence intensity of HA before and after Ca(II) addition, respectively, and f is the fraction of the initial fluorescence that participates in binding.
I0/(I0 − I) = 1/(fK[Ca]) + 1/f
The fluorescence quenching of HA by Ca(II) addition was displayed in Figure 7a by using the maximum fluorescence intensity at ~460 nm in the SyF spectrum. The fluorescence quenching data was further fitted to the modified Stern-Volmer model (Figure 7b). The logK value for the HA-Ca(II) complex was calculated to be 2.93, which is in good consistency with the values reported previously [40]. The corresponding f value was 36.4%.
4. Conclusions
Photolytic degradation of TC was investigated in the presence of Ca(II) and/or HA under UVA-LED irradiation. The results showed that TC photolytic degradation followed pseudo-first-order kinetics. The presence of Ca(II) significantly accelerated the degradation rate constants due to the red shift of the light absorption of TC-Ca(II) complex. The coexistence of Ca(II) and HA could enhance TC photolytic degradation. However, compared to that in the mono-system of Ca(II), the addition of HA decreased the acceleration effect of Ca(II) due to the formation of HA-Ca(II) complex. The complexes of TC-Ca(II) and HA-Ca(II) were characterized by UV-Vis absorbance and fluorescence spectroscopy. Participation of different reactive species was verified by addition of scavengers. Direct photolysis and 1O2-induced removal mainly accounted for photolytic degradation of TC. These results encourage much interest in understanding the fate of antibiotics in surface waters wherein HA inevitably coexists with metal species. The occupation of metal species by HA will counteract the effect of metal ions on photolysis. The results demonstrated in this study have important implications for exploring the behavior of antibiotics with other metal species and ligands during photolytic degradation. The formation of potential harmful products arising from photolysis of antibiotics, especially in the presence of metals and ligands, deserves particular attention in future studies.
Author Contributions
Conceptualization, S.L.; formal analysis, S.L. and Y.H.; investigation, S.L.; writing—original draft preparation, S.L.; writing—review and editing, W.S. and J.H.; visualization, S.L., Y.H., and F.K.; funding acquisition, W.S. and J.H. All authors have read and agreed to the published version of the manuscript.
Funding
This research was funded by the National Natural Science Foundation of China, grant number 51879001; and Singapore-Peking-Oxford Research Enterprise (SPORE), grant number COY-15-EWI-RCFSA/N197-1.
Conflicts of Interest
The authors declare no conflict of interest.
References
- Wang, P.; He, Y.L.; Huang, C.H. Reactions of tetracycline antibiotics with chlorine dioxide and free chlorine. Water Res. 2011, 45, 1838–1846. [Google Scholar] [CrossRef] [PubMed]
- Kovalakova, P.; Cizmas, L.; McDonald, T.J.; Marsalek, B.; Feng, M.; Sharma, V.K. Occurrence and toxicity of antibiotics in the aquatic environment: A review. Chemosphere 2020, 251, 126351. [Google Scholar] [CrossRef] [PubMed]
- Daghrir, R.; Drogui, P. Tetracycline antibiotics in the environment: A review. Environ. Chem. Lett. 2013, 11, 209–227. [Google Scholar] [CrossRef]
- Wei, R.; Ge, F.; Huang, S.; Chen, M.; Wang, R. Occurrence of veterinary antibiotics in animal wastewater and surface water around farms in Jiangsu Province, China. Chemosphere 2011, 82, 1408–1414. [Google Scholar] [CrossRef] [PubMed]
- Watkinson, A.J.; Murby, E.J.; Costanzo, S.D. Removal of antibiotics in conventional and advanced wastewater treatment: Implications for environmental discharge and wastewater recycling. Water Res. 2007, 41, 4164–4176. [Google Scholar] [CrossRef]
- Ben, W.; Zhu, B.; Yuan, X.; Zhang, Y.; Yang, M.; Qiang, Z. Occurrence, removal and risk of organic micropollutants in wastewater treatment plants across China: Comparison of wastewater treatment processes. Water Res. 2018, 130, 38–46. [Google Scholar] [CrossRef]
- Watkinson, A.J.; Murby, E.J.; Kolpin, D.W.; Costanzo, S.D. The occurrence of antibiotics in an urban watershed: From wastewater to drinking water. Sci. Total Environ. 2009, 407, 2711–2723. [Google Scholar] [CrossRef]
- Li, S.; Shi, W.; Liu, W.; Li, H.; Zhang, W.; Hu, J.; Ke, Y.; Sun, W.; Ni, J. A duodecennial national synthesis of antibiotics in China's major rivers and seas (2005–2016). Sci. Total Environ. 2018, 615, 906–917. [Google Scholar] [CrossRef]
- Lopez-Serna, R.; Jurado, A.; Vazquez-Sune, E.; Carrera, J.; Petrovic, M.; Barcelo, D. Occurrence of 95 pharmaceuticals and transformation products in urban groundwaters underlying the metropolis of Barcelona, Spain. Environ. Pollut. 2013, 174, 305–315. [Google Scholar] [CrossRef]
- Yao, L.; Wang, Y.; Tong, L.; Deng, Y.; Li, Y.; Gan, Y.; Guo, W.; Dong, C.; Duan, Y.; Zhao, K. Occurrence and risk assessment of antibiotics in surface water and groundwater from different depths of aquifers: A case study at Jianghan Plain, central China. Ecotoxicol. Environ. Saf. 2017, 135, 236–242. [Google Scholar] [CrossRef]
- Haddad, T.; Baginska, E.; Kümmerer, K. Transformation products of antibiotic and cytostatic drugs in the aquatic cycle that result from effluent treatment and abiotic/biotic reactions in the environment: An increasing challenge calling for higher emphasis on measures at the beginning of the pipe. Water Res. 2015, 72, 75–126. [Google Scholar] [CrossRef] [PubMed]
- Auerbach, E.A.; Seyfried, E.E.; McMahon, K.D. Tetracycline resistance genes in activated sludge wastewater treatment plants. Water Res. 2007, 41, 1143–1151. [Google Scholar] [CrossRef] [PubMed]
- Chen, Y.; Hu, C.; Qu, J.; Yang, M. Photodegradation of tetracycline and formation of reactive oxygen species in aqueous tetracycline solution under simulated sunlight irradiation. J. Photochem. Photobiol. A Chem. 2008, 197, 81–87. [Google Scholar] [CrossRef]
- Gómez-Pacheco, C.V.; Sánchez-Polo, M.; Rivera-Utrilla, J.; López-Peñalver, J.J. Tetracycline degradation in aqueous phase by ultraviolet radiation. Chem. Eng. J. 2012, 187, 89–95. [Google Scholar] [CrossRef]
- Li, S.; Hu, J.Y. Photolytic and photocatalytic degradation of tetracycline: Effect of humic acid on degradation kinetics and mechanisms. J. Hazard. Mater. 2016, 318, 134–144. [Google Scholar] [CrossRef]
- Schmitt, M.O.; Schneider, S. Spectroscopic investigation of complexation between various tetracyclines and Mg2+ or Ca2+. Phys. Chem. Comm. 2000, 3, 42. [Google Scholar] [CrossRef]
- Chen, W.R.; Huang, C.H. Transformation of tetracyclines mediated by Mn(II) and Cu(II) ions in the presence of oxygen. Environ. Sci. Technol. 2009, 43, 401–407. [Google Scholar] [CrossRef]
- Wang, H.; Yao, H.; Sun, P.; Pei, J.; Li, D.; Huang, C.H. Oxidation of tetracycline antibiotics induced by Fe(III) ions without light irradiation. Chemosphere 2015, 119, 1255–1261. [Google Scholar] [CrossRef]
- Werner, J.J.; Arnold, W.A.; McNeill, K. Water hardness as a photochemical parameter: Tetracycline photolysis as a function of calcium concentration, magnesium concentration, and pH. Environ. Sci. Technol. 2006, 40, 7236–7241. [Google Scholar] [CrossRef]
- Chen, Y.; Li, H.; Wang, Z.; Tao, T.; Hu, C. Photoproducts of tetracycline and oxytetracycline involving self-sensitized oxidation in aqueous solutions: Effects of Ca2+ and Mg2+. J. Environ. Sci. 2011, 23, 1634–1639. [Google Scholar] [CrossRef]
- Caupos, E.; Mazellier, P.; Croue, J.P. Photodegradation of estrone enhanced by dissolved organic matter under simulated sunlight. Water Res. 2011, 45, 3341–3350. [Google Scholar] [CrossRef] [PubMed]
- Li, S.; Hu, J. Transformation products formation of ciprofloxacin in UVA/LED and UVA/LED/TiO2 systems: Impact of natural organic matter characteristics. Water Res. 2018, 132, 320–330. [Google Scholar] [CrossRef]
- Niu, J.F.; Li, Y.; Wang, W.L. Light-source-dependent role of nitrate and humic acid in tetracycline photolysis: Kinetics and mechanism. Chemosphere 2013, 92, 1423–1429. [Google Scholar] [CrossRef] [PubMed]
- Jiao, S.; Zheng, S.; Yin, D.; Wang, L.; Chen, L. Aqueous photolysis of tetracycline and toxicity of photolytic products to luminescent bacteria. Chemosphere 2008, 73, 377–382. [Google Scholar] [CrossRef]
- Elkins, K.M.; Nelson, D.J. Fluorescence and FT-IR spectroscopic studies of Suwannee river fulvic acid complexation with aluminum, terbium and calcium. J. Inorg. Biochem. 2001, 87, 81–96. [Google Scholar] [CrossRef]
- Gao, Y.; Yan, M.; Korshin, G. Effects of calcium on the chromophores of dissolved organic matter and their interactions with copper. Water Res. 2015, 81, 47–53. [Google Scholar] [CrossRef]
- Xiong, P.; Hu, J.Y. Inactivation/reactivation of antibiotic-resistant bacteria by a novel UVA/LED/TiO2 system. Water Res. 2013, 47, 4547–4555. [Google Scholar] [CrossRef]
- Chen, Y.X.; Yang, S.Y.; Wang, K.; Lou, L.P. Role of primary active species and TiO2 surface characteristic in UV-illuminated photodegradation of Acid Orange 7. J. Photochem. Photobiol. A Chem. 2005, 172, 47–54. [Google Scholar] [CrossRef]
- Haag, W.R.; Hoigné, J.; Gassman, E.; Braun, A.M. Singlet oxygen in surface waters. Part 1: Furfuryl alcohol as a trapping agent. Chemosphere 1984, 13, 631–640. [Google Scholar] [CrossRef]
- Chen, W.R.; Huang, C.H. Transformation kinetics and pathways of tetracycline antibiotics with manganese oxide. Environ. Pollut. 2011, 159, 1092–1100. [Google Scholar] [CrossRef]
- Zhao, C.; Pelaez, M.; Duan, X.D.; Deng, H.P.; O'Shea, K.; Fatta-Kassinos, D.; Dionysiou, D.D. Role of pH on photolytic and photocatalytic degradation of antibiotic oxytetracycline in aqueous solution under visible/solar light: Kinetics and mechanism studies. Appl. Catal. B Environ. 2013, 134, 83–92. [Google Scholar] [CrossRef]
- Day, S.T.; Crouthamel, W.G.; Martinelli, L.C.; Ma, J.K.H. Mechanism of fluorometric analysis of tetracycline involving metal complexation. J. Pharm. Sci. 1978, 67, 1518–1523. [Google Scholar] [CrossRef] [PubMed]
- Chi, Z.; Liu, R.; Yang, B.; Zhang, H. Toxic interaction mechanism between oxytetracycline and bovine hemoglobin. J. Hazard. Mater. 2010, 180, 741–747. [Google Scholar] [CrossRef] [PubMed]
- Dryer, D.J.; Korshin, G.V.; Fabbricino, M. In situ examination of the protonation behavior of fulvic acids using differential absorbance spectroscopy. Environ. Sci. Technol. 2008, 42, 6644–6649. [Google Scholar] [CrossRef]
- Sun, W.L.; Xia, J.; Li, S.; Sun, F. Effect of natural organic matter (NOM) on Cu(II) adsorption by multi-walled carbon nanotubes: Relationship with NOM properties. Chem. Eng. J. 2012, 200-202, 627–636. [Google Scholar] [CrossRef]
- Miano, T.M.; Senesi, N. Synchronous excitation fluorescence spectroscopy applied to soil humic substances chemistry. Sci. Total Environ. 1992, 118, 41–51. [Google Scholar] [CrossRef]
- Zhou, P.; Yan, H.; Gu, B. Competitive complexation of metal ions with humic substances. Chemosphere 2005, 58, 1327–1337. [Google Scholar] [CrossRef]
- Kinniburgh, D.G.; Milne, C.J.; Benedetti, M.F.; Pinheiro, J.P.; Filius, J.; Koopal, L.K.; Van Riemsdijk, W.H. Metal ion binding by humic acid: Application of the NICA-Donnan model. Environ. Sci. Technol. 1996, 30, 1687–1698. [Google Scholar] [CrossRef]
- Esteves da Silva, J.C.G.; Machado, A.A.S.C.; Oliveira, C.J.S.; Pinto, M.S.S.D.S. Fluorescence quenching of anthropogenic fulvic acids by Cu(II), Fe(III) and UO22+. Talanta 1998, 45, 1155–1165. [Google Scholar] [CrossRef]
- Burgess, J.; Raven, E. Calcium in biological systems. In Advances in Inorganic Chemistry; Rudi van, E., Colin, D.H., Eds.; Academic Press: Cambridge, MA, USA, 2009; Volume 61, pp. 251–366. [Google Scholar]
Figure 1.
Photolytic degradation of tetracycline (TC) with increasing Ca(II) concentrations. Plot of C/C0 versus irradiation time (a), TC removal percentages by complexation and photodegradation (b).
Figure 1.
Photolytic degradation of tetracycline (TC) with increasing Ca(II) concentrations. Plot of C/C0 versus irradiation time (a), TC removal percentages by complexation and photodegradation (b).

Figure 2.
The rate constants of TC in the presence of Ca(II) and humic acid (HA)-Ca(II) complex with (a) and without (b) scavengers.
Figure 2.
The rate constants of TC in the presence of Ca(II) and humic acid (HA)-Ca(II) complex with (a) and without (b) scavengers.

Figure 3.
UV-Vis absorbance (a), changes in UV-Vis absorbance (b) and normalized (to highest peak) synchronous fluorescence (SyF) spectra (c) of TC with increasing Ca(II) concentrations.
Figure 3.
UV-Vis absorbance (a), changes in UV-Vis absorbance (b) and normalized (to highest peak) synchronous fluorescence (SyF) spectra (c) of TC with increasing Ca(II) concentrations.

Figure 4.
Chemical structure of TC and possible complexation sites with Ca(II).

Figure 5.
Fluorescence excitation-emission matrix (EEM) of TC with increasing Ca(II) concentrations (top panel, a) and EEM of fluorescence variation (ΔEEM) by Ca(II) (bottom panel, b). ΔEEM (+) indicated the fluorescence was enhanced by Ca(II) addition.
Figure 5.
Fluorescence excitation-emission matrix (EEM) of TC with increasing Ca(II) concentrations (top panel, a) and EEM of fluorescence variation (ΔEEM) by Ca(II) (bottom panel, b). ΔEEM (+) indicated the fluorescence was enhanced by Ca(II) addition.

Figure 6.
UV-Vis absorbance (a), changes in UV-Vis absorbance (b) and normalized (to highest peak) SyF spectra (c) of HA with increasing Ca(II) concentrations.
Figure 6.
UV-Vis absorbance (a), changes in UV-Vis absorbance (b) and normalized (to highest peak) SyF spectra (c) of HA with increasing Ca(II) concentrations.

Figure 7.
SyF quenching of HA by Ca(II) (a) and plots of the modified Stern-Volmer Equation (b).

© 2020 by the authors. Licensee MDPI, Basel, Switzerland. This article is an open access article distributed under the terms and conditions of the Creative Commons Attribution (CC BY) license (http://creativecommons.org/licenses/by/4.0/).
Share and Cite
MDPI and ACS Style
Li, S.; He, Y.; Kong, F.; Sun, W.; Hu, J. Photolytic Degradation of Tetracycline in the Presence of Ca(II) and/or Humic Acid. Water 2020, 12, 2078. https://doi.org/10.3390/w12082078
AMA Style
Li S, He Y, Kong F, Sun W, Hu J. Photolytic Degradation of Tetracycline in the Presence of Ca(II) and/or Humic Acid. Water. 2020; 12(8):2078. https://doi.org/10.3390/w12082078
Chicago/Turabian StyleLi, Si, Yiyan He, Fanguang Kong, Weiling Sun, and Jiangyong Hu. 2020. "Photolytic Degradation of Tetracycline in the Presence of Ca(II) and/or Humic Acid" Water 12, no. 8: 2078. https://doi.org/10.3390/w12082078
Note that from the first issue of 2016, this journal uses article numbers instead of page numbers. See further details here.