Water Quality Index of Suceava River in Suceava City Metropolitan Area


1
Department of Geography, Ștefan cel Mare University of Suceava, 720229 Suceava, Romania
2
Department of Computers, Electronics and Automation, Ștefan cel Mare University of Suceava, 720229 Suceava, Romania
*
Author to whom correspondence should be addressed.
Water 2020, 12(8), 2111; https://doi.org/10.3390/w12082111
Submission received: 31 May 2020
/
Revised: 17 July 2020
/
Accepted: 23 July 2020
/
Published: 25 July 2020
Abstract
:The water quality of rivers worldwide is of persistent interest due to its impact on human life. Five streamwater quality parameters of Suceava River were monitored in 2019 upstream and downstream of Suceava city, Romania: dissolved oxygen, specific conductivity, pH, oxidation-reduction potential, and temperature. Data was recorded at a high temporal frequency, every hour, and produced Water Quality Index (WQI) time series of similar resolution. Our additive WQI has variants with particular advantages. Water quality of Suceava city exhibits a diurnal cycle. Upstream, WQI values indicate a quasi-permanent good water quality; downstream, the water quality oscillates around the average WQI value because of the various sources of water contaminants, especially the wastewaters from the wastewater treatment plant. Parameters from this point source of pollution are taken into account to explain the decaying streamwater quality towards the end of 2019. WQI is useful for detecting time intervals when water self-purification events have a high chance of occurrence.
1. Introduction
Water quality of rivers is of high interest to scientists and communities alike. The concern over streamwater quality in urban areas is even greater, given the fact that cities generate many wastewaters [1]. River water quality is assessed for various purposes in many domains, ranging from economy to human health and ecology [2]. A water quality index (WQI) is a dimensionless number that aggregates the values of water quality parameters through a method that properly indicates the water quality [3]. Rudimentary forms of WQI can be traced back to 1848 [4] and the first modern WQI was proposed by Horton [5] in 1965. Since then, many methods to calculate WQI were proposed, depending on necessity and on the available water quality parameters [6,7,8,9,10]. There are four steps that can be involved in the process of creating a WQI: (a) choosing the water quality parameters (physical, chemical, biological); (b) combining the chosen parameters into sub-indices or converting them to a common scale; (c) attributing equal or inequal weights to the products of the previous step; (d) aggregation of the weighted elements into a final index, computed through various formulae [3]. Some of the most widely used WQIs are NSFWQI (National Sanitation Foundation Water Quality Index [6]), CCMEWQI (Canadian Council of Ministers of the Environment Water Quality Index [11]), HWQI (House’s Water Quality Index [12]), or OWQI (Oregon Water Quality Index [13]). Despite the many efforts to create better WQIs, there is still no commonly accepted methodology [14], partly because of the regional peculiarities of the analyzed waters; as result, some studies focus on creating WQIs with applicability at national levels [15]. The calculus of WQI can use various references, such as the national standards for water quality [16,17] or the site-specific conditions [14].
Often, the process of choosing and adjusting parameters for use in WQI rely on expert judgement (e.g., using the Delphi technique). Attempts to remove subjectivism in assessing the importance of parameters available for WQI are based on multivariate statistical techniques, which may increase the level of certainty [14,18].
In general, the WQI calculation uses a transformation to a common scale of the chosen parameters (generating sub-indices) and, optionally, a differential weighting of the transformed values before an aggregation method is applied [4]. Nevertheless, some WQIs use the actual values of the parameters in the calculus of the final index, avoiding standardization [11,19]. There are two most common methods of aggregating the sub-indices: additive and multiplicative [3]. Advantages and disadvantages arise from the use of one method or another, as resulting from the review studies on WQI [3,20], which also highlight the relativity of the results caused by the selected type of WQI. Even for the same WQI, changing the original parameters require precaution in interpreting the results—for example, using orthophosphates and total suspended solids, instead of total phosphorus and total solids—leads to important changes in the NSFWQI values [21].
Electrical conductivity, temperature, pH, and dissolved oxygen are cost-effective water parameters used in many WQIs [22] and nowadays these parameters are included in many continuous monitoring networks [23]. Long time series from continuous monitoring help in predicting the water quality index class of the monitored rivers [24] and the trend analysis may assist managers in allocating funds for improving environment quality [4].
WQI is sometimes used in studies about water quality of Romanian rivers [25,26], especially in studies about Danube [27,28]. An upstream–downstream decrease in water quality is observed [29] and the seasonality of variations is discussed [30]. Fewer are the studies that focus on distinguishing the impact of cities on the spatial variability of WQI [31,32,33]. Suceava River was previously included in a WQI study [29] that analyzed the general upstream–downstream water quality decrease, without including the area of Suceava city. Additionally, to our knowledge, there is no study that discusses the diurnal cycle of streamwater quality.
The aim of our study is to calculate the WQI of Suceava River by using the measurements from water monitoring stations located upstream and downstream of Suceava city and to discuss its variability and possible adaptations and usefulness. The research objectives are to provide a WQI that is well suited for assessing the changes in streamwater quality induced by a city by using the upstream monitoring station as reference and to analyze periodicities in the WQI time series.
2. Materials and Methods
2.1. Study Area
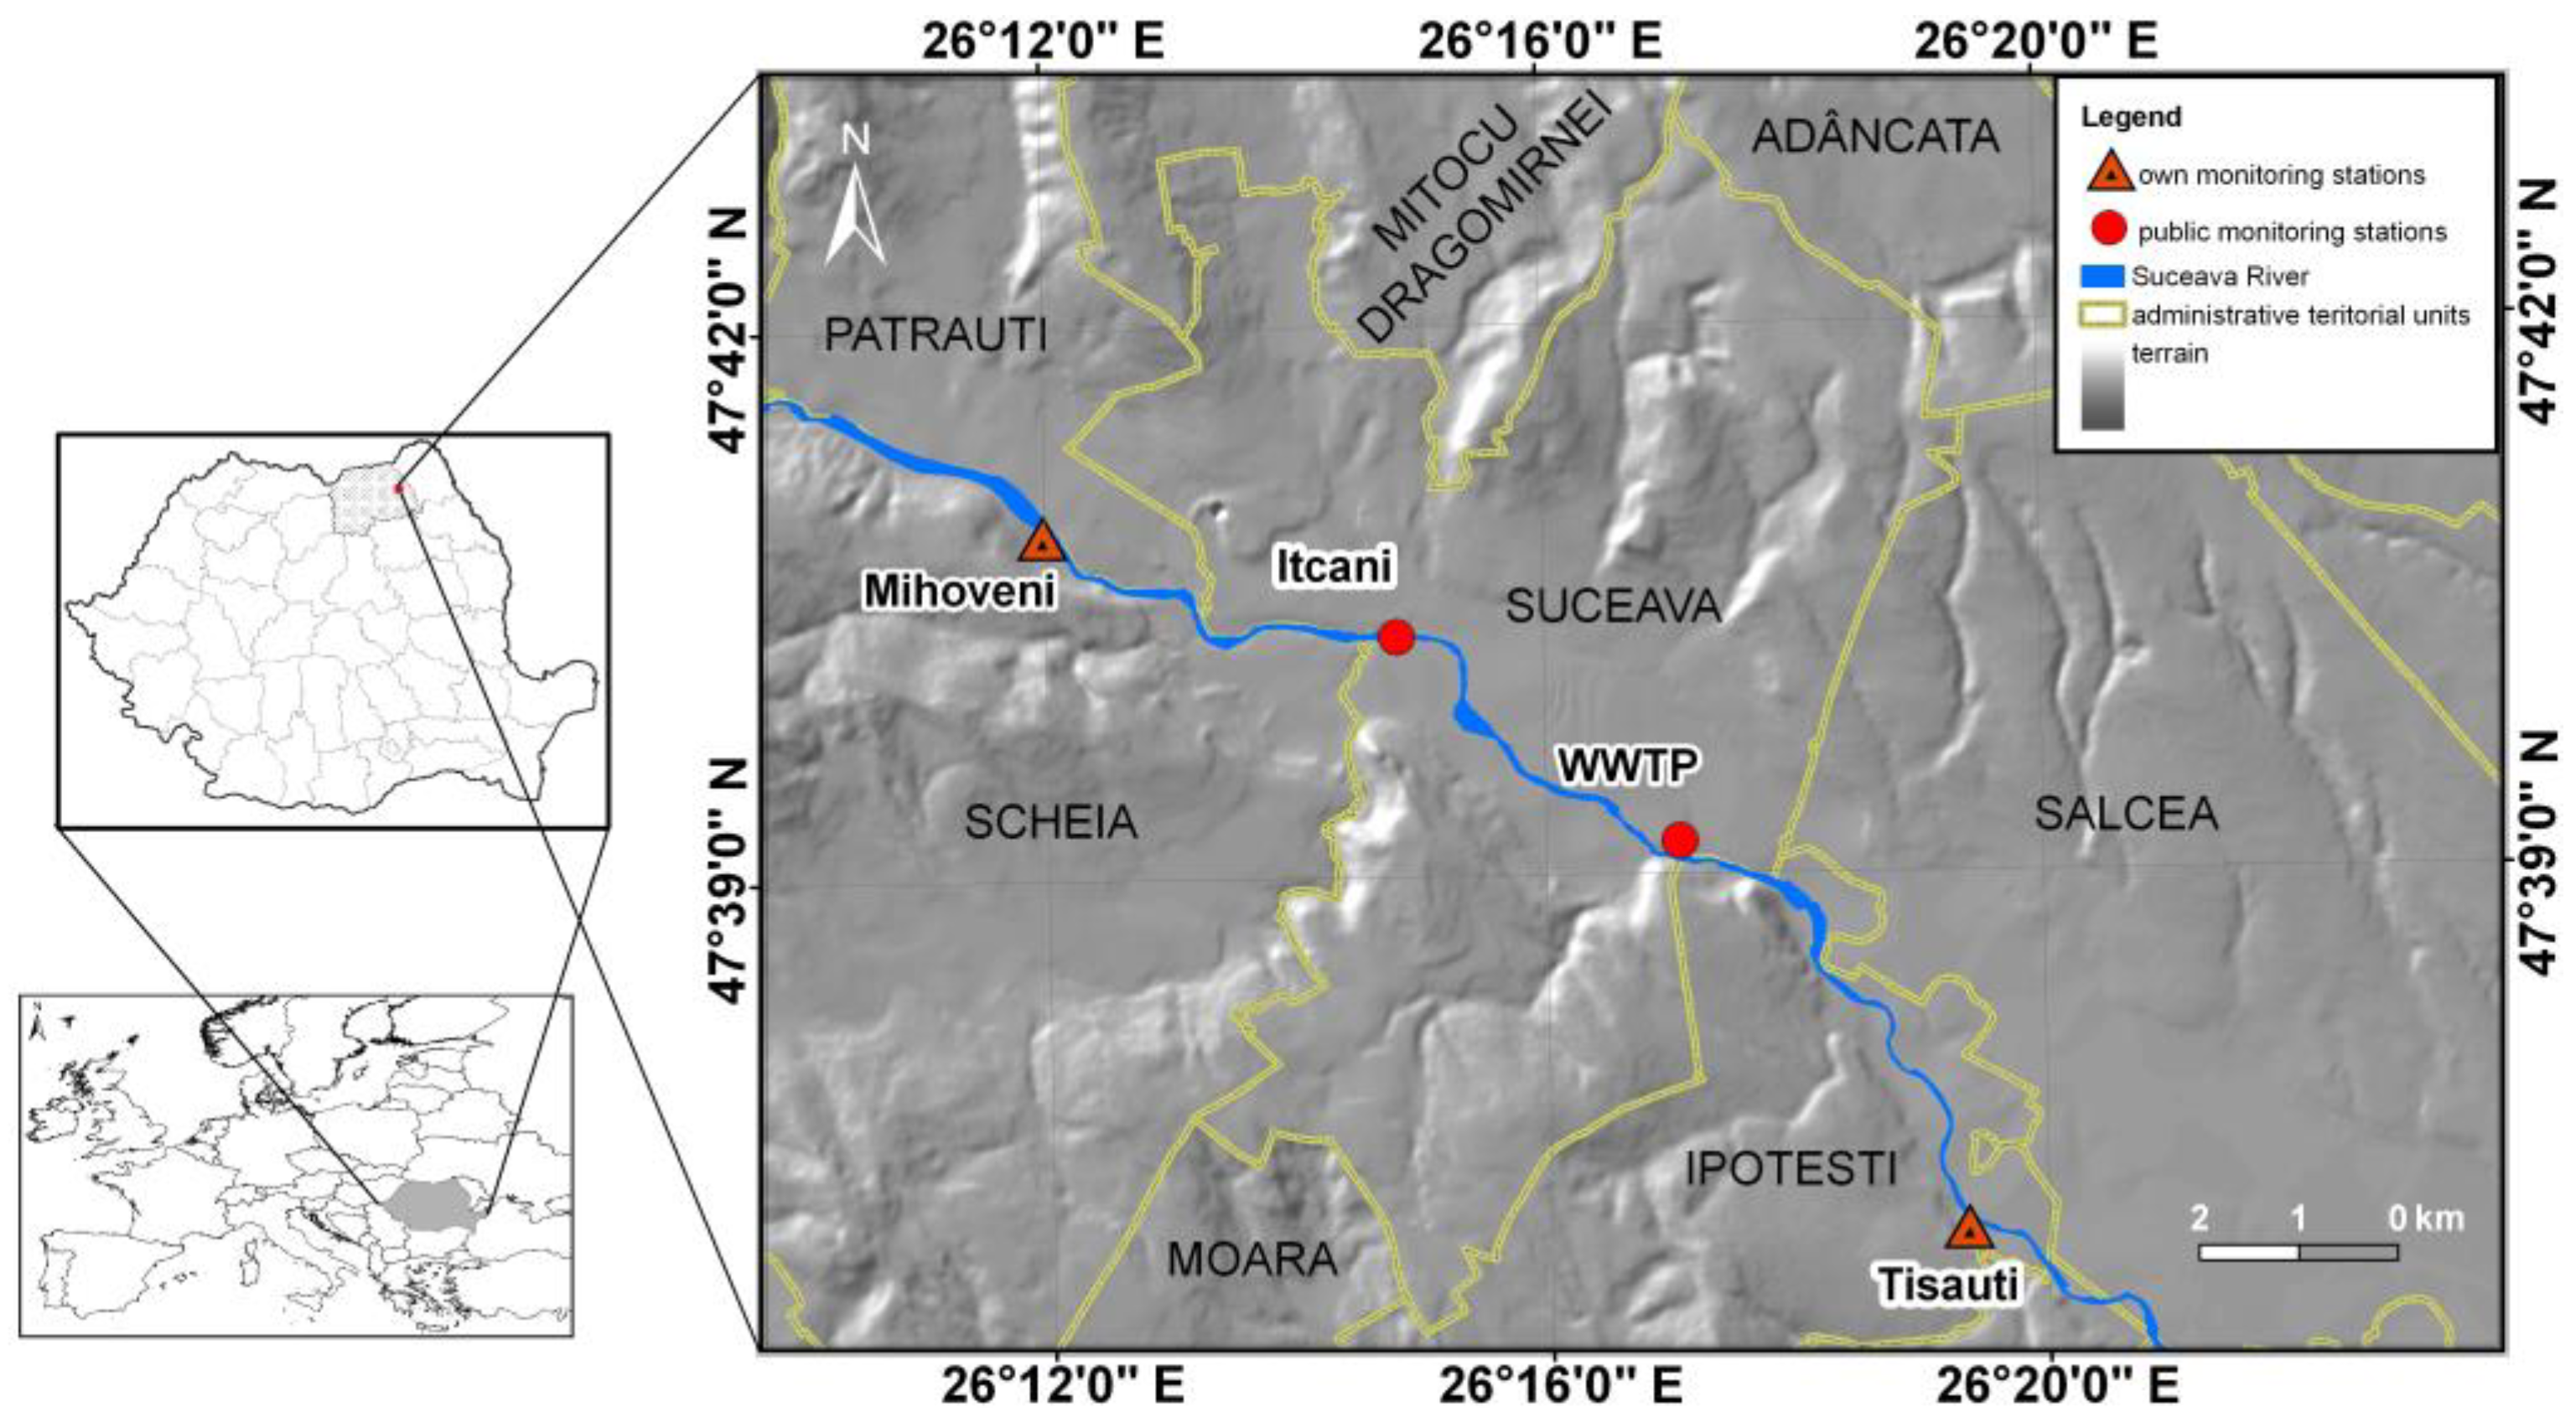
Suceava metropolitan area is located in Suceava Plateau, NE Romania (Figure 1). Climate is temperate continental, with 8.16 °C mean air temperature and 621 mm sum of atmospheric precipitation. The metropolitan area comprises two cities, Suceava and its satellite city, Salcea, and numerous peri-urban villages. This area is centered on Suceava River valley. Suceava River is a tributary of Siret River, which is a tributary of Danube. It has an average flow rate of 16.87 m3/s at Iţcani station [34]. It collects urban tributaries that transfer the impact of the urban areas into their collector (chemical and thermal pollution [35,36]). Downstream of Suceava city there is the wastewater treatment plant (WWTP) of Suceava city, which collects most wastewaters of the metropolitan area. Small amounts of untreated wastewaters are discharged into Suceava River through some urban tributaries [34].
Suceava River has high waters usually during April–August, due to snowmelts (in spring) and intense summer rainfalls. Upstream of Suceava city, at Mihoveni, there is a small dam built for run-of-the-river hydroelectricity. In the same place, some river water is collected for treatment and serves as potable water for some quarters of Suceava city (in the floodplain). Water quality here is considered, therefore, as being good and we used this location as a site for continuously monitoring some water parameters. We also used for monitoring a site that is representative for the negative impact of the city on Suceava River water quality—this other site is at Tişăuţi, downstream of Suceava city, where the waters from WWTP are well mixed with those of Suceava River.
2.2. Instruments
The instruments used at Mihoveni and Tişăuţi stations are AquaTROLL 500 multiparameters and Tube 300R units, both provided by In-Situ. The sensors attached to these instruments allowed for measurements of high resolution and accuracy of dissolved oxygen (DO; ±0.1 mg/L accuracy, 0.01 mg/L resolution), specific conductivity (SC; ±0.5% of reading +1 µS/cm accuracy, 0.1 µS/cm resolution), pH (±0.1 pH unit accuracy, 0.01 pH resolution), oxidation reduction potential (ORP; ±5 mV accuracy, 0.1 mV resolution), water temperature (T-SV; ±0.1 °C accuracy, 0.01 °C resolution), and water level (±0.1% full scale (9 m) accuracy, 0.01% full scale resolution). The instruments were calibrated periodically and, also, the aquatic sites were regularly checked for representativeness.
2.3. Data
Data used in this study cover the entire year 2019 and are represented by time series from our own measurements and time series from measurements undertaken by various public institutions. Our monitoring stations measured DO, SC, pH, ORP, water temperature and level every hour. Data provided by public entities are represented by data from the National Administration “Romanian Waters”/Siret Water Basin Administration (daily water level at Iţcani gauge and monthly total nitrogen (TN) concentrations at Mihoveni and Tişăuţi) and by data from ACET Suceava (the company that manages WWTP—hourly data of suspended matter (SM), biological oxygen demand (BOD5), chemical oxygen demand (CODCr), TN, total phosphorus (TP), synthetic detergents (SD), total dissolved solids (TDS), discharge (Q-WWTP), and temperature (T-WWTP)).
Streamwater data analyzed in this study has a length of 1 year because our time series length is shorter than 2 years and because we intended to analyze trends in WQI during a calendar year, the annual cycle, and the sub-annual variability.
2.4. Analysis Methods
The principal component analysis (PCA) is a projection method that, in its simplest form, projects observations to a bidimensional space where the axes represent dimensions which conserve maximum information about the total variance of the dataset. This method is widely used today when selecting statistical methods to decide the number of parameters to be included in WQI and their weight [14,37,38]. PCA calculates the variance of the data set and can considerably reduce the number of necessary parameters, conserving, at the same time, the maximum variance [39]. PCA was applied in XLSTAT for obtaining a multivariate data analysis of the parameters available for this study. The PCA type was Pearson correlation and used only quantitative variables. The PCA analysis produces correlation circles based on two principal components. The first principal component is represented by the horizontal axis in the correlation circle, while the secondary principal component is represented by the vertical axis. The length of a vector/variable on the correlation circles represents how well their correlation with other vectors/variables is described by the first two principal components of PCA (the length of the circle radius is the best fit). Vectors that generate obtuse angles have negative relationships, in opposition to vectors placed close to each other, which are positively linked.
The wavelet transform is a mathematical technique useful in signal detection, including signals of water quality parameters, such as the annual or seasonal cycles [40,41]. The wavelets are functions used to represent data according to some repetitive patterns and a finite number of scales/resolutions and offers a perspective of both the entire dataset and its details at the same time. Wavelet transforms of the raw time series were carried out in order to obtain scalograms of the wavelet coherence (WTC) analysis. We applied the wavelet coherence method of Grinsted [42] for creating WTC scalograms of the selected parameters, which indicate the time when periodicities in two time series are coherent. The wavelet analysis used Morlet as mother wavelet because this nonorthogonal wavelet function has proven to provide good results in wavelet coherence analyses of geophysical time series [35,36]. The cone of influence on scalograms is created by the edge effects specific to finite time series. Additionally, some areas with high coherence power (red color) are enclosed by thick black contours, meaning that those areas have 0.95 confidence level against AR1 red noise [43]. The WTC scalograms contain arrows with various orientations: right means that the selected time series are in-phase; left means anti-phase; down means that series 1 leads series 2 by 90°. For equations of the wavelet analysis, see our complementary study [35].
A water quality index (WQI) was computed by using a modified additive type formula specific to WQI calculation:
where P are normalized parameters whose high values mean high water quality and N are normalized parameters whose high values mean low water quality; n is the maximum number of parameters of a certain type (P or N)—its absolute value varies depending on the type of parameters (e.g., 3 for P and 2 for N). The time series of each parameter was normalized between 0 and 1 by dividing the difference between each value and the minimum of the time series by the difference of the maximum and minimum values of the time series. Parameters of type P are DO, pH, and ORP. N-type parameters are SC and T-SV. The positive or negative impact of the fluctuation of these parameters on water quality of Suceava River was established in our previous studies on this river [20,21,22]. Equation (1) is flexible and is involved in two calculations. The first calculus is that of the main WQI, where all parameters are included. As the total number of parameters in this study is 5, the maximum water quality is indicated by the maximum value (3 points) and the worst by the lowest value (−2), while the average value is 0.5. The second calculus is that of the case study when we remove DO and T-SV: the new WQI maximum and minimum values are 2 and, respectively, −1; the average value remains 0.5. As a rule, the maximum value is equal to the number of P-type parameters, the minimum value is equal to the negative of the number of N-type parameters and the average value is the mean of the maximum and minimum values.
3. Results and Discussion
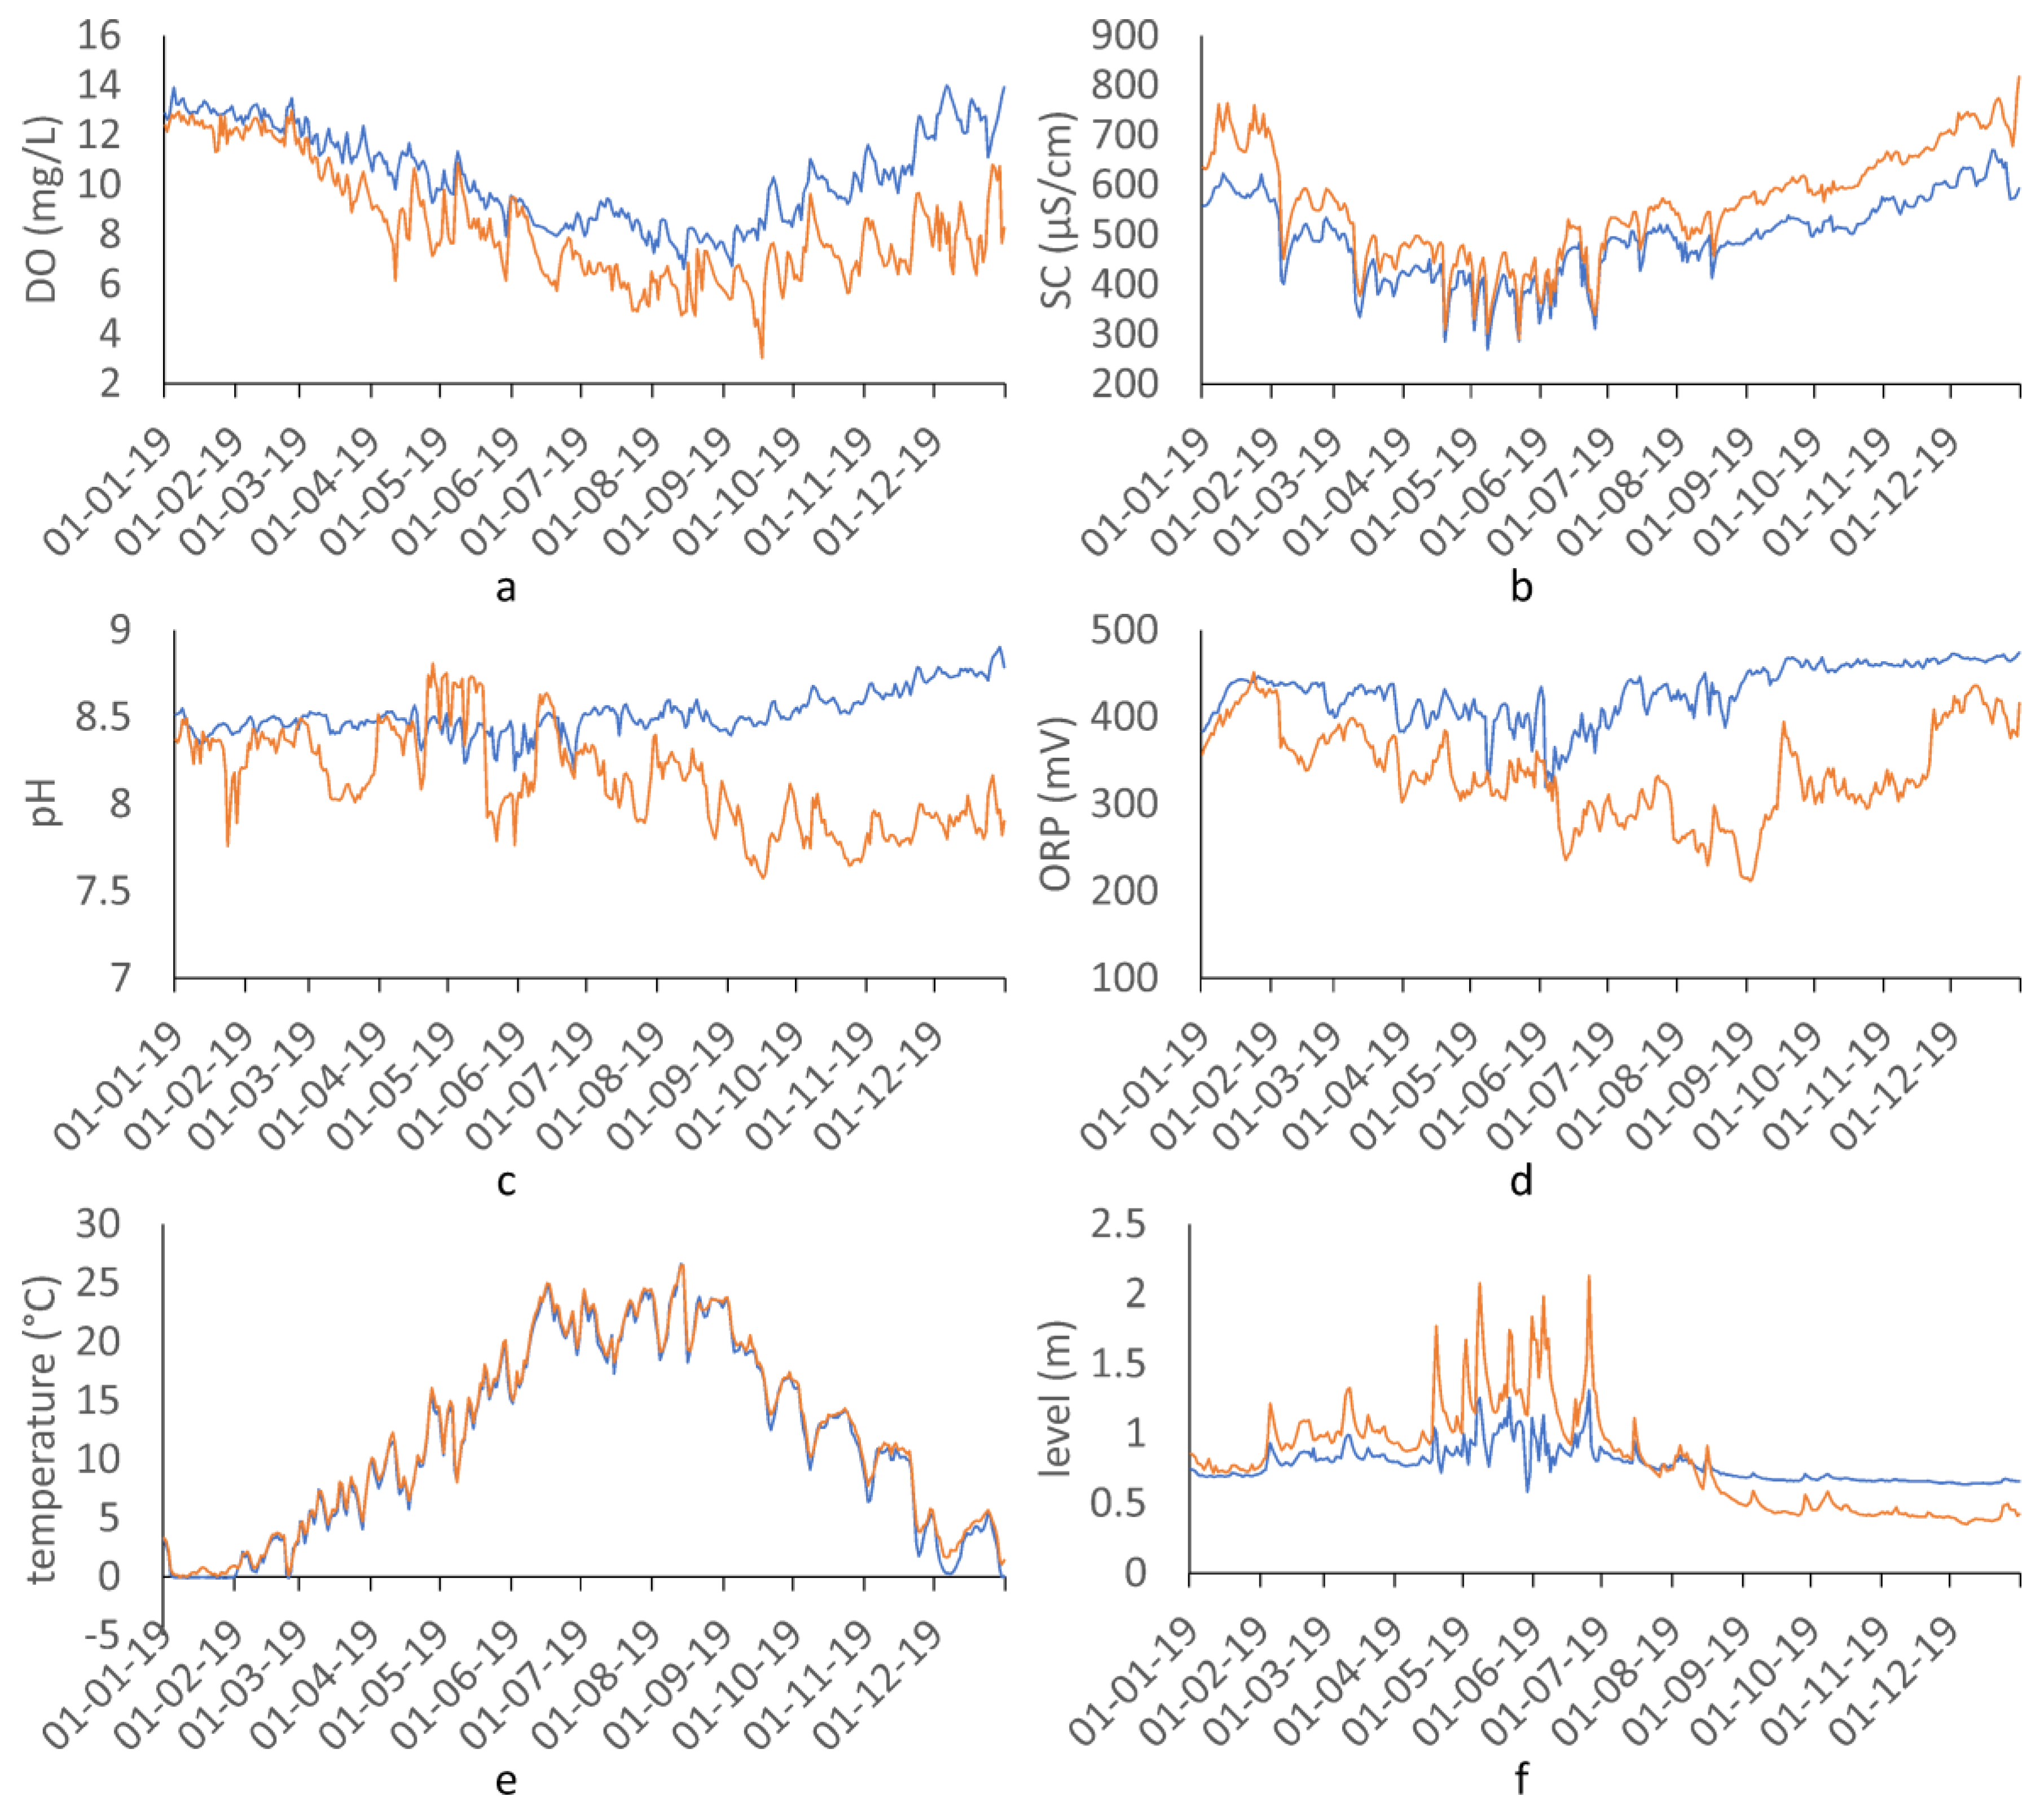
The upstream–downstream changes in the values of the monitored water parameters of Suceava River are specific to those of urban waters impacted by cities (Figure 2, Table 1, Supplementary Materials Tables S1 and S2). DO is lower downstream because of the increased chemical oxygen demand generated by treated and untreated wastewaters. The increased amount of dissolved solids is indicated by the higher SC downstream. ORP and pH usually have lower values downstream. ORP of Suceava River decreases downstream because of the input of wastewaters from WWTP, which have negative ORP values. The same wastewaters have SC greater than 800 µS/cm (usually over 1000 µS/cm, as revealed by wastewater TDS (data from WWTP) conversion into wastewater SC and aperiodic field measurements of SC carried out with a portable Hach HQ40d multiparameter). The average discharge of WWTP in 2019 was 0.34 m3/s, much lower than the average discharge of Suceava River in the same year (19.5 m3/s at Iţcani gauge station). Even so, WWTP is responsible for most of the urban thermal pollution of Suceava River [22], which is 0.43 °C warmer downstream. The streamwater level recorded an annual variation specific to this river [20], respectively, an increase in the later spring and summer and a decrease in the autumn and early winter.
The average hourly values of the water quality parameters at the upstream (Mihoveni) versus the downstream (Tişăuţi) monitoring points were: 10.39 mg/L vs. 8.38 mg/L DO, 491.89 µS/cm vs. 559.97 mg/L SC, 429.09 mV vs. 336.12 mV ORP, 8.52 vs. 8.13 pH, and 11.54 °C vs. 11.97 °C temperature. During a year, the lowest SC values are corelated with high waters, caused especially by summer rainfalls. The negative air temperature during winter months forces the streamwater temperature to fluctuate slightly around 0 °C, but contributes to the greater concentration of DO. Daily oscillations of all parameters, created by the day/night cycle, were observed and have a high temporal and spatial variability [20,21,22].
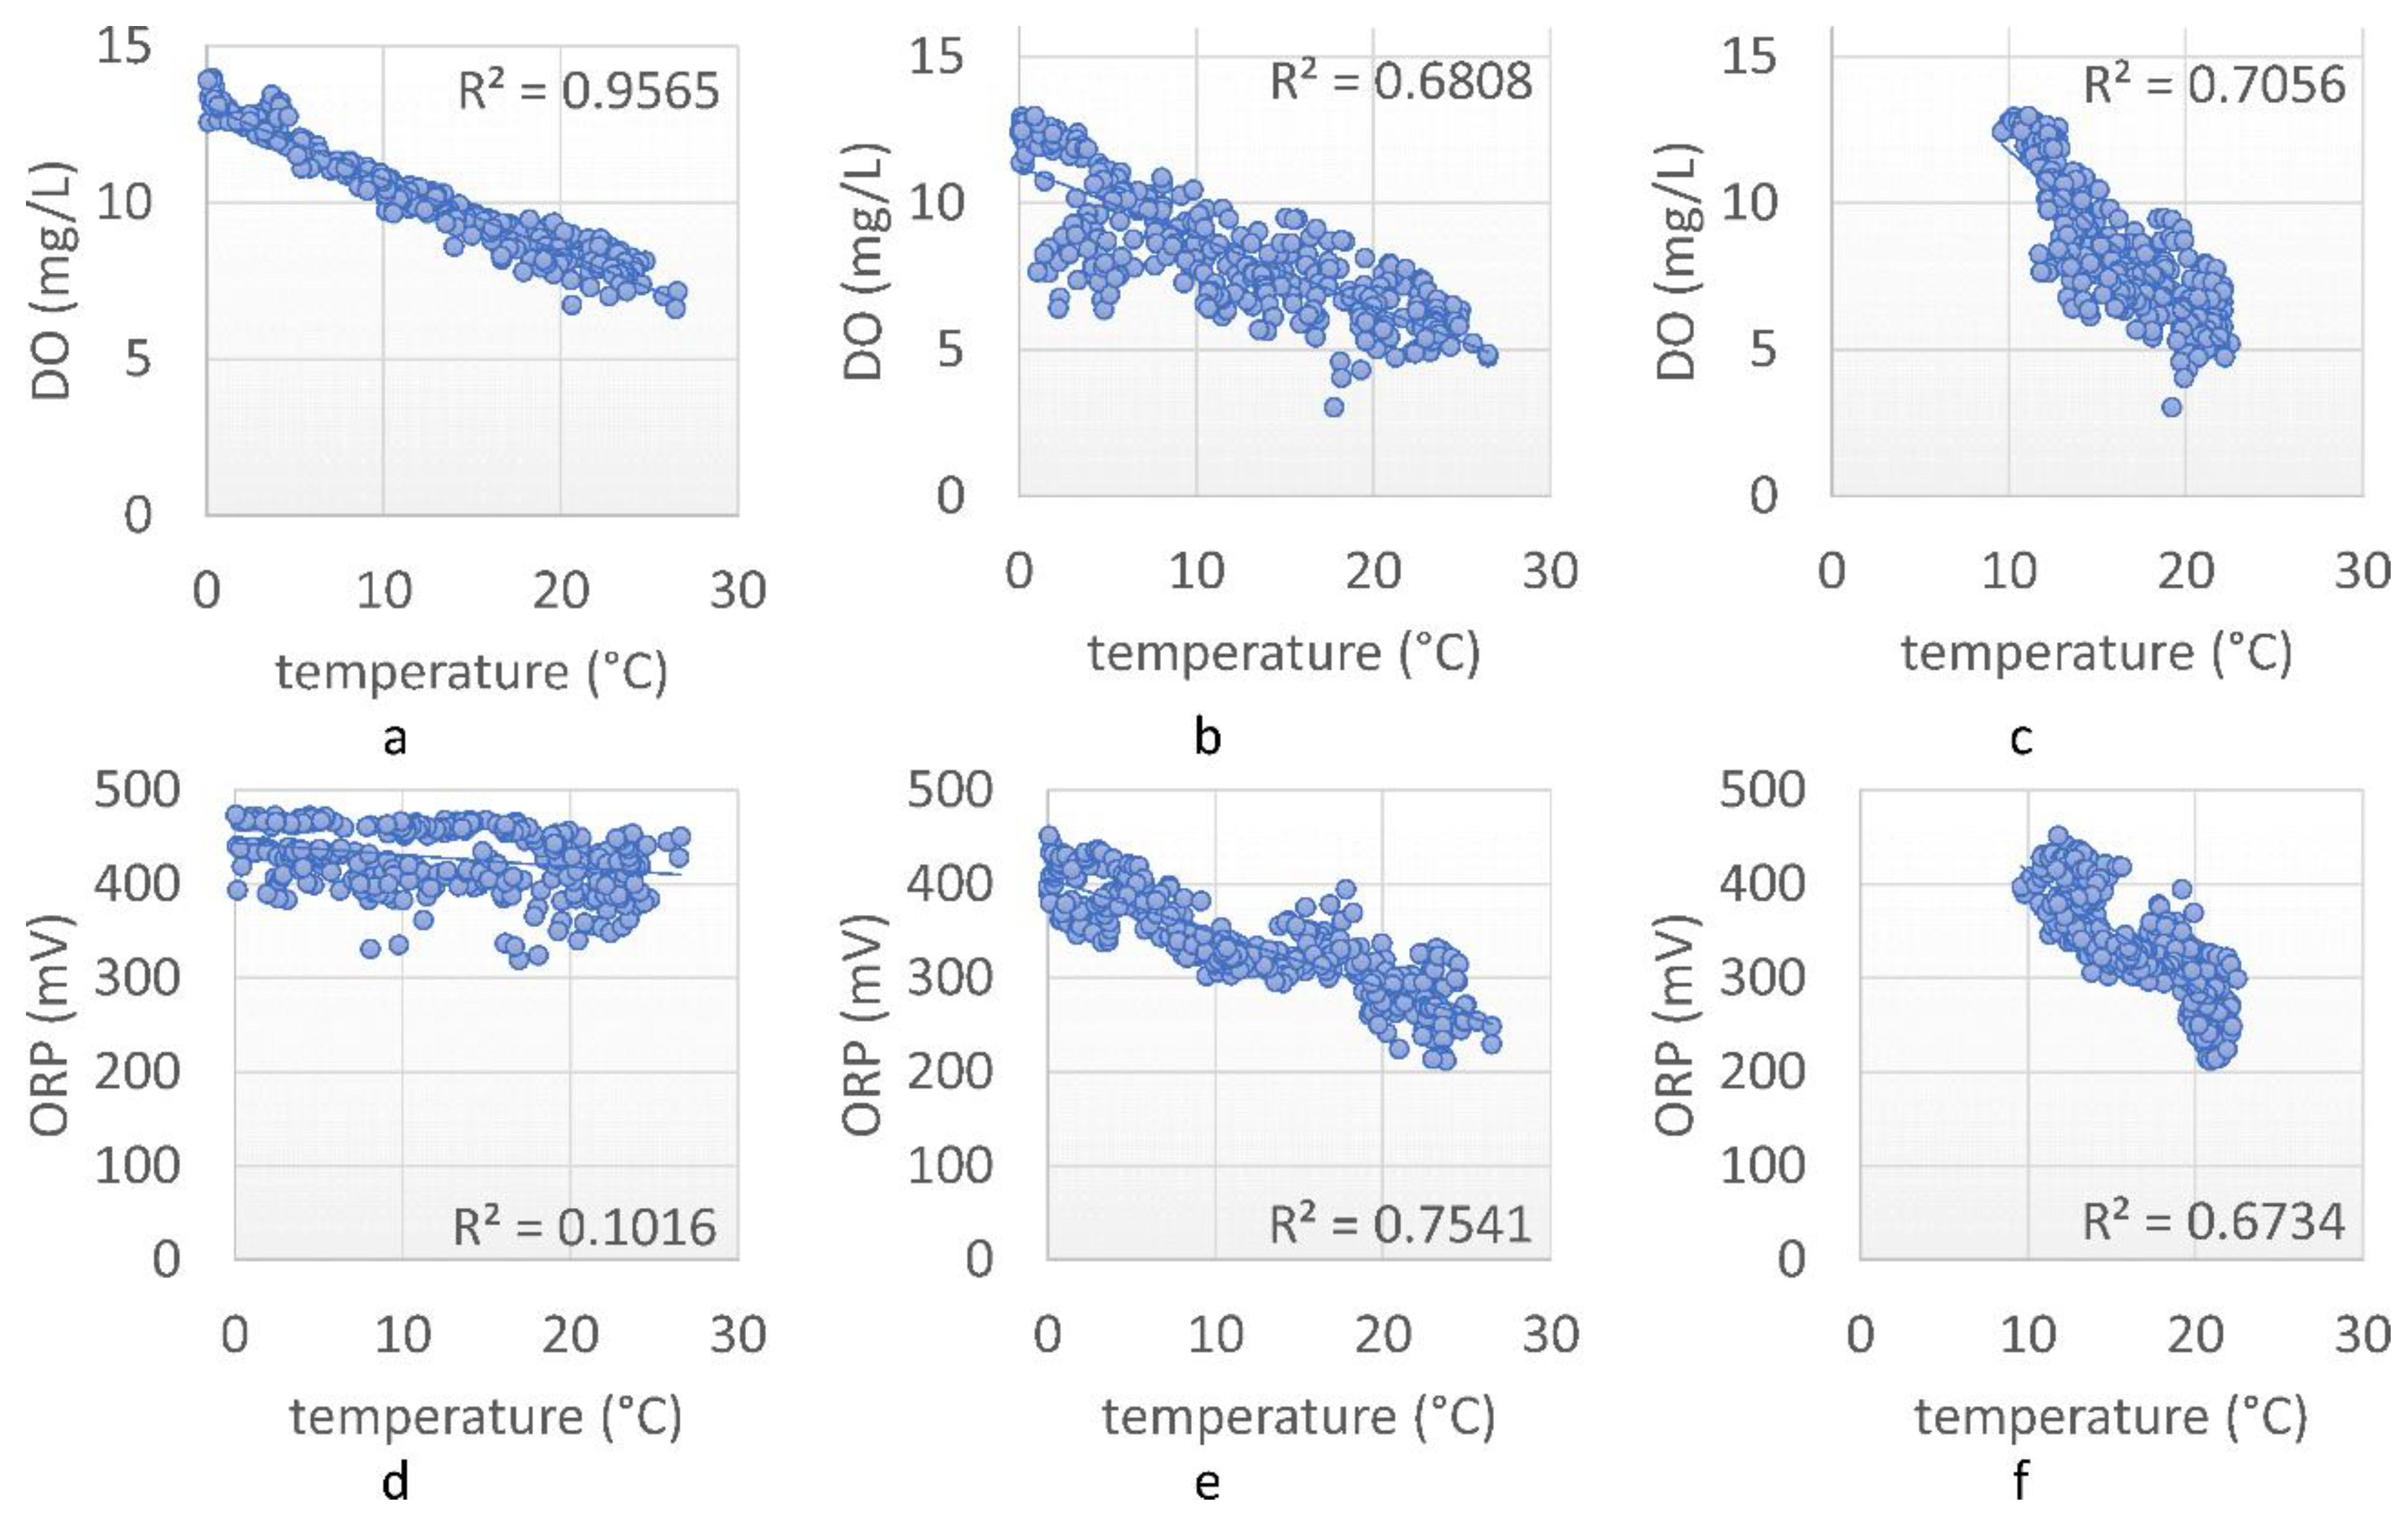
The relationship between water temperature and other parameters reveals the impact of urban wastewaters on Suceava River. There is a very good correlation (0.95) between streamwater temperature and DO at the upstream station (Mihoveni), but only a good one (0.68) at the downstream station (Tişăuţi)—Figure 3. The latter correlation is similar to that between streamwater DO at the downstream point and the temperature of wastewaters from WWTP.
The average daily temperature of these wastewaters in 2019 was 16.3 °C and the minimum value was 9.6 °C—both of them are much higher than their counterparts in streamwater. Additionally, streamwater ORP and temperature have very weak correlation upstream of Suceava city, but a good correlation downstream, caused by the wastewaters from WWTP.
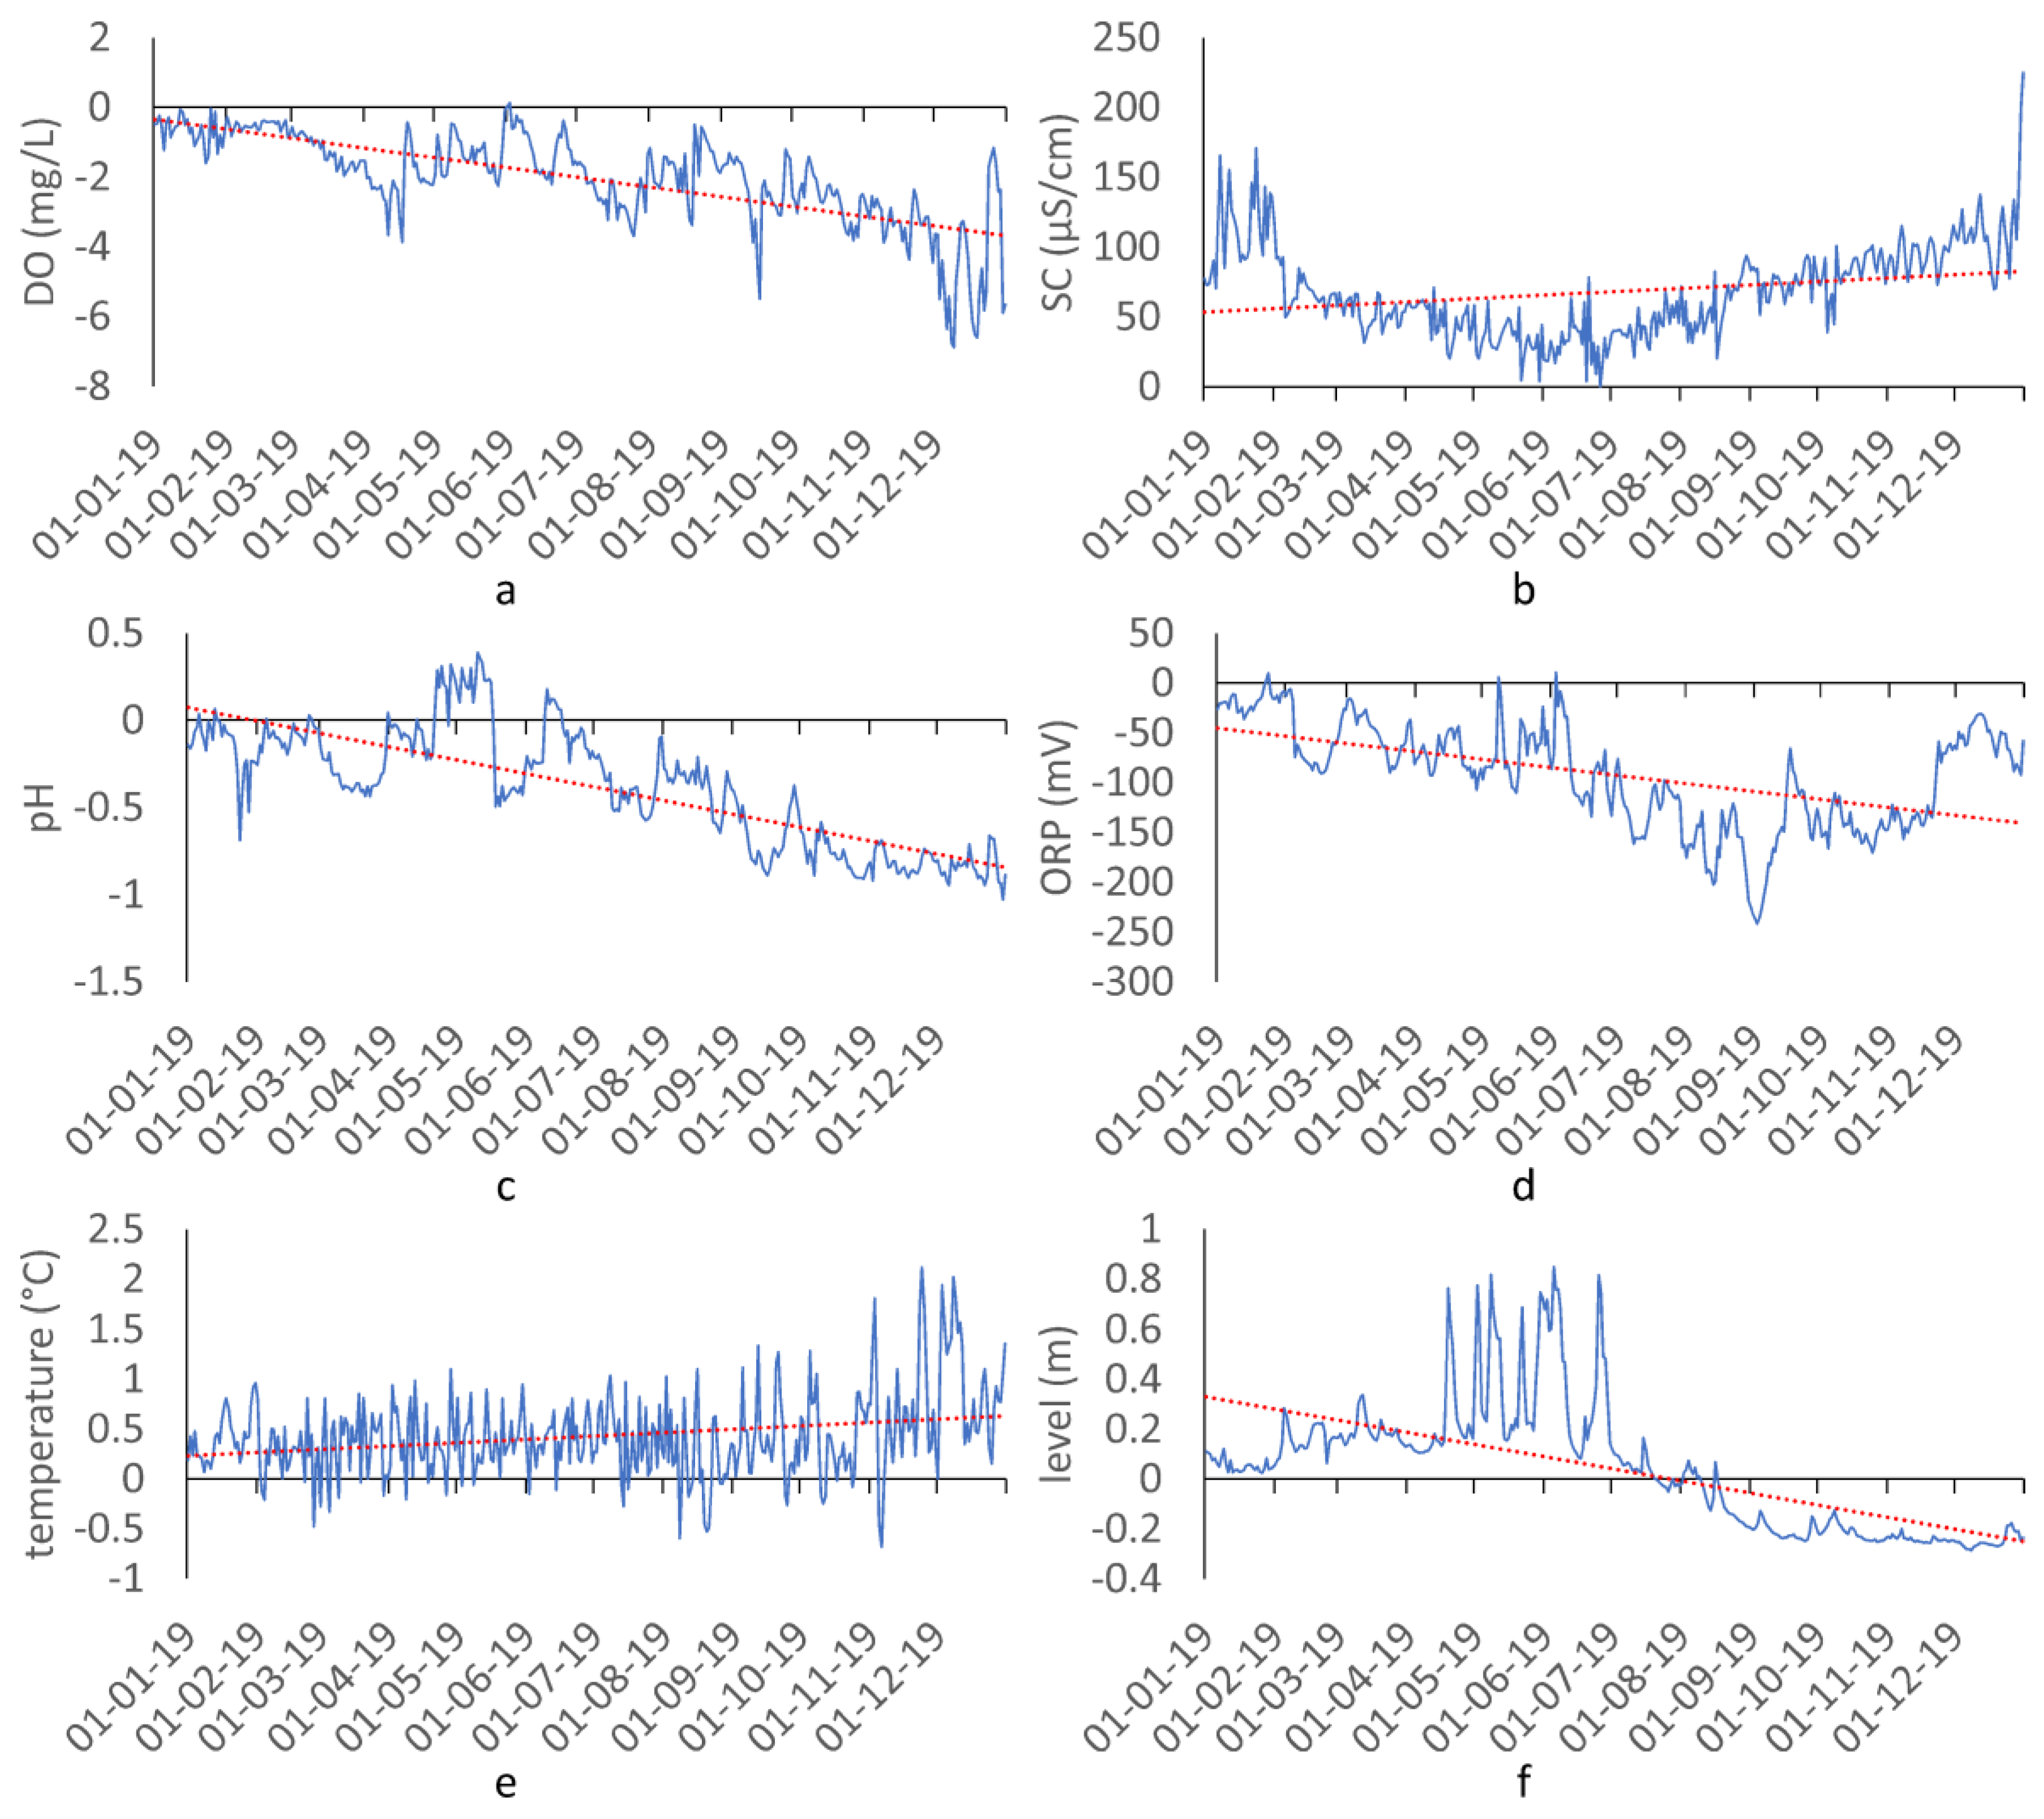
The difference between the hourly values of the upstream and downstream stations in 2019 indicates a worsening of the water quality towards the end of the year (Figure 4). The values of DO, pH, and ORP downstream are becoming much lower than upstream in the second half of 2019 or towards the end of 2019, while the differences in SC and temperature are growing. A partial explanation of the observed trends is the very low level/flow rate of Suceava River in the autumn of 2019 and December 2019. In the last 4 months of 2019, the mean flow rate was only 4.01 m3/s at Iţcani, which is close to historical minima and was caused by insufficient rainfalls in the catchment (Supplementary Figure S1 and Table S3).
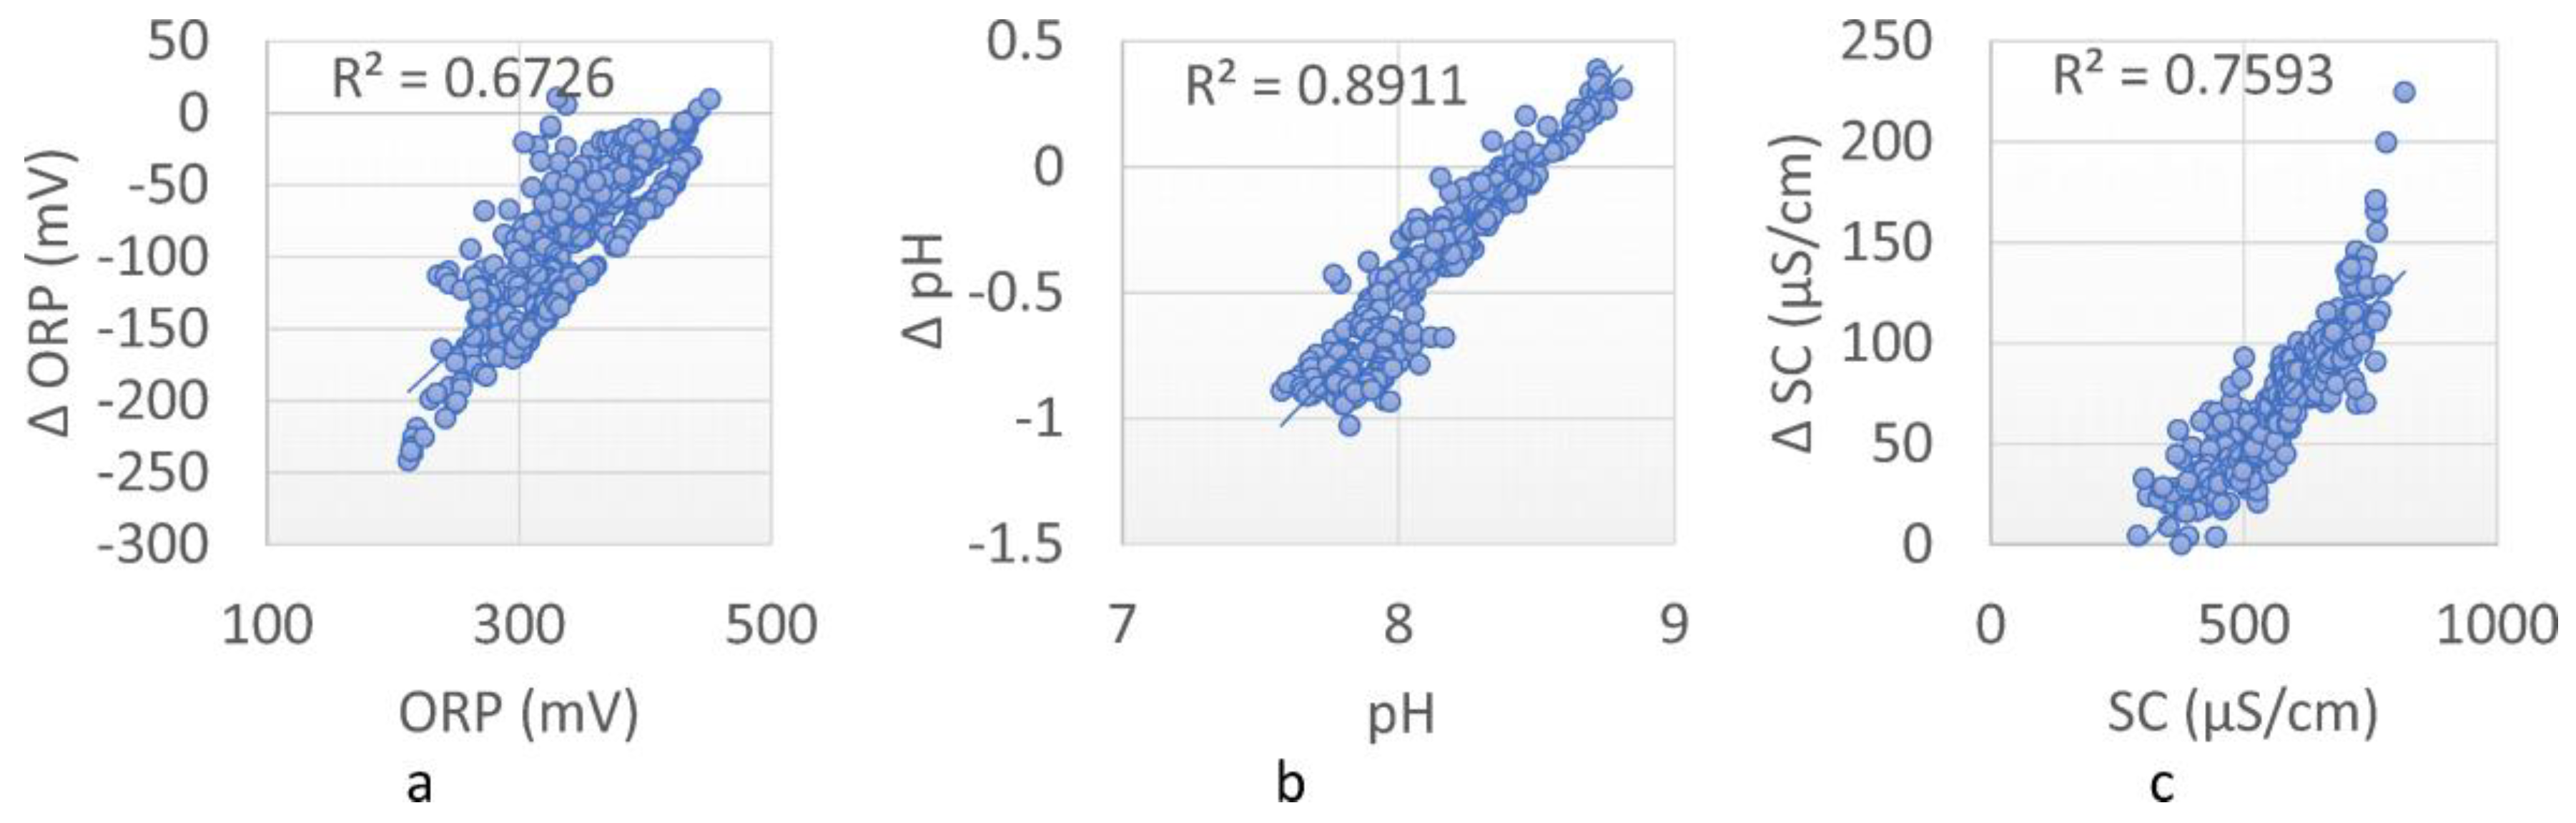
There are good correlation (R; Pearson) and determination coefficients (R2) between ORP, pH, and SC at the downstream point (Tişăuţi) and the difference between the same parameters at Tişăuţi and Mihoveni (Figure 5). The increasing SC downstream create a stronger difference, even if the upstream values have an upward trend too.
There are multiple strong correlation coefficients between raw and calculated parameters of the downstream and upstream stations. The Supplementary Table S3 contains a comprehensive correlation matrix and the correlation coefficients in bold are different from 0 with a significance level alpha = 0.001. The values greater than 0.5 and lower than −0.5 carry even more statistical relevance (yellow background in the table).
A high temporal resolution WQI for Suceava River can be computed using the available data in our study area (the five water quality parameters monitored at Mihoveni and Tişăuţi). We chose the additive type WQI because changes in its values can be easily understood as changes in one component parameter or another. The increase of three parameters lead to an increase in water quality (DO, pH, and ORP) and their values are added to each other in the WQI calculus, while the increase of the other two parameters lead to a decrease in water quality (SC, temperature) and their values are subtracted from the sum of the previously mentioned parameters. All values are normalized between 0 and 1 prior to the calculus of WQI in order to give an equal weight to each parameter, irrespective of the amplitude of their values. We verified if some parameters can be considered as representing the same natural driver, meaning that they show well linked relations and that including them all in the calculus of WQI will artificially increase the importance/weight of that driver in the Equation (1) just because more parameters linked to this driver are available—the use of PCA in discriminating parameters for the calculus of WQI is frequent [2].
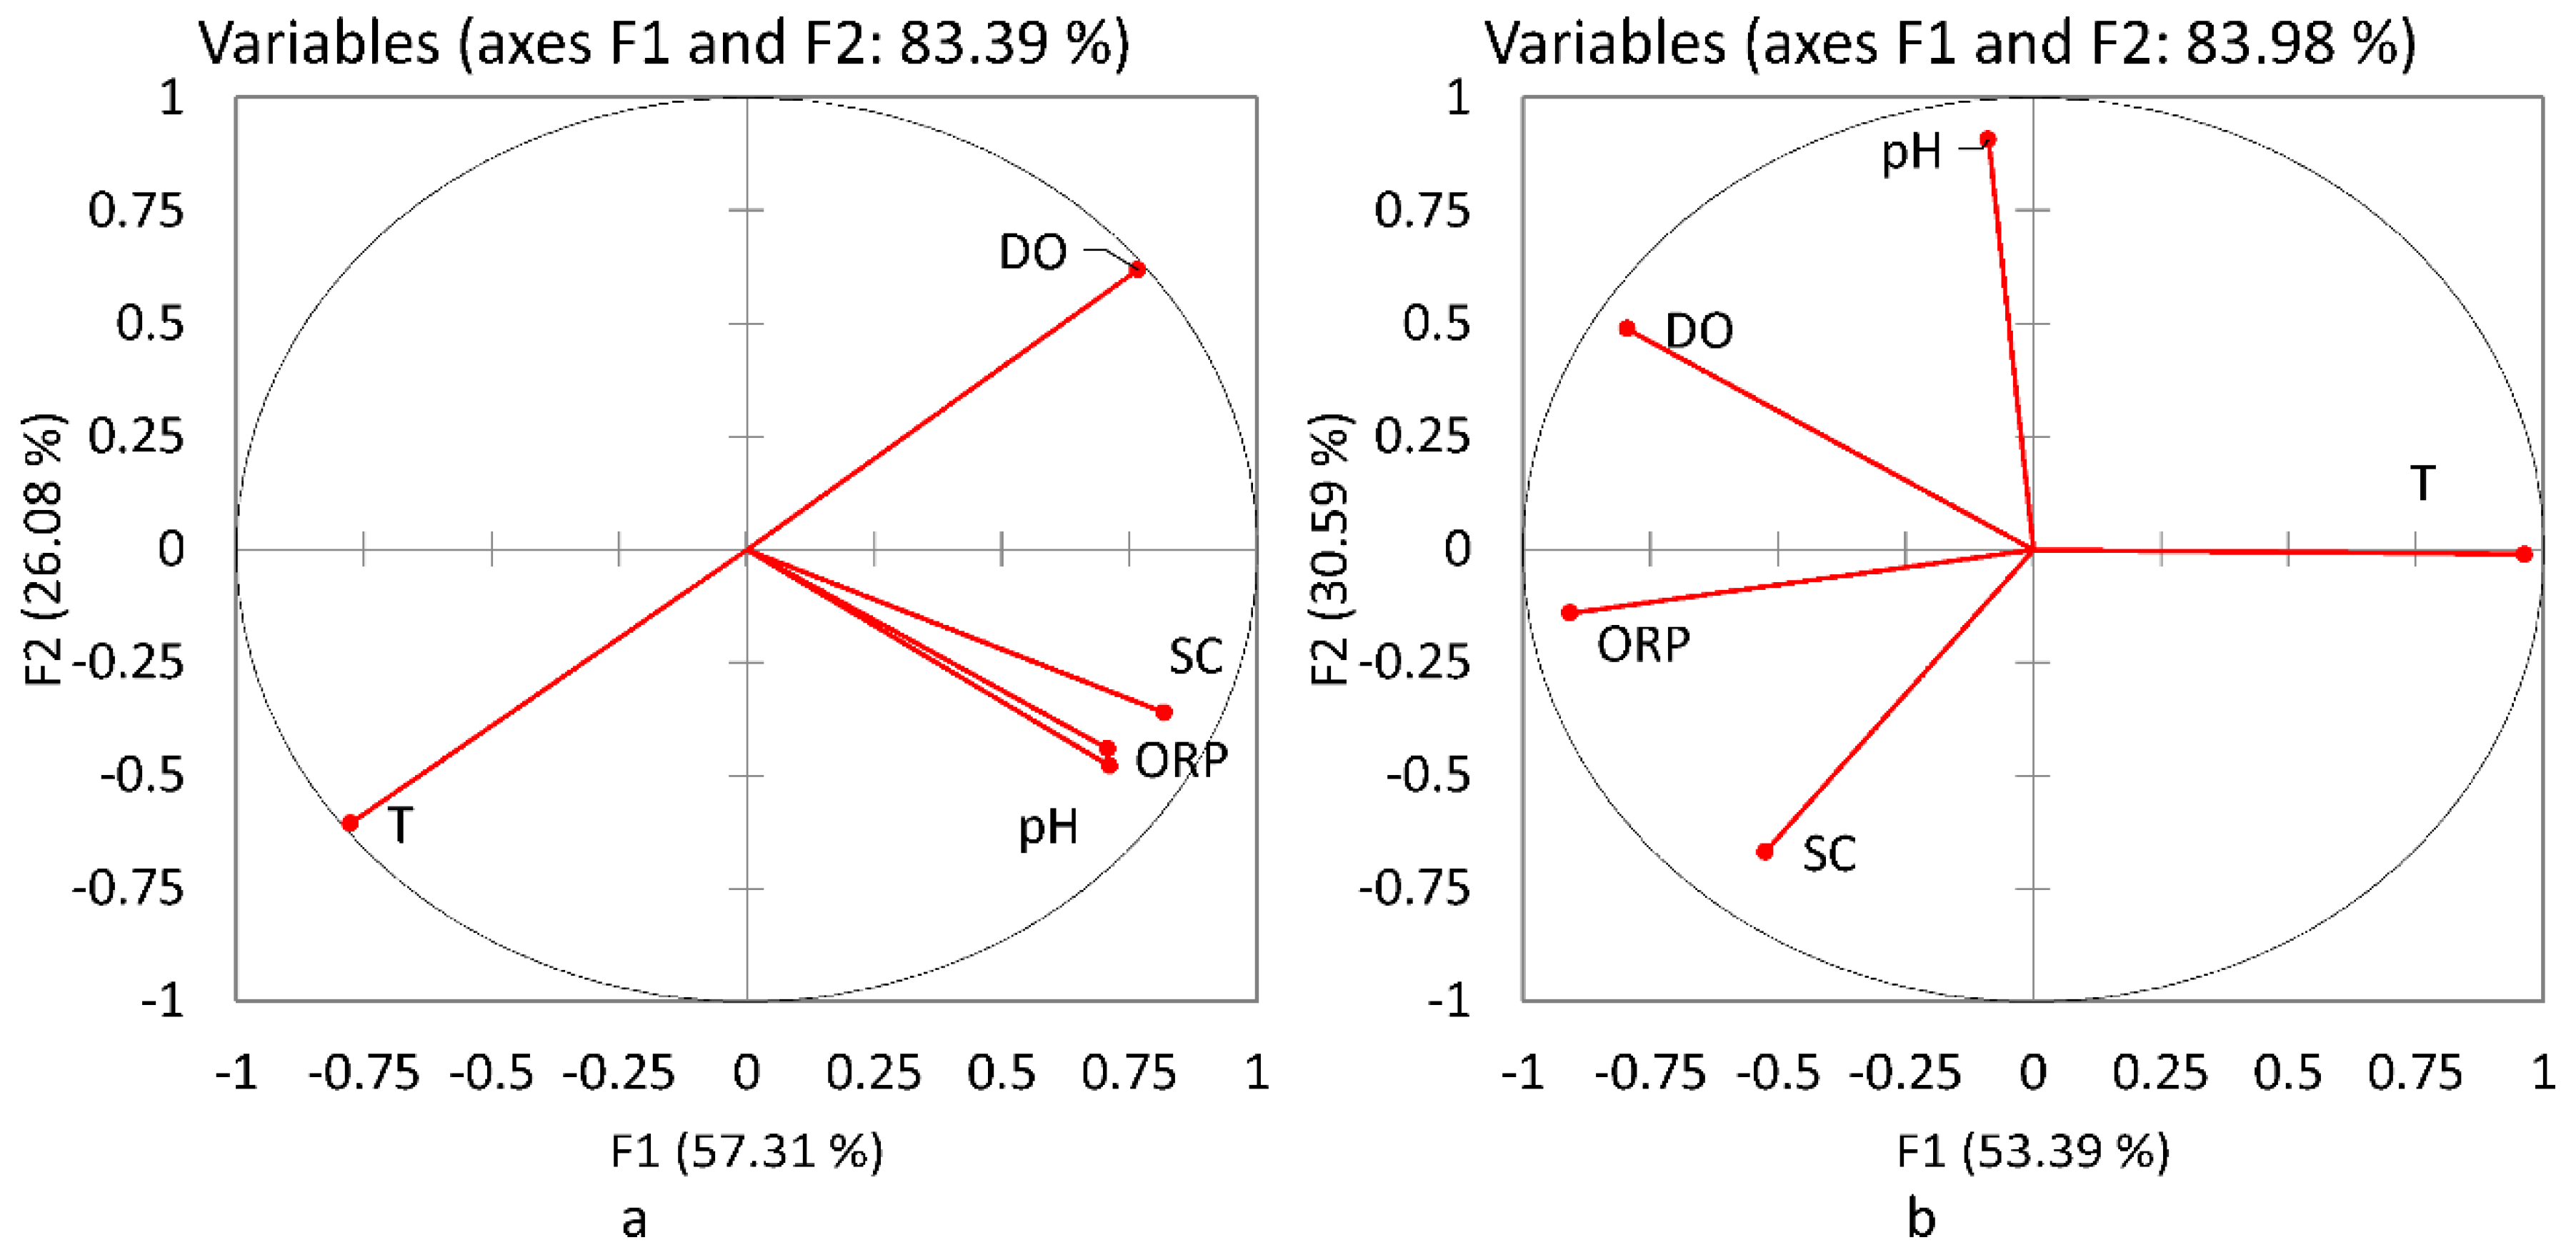
The correlation circles of the PCA analysis of the water quality parameters at each monitoring station indicate different patterns of the relationships between the studied parameters. The axes representing the factors/dimensions numbers 1 and 2 explain over 83% of the variance of the water quality parameters (83.39% upstream, 83.98% downstream). These observations suggest that all parameters should be kept for inclusion in the WQI because there is no parameter which can replace other parameters (possible if they would have similar behavior at both stations).
The PCA analysis (Figure 6) indicated that, at the upstream monitoring point, temperature and DO are in antiphase/very good negative correlation, with the DO fluctuations being an effect of fluctuations in temperature (cause). Nonetheless, the relationship between the same parameters at the downstream station is much weaker and, furthermore, the relationship between all parameters changed too (important urban impact). These upstream–downstream changes in relationships led us to the conclusion that we can include all parameters with an identical weight in our equation in order to keep the same number of parameters for both stations.
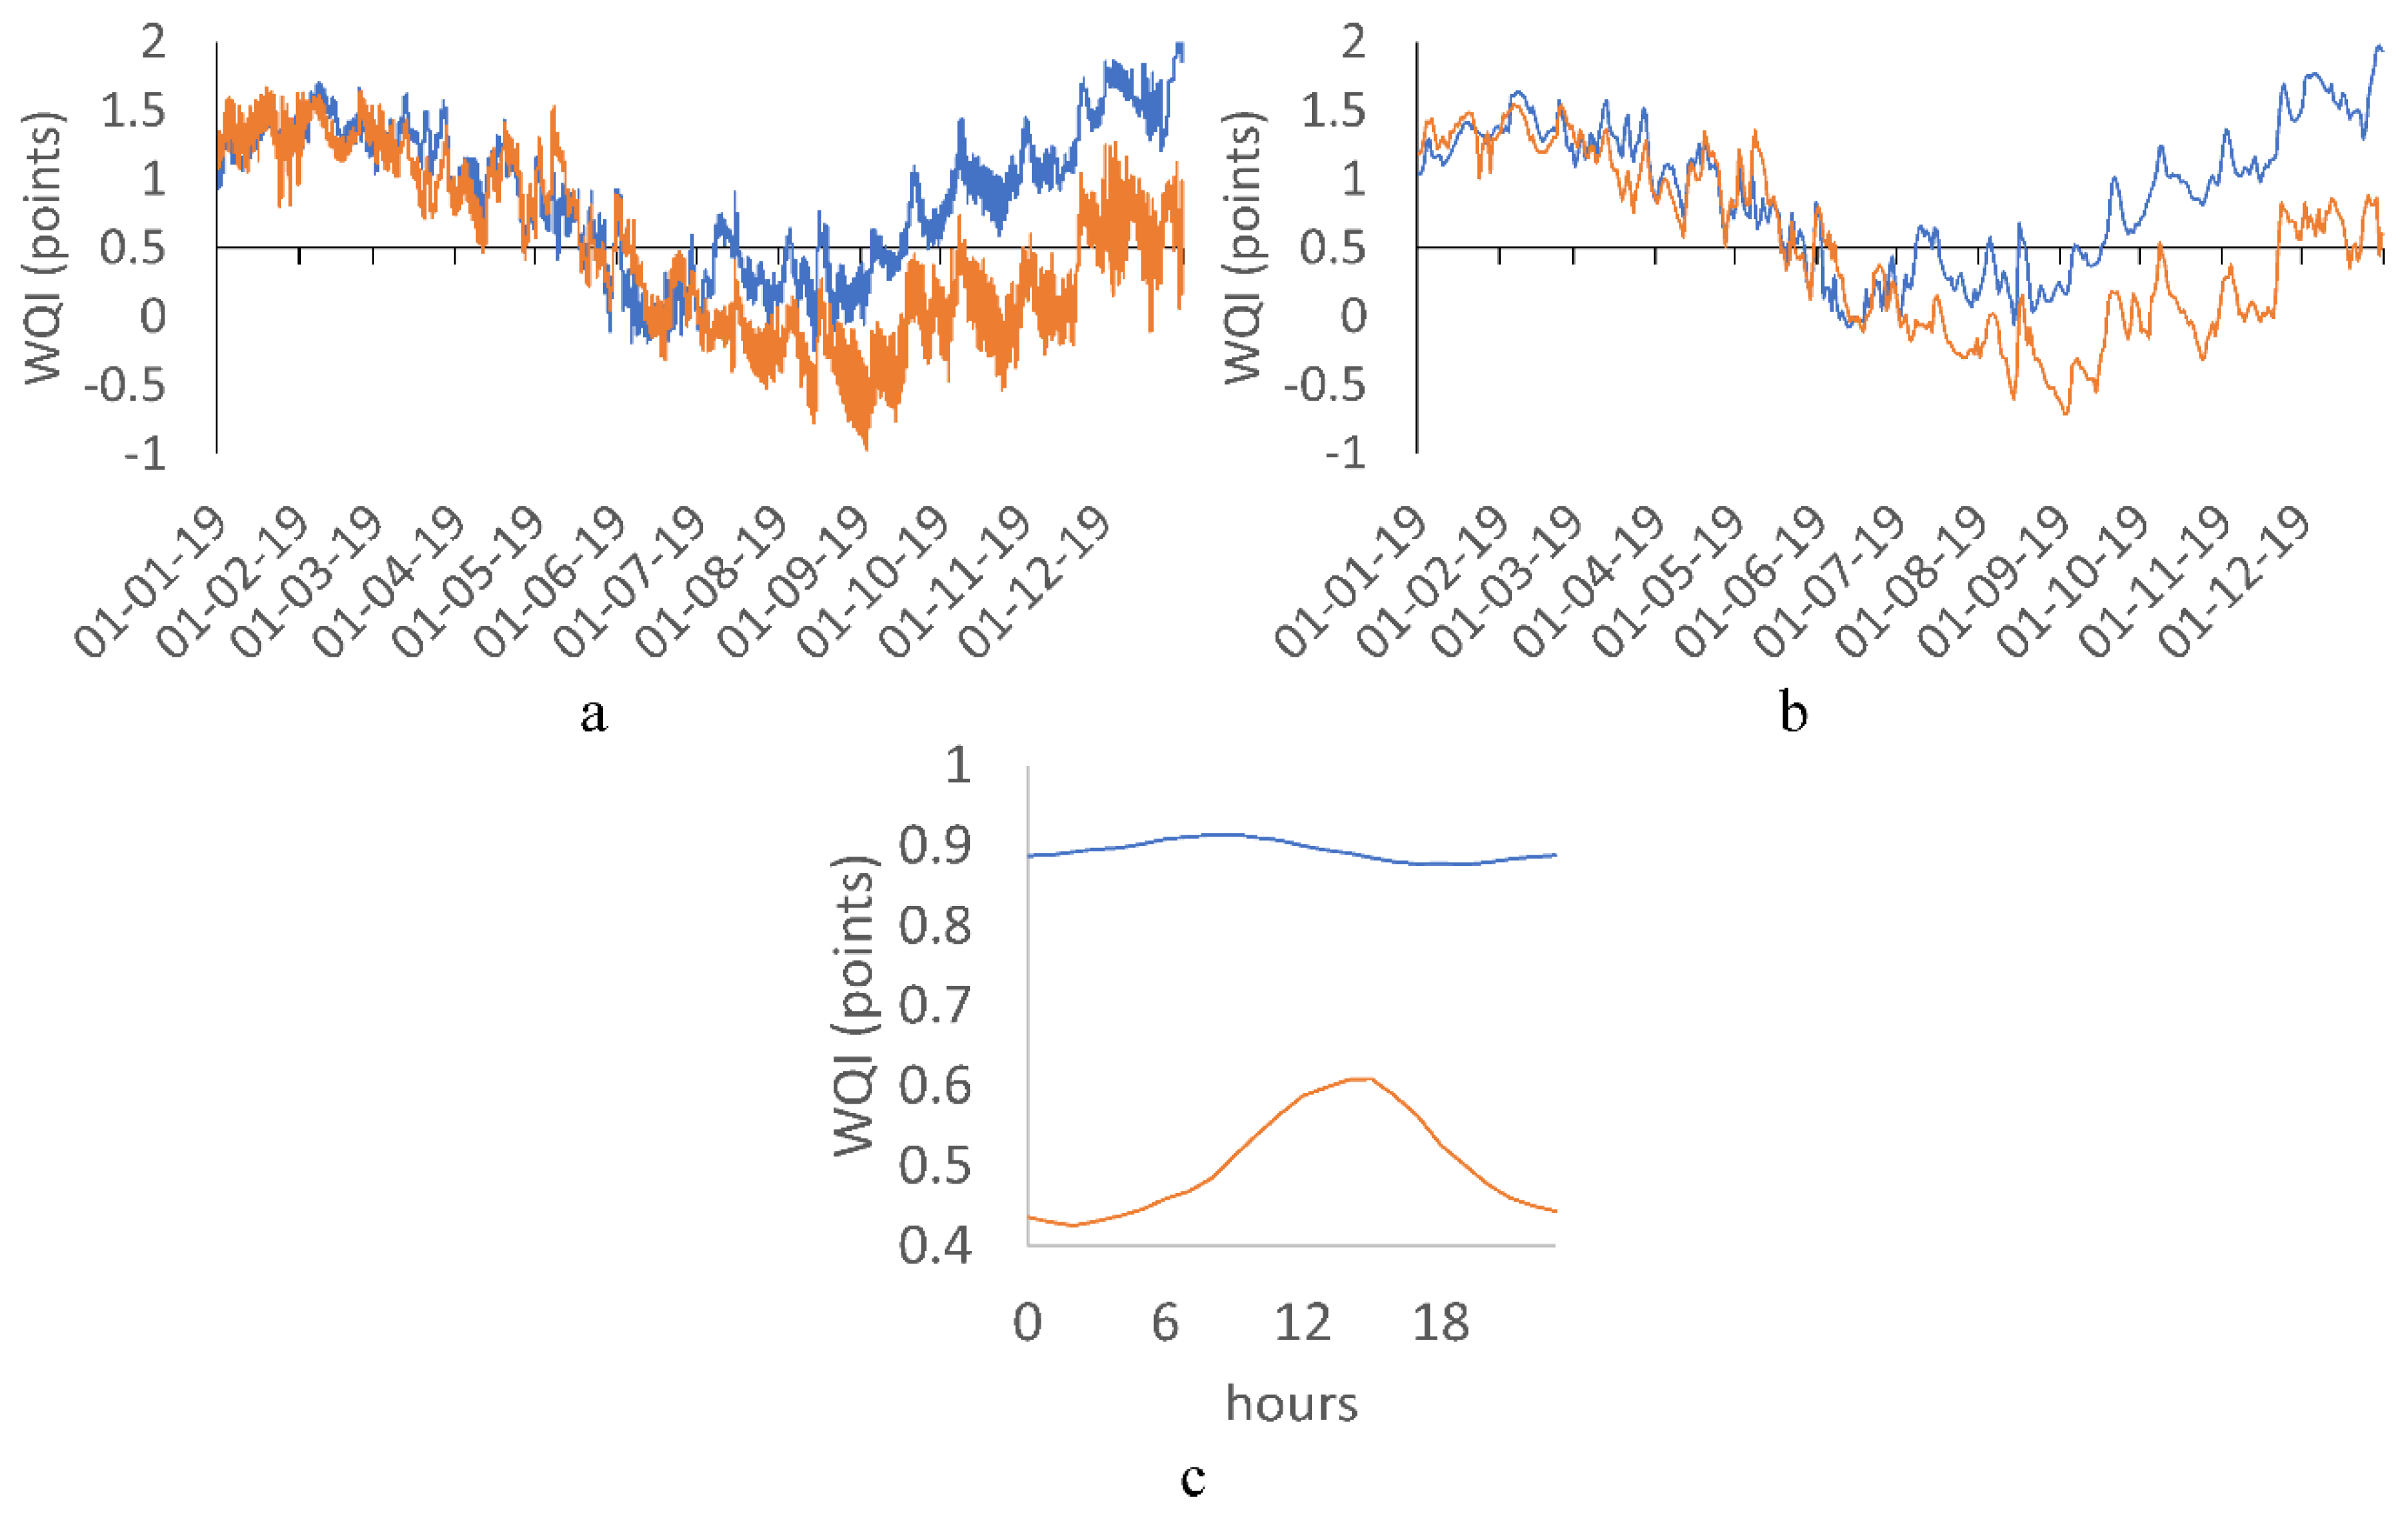
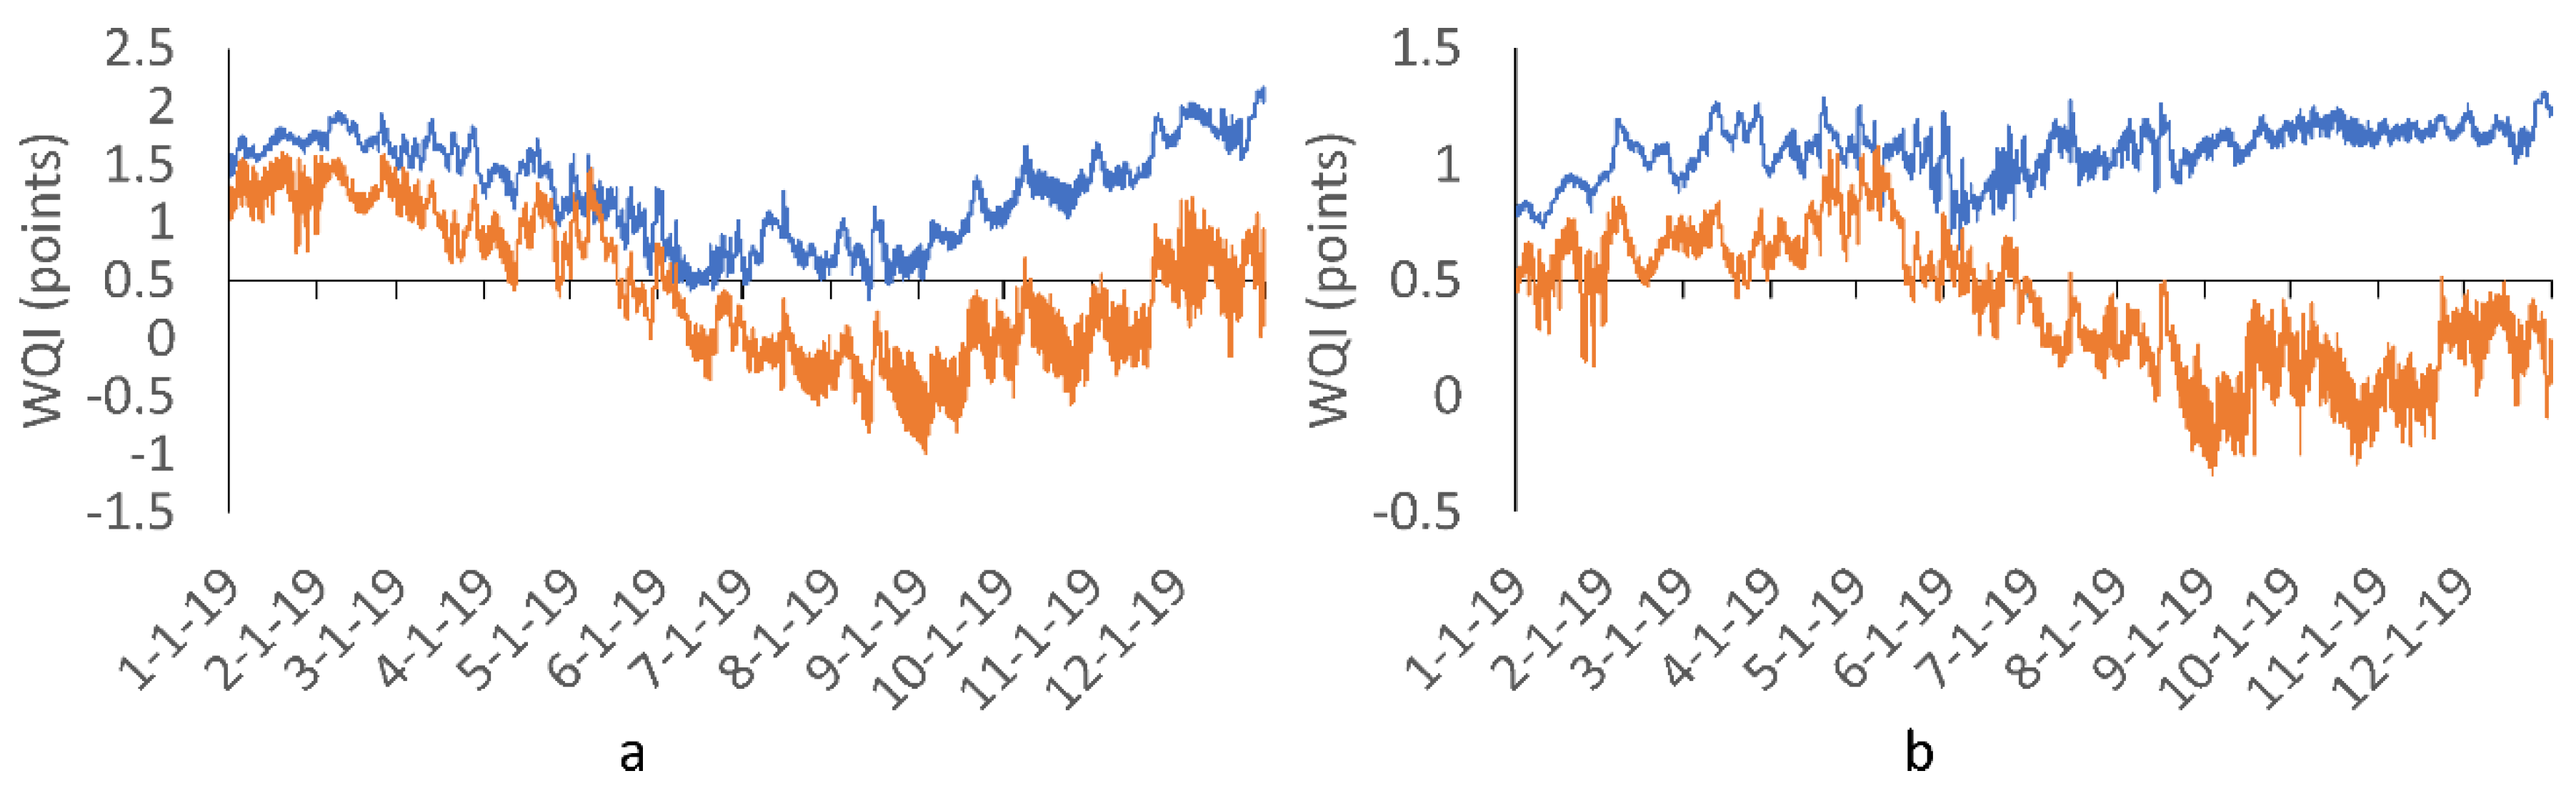
The calculus of our first WQI variant indicates an increasing in the water quality difference between the downstream and upstream stations in the second half of 2019 (Figure 7a,b). Over the entire year, there is a quasi-stationary general/linear trend of WQI upstream of Suceava city, but a slight downward trend at the downstream station. A summer annual minimum occurs at both stations, with the mention that this minimum period extends into autumn, downstream of Suceava city. The minimum is caused mainly by the increase in water temperature and decrease in dissolved oxygen concentration during summer and by the low waters during autumn (there is a correlation coefficient of 0.37 between WQI and water level downstream). This is in accordance with previous studies that showed how the seasonal water deficit impairs the surface water quality [44,45]; streamwater level may be the main factor impacting stream water quality [46]. Supplementary Figure S2 shows the correlation type between water level and WQI downstream of Suceava city—there are two groups of points corresponding to aperiodic and anthropogenic changes in the retention volume of Mihoveni Dam (upstream).
The diurnal profile of WQI includes a diurnal oscillation, caused by the same type oscillations of the compounding parameters (Figure 7c). During an average day, the upstream station has streamwater with a constantly good quality, while the downstream station has streamwater with a quality oscillating around the average value of WQI (0.5). Consecutive values smaller than 0.5 are frequent during summer at both stations. The hourly distribution of the minimum and maximum values is similar to those of SC and ORP at the upstream station and to those of DO and pH at the downstream station (according to the diurnal cycles of the water quality parameters described in our previous study [35]). The DO oscillation downstream is bound to the water temperature; water temperature downstream is influenced by the Suceava city urban heat island and wastewaters [36]—the higher thermal amplitude might explain the higher influence of the DO diurnal profile on the shape of the WQI diurnal profile at the downstream station. The atmospheric environment does not influence only the water temperature, but also its evaporation. Evapotranspiration is recognized as an important cause in the creation of the diurnal cycles in streamwaters [47,48]. At both monitoring stations, the evaporation and evapotranspiration in the riparian area and sub-catchments play an important role in the oscillation of the water level, which, in turn, influences the water quality parameters. The catchments of the urban tributaries of Suceava River in the study area have surfaces belonging to the built-up area of Suceava city that increase the temperature of urban tributaries up to 2 °C [36] above the water temperature of Suceava River at the upstream station, leading to changes in the values of the water quality parameters due to the modified chemical reactivity and water viscosity. Built-up areas have a negative impact on water quality of rivers [49,50] and groundwaters [51]. Groundwater in Suceava city metropolitan area is documented in a few studies that highlight its pollution due to various causes such as landfill leachates or consistent leakages from the sewerage [34,52] and one can assume that groundwater contributes to the degrading of streamwater quality in Suceava city area.
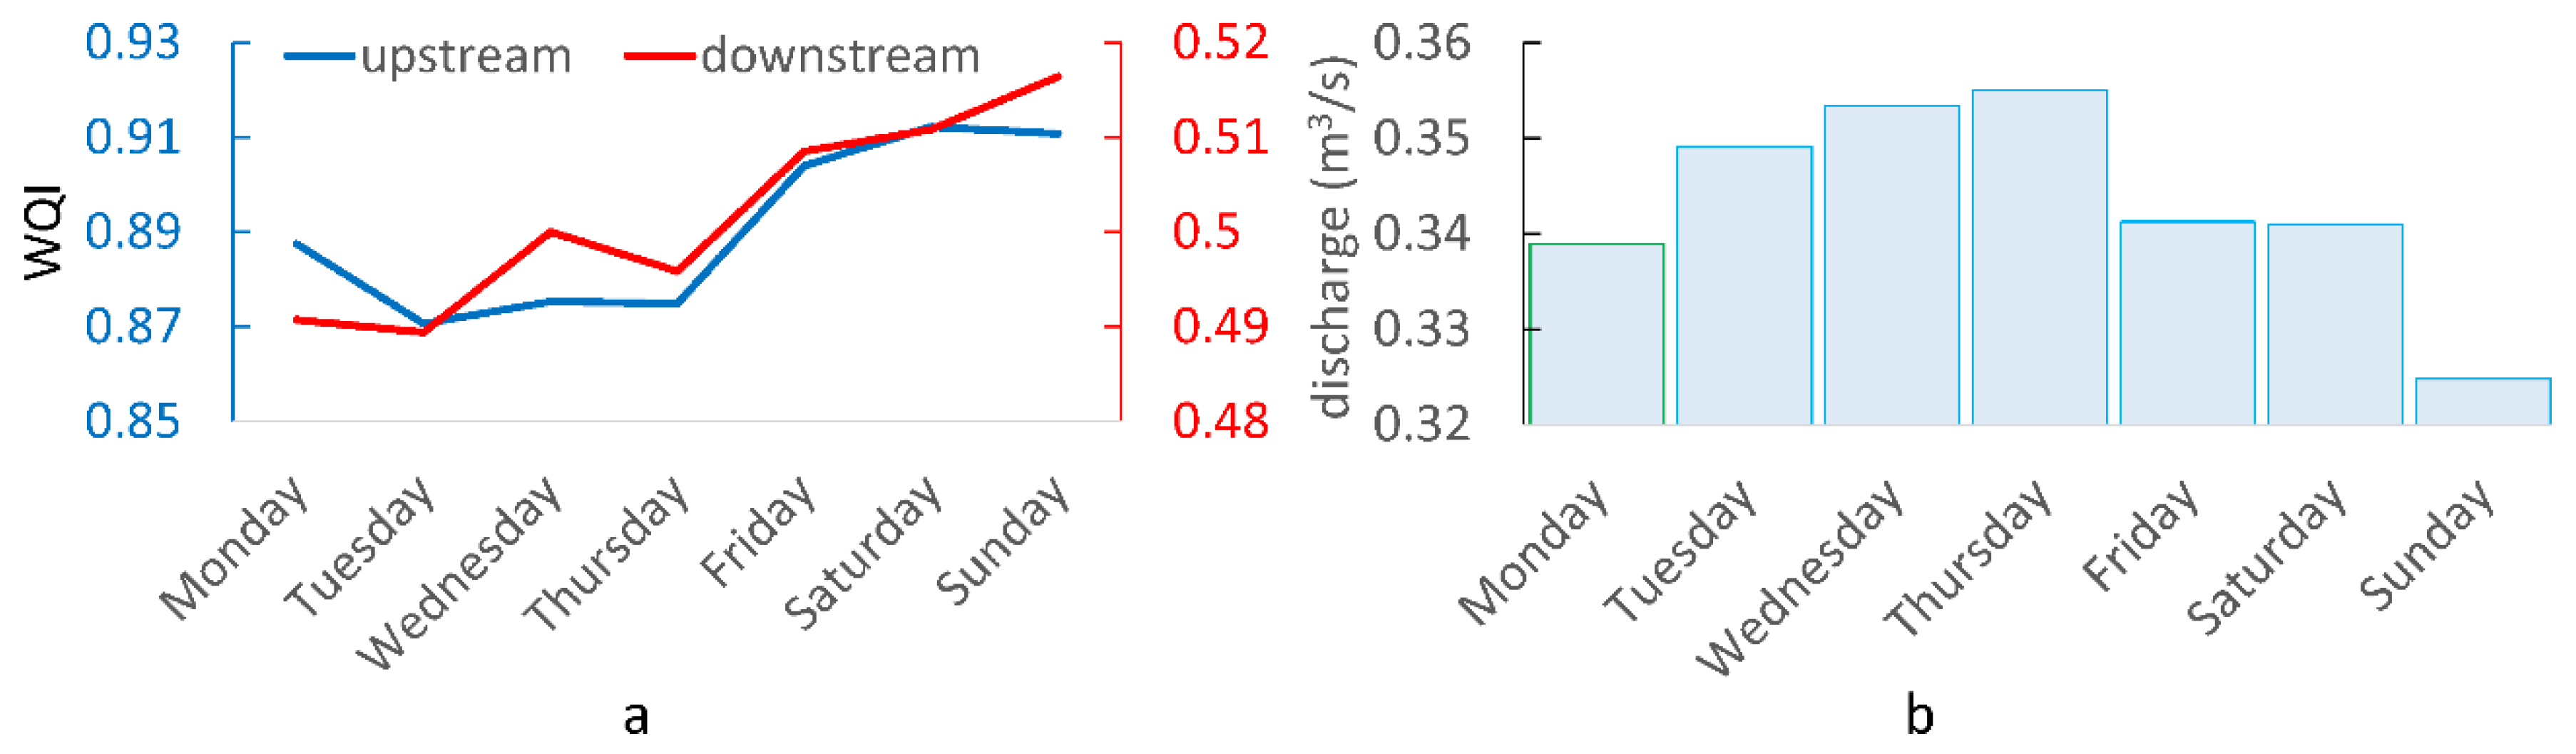
The main source of streamwater contamination in Suceava city is WWTP, whose weekly periodicity in wastewater discharge generates a similar periodicity in the WQI of Suceava River (Figure 8). The weekly cycle of water quality is a periodicity caused by human activities in populated areas [53]. Suceava River has higher water quality at both monitoring points during the weekend, when some human activities have a reduced intensity or cease temporarily in Suceava city and in the cities and villages located in the upstream catchment.
As WQI is computed for close stations, on the same river, WQI can be improved by normalizing the raw time series of each parameter by taking into consideration the minimum and maximum values at both stations together, not per station. Using this extended normalization, a rectified WQI was computed (Figure 9a) and shows a more realistic water quality difference between stations (streamwater quality downstream should always be, in a simplistic/minimalist perspective, worse downstream because of the wastewaters from WWTP). We also tested how WQI would look like if we remove from Equation (1) the parameters which might overrepresent a driver. After removing DO and temperature in the calculus of WQI at both stations, we obtained the partial WQI (Figure 9b). The advantage of the partial WQI is the lack of the seasonal oscillation—a closer look at the upstream station reveals that there is no summer minima and winter maxima.
Previous studies showed that there is sometimes a consistent self-purification of Suceava River inside Suceava city caused by, for example, the hydraulic jumps below bridges and the natural cotreatment of waters with different pollution profile [34,54,55]. Therefore, we prefer to use the first variant of WQI. Supplementary arguments to this preference is the fact that (1) the diurnal profiles of various parameters have very labile positions of the minimum and maximum values, suggesting that the river undergoes substantial changes inside the city, even if its discharge increases only by ≈0.84 m3/s between the upstream and downstream stations [35]—for example, the diurnal cycles of DO can be in antiphase at the selected stations; (2) the annual cycle that creates low WQI in the late summer and in autumn is a fact with real consequences in the aquatic environment and riparian area.
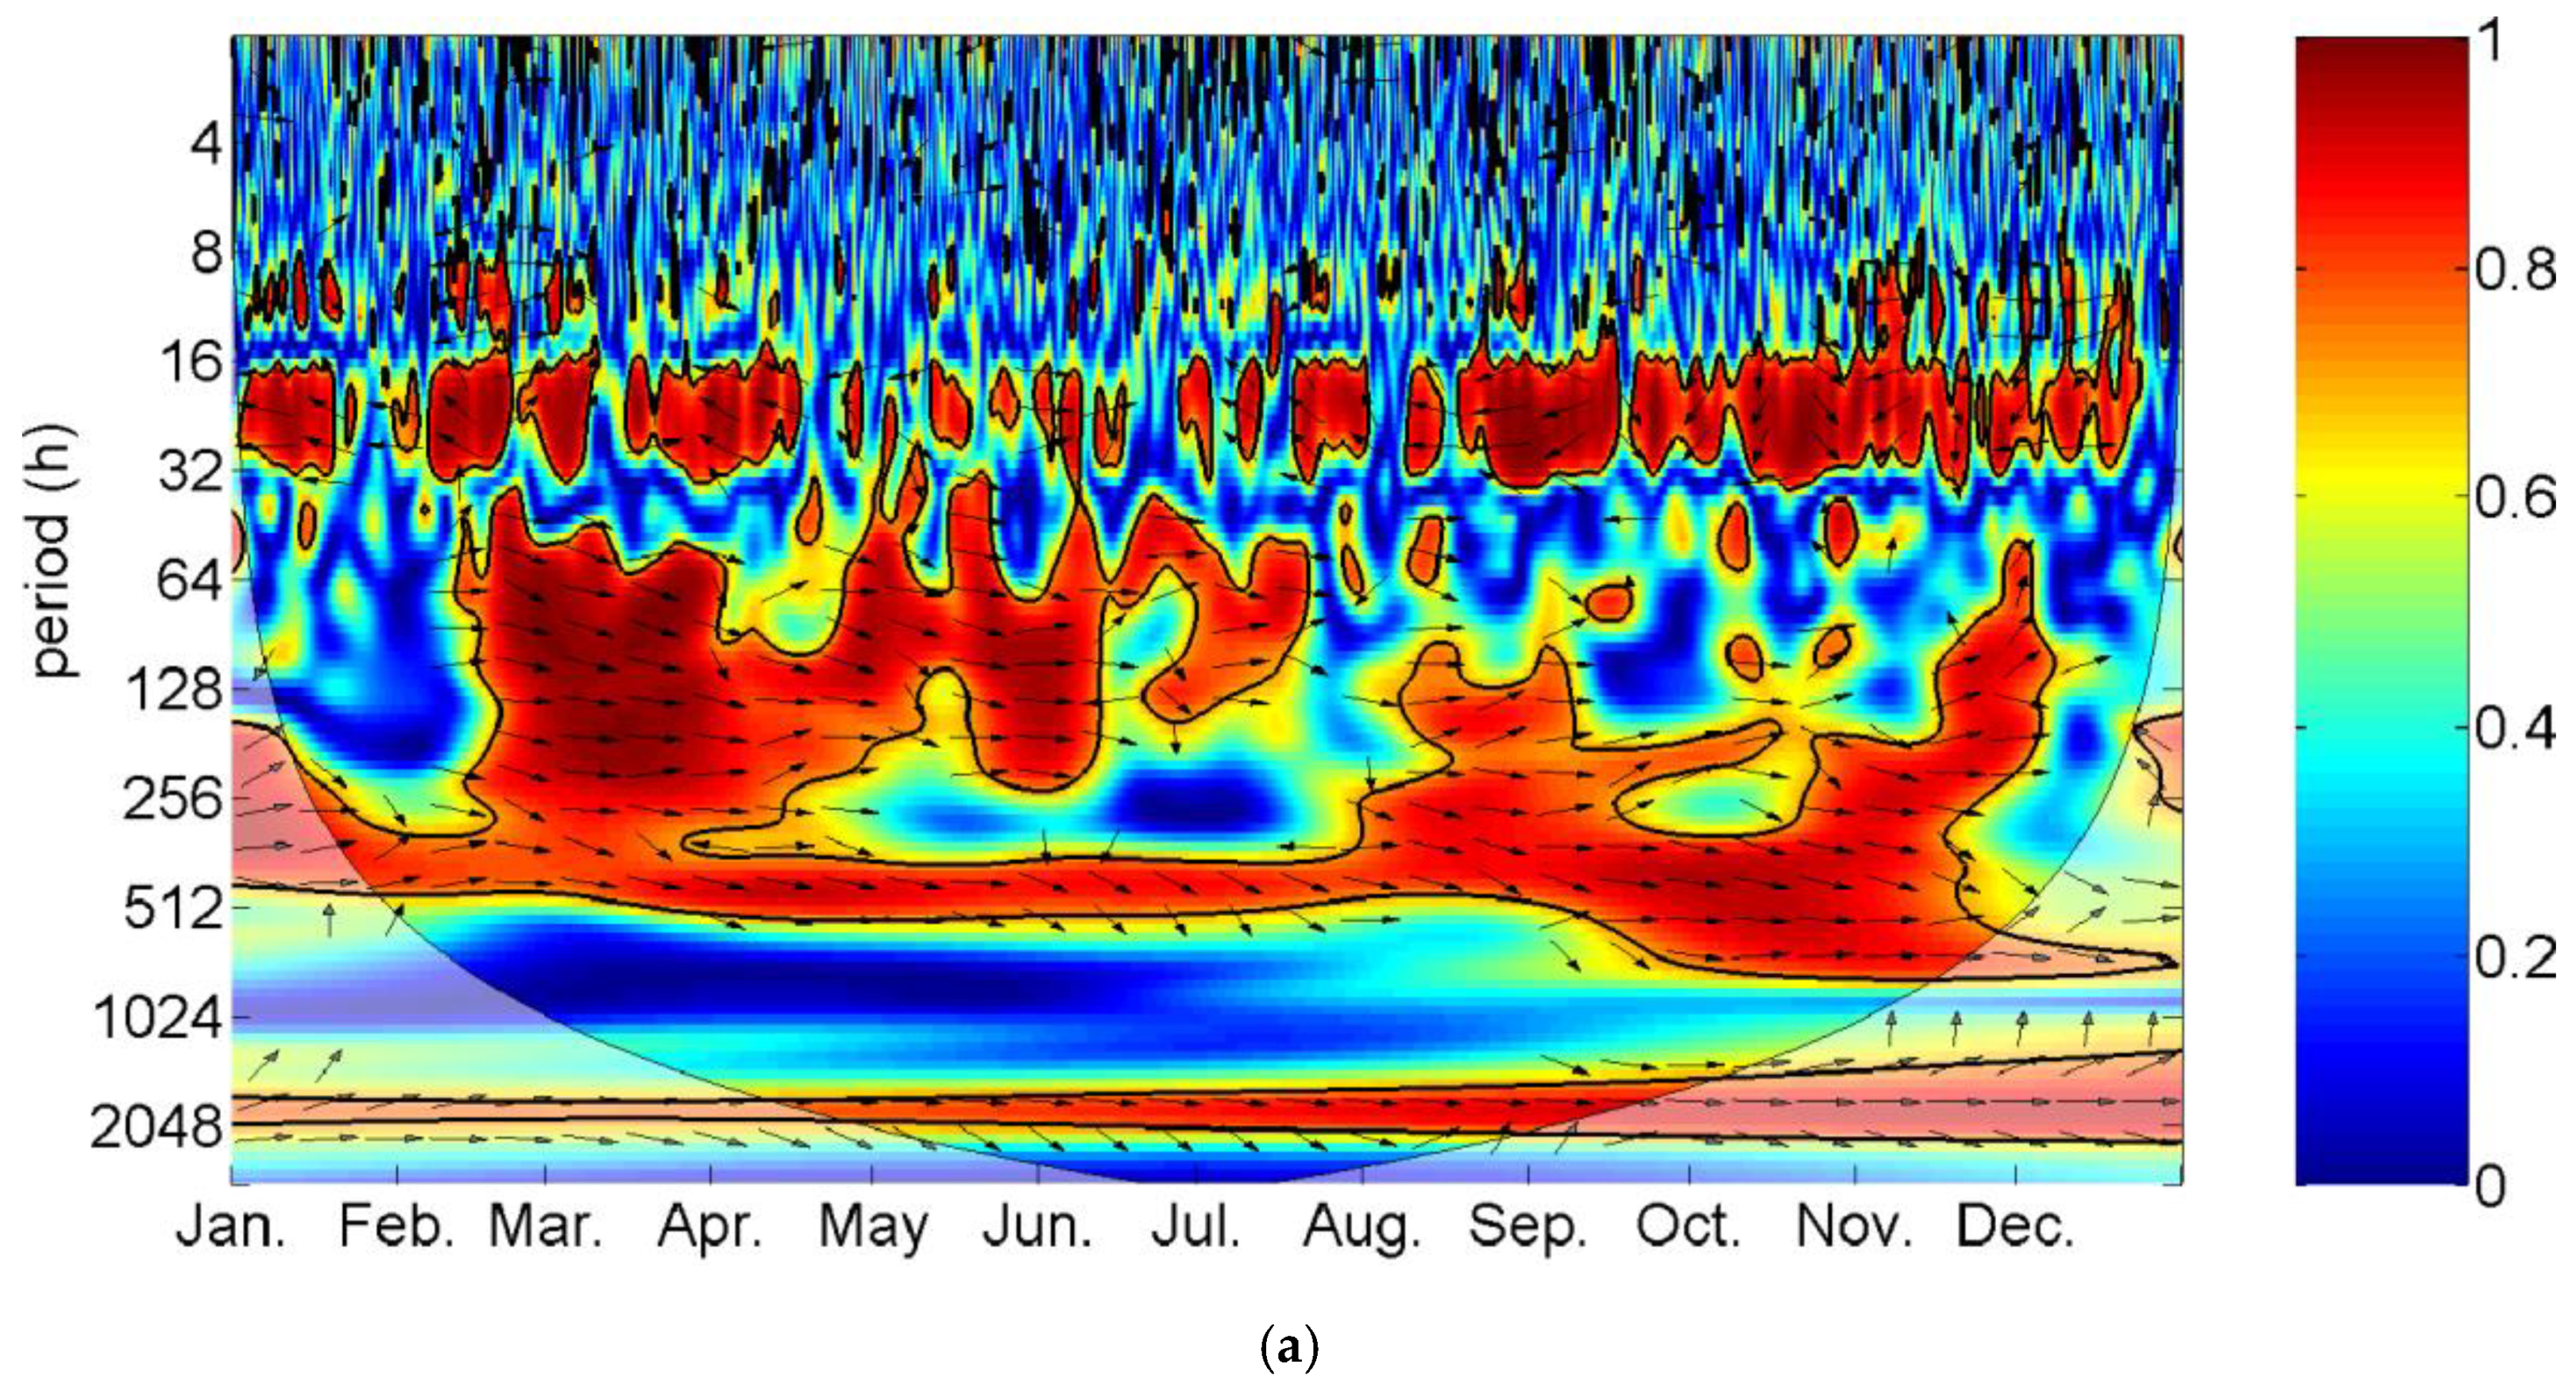
The wavelet coherence analysis between the upstream and downstream WQI time series indicates high power at the diurnal band (24 h), but the diurnal signals are variably unphased (Figure 10a). On scalograms, the diurnal cycle is marked by the discontinuous band of red areas (high power) surrounded by thick black contours and located around the 24 h position indicated by the vertical axis. At lower frequencies (longer periods), the time series have time intervals with high coherence and an almost in-phase relationship. The phasing is indicated by the arrows pointing right between the periodicities of ≈64 and ≈512 h. This means that, at the weekly scale, water quality at both stations co-varies at a significant level (0.05). Compared to this scale, the diurnal scale indicates the antiphase as the dominant phase (arrows pointing left)—areas with unphased diurnal signal or lack of it (indicated by the blue-green colors of the power spectrum) are mostly caused by high waters, which interrupt the established linkage during the baseflow [35].
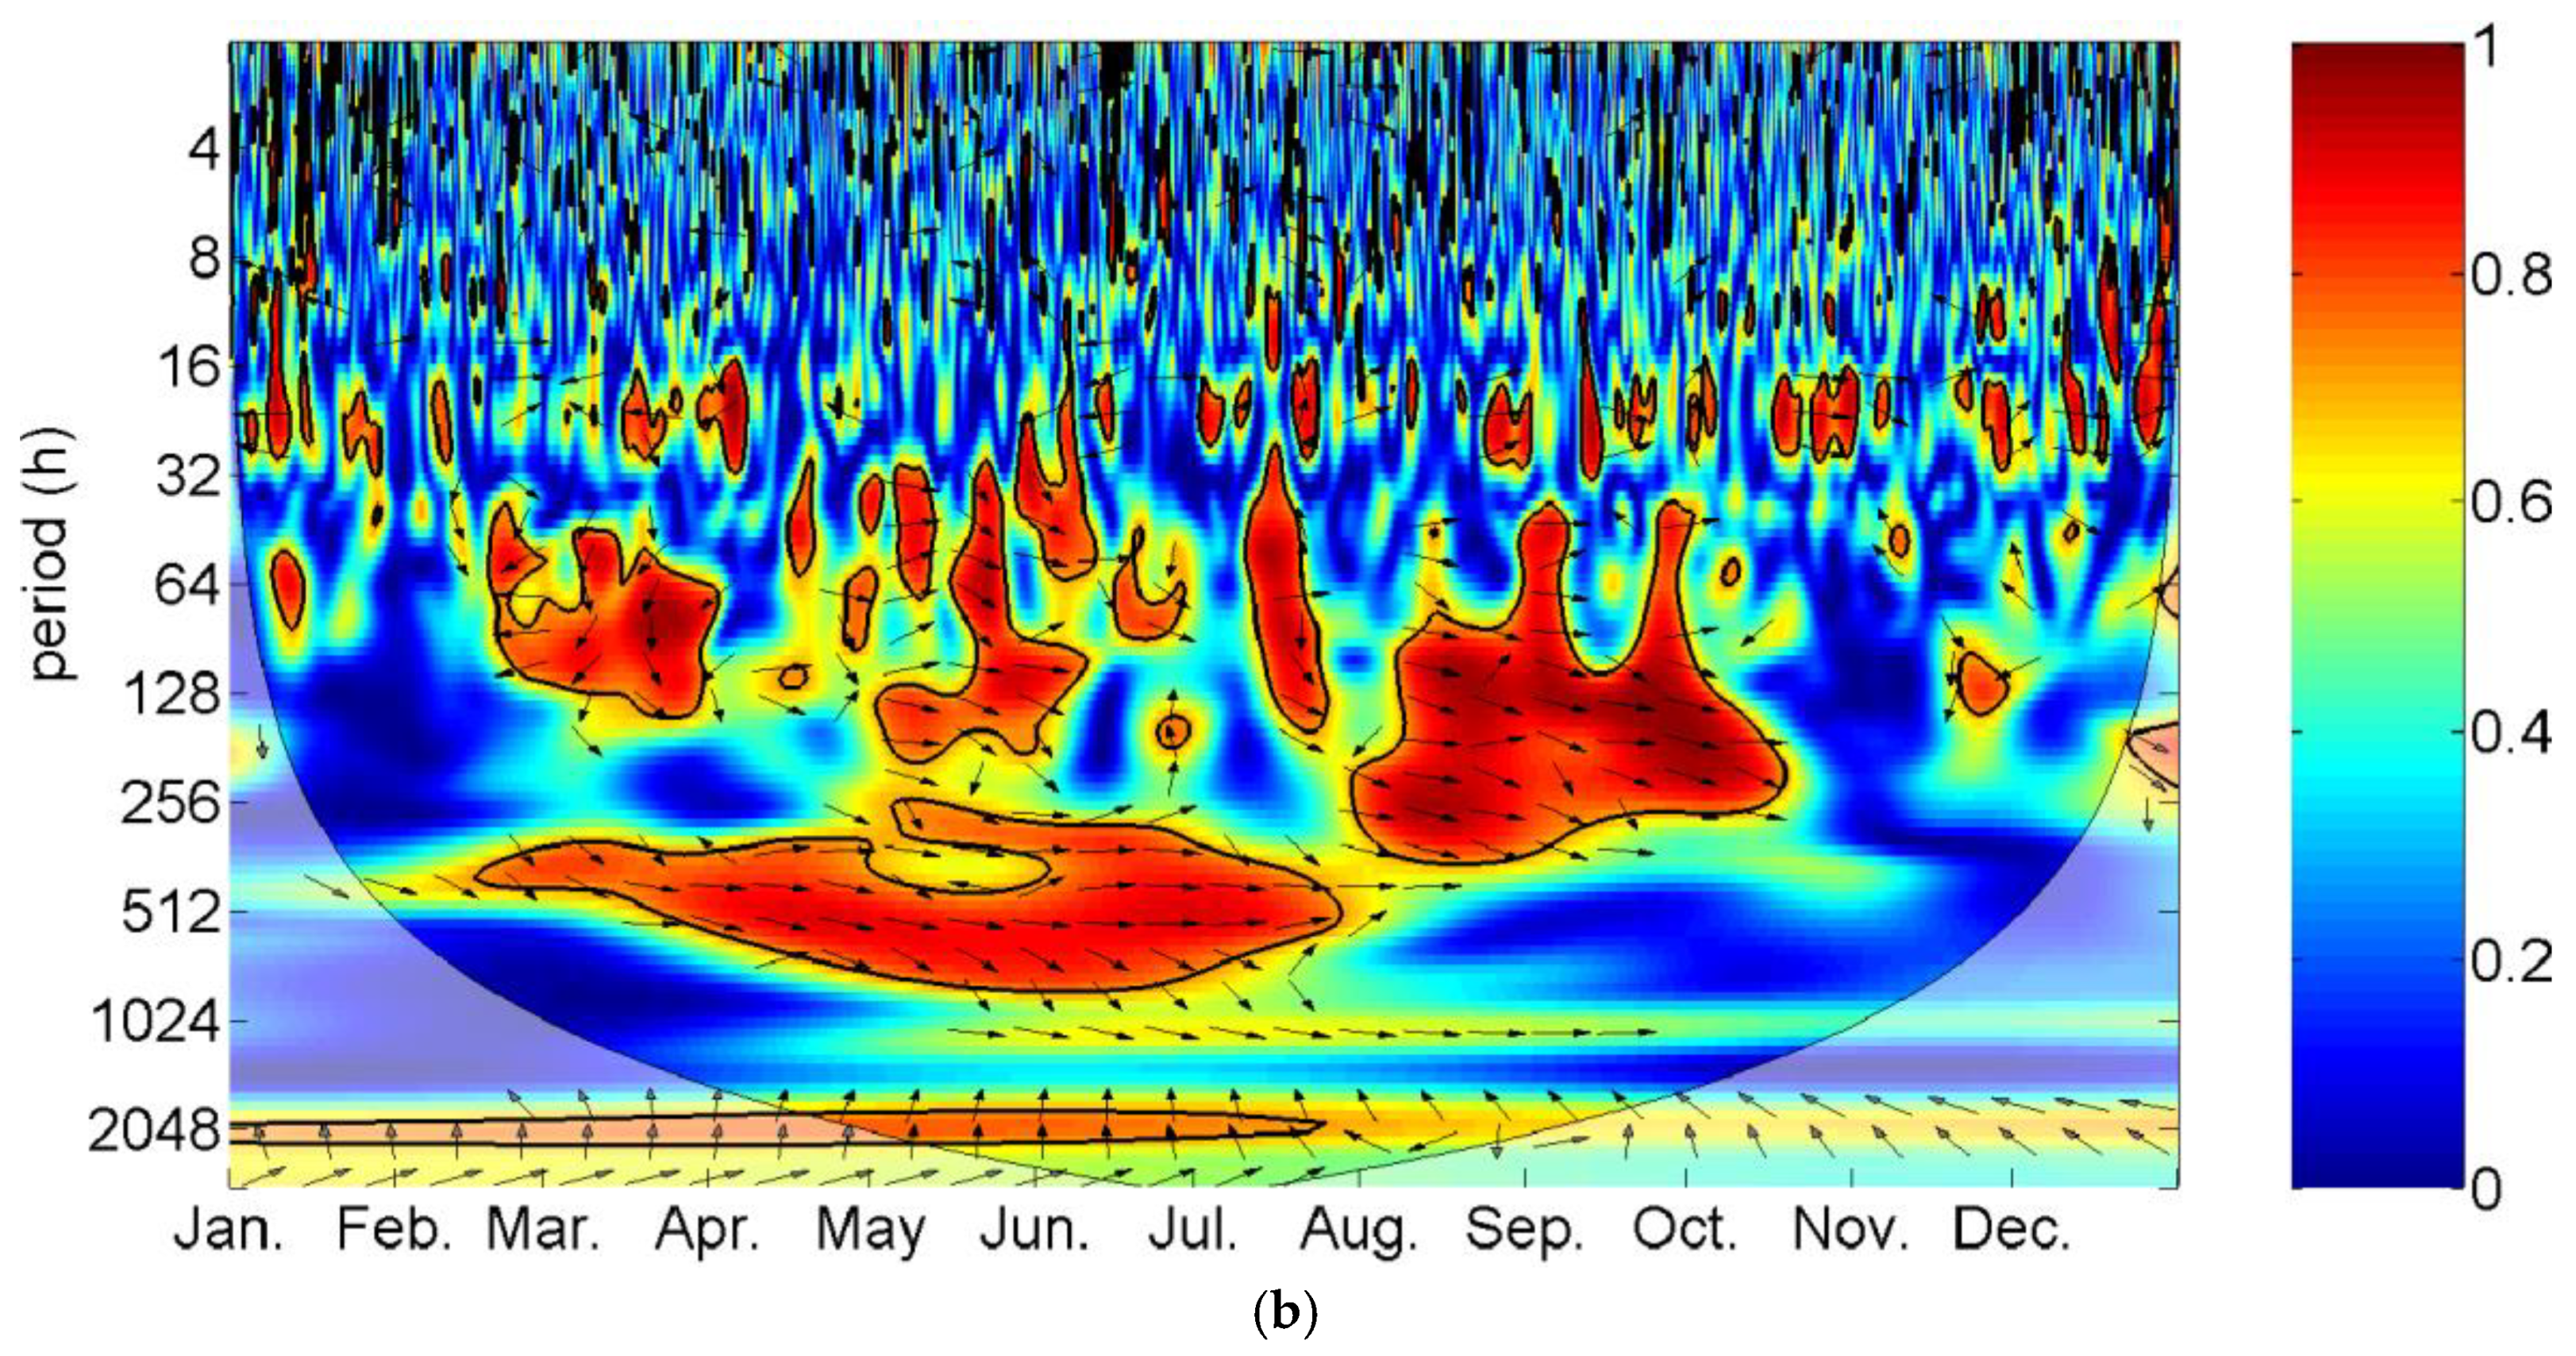
Figure 10b illustrates that there is a moderate linkage between water level downstream and WQI downstream, especially for periodicities greater than 3 days. Note the high power (red color) during the lowest WQI values.
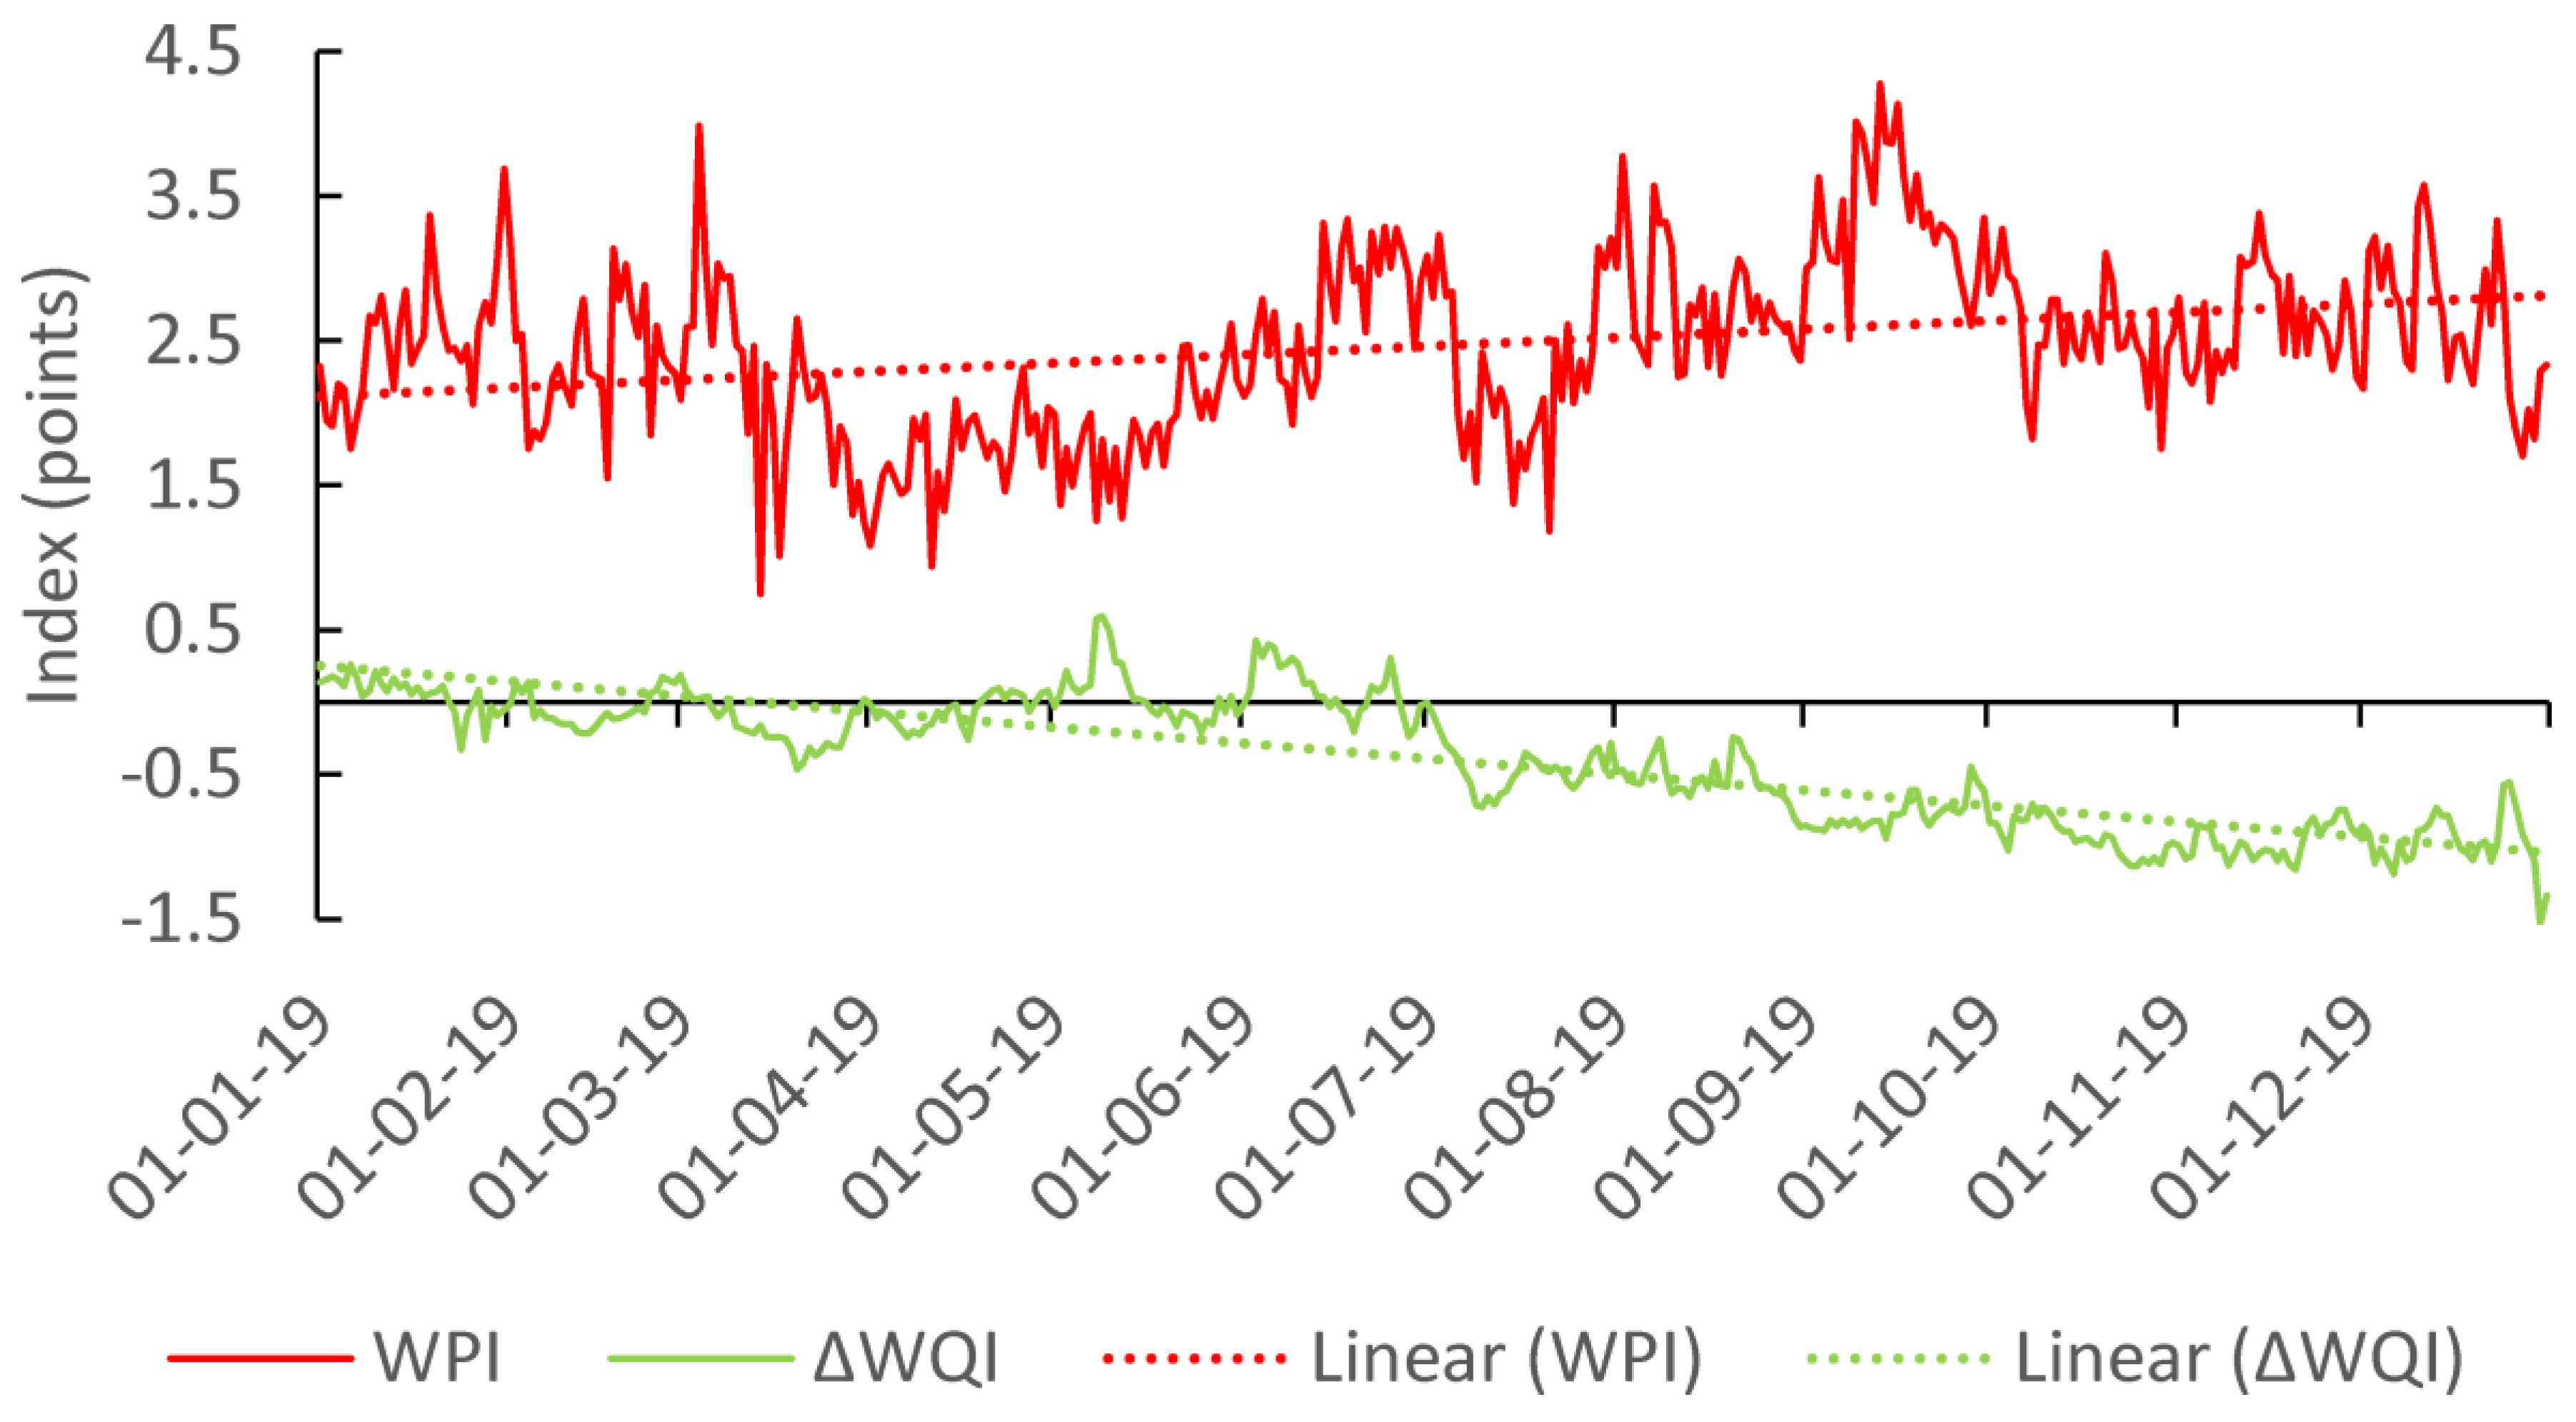
The low flow rate of Suceava River leads to a reduced streamwater capacity to dilute the urban water contaminants, which record no seasonality. Another explanation for the decreasing WQI values downstream might be an increase in the toxicity of various wastewaters. See Supplementary Tables S4 and S5 for correlation matrices of streamwater and wastewater parameters. In 2019, the average daily values of the WWTP parameters related to water contaminants/impurities are SM—22.6 mg/L, BOD5—17.1 mg/L, CODCr—57.8 mg/L, TN—7.3 mg/L, TP—0.62 mg/L, DS—0.44 mg/L, TDS—812 mg/L. Each parameter shows a quasi-random evolution in 2019, but adding them in a water pollution index (WPI) through the simple addition of all normalized parameters will create an index with an upward linear trend (Figure 11). This increase of WPI might be used together with the decreasing water level to explain the increasing discrepancy in water quality between the upstream and downstream monitoring points in the second half of 2019.
The streamwater contamination caused by WWTP generates higher SC at the downstream monitoring point—see, for example, the relation between SC and TN of Suceava River (Supplementary Figure S3). There is a stronger correlation between the downstream SC and TN.
Re-inspecting the first variant WQI from the perspective of the self-purification of Suceava River, one can assume that, when the downstream WQI values are higher than upstream, there is a high chance to detect a strong self-purification of Suceava River between the monitoring points. For example, on 10 January 2019, WQI downstream was 1.315, while WQI upstream was 1.099. TP concentration was 0.037 mg/L at the upstream station, 0.63 mg/L at WWTP (effluent), and 0.065 mg/L at the downstream station. The calculated or measured discharges at these points were 7.8975 m3/s, 0.345 m3/s and, respectively, 8.145 m3/s. Between the upstream and downstream monitoring points, Suceava River receives not only the wastewaters from WWTP, but also urban tributaries with an estimated flow rate of 0.25 m3/s and an estimated TP concentration of 0.13 mg/L (according to the tributary/collector ratio of contaminant concentrations in previous studies about Suceava city area [54]). As result, TP discharge at the upstream station is ≈292.2 mg/s; Suceava River receives 249.85 mg/s TP between the upstream and downstream monitoring stations and should have a discharge of 542.05 mg/s TP at the downstream station. Instead, at the downstream station, the recorded TP discharge was 529.425 mg/s; the difference between the expected and the recorded TP discharge is ≈12.625 mg/s, meaning that a self-purification of ≈2.4% occurred. TP self-purification of Suceava City is documented to be higher in the cold season and, sometimes, it can exceed 50% [55]. According to the same authors, pollutants are adsorbed by alluvial sediments and consumed in various aquatic biological processes.
4. Conclusions
The three variants of WQI have specific advantages and disadvantages. All of them show a bad water quality of Suceava River downstream of Suceava city in the second half of 2019. The advantage of the proposed WQI is that it is adjusted for an upstream–downstream pair of monitoring points centered on a city or a streamwater pollution source and provide WQI values relative to local water quality references.
The main cause of decaying streamwater quality in the metropolitan area are the wastewaters from WWTP. The increased contamination level of these wastewaters and the very low water level of Suceava River concurred in generating low water quality downstream of Suceava city in the second half of 2019. Future studies might search for a better understanding of the relationship between the streamwater self-purification capacity and the upstream–downstream ratio of WQI.
Supplementary Materials
The following are available online at https://www.mdpi.com/2073-4441/12/8/2111/s1, Figure S1: Monthly average values of Suceava River in 2019: discharge at Iţcani station and temperature at Mihoveni and Tişăuţi stations (averaged), Figure S2: Scatter plot of WQI and water level of Suceava River at the downstream monitoring station in 2019, Figure S3: Scatter plots of TN and SC of Suceava River in 2019 (monthly values; based on data provided by ANAR): a. samples from Mihoveni and Tişăuţi; b. samples from Tişăuţi only, Table S1: Mean, minimum and maximum monthly values of the water quality parameters of Suceava River at the upstream station (Mihoveni) in 2019, based on hourly values, Table S2: Mean, minimum and maximum monthly values of the water quality parameters of Suceava River at the downstream station (Tişăuţi) in 2019, based on hourly values, Table S3: Pearson correlation coefficients between water parameters of Suceava River at the downstream station and the difference between the downstream (Tişăuţi) and upstream (Mihoveni) stations, Table S4: Pearson correlation coefficients between Suceava River water parameters at the downstream station (Tişăuţi) and wastewater parameters at WWTP, Table S5. Pearson correlation coefficients between wastewater parameters at WWTP and the difference between the downstream (Tişăuţi) and upstream (Mihoveni) parameters values (2019).
Author Contributions
Conceptualization, A.-E.B.; Data curation, A.-E.B.; Investigation, A.-E.B.; Methodology, A.-E.B.; Resources, A.-E.B., A.G. and D.I.O.; Supervision, A.G.; Visualization, D.I.O.; Writing—original draft, A.-E.B.; Writing—review and editing, A.G. All authors have read and agreed to the published version of the manuscript.
Funding
This research was funded by CNCS—UEFISCDI, project number PN-III-P1-1.1PD-2016-2106.
Acknowledgments
Thanks for the data provided is addressed to ANAR (Siret Water Basin Administration) and to ACET Suceava. This study was supported by data obtained within the research project SQRTDA (Streamwater Quality Real-Time Data Analysis). This work was supported by a grant of Ministery of Research and Innovation, CNCS—UEFISCDI, project number PN-III-P1-1.1PD-2016-2106, within PNCDI III.
Conflicts of Interest
The authors declare no conflict of interest. The funders had no role in the design of the study; in the collection, analyses, or interpretation of data; in the writing of the manuscript, or in the decision to publish the results.
References
- Hamid, A.; Bhat, S.U.; Jehangir, A. Local determinants influencing stream water quality. Appl. Water Sci. 2020, 10, 24. [Google Scholar] [CrossRef] [Green Version]
- Son, C.T.; Giang, N.T.H.; Thao, T.P.; Nui, N.H.; Lam, N.T.; Cong, V.H. Assessment of Cau River water quality assessment using a combination of water quality and pollution indices. J. Water Supply Res. Technol. Aqua 2020, 69, 160–172. [Google Scholar] [CrossRef]
- Sutadian, A.D.; Muttil, N.; Yilmaz, A.; Perera, C. Development of river water quality indices—A review. Environ. Monit. Assess. 2016, 188, 58. [Google Scholar] [CrossRef] [PubMed] [Green Version]
- Abbasi, T.; Abbasi, S.A. Water Quality Indices; Elsevier: Amsterdam, The Netherlands, 2012. [Google Scholar]
- Horton, R. An Index Number System for Rating Water Quality. J. Water Pollut. Control. Fed. 1965, 37, 300–306. [Google Scholar]
- Brown, R.M.; McClelland, N.I.; Deininger, R.A.; Tozer, R.G. A water quality index—Do we dare? Water Sew. Work 1970, 117, 339–343. [Google Scholar]
- Prati, L.; Pavanello, R.; Pesarin, F. Assessment of surface water quality by a single index of pollution. Water Res. 1971, 5, 741–751. [Google Scholar] [CrossRef]
- Ross, S.L. An index system for classifying river water quality. Water Pollut. Control 1977, 76, 113–122. [Google Scholar]
- Bascarón, M. Establishment of a methodology for the determination of water quality. Bol. Inf. Medio Ambiente 1979, 9, 30–51. [Google Scholar]
- Sarkar, C.; Abbasi, S.A. Qualidex—A new software for generating water quality indices. Environ. Monit. Assess. 2006, 119, 201–231. [Google Scholar] [CrossRef]
- CCME. Canadian Water Quality Guidelines for the Protection of Aquatic Life. In CCME Water Quality Index 1.0, User’s Manuall; Canadian Council of Ministers of the Environment: Winnipeg, MB, Canada, 2001; Available online: http://www.ccme.ca/files/Resources/calculators/WQI%20User’s%20Manual%20(en).pdf (accessed on 1 May 2020).
- House, M.A. A water quality index for river management. Water Environ. J. 1989, 3, 336–344. [Google Scholar] [CrossRef]
- Cude, C.G. Oregon Water Quality Index: A Tool for Evaluating Water Quality Management Effectiveness. J. Am. Water Resour. Assoc. 2001, 37, 125–137. [Google Scholar] [CrossRef]
- Unda-Calvo, J.; Ruiz-Romera, E.; Martínez-Santos, M.; Vidal, M.; Antigüedad, I. Multivariate statistical analyses for water and sediment quality index development: A study of susceptibility in an urban river. Sci. Total Environ. 2020, 711, 135026. [Google Scholar] [CrossRef] [PubMed]
- Banda, T.D.; Kumarasamy, M. Development of a Universal Water Quality Index (UWQI) for South African River Catchments. Water 2020, 12, 1534. [Google Scholar] [CrossRef]
- Anyanwu, E.D.; Umeham, S.N. Identification of waterbody status in Nigeria using predictive index assessment tools: A case study of Eme River, Umuahia, Nigeria. Int. J. Energy Water. Res. 2020. [Google Scholar] [CrossRef]
- Gomes, R.C.; Longo, R.M.; Ribeiro, F.H.S.; Bettine, S.D.C.; Demanboro, A.C.; Ribeiro, A.I. Water quality index in an urban watershed. Int. J. Sustain. Dev. Plan. 2016, 11, 1037–1043. [Google Scholar] [CrossRef] [Green Version]
- Banda, T.D.; Kumarasamy, M. Application of Multivariate Statistical Analysis in the Development of a Surrogate Water Quality Index (WQI) for South African Watersheds. Water 2020, 12, 1584. [Google Scholar] [CrossRef]
- Said, A.; Stevens, D.K.; Sehlke, G. An innovative index for evaluating water quality in streams. Environ. Manag. 2004, 34, 406–414. [Google Scholar] [CrossRef]
- Kachroud, M.; Trolard, F.; Kefi, M.; Jebari, S.; Bourrié, G. Water Quality Indices: Challenges and Application Limits in the Literature. Water 2019, 11, 361. [Google Scholar] [CrossRef] [Green Version]
- Noori, R.; Berndtsson, R.; Hosseinzadeh, M.; Adamowski, J.F.; Abyaneh, M.R. A critical review on the application of the National Sanitation Foundation Water Quality Index. Environ. Pollut. 2019, 244, 575–587. [Google Scholar] [CrossRef]
- Kannel, P.R.; Lee, S.; Lee, Y.S.; Kanel, S.R.; Khan, S.P. Application of water quality indices and dissolved oxygen as indicators for river water classification and urban impact assessment. Environ. Monit. Assess. 2007, 132, 93–110. [Google Scholar] [CrossRef]
- Briciu, A.-E.; Oprea-Gancevici, D.I. Diurnal thermal profiles of selected rivers in Romania. In Proceedings of the International Multidisciplinary Scientific GeoConference SGEM2015, Albena, Bulgaria, 18–24 June 2015; Volume 1, pp. 221–228. [Google Scholar]
- Ho, J.Y.; Afan, H.A.; El-Shafie, A.H.; Koting, S.B.; Mohd, N.S.; Jaafar, W.Z.B.; Sai, H.L.; Malek, M.A.; Ahmed, A.N.; Mohtar, W.H.M.W.; et al. Towards a time and cost effective approach to water quality index class prediction. J. Hydrol. 2019, 575, 148–165. [Google Scholar] [CrossRef]
- Martonoș, I.M.; Petruș, M.; Roșu, C. Assessment of Chinteni rivulet (Romania) water quality under the impact of the anthropogenic factor. Studia Univ. Babes Bolyai Ambient. 2018, 63, 63–74. [Google Scholar] [CrossRef]
- Dunca, A.-M. Water Pollution and Water Quality Assessment of Major Transboundary Rivers from Banat (Romania). J. Chem. 2018, 9073763. [Google Scholar] [CrossRef] [Green Version]
- Ismail, A.H.; Robescu, D.; Hameed, M.A. Application of CCME WQI in the Assessment of the Water Quality of Danube River, Romania. Eng. Technol. J. 2018, 36, 142–146. [Google Scholar]
- Iticescu, C.; Georgescu, L.P.; Murariu, G.; Topa, C.; Timofti, M.; Pintilie, V.; Arseni, M. Lower Danube Water Quality Quantified through WQI and Multivariate Analysis. Water 2019, 11, 1305. [Google Scholar] [CrossRef] [Green Version]
- Enea, A.; Hapciuc, O.-E.; Iosub, M.; Minea, I.; Romanescu, G. Water quality assessment in three mountainous watersheds from eastern Romania (Suceava, Ozana and Tazlau rivers). Environ. Eng. Manag. J. 2017, 16, 605–614. [Google Scholar] [CrossRef]
- Iticescu, C.; Murariu, G.; Georgescu, L.P.; Burada, A.; ¸Topa, C.M. Seasonal variation of the physico-chemical parameters and Water Quality Index (WQI) of Danube water in the transborder Lower Danube area. Rev. Chim. 2016, 67, 1843–1849. [Google Scholar]
- Iticescu, C.; Georgescu, L.P.; Topa, C.M. Assessing the Danube Water Quality Index in the City of Galati, Romania. Carpath. J. Earth Environ. Sci. 2013, 8, 155–164. [Google Scholar]
- Topa, M.C.; Timofti, M.; Burada, A.; Iticescu, C.; Georgescu, L.P. Danube water quality during and after flood near an urban agglomeration. J. Environ. Prot. Ecol. 2015, 16, 1255–1261. [Google Scholar]
- Piştea, I.; Ungur, A.; Roba, C.; Popiţa, G.; Roşu, C. Assessment of the surface water quality using water quality index (WQI). Case Study: Someșul Mic River, Cluj Napoca, Romania. Studia Univ. Babes Bolyai Ambient. 2013, 58, 87–92. [Google Scholar]
- Briciu, A.-E. Studiu de Hidrologie Urbană în Arealul Municipiului Suceava (Urban Hydrology Study in Suceava Municipality Area); Ştefan cel Mare University Publishing House: Suceava, Romania, 2017. [Google Scholar]
- Briciu, A.-E.; Graur, A.; Oprea, D.I.; Filote, C. A Methodology for the Fast Comparison of Streamwater Diurnal Cycles at Two Monitoring Stations. Water 2019, 11, 2524. [Google Scholar] [CrossRef] [Green Version]
- Briciu, A.-E.; Mihăilă, D.; Graur, A.; Oprea, D.I.; Prisăcariu, A.; Bistricean, P.I. Changes in the Water Temperature of Rivers Impacted by the Urban Heat Island: Case Study of Suceava City. Water 2020, 12, 1343. [Google Scholar] [CrossRef]
- Ali, Z.M. Robust principal component analysis in water quality index development. AIP Conf. Proc. 2014, 1602, 1091. [Google Scholar]
- Sahoo, M.M.; Patra, K.C.; Khatua, K.K. Inference of Water Quality Index Using ANFIA and PCA. Aquat. Procedia 2015, 4, 1099–1106. [Google Scholar] [CrossRef]
- Tripathi, M.; Singal, S.K. Use of Principal Component Analysis for parameter selection for development of a novel Water Quality Index: A case study of river Ganga India. Ecol. Indic. 2019, 96, 430–436. [Google Scholar] [CrossRef]
- Gao, A.; Wu, S.; Zhu, S.; Xu, Z. Wavelet and statistical analyses of river water quality parameters: A case study in the Lower Minnesota River. Water Pract. Technol. 2018, 13, 922–931. [Google Scholar] [CrossRef]
- Kang, S.; Lin, H. Wavelet analysis of hydrological and water quality signals in an agricultural watershed. J. Hydrol. 2007, 338, 1–14. [Google Scholar] [CrossRef]
- Grinsted, A.; Moore, J.C.; Jevrejeva, S. Application of the cross wavelet transform and wavelet coherence to geophysical time series. Nonlinear Process. Geophys. 2004, 11, 561–566. [Google Scholar] [CrossRef]
- Torrence, C.; Compo, G.P. A practical guide to wavelet analysis. Bull. Am. Meteorol. Soc. 1998, 79, 61–78. [Google Scholar] [CrossRef] [Green Version]
- Gomes, F.D.G.; Osco, L.P.; Antunes, P.A.; Ramos, A.P.M. Climatic seasonality and water quality in watersheds: A study case in Limoeiro River watershed in the western region of São Paulo State, Brazil. Environ. Sci. Pollut. Res. 2020. [Google Scholar] [CrossRef]
- Zhong, M.; Zhang, H.; Sun, X.; Wang, Z.; Tian, W.; Huang, H. Analyzing the significant environmental factors on the spatial and temporal distribution of water quality utilizing multivariate statistical techniques: A case study in the Balihe Lake, China. Environ. Sci. Pollut. Res. 2018, 25, 29418–29432. [Google Scholar] [CrossRef] [PubMed]
- Xu, G.; Li, P.; Lu, K.; Tantai, Z.; Zhang, J.; Ren, Z.; Wang, X.; Yu, K.; Shi, P.; Cheng, Y. Seasonal changes in water quality and its main influencing factors in the Dan River basin. Catena 2019, 173, 131–140. [Google Scholar] [CrossRef]
- Gribovszki, Z.; Szilágyi, J.; Kalicz, P. Diurnal fluctuations in shallow groundwater levels and streamflow rates and their inter-pretation—A review. J. Hydrol. 2010, 385, 371–383. [Google Scholar] [CrossRef] [Green Version]
- Gribovszki, Z.; Kalicz, P. Diurnal methods for evapotranspiration and recharge estimations. Geophys. Res. Abstr. 2019, 21, 1. [Google Scholar]
- Tian, Y.; Jiang, Y.; Liu, Q.; Dong, M.; Xu, D.; Liu, Y.; Xu, X. Using a water quality index to assess the water quality of the upper and middle streams of the Luanhe River, northern China. Sci. Total Environ. 2019, 667, 142–151. [Google Scholar] [CrossRef]
- Zhu, S.; Mostafaei, A.; Luo, W.; Jia, B.; Dai, J. Assessing water quality for urban tributaries of the Three Gorges Reservoir, China. J. Water Reuse Desal. 2019, 9, 105–114. [Google Scholar] [CrossRef] [Green Version]
- Puczko, K.; Jekatierynczuk-Rudczyk, E. Analysis of urban land cover influence to organic carbon and nutrients in surface water via impacted groundwater. Environ. Monit. Assess. 2020, 192, 145. [Google Scholar] [CrossRef] [Green Version]
- Briciu, A.-E.; Mihaila, D.; Mihaila, D. Short, medium and long term stochastic analysis of the Suceava river pollution evolution in the homonymous city. In Proceedings of the International Multidisciplinary Scientific GeoConference, SGEM2012, Albena, Bulgaria, 17–23 June 2012; Volume 3, pp. 809–816. [Google Scholar]
- Grimmeisen, F.; Zemann, M.; Goeppert, N.; Goldscheider, N. Weekly variations of discharge and groundwater quality caused by intermittent water supply in an urbanized karst catchment. J. Hydrol. 2016, 537, 157–170. [Google Scholar] [CrossRef]
- Briciu, A.-E.; Toader, E.; Romanescu, G.; Sandu, I. Urban Streamwater Contamination and Self-purification in a Central-Eastern European City. Part, I. Rev. Chim. 2016, 67, 1294–1300. [Google Scholar]
- Briciu, A.-E.; Toader, E.; Romanescu, G.; Sandu, I. Urban Streamwater Contamination and Self-purification in a Central-Eastern European City. Part, B. Rev. Chim. 2016, 67, 1583–1586. [Google Scholar]
Figure 1.
Geographical position of the study area and the location of stations included in this study.
Figure 1.
Geographical position of the study area and the location of stations included in this study.

Figure 2.
Comparative evolution of daily average values of the monitored parameters at Mihoveni (upstream, blue line) and Tişăuţi (downstream, orange line) in 2019: (a) dissolved oxygen (DO); (b) specific conductivity (SC); (c) pH; (d) oxidation reduction potential (ORP); (e) temperature; (f) level.

Figure 3.
Scatter plots of two parameters (first row—DO; second row—ORP) monitored at Mihoveni (upstream) and Tişăuţi (downstream) and the temperature of various types of waters: (a,d)—streamwater upstream; (b,e)—streamwater downstream; (c,f)—wastewater temperature of wastewater treatment plant of Suceava city (WWTP) effluent vs. Suceava River DO or ORP downstream (linear trendline and coefficient of determination included).

Figure 4.
Comparative evolution of the difference between daily average values of the monitored parameters at Tişăuţi and Mihoveni in 2019 (the dotted red line is the linear trendline): (a) DO; (b) SC; (c) pH; (d) ORP; (e) temperature; (f) level.
Figure 4.
Comparative evolution of the difference between daily average values of the monitored parameters at Tişăuţi and Mihoveni in 2019 (the dotted red line is the linear trendline): (a) DO; (b) SC; (c) pH; (d) ORP; (e) temperature; (f) level.

Figure 5.
Scatter plots of the daily values of some parameters ((a) ORP, (b) pH, (c) SC) at Tişăuţi (downstream) and the difference between the daily average values of the same parameters at Tişăuţi and Mihoveni (linear trendline and coefficient of determination included).
Figure 5.
Scatter plots of the daily values of some parameters ((a) ORP, (b) pH, (c) SC) at Tişăuţi (downstream) and the difference between the daily average values of the same parameters at Tişăuţi and Mihoveni (linear trendline and coefficient of determination included).

Figure 6.
Principal component analysis (PCA) correlation circles of water quality parameters at (a) Mihoveni (upstream); (b) Tişăuţi (downstream); based on hourly values—there is a negative correlation if lines are in opposite parts of the circle and positive if they are close to each other; the length of a line indicate the contribution of that parameter to the strength of the correlative model.

Figure 7.
Water quality index (WQI) of Suceava River upstream (blue line) and downstream (orange line) in 2019: (a) temporal evolution based on hourly data; (b) temporal evolution based on average daily data; (c) average diurnal profile.
Figure 7.
Water quality index (WQI) of Suceava River upstream (blue line) and downstream (orange line) in 2019: (a) temporal evolution based on hourly data; (b) temporal evolution based on average daily data; (c) average diurnal profile.

Figure 8.
Weekly regime of some studied waters in 2019 (averaged daily data): (a) Suceava River WQI; (b) treated wastewater discharge from WWTP.
Figure 8.
Weekly regime of some studied waters in 2019 (averaged daily data): (a) Suceava River WQI; (b) treated wastewater discharge from WWTP.

Figure 9.
Variants of WQI of Suceava River upstream (blue line) and downstream (orange line) in 2019 (temporal evolution based on hourly data): (a) rectified WQI; (b) partial WQI.
Figure 9.
Variants of WQI of Suceava River upstream (blue line) and downstream (orange line) in 2019 (temporal evolution based on hourly data): (a) rectified WQI; (b) partial WQI.

Figure 10.
Scalograms of the wavelet coherence (WTC) analysis: (a) wavelet coherence between WQI upstream and WQI downstream; (b) wavelet coherence between water level downstream and WQI downstream.
Figure 10.
Scalograms of the wavelet coherence (WTC) analysis: (a) wavelet coherence between WQI upstream and WQI downstream; (b) wavelet coherence between water level downstream and WQI downstream.


Figure 11.
Comparison of the temporal evolution (daily data) of WPI (data from WWTP) and ΔWQI (difference between downstream and upstream values of Suceava River WQI).
Figure 11.
Comparison of the temporal evolution (daily data) of WPI (data from WWTP) and ΔWQI (difference between downstream and upstream values of Suceava River WQI).


Table 1.
Summary of the water quality parameters of Suceava River at the two monitoring stations in 2019 based on daily values.
Table 1.
Summary of the water quality parameters of Suceava River at the two monitoring stations in 2019 based on daily values.
| DO (mg/L) | SC (µS/cm) | ORP (mV) | pH | Temperature (°C) | ||
|---|---|---|---|---|---|---|
| Upstream | Average | 10.39 | 491.89 | 429.09 | 8.52 | 11.55 |
| Minimum | 6.61 | 269.60 | 319.38 | 8.19 | −0.10 | |
| Maximum | 13.99 | 669.63 | 473.65 | 8.90 | 26.58 | |
| Standard deviation | 1.89 | 81.02 | 31.65 | 0.12 | 7.97 | |
| Downstream | Average | 8.38 | 559.97 | 336.12 | 8.13 | 11.98 |
| Minimum | 3.03 | 290.34 | 212.11 | 7.57 | −0.01 | |
| Maximum | 12.98 | 817.34 | 451.33 | 8.81 | 26.47 | |
| Standard deviation | 2.27 | 107.70 | 53.04 | 0.28 | 7.88 |
© 2020 by the authors. Licensee MDPI, Basel, Switzerland. This article is an open access article distributed under the terms and conditions of the Creative Commons Attribution (CC BY) license (http://creativecommons.org/licenses/by/4.0/).
Share and Cite
MDPI and ACS Style
Briciu, A.-E.; Graur, A.; Oprea, D.I. Water Quality Index of Suceava River in Suceava City Metropolitan Area. Water 2020, 12, 2111. https://doi.org/10.3390/w12082111
AMA Style
Briciu A-E, Graur A, Oprea DI. Water Quality Index of Suceava River in Suceava City Metropolitan Area. Water. 2020; 12(8):2111. https://doi.org/10.3390/w12082111
Chicago/Turabian StyleBriciu, Andrei-Emil, Adrian Graur, and Dinu Iulian Oprea. 2020. "Water Quality Index of Suceava River in Suceava City Metropolitan Area" Water 12, no. 8: 2111. https://doi.org/10.3390/w12082111
Note that from the first issue of 2016, this journal uses article numbers instead of page numbers. See further details here.