Article

Development of an Environmental Decision Support System for Enhanced Coagulation in Drinking Water Production

1
LEQUIA, Institute of the Environment, University of Girona, E-17003 Girona, Catalonia, Spain
2
Ens d’Abastament d’Aigua Ter-Llobregat (ATL), Sant Martí de l’Erm, E-08970 Sant Joan Despí, Barcelona, Spain
*
Author to whom correspondence should be addressed.
Water 2020, 12(8), 2115; https://doi.org/10.3390/w12082115
Submission received: 23 June 2020 / Revised: 21 July 2020 / Accepted: 22 July 2020 / Published: 25 July 2020
(This article belongs to the Special Issue Modelling of Drinking Water Treatments to Deal with Global Change)

Abstract

:
Drinking water production is subject to multiple water quality requirements such as minimizing disinfection byproducts (DBPs) formation, which are highly related to natural organic matter (NOM) content. For water treatment, coagulation is a key process for removing water pollutants and, as such, is widely implemented in drinking water treatment plants (DWTPs) facilities worldwide. In this context, artificial intelligence (AI) tools can be used to aid decision making. This study presents an environmental decision support system (EDSS) for coagulation in a Mediterranean DWTP. The EDSS is structured hierarchically into the following three levels: data acquisition, control, and supervision. The EDSS relies on influent water characterization, suggesting an optimal pH and coagulant dose. The model designed for the control level is based on response surface methodology (RSM), targeted to optimize removal for the response variables (turbidity, total organic carbon (TOC), and UV254). Results from the RSM model provided removal percentages for turbidity (64.6%), TOC (21.9%), and UV254 (30%), which represented an increase of 4%, 33%, and 28% as compared with the DWTP water sample. Regarding the entire EDSS, 62%, 21%, and 25% of turbidity, TOC, and UV254 removal were fixed as the optimization criteria. Supervision rules (SRs) were included at the top of the architecture to intensify process performance under specific circumstances.

Graphical Abstract

1. Introduction

Drinking water treatment plants (DWTPs) supply water for all citizens under strictly legislated quality parameters. Multiple factors have an impact on drinking water treatment. For instance, scientific evidence shows that climate change has been modifying the availability of surface waters and inducing some changes in the quality of surface waters [1,2,3]. This situation, coupled with the idiosyncrasy of Mediterranean countries, i.e., geographical regions where water resources are highly stressed, has created additional difficulties for drinking water management. There are different types of water catchment facilities depending on the water source, i.e., groundwater, seawater, regenerated water, and surface water (including rivers and reservoirs) [4,5].
All DWTPs deal with influent natural organic matter (NOM) fluctuations. NOM is a heterogenic matrix and has become the most challenging factor to ensure drinking water regulations are met [6,7]. Spanish legislation requires a chlorine-based oxidation process at the end of treatment to avoid disinfection byproducts (DBPs) formation throughout the distribution network [8]. It is at this point where NOM removal becomes significant, given that NOM is the largest precursor of these compounds [9,10,11,12]. An increase of NOM removal in coagulation and flocculation reduces DBPs formation along water treatment and distribution.
In order to ensure NOM removal throughout the treatment process, DWTPs run a series of complementary unit operations. The most typical configuration is coagulation/flocculation coupled to filtration-based processes. Several authors [13,14,15] have shown that coagulation and flocculation optimization has an effect on organic components removal. Nevertheless, sand filters and CAG beds are critical for removing certain groups of NOM fractions [16,17]. Considering processes following coagulation, ultrafiltration (UF) membranes are emerging as promising and robust water quality treatments [18,19] that can even work as hybrid systems [20,21]. In this sense, parameters monitored to control membrane fouling can be used to complement NOM characterization [22]. Hence, the integration of enhanced coagulation models coupled with the expert rules derived from membrane experiments can improve DWTPs performance.
In an integrated treatment, the efficacy of enhanced coagulation has an impact on the following unit operations and, as such, the type of coagulant, dosages, dosing methodologies (continuous or intermittent), dosing points, and mixing methods [6,23] must be controlled in order to avoid membrane fouling, if the next unit operation in the treatment chain is a membrane-based treatment [24,25]. Several water properties (hydrophobicity, charge density, molecular weight, and molecular size) and impurities (colloidal or dissolved, protein-like substances, organic or inorganic) contribute to the fouling phenomena [26,27]. Considering all of this, UF fouling indicators can be used to characterize NOM, adding information to that already provided by the enhanced coagulation models.
To track and remove NOM content, DWTPs have developed a set of analytical techniques and have improved the quantity of the sensors implemented to monitor NOM, in an attempt to adapt the treatment to the environmental conditions [28]. To achieve a resilient process, NOM must be characterized and quantified at different stages during the treatment to control the efficiency of the treatments and to determine the levels of reactivity of the NOM compounds. The water content of the NOM is monitored through online sensors and analyzers, continuously producing large amounts of data. This data, which can be codified and incorporated into an environmental decision support system (EDSS), contain valuable information about the capability of the DWTPs’ unit processes to reduce NOM and the related DBP formation. EDSSs are artificial intelligence (AI) tools that have emerged to cope with systems’ operational complexity and accelerate decision making [29]. They integrate quantitative and qualitative aspects, combining mechanistic and statistical models together with other AI techniques. For instance, in a real-plant application, process parameters such as turbidity and UV254 were used to build an artificial neural network to predict oxidant demand at a full-scale DWTP [30].
For EDSS implementation, it is important to define an operating structure which should make it possible to work with a fast and easily updated version of the system and to include any new requirements (legislation updates and modifications), new models, or new DWTP treatments. In that sense, the EDSS architecture has to be structured hierarchically in order to perfectly visualize all the modules or codified knowledge [31,32]. Consequently, a three-level architecture can be defined as data acquisition, control, and supervision [33]. According to this study, the control level represents the engine of the whole EDSS.
Traditionally, coagulation has been modeled through a one-factor-at-a-time approach (OFAT), based on controlling pH and coagulant doses to counter the turbidity response. To achieve enhanced coagulation, other water parameters, rather than solely turbidity removal, can be considered [34,35]. The development and implementation of these approaches implies an increase in the number of quality parameters (factors and responses) considered in the process. For this purpose, some modeling tools can be applied. For instance, response surface methodology (RSM) which is a technique based on mathematical statistical methods, provides an efficient and rapid resolution for coagulation processes that offers a multivariate response optimization analysis using a minimum number of experimental tests. RSM is also useful to describe the importance of individual factors as well as their interactive influences [36,37,38,39].
The present study was carried out within the framework of developing an EDSS for a water treatment facility in the Mediterranean, which would help to improve the whole plant’s performance. The general objective was to develop an EDSS module for enhanced coagulation in order to determine the optimum operation conditions for this unit operation by achieving the following three specific objectives: (i) develop an enhanced coagulation model using RSM, (ii) evaluate the model for the case study, and (iii) develop the applied knowledge-based supervision rules for the EDSS.
The paper is structured as follows: First, in the Materials and Methods section the DWTP case study, laboratory experiments, and RSM coagulation model design are described; then, the Results and Discussion are divided into two subsections, the enhanced coagulation model and the EDSS architecture, where model analysis and optimization are fully detailed; finally, the three-level architecture of the EDSS is drawn up and specified with the proposed supervision rules.

2. Materials and Methods
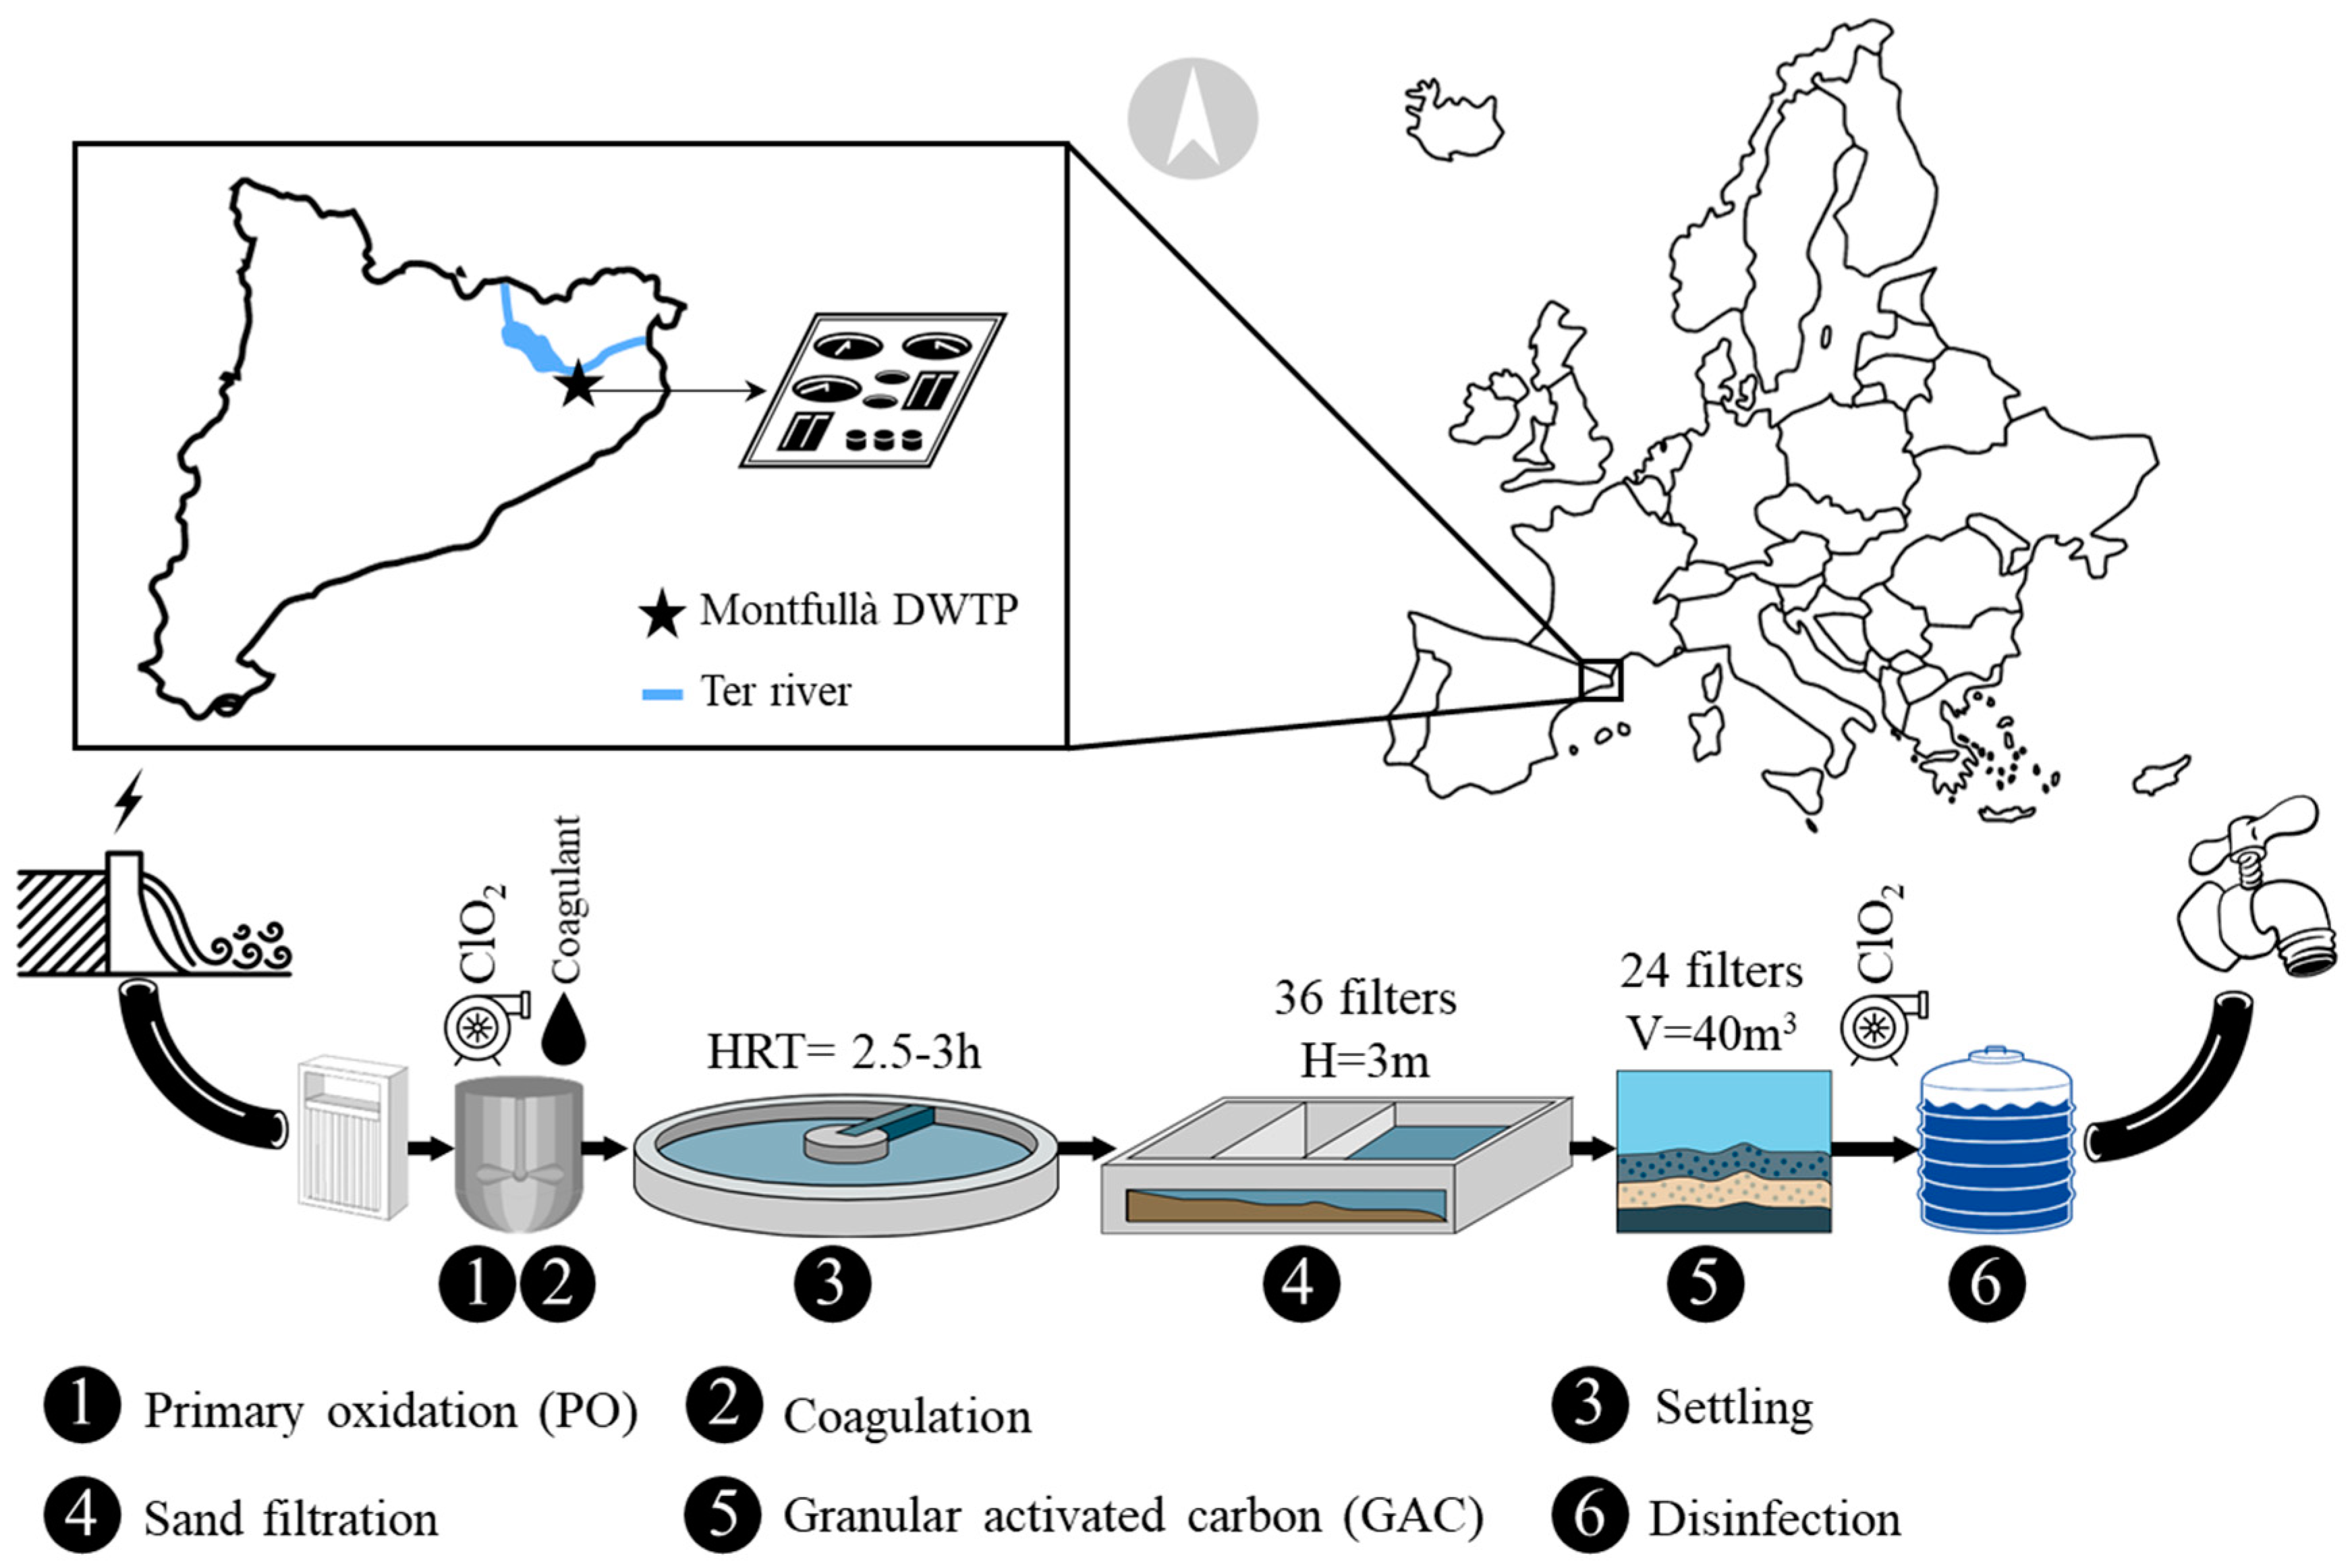
2.1. Case Study

The NOM-related EDSS for coagulation unit operation optimization was developed at the Montfullà DWTP, located near Girona (NE Spain). This facility provides water to the province of Girona, and is managed by the Aigües de Girona, Salt i Sarrià de Ter company. Influent water coming from a series of connected reservoirs (Sau-Susqueda-Pasteral) in the Ter river basin is conducted through a 16 km pipeline. The maximum production of drinking water is 125,000 m3·day−1, supplied to circa 300 k inhabitants. The effect the reservoirs have on the quality of the water along the Ter river has been studied since the 1990s, and the water before and after the reservoirs’ experience has been determined as having differences in NOM quantity and quality due to the settling effect and also the degradation of the organic compounds [40]. The treatment chain at the Montfullà DWTP is comprised of the following: (1) primary oxidation (PO) process with chlorine dioxide (ClO2) in the mixing chamber; (2) rapidly followed by coagulation and flocculation with the addition of powdered polyaluminium chloride (PAC) before slow sedimentation settling; (3) then, gravity filtration through sand filters; and (4) CAG beds (in this facility, flocculant is not added as the powdered PAC alone is enough to keep the desired water quality requirements); (5) at the end of the treatment, the disinfection phase occurs to ensure the free chlorine concentration required as the water is moved through the supply distribution network [8]. Figure 1 shows the geographical location and a representation of the Montfullà DWTP treatment flow diagram.
A group of parameters are monitored to characterize the influent coming into the facility and adapt the treatment to the changing conditions (Table 1). Some of these parameters, such as turbidity and total organic carbon (TOC), are used as NOM content indicators.

Influent Raw Water Parameter Selection

First, for the EDSS data acquisition level, it was necessary to identify the source, the format, and the availability of data. The aim was to propose a database for EDSS data acquisition. Different types of information were included in this database which included water quality (incoming influent and throughout the treatment), operational reagent (dosages), and laboratory analytics. To proceed with this analysis objectively, data were classified into databases A, B, and C based on their source, typology, and nature. Database A contained the manually introduced data from the DWTP laboratory analyses; Database B contained the data collected from the sensors, probes, and online analyzers; and Database C contained the values of the operational reagent dosages and other working parameters (flow, pH, HRTs, etc.).
Then, data from the DWTP influent were evaluated statistically representing the temporal evolution of the variables to detect behavioral patterns (seasonality) and cases of changing conditions, as well as normal distribution diagrams and other statistical values (average, median and percentile values, box diagrams, and so forth). Furthermore, Pearson correlations were analyzed to determine the influences between parameters. Data processing tools Excel 2016 (Microsoft®, Santa Rosa, CA, USA) and MATLAB 2015a (Mathworks®, Natick, MA, USA) were used to perform these analyses.
All these statistics, graphs, and correlations were assessed to identify the key influent parameters which needed to be considered to achieve an enhanced coagulation RSM model (EDSS control level). To compare the effect of raw water characterization and PO (ClO2DOSE) against the coagulation parameters from the DWTP, the data provided for Databases A, B, and C were correlated with the coagulant dose. Table 2 shows the results from these correlations.
Table 2 shows that the highest correlations with the coagulant dose were TurbidityRAW and TOCRAW. On the basis of these results and the pre-existing scientific bibliography, these two raw water parameters were selected as enhanced coagulation model responses. In addition to these, UV254 was included in the models and was proposed as a good indicator for NOM [41]. The objective of enhanced coagulation is to consider more responses (water parameters) than the OFAT approach does. For that reason, and to increase RSM robustness, the following three factors were selected as the most representative for DWTP coagulation performance: Turbidity, TOC, and UV254.

2.2. Jar Test Experiments

The jar test is widely used to determine the best coagulation conditions. Coagulant supplied by the DWTP was used in this study. The coagulant was alum-based (polyaluminium chloride), and the pH was adjusted with HCl 0.1M and NaOH 0.1M before the addition of the coagulant reagent. A Phipps & Bird (7790-910, Richmond, VA, USA) programmable jar tester was employed for the experiments (6 × 2 L rectangular jars). Mixing conditions were divided into three sequential steps as follows: rapid mix phase (1 min at 250 rpm), slow mix phase (30 min at 30 rpm), and a settling time of 30 min. The coagulant was added at T0 of the rapid mix phase. NOM parameters (turbidity, TOC, and UV254) were measured before and after the jar test experiments. Supernatants were collected from the middle of the water column to avoid collecting unstable superficial flocs.

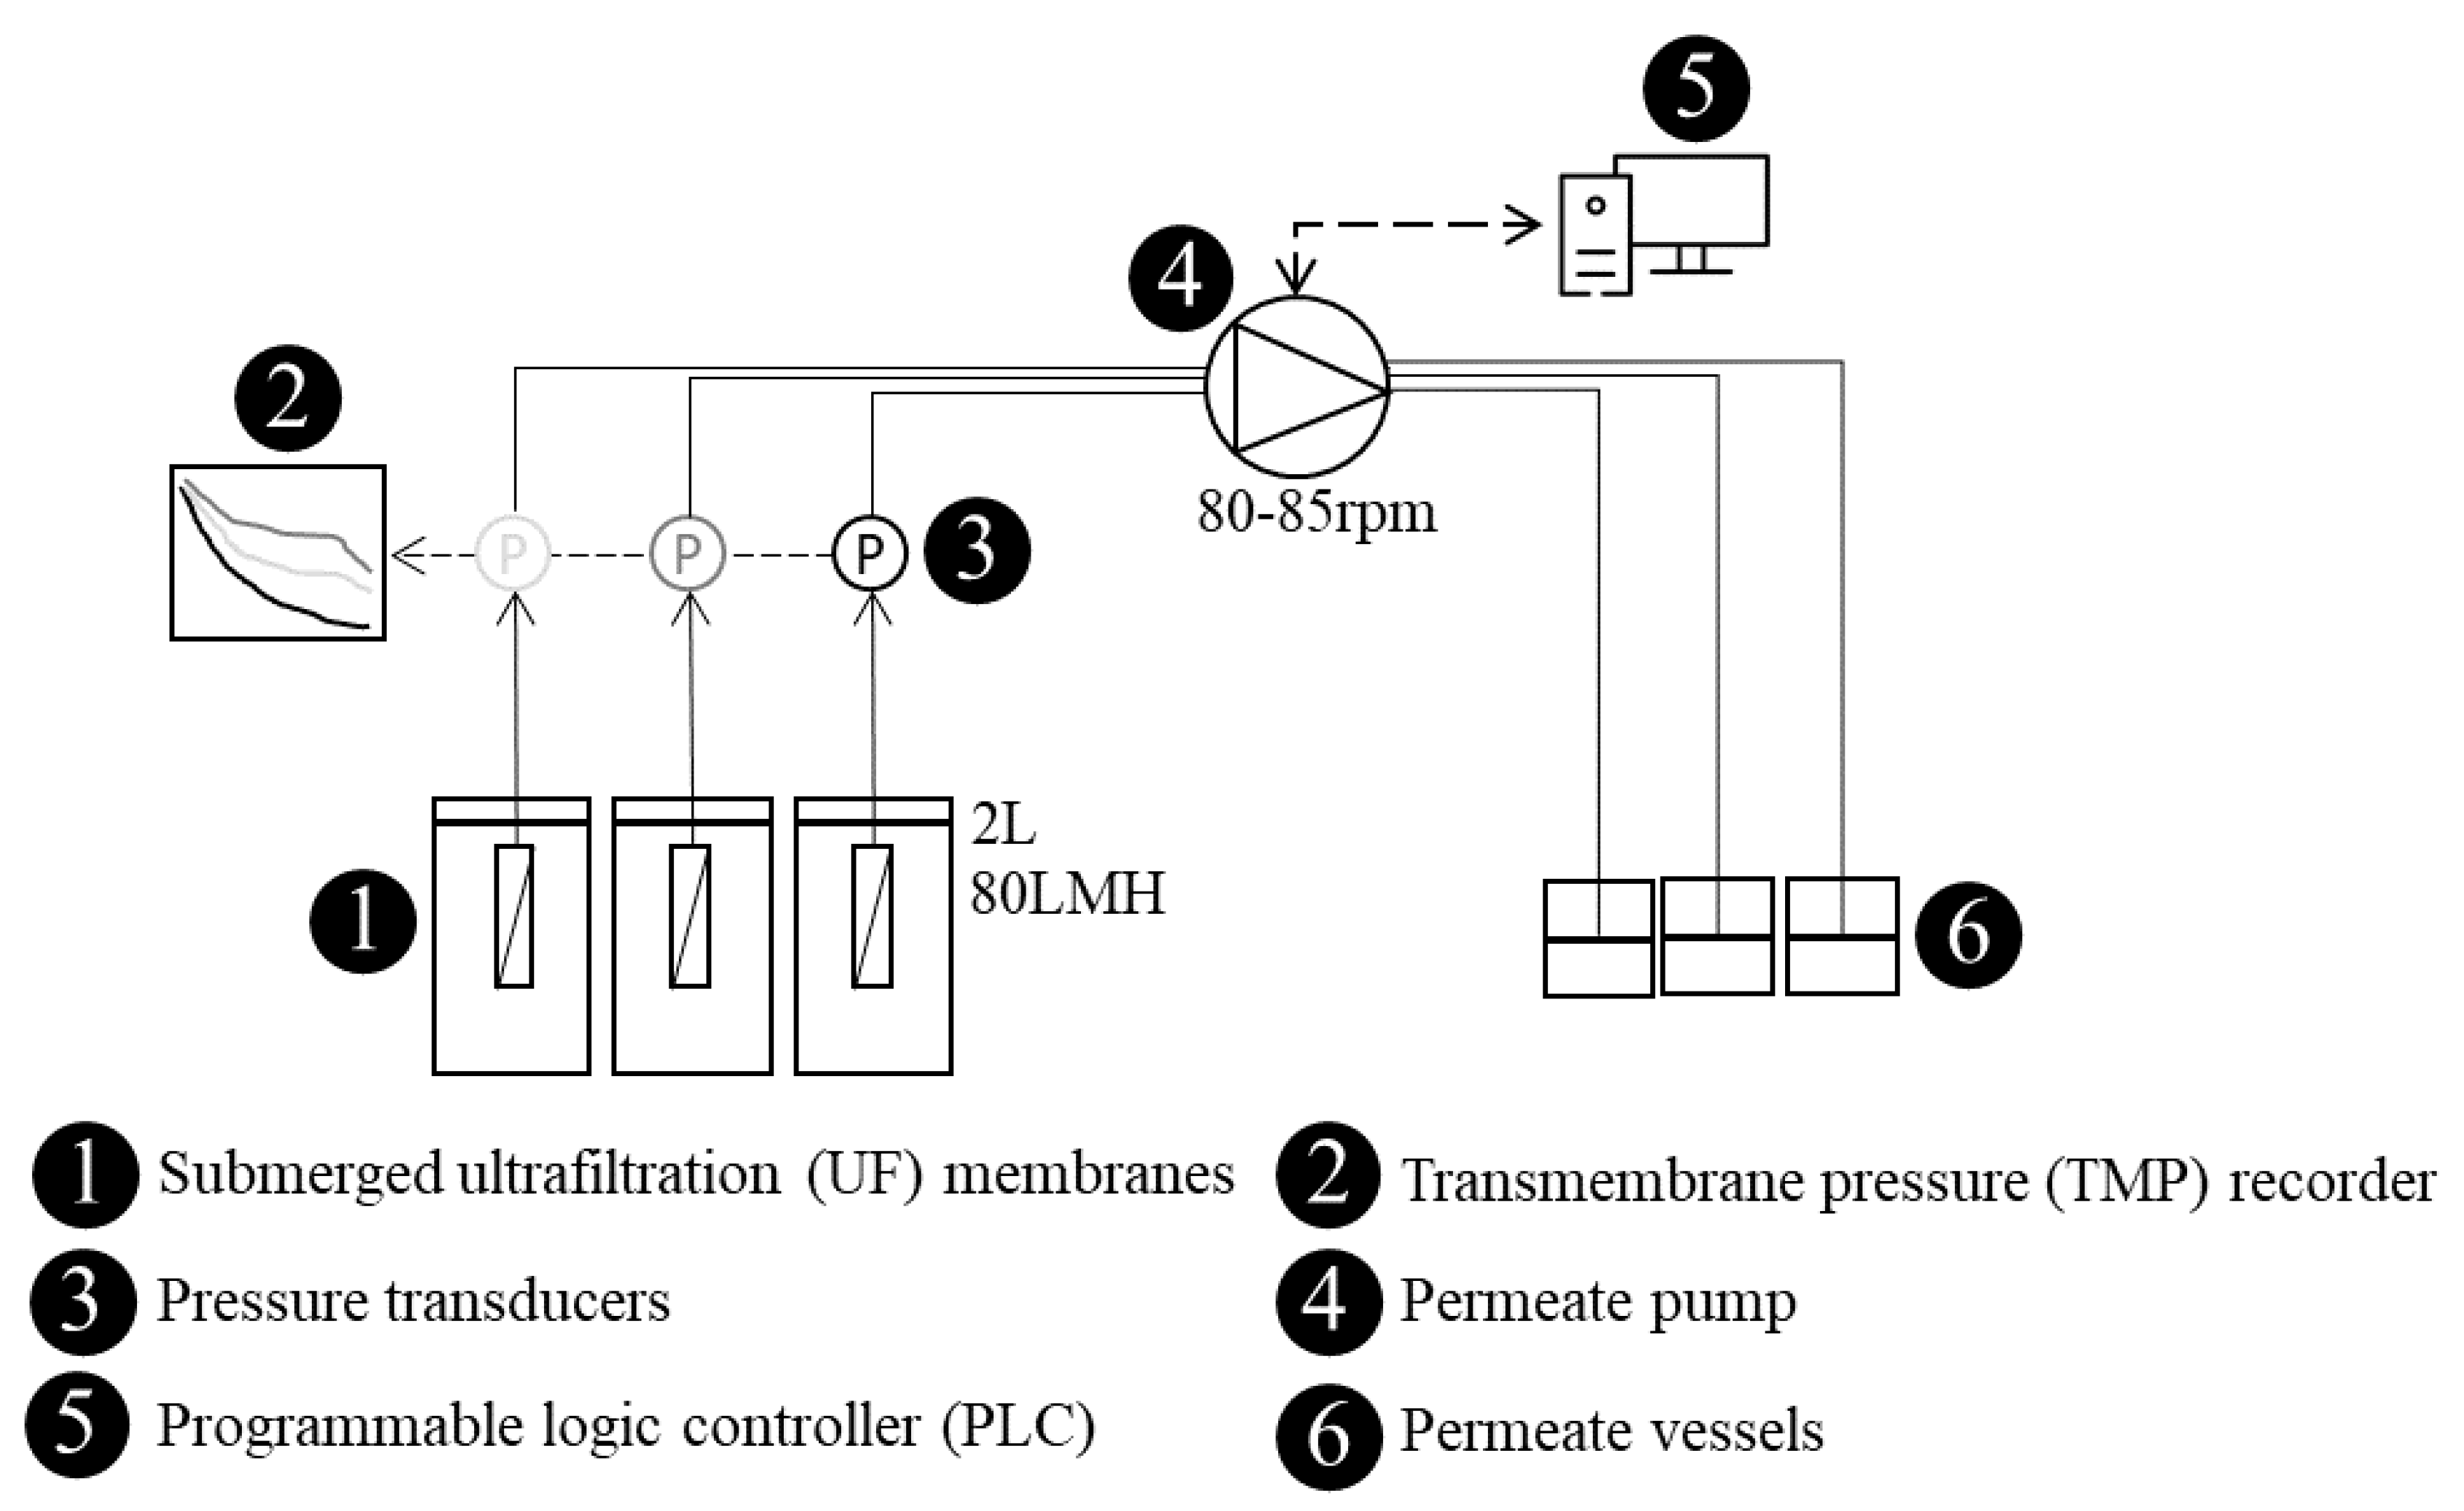
2.3. Experimental Methodology for UF Membrane

To quantify the fouling phenomena, a bench-scale membrane filtration system with the ability to filter, in parallel, different water samples was constructed (Figure 2). As NOM is considered to be one of the most critical fouling factors, different operational and quality parameters were monitored, including transmembrane pressure (TMP) values, flux, and permeability (K).
To assemble the hollow fiber (HF) UF membrane modules, a protocol to ensure that their characteristics were similar had to be developed. Each module was composed of two new PVDF fibers of equal length, (approximately 30 cm), thus, providing a useful filtration area of around 0.004 m2. The fibers used for the modules were provided by Polymem® and had a cut-off of 0.1 µm. All the modules were validated with an integrity test (5 min at 1 bar of pressure) and then the liquid permeability was assessed at 20 °C. Next, the continuous filtration experiments for estimating potential fouling were planned by maintaining a theoretical constant flux (monitored during the experiments) and evaluating the permeability as a key parameter in order to analyze the fouling potential [42,43].
The experimental UF tests, presented in this study, were evaluated by filtering the supernatant jar samples obtained after the coagulation experiments and the real DWTP coagulated sample. NOM-related parameters were measured before the UF experiments were run and at the same time as permeability was recorded. The study of permeability enabled the comparison between samples to be made because it integrated small changes into surface filtration areas which were calculated using online flux and transmembrane pressure (TMP) values (Equation (1)). The loss of permeability over the experiment was also calculated with Equation (2).
Permeability   ( K ) = Flux   ( LMH ) TMP   ( Bar )
where flux is expressed by L · m 2 · H 1 and transmembrane pressure (TMP) in Bar.
%   Permeability   lost   ( K Lost ) = K ti   K tf K ti × 100
where Kti and Ktf are permeability values at time = 0 and time = final, respectively.
The UF experiments were carried out before and after a heavy flood event. This kind of extreme phenomena is typical in Mediterranean regions, causing alterations in reservoirs’ water quality in terms of particulate and dissolved organic loads [44]. As the DWTP catchment is a reservoir system, the aim of the UF experiments was to correlate enhanced coagulation performance and UF membrane operation. In addition, all the samples were chemically analyzed.

2.4. Chemical Analysis

Water samples were characterized by monitoring specific parameters, including pH, turbidity, total carbon (TC), TOC, UV254, at the case study DWTP. For the turbidity measurements, a Hach TU5200 turbidimeter was used and the results were recorded in nephelometric units (NTU). TC/TOC and UV254 (cm−1) were analyzed with a Sievers M9 portable analyzer and a Cary 3500 UV-Vis Agilent Tech spectrophotometer with a quartz cell (1 cm of path length), respectively. The TC and TOC values were analyzed with the ICR function activated, thus, ensuring an inorganic carbon (IC) loss between 90 to 99%. Meanwhile, the pH was determined with a Crison micro pH 2000.
The ISO 5667-3:2018 requirements were followed to transport, store, and pretreat the samples. Samples were collected (without adding chemical reagents), directly from the DWTP influent through a pipe or from the river catchment, and were stored in amber bottles, in darkness at 4 °C. Once in the laboratory, to determine the TOC and UV254, the samples were filtered through 0.45 µm nylon filters prior to analysis. UV254 was measured according to Standard Methods: 5910B [45].

2.5. Response Surface Methodology (RSM) Design

The pH and coagulant dose were considered to be the key factors (A and B, respectively) in developing the response surface methodology (RSM) design. RSM for a NOM-related enhanced coagulation, which has been reported as a useful approach with which to model multifactorial processes such as coagulation, was developed. RSM with a central composite design (CCD) was the method chosen to optimize coagulation in the case study DWTP, in accordance with the methodology reported by [46]. Design response parameters were turbidity (%), TOC (%), and UV254 (%) removal. Design-Expert® (Stat-Ease, Inc., Minneapolis, MN, USA) software version 11.0 was used to generate the models.
The RSM was designed for a wider range of factors than those encountered in real DWTP operation, because the aim was to describe a total surface output model for response parameters. The Montfullà DWTP design was factorized with a pH range from 5.5 to 8.5, but in a real plant the operation fluctuates between 7.5 and 8. The coagulant dose was defined in the range from 10 to 40 mg·L−1, which was considered to be feasible and representative.
Once the CCD-RSM had been developed, the model’s outputs were used to identify the best pH and coagulant conditions for coagulation optimization. The removal percentages of the response variables (turbidity, TOC, and UV254) were configured as an output of the model by following Equations (3)–(5). The raw water samples were the DWTP’s influent without the addition of reagents.
% Turbidity REMOVED = Turbidity RAW   Turbidity SUPERNATANT Turbidity RAW × 100 %  
% TOC REMOVED = TOC RAW   TOC SUPERNATANT TOC RAW × 100 %  
% UV 254 REMOVED = UV 254 RAW   UV 254 SUPERNATANT UV 254 RAW × 100 %  
It is worth noting that different sampling campaigns are planned to be carried out throughout the year, including seasonality events and different quantity/quality NOM fluctuations, in order to enhance the robustness and accuracy of the proposed design.

3. Results and Discussion

In this section, the enhanced coagulation model and the UF membrane experiments are presented. Then, the data and knowledge are incorporated into the EDSS architecture.

3.1. Development and Evaluation of the Enhanced Coagulation Model

The enhanced coagulation model based on the RSM-CCD developed at the case study DWTP is presented here. The factors for the model were pH (A) and coagulant dose (B), while percentages of turbidity, TOC, and UV254 removal were the responses. Output supernatants from the jar test experiments were characterized for each model run (Table 3). Some of the runs presented response values without significant percentages of removal (less than 0.5%) and, as such, were not considered. These results can be explained by the high pH effect (in Runs 7, 9, and 14) and the absence of coagulant dosage (Run 16). The summary of run factors provided by the model’s output and responses obtained from the analysis of the supernatants are presented in Table 3.

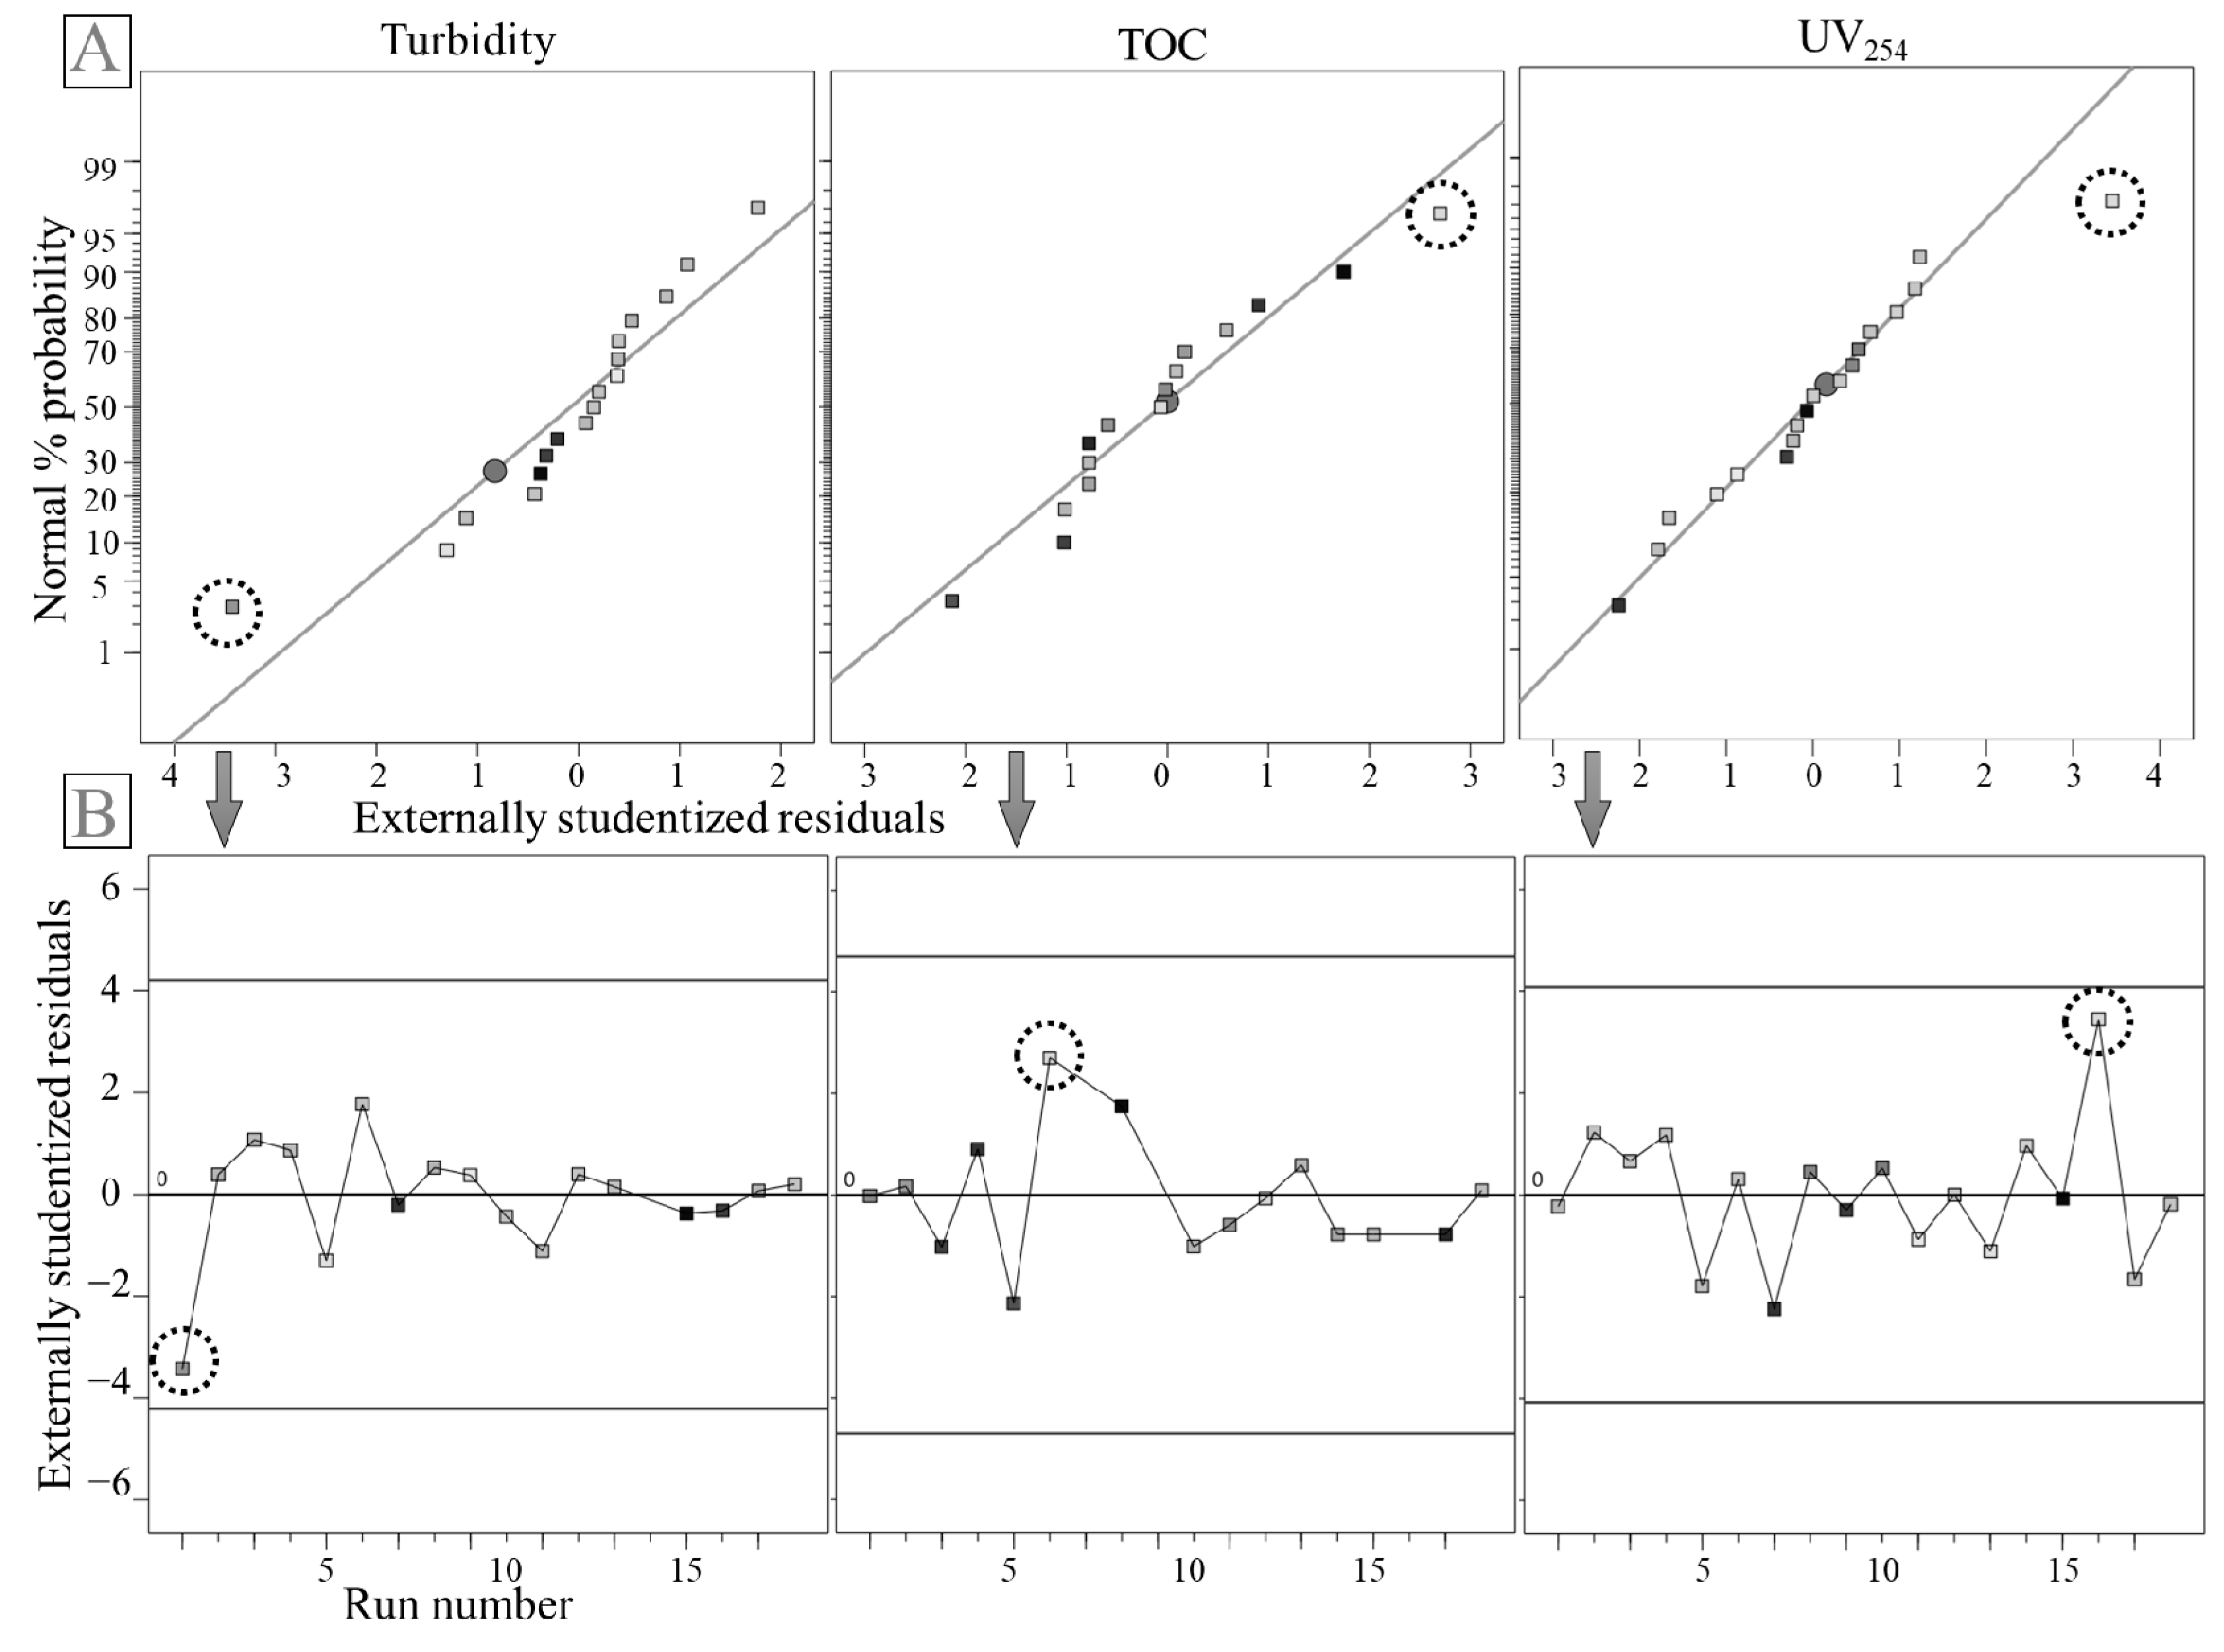
3.1.1. Model Analysis and Diagnosis

In this section, the results from model fitting and process analyses are presented. For three responses, statistics provided by ANOVA exhibited that model terms were significant (p-value < 0.05). Models did not exhibit lack of fit (p-value > 0.05), thus, indicating a significant level of confidence (lack of fit was not significant relative to the pure error). Therefore, the normal plot of residuals did not show significant deviations with respect to the linear distribution (Figure 3A). Points which differed from a linear distribution were checked and significant relevance was not detected (Figure 3B).
The coded equation can be used to predict responses for a given level of each factor and to identify the relative impact of the factors by comparing the factor coefficients. In addition, it is useful to know what the most relevant factor for each response is (A, B, AB, A2, and B2) and which of these are significant model terms. In that sense, the quadratic equations suggest that the coagulant dose represents the highest influence factor for turbidity and UV254 removal (Table 4).
To evaluate the model, the standard error (SE) was plotted in the fraction of design space using an fraction of design space (FDS) graph, thus, providing information about the maximum predictor variability of any given factor of the total space represented by the model [47]. In our case, 80 percent of the RSM design falls at or below 0.44 units of SE (see Figure 4A). The representation of SE in our RSM is useful in order to determine its prediction power. In this case, the model is less affected by intermediate values of pH and coagulant dose (Figure 4B) because the CCD is a design composed of six center points, and therefore more robust in the middle of the represented space. However, in the corners, close to our design limits, the model is affected by the lack of predictability, i.e., regions where the response cannot be predicted as precisely.

3.1.2. Model Optimization

Having evaluated the accuracy and robustness of the performed models, the next step was to optimize the coagulation and to generate predictive models for our three responses, i.e., turbidity, TOC, and UV254 removal as a function of two factors, i.e., pH and coagulant dose.
The numerical optimization is presented through the two-dimensional (2D) and three-dimensional (3D) surface plots shown in Figure 5. As a general trend, best removals were obtained at a lower pH for the three responses.
For turbidity removal, the acceptable range (≥60%) was at a medium coagulant dose and all ranges of pH, (see Figure 5A). At neutral pH values and a high coagulant dose, TOC removal was higher than 30%. At a feasible DWTP, (pH varying from 7 to 8), the highest removals were obtained at pH 7 and with a medium coagulant dose (between 30 and 40 mg·L−1), i.e., 65% of turbidity, 30% of TOC, and UV254 removal. Response surface plots are presented with the ranges fixed by model runs (0–50 mg·L−1) for coagulant dose and 4.5–9.5 for pH, (see Table 3) in order to observe the full gradient through the whole response surface.
Subsequently, the model was numerically optimized with the aim of determining a common surface response in order to achieve satisfactory levels of removal for the three aforementioned responses. The optimization criteria were fixed by evaluating the minimum and maximum removals per run and response (see Table 3). For turbidity, the minimum removal was 47.1% and the maximum 77.5%, for TOC 6.8% and 36.3%, and for UV254 1.2% and 49.3%. The suitable low range was calculated following Equation (6), thus, ensuring, at least, the mid-upper percentage of removal in the obtained response range. The upper range of response removal was the maximum obtained after the jar test experiments (Table 3). Hence, selected ranges were superposed in a common surface, and the overlay graph was obtained (Figure 6). In Figure 6, the area shaded grey illustrates the surface area where the optimization criteria were achieved: 62.3–77.5% removal for turbidity, 21.55–36.3% for TOC, and 25.25–49.3% for UV254. As in the discussion above, pH 7 was determined to be the best value for a feasible level in a real DWTP operation. For the model developed here, the yellow circle (pH = 7 and coagulant dose = 40 mg·L−1) represents the optimized proposal for coagulation.
The results obtained by the model (the yellow circle) were compared with those from the real DWTP operation (the blue circle). For the real DWTP, the sampling campaign using the jar test took place in April 2019. The values were calculated from April’s monthly average, with a pH result of 7.8 and coagulant dose of 21.9 mg·L−1. The improvements obtained in terms of coagulation removals (Equation (7)) were +4% for turbidity, +33% for TOC, and +28% for UV254 removal as compared with the DWTP’s monthly operation mean. The lower impact on turbidity removal is fundamentally because of the low turbidity value of the influent water. However, it has been demonstrated that coagulants do increase the amount of turbidity removal with high turbid waters (as a consequence of more particulate NOM fraction), and their capacity for turbidity removal is likewise reduced in low turbidity waters [48,49].
Low   Range   ( % ) = Response max   Response min 2 + Response min
Removal   increase   ( % ) = Response RSM   Response DWTP Response RSM × 100

3.2. Knowledge-Based Rules for Coupled Enhanced Coagulation—Membrane Filtration

In this section, the results from the enhanced coagulation coupled to UF experiments are presented. After evaluating the supernatants obtained in the jar test experiments, runs 8 and 17 were chosen for continuous UF assays (Table 3). The election criteria followed the highest removal values for three responses (49.7%, Run 8) and the best run in a feasible operation at the DWTP (pH = 7, Run 17). Although Run 15 had high values, it was not selected because it was outside the initial model boundaries.
Permeability evolution over time was monitored. The reduction of permeability was related to fouling properties [50]. The results shown during the dry period (Figure 7A) revealed that the decrease in permeability was higher in the DWTP sample than Runs 8 and 17, although the initial value being the largest. The UF membrane with the DWTP sample was the most fouled and experienced a 30% permeability loss. A comparison of these results with the after-flood (AF) event experiment (Figure 7B) seems to indicate that there is no apparent relationship. After the flood, Run 17 presented the most fouled sample, with a decrease in permeability of over 40%.
To understand these behaviors, the chemical parameters values (Table 5) had to be checked to comprehend the permeability decreases. As we expected, the waters from the AF event had more organic charge, reflected by the increase of turbidity and the UV254 values in the raw water samples collected. However, this trend was not observed for TOC. This can be explained by the fact that TOC content in large mass waters such as lakes or reservoirs is not related to precipitation or runoff [51].
The results for samples with higher permeability loss are well associated with high values of UV254. These results are in accordance with previous studies [52], supporting that UF membranes working with waters with a high level of aromatic compounds have a greater capacity to retain compounds associated with UV254 than those corresponding to the TOC fraction. The UV254 NOM fraction cannot pass through the membrane, consequently causing fouling and decreasing permeability capabilities.

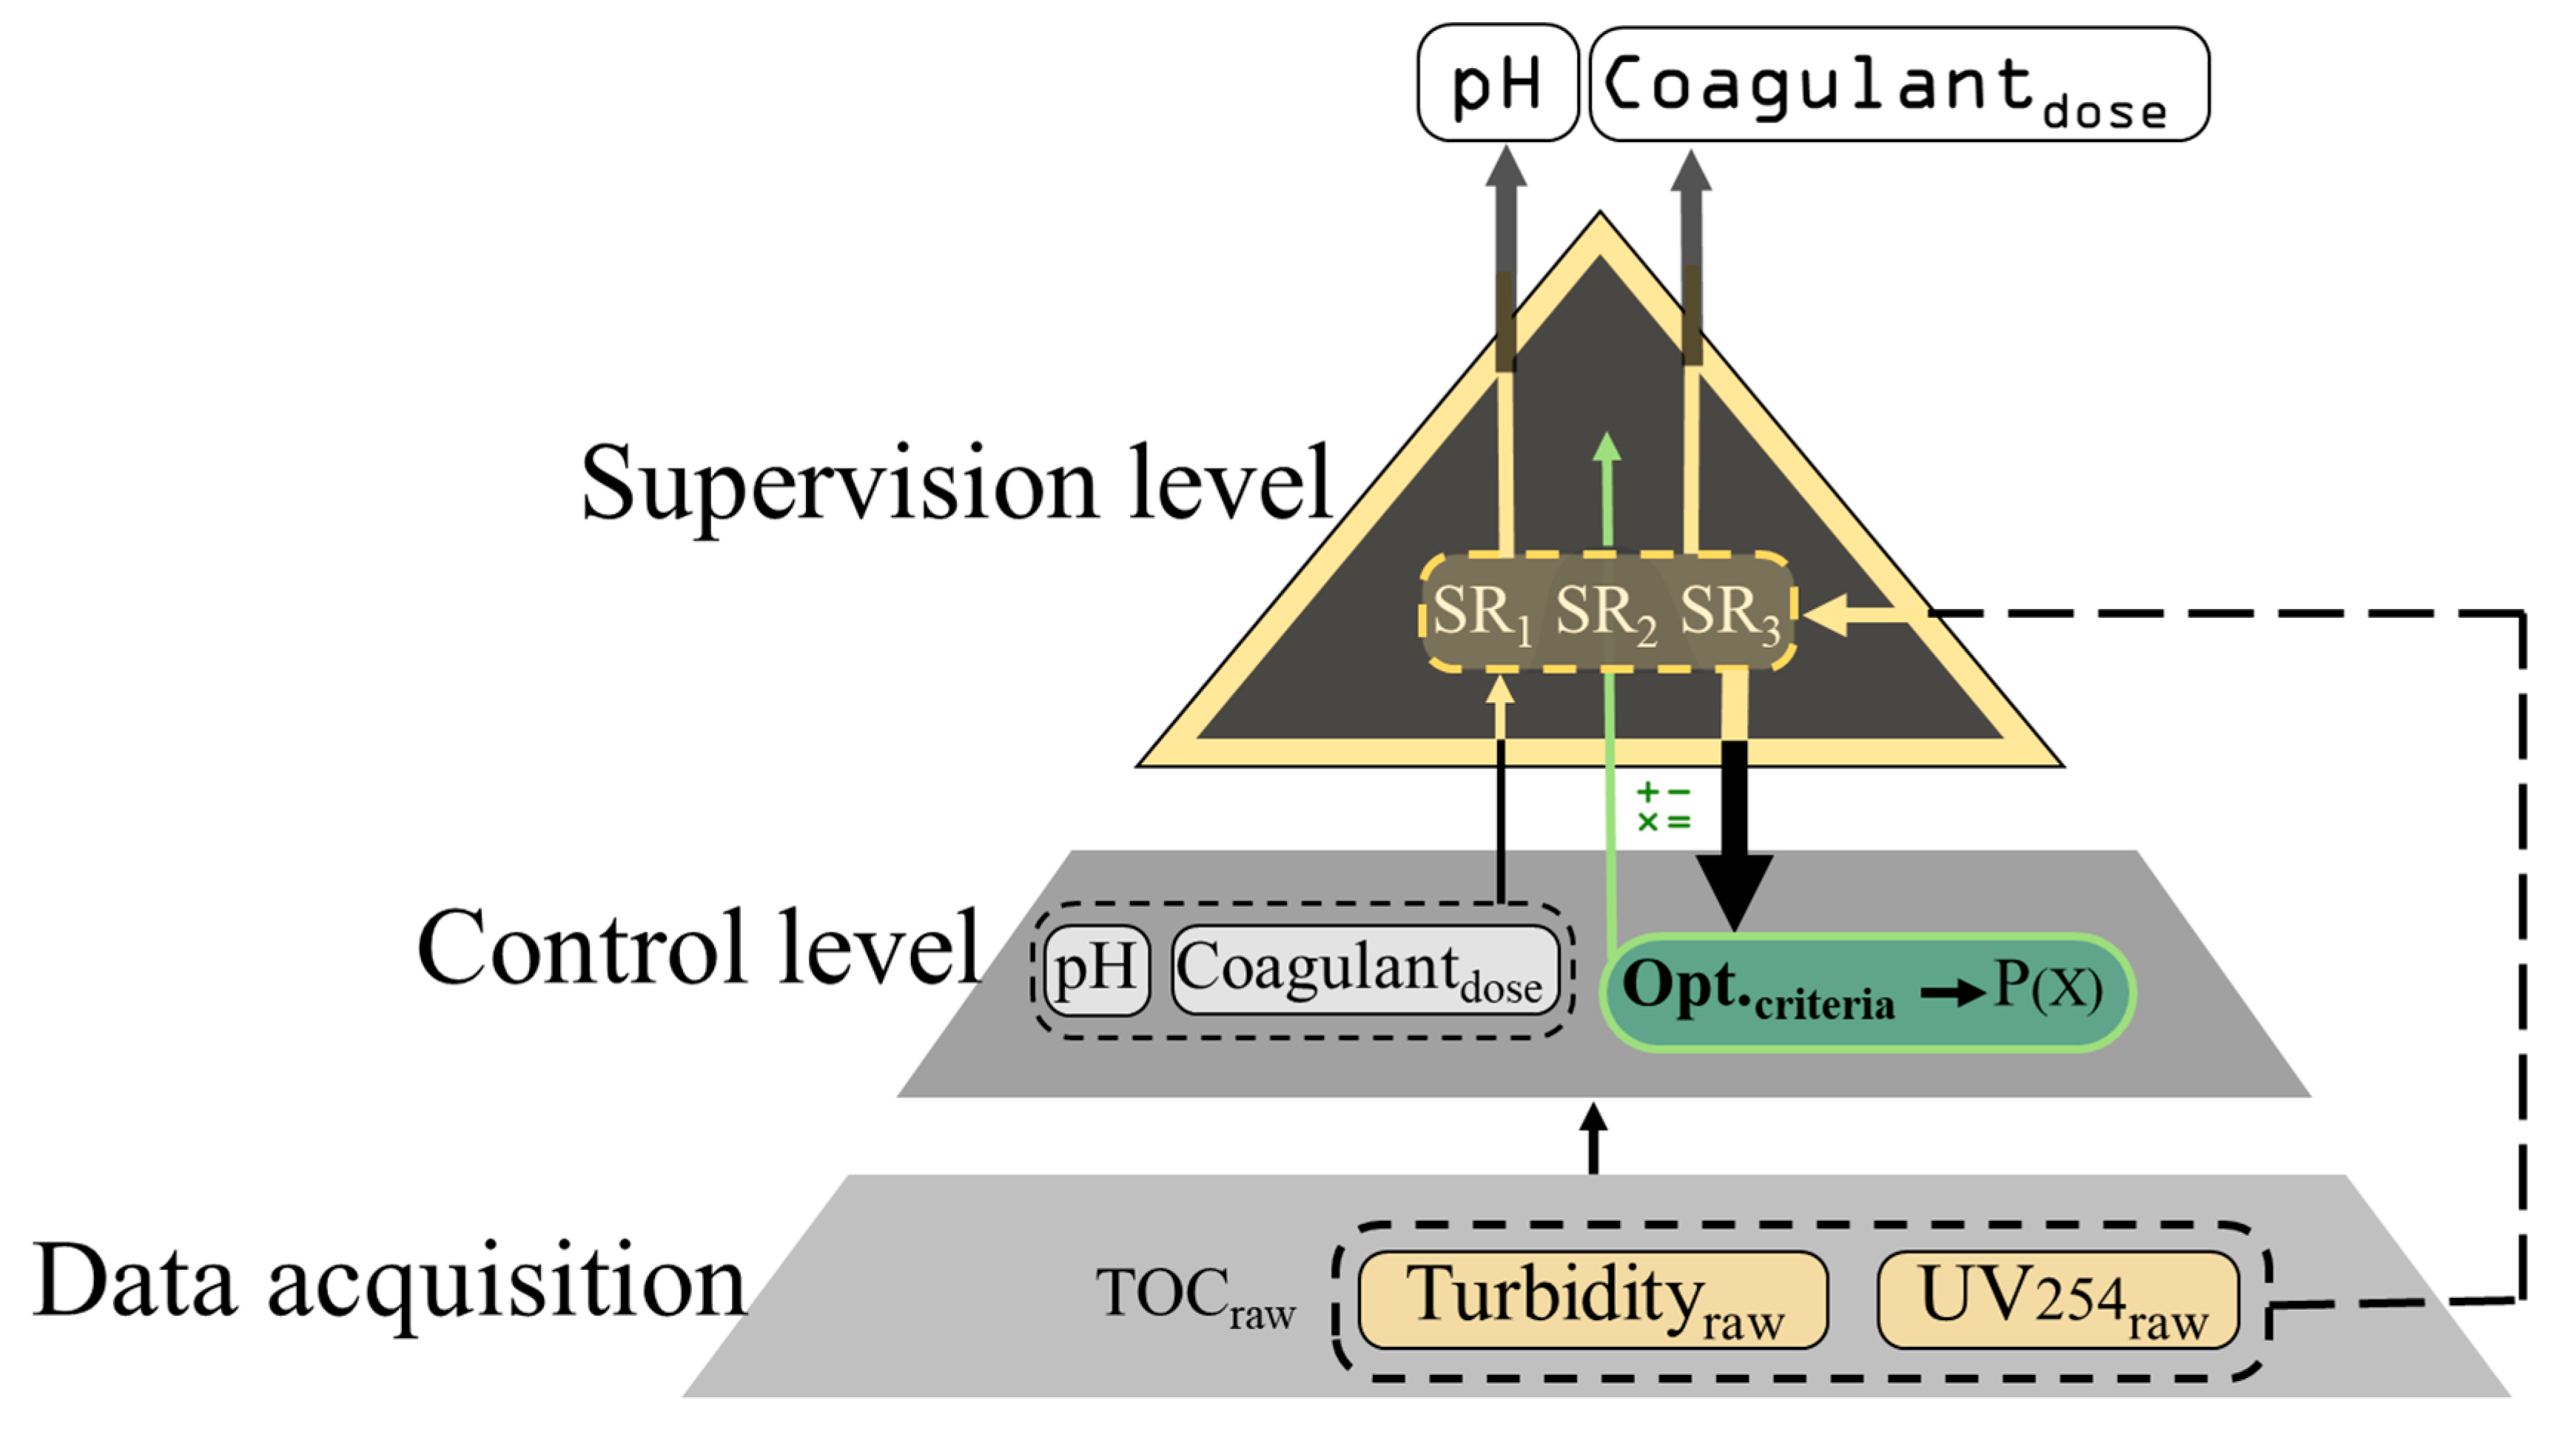
3.3. EDSS Operational Architecture

The information and knowledge acquired in this study allowed us to establish a hierarchical structure and to configure the EDSS. In the following, each EDSS level, as well as the decision tree proposed for the supervision level are described (and summarized in Figure 8) as follows:
Data acquisition level: Data dumped directly from DWTP databases provide the input for the control and supervisory levels. The values used in the algorithms correspond to instantaneous readings from online sensors and analyzers coupled with laboratory analytics.
Control level: Coagulation at the Montfullà DWTP is controlled by fixing the coagulant dose (PACDose) and the pH set point at the clarifiers (pHclar). The three parameters related to NOM content that were studied were considered for the EDSS design.
In terms of the influence raw water quality has on NOM content, several raw water quality parameters such as turbidity, TOC, and UV254 can be monitored. For operational parameters, pH and coagulant dose are the main variables that can be modified in order to optimize coagulation. Influent water quality accounts for the principal environmental conditions which, apart from the seasonal variations, also depends on the depth from which raw water is taken from the reservoir (different catchment heights can be selected) [53]. In order to include these fluctuations, it is important to complete the EDSS with updated versions that include all this variability.
The model acts by recognizing the typology of influent water when it receives the three input variables (turbidity, TOC, and UV254), and then considers all this information to propose an optimized pH and coagulant dose for coagulation optimization. Based on model described in Section 3.1, the EDSS was designed to propose operational consigns to ensure at least 62%, 21%, and 25% removal for turbidity, TOC, and UV254, respectively.
Supervision level: At the top hierarchical level of the EDSS, the expert knowledge and reasoning is incorporated and supervises the control actions module. The supervision rules developed to specify some process operation factors are also introduced at this stage. The main task of this level is to ensure NOM enhanced coagulation (adjusting pH and coagulant dose) under some active operational DWTP management considerations. Supervision rules (SR) were established to build this EDSS, i.e., SR1 is related to UV254, SR2 to cost-environmental assessment (coagulant dose), and SR3 in case of flood events and are described as follows:
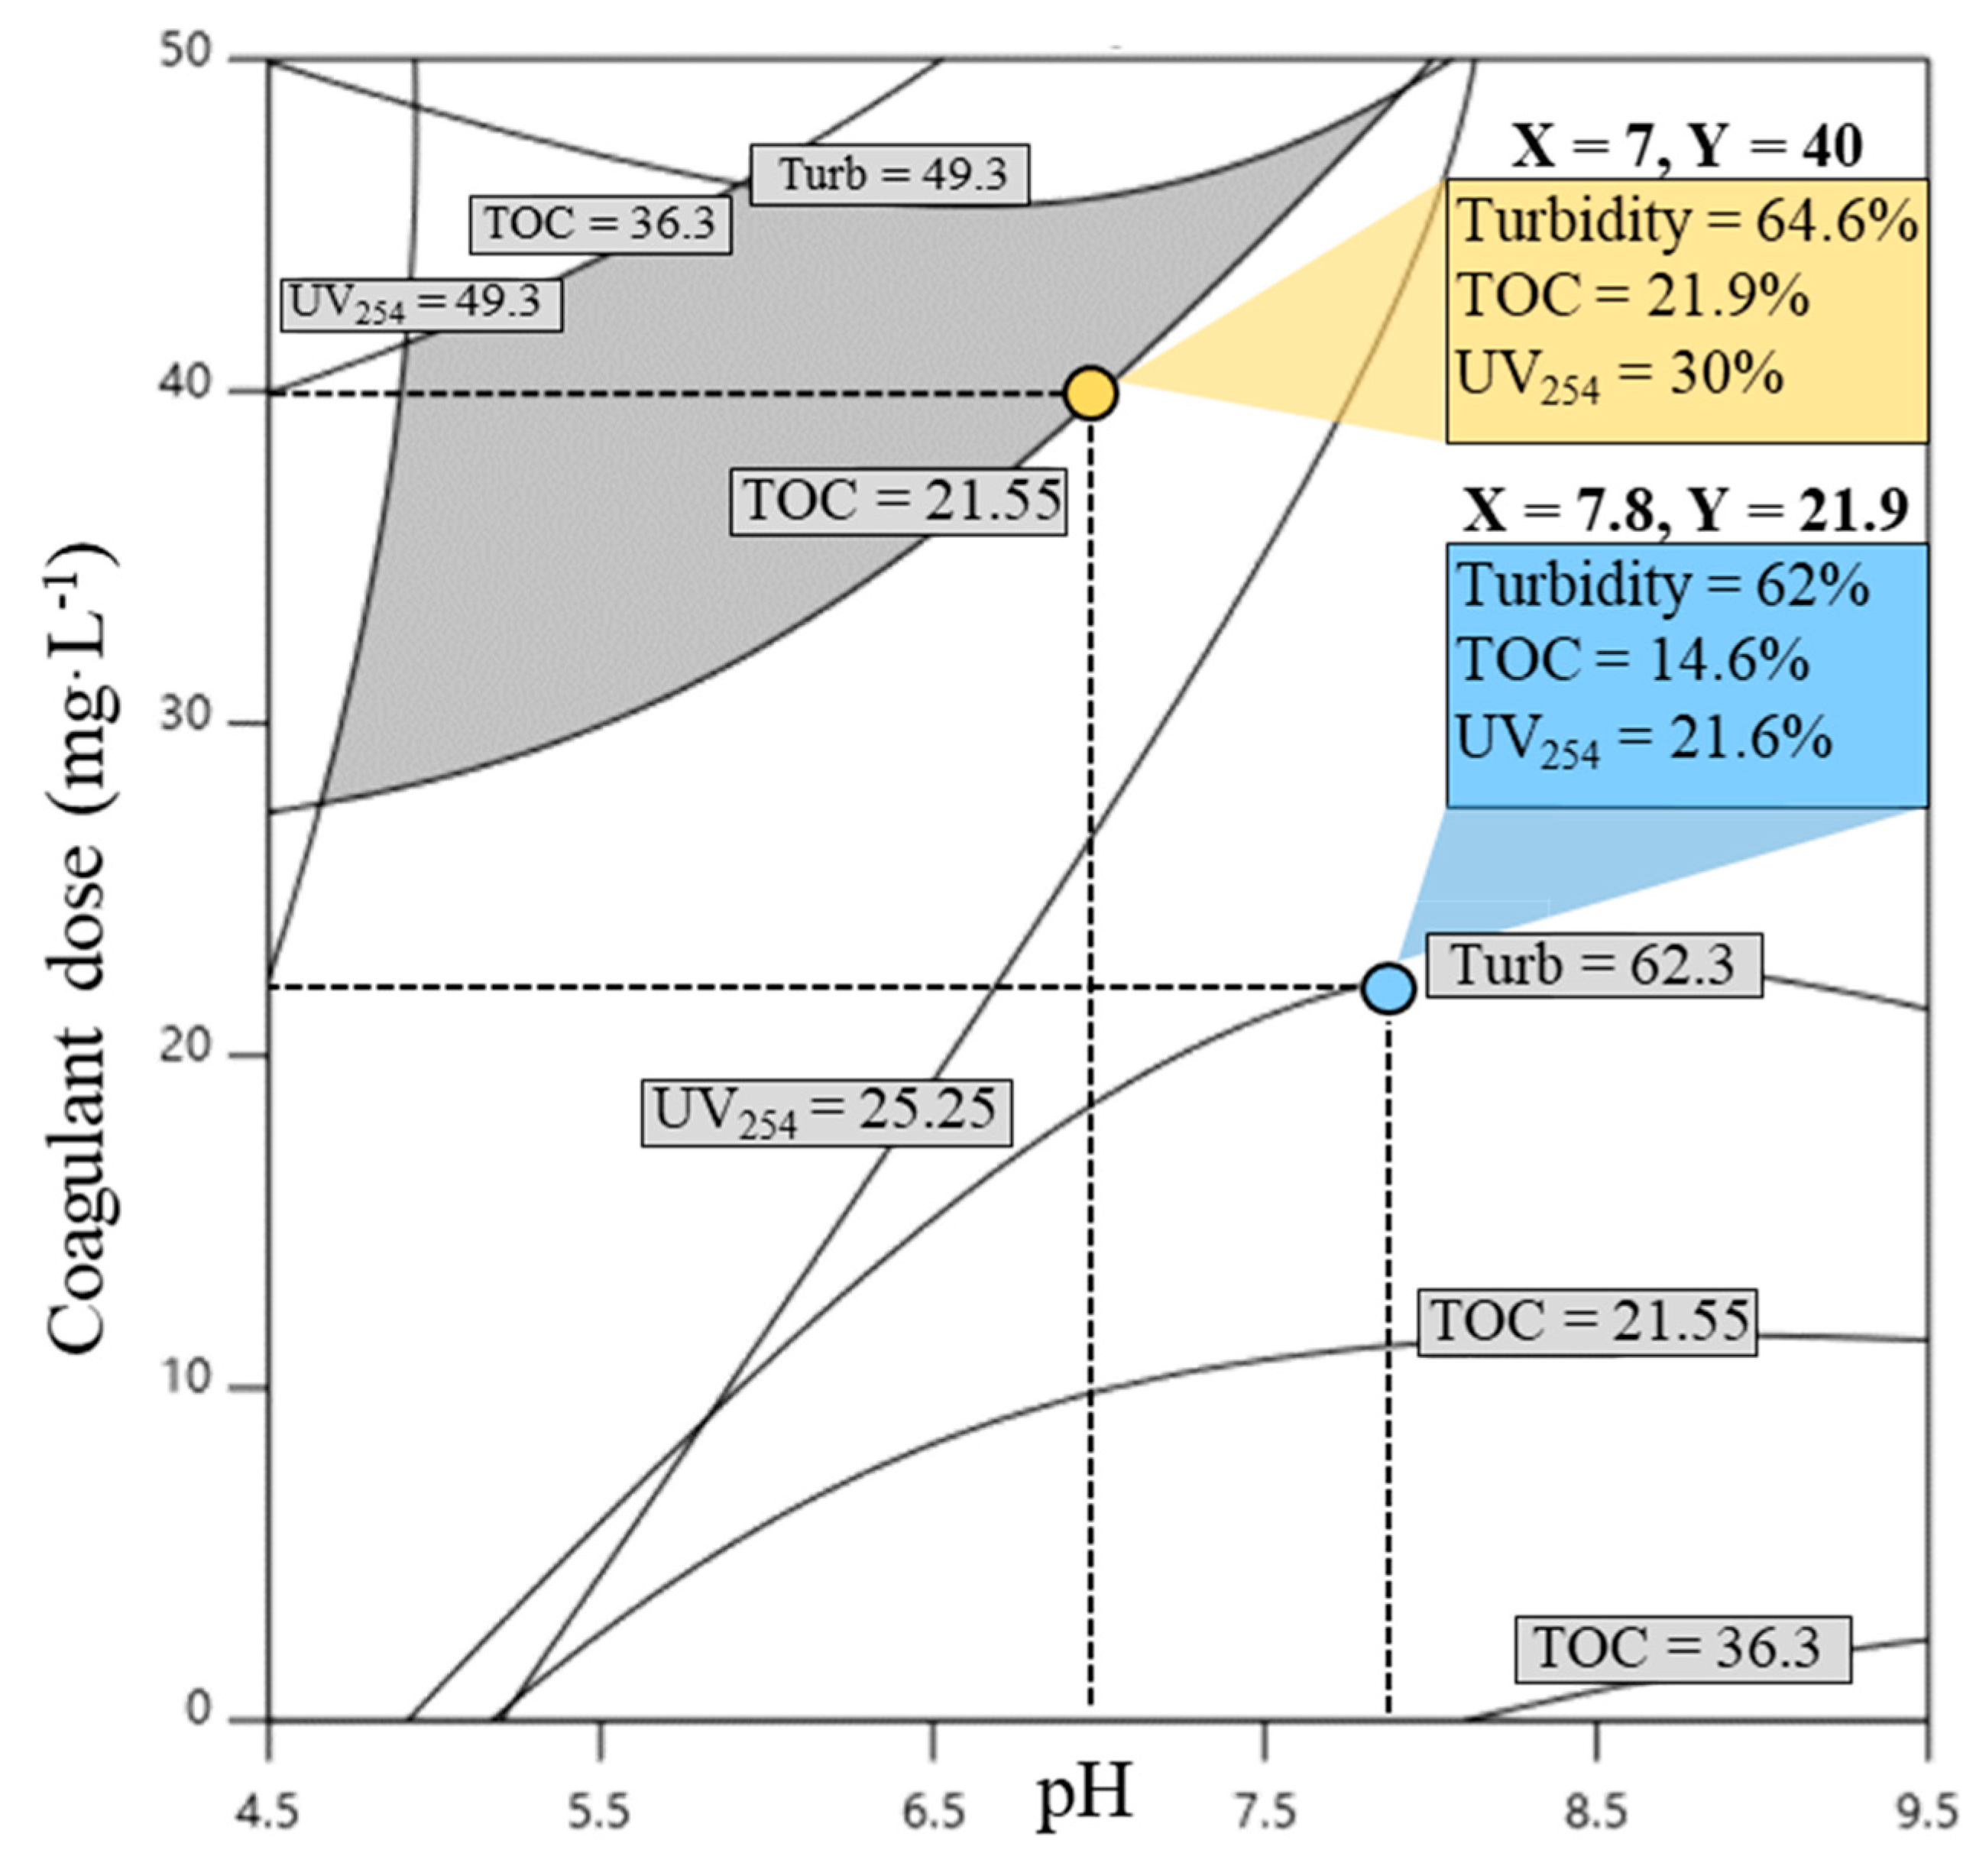
  • SR1 intensifies the enhanced coagulation (pH and dose of coagulant) to achieve 50% UV254 removal (modify RSM optimization criteria) to ensure a high quality post-coagulated water prior to filtration. This SR works when an influent UV254RAW value is higher than 0.1 cm−1 so as to avoid sand filters pore blocking and increase their useful life. SR1 acts with a fixed optimum pH = 7 and modifies the coagulant dose of the control level optimization criteria (Figure 9). In addition, this SR decreases the costs associated with sand filters and CAG replacement (>50% of DWTP total annual costs).
  • SR2 is related to economic cost of the PAC, in cases with high proposed coagulant dose >40 mg·L−1. In these cases, the priority is to adjust the pH instead of surpassing a coagulant dosage of 40 mg·L−1 (Figure 9). Polyaluminum coagulants are more expensive than other alum-based coagulants [49] and for this reason, and also to reduce the formation of chemical sludge, SR2 is important for managing tasks and indirectly contributes to generating lower impact from an environmental viewpoint.
  • SR3 is designed to be activated when facing flood events. When the TurbidityRAW is >10 NTU, the percentage of turbidity removal is automatically increased to 75%. As with SR1, the intervention of this SR occurs at the optimization criteria of enhanced coagulation control level, readjusting the coagulant dose to ensure the required quality (Figure 9). Ensuring this percentage of removal in cases where turbidity is high is crucial for plant managers, because turbidity is considered to be the most critical factor in the performance of filtration-based treatments (sand filters and CAG).

4. Conclusions

The study presents the development of an enhanced coagulation EDSS for drinking water production, with the aim to support daily decision making. To accomplish this, the EDSS was structured onto a three-level hierarchical architecture, i.e., data acquisition, control, and supervision. Regarding the control level, the model developed for coagulation is designed based on RSM and proposes the optimum pH and coagulant dosage under specific removal quality requirements (optimization criteria). Under normal conditions, the model is designed to achieve 62%, 21%, and 25% removal for turbidity, TOC, and UV254, respectively, thus, helping to reduce the risk of DBP formation. Membrane fouling indicators and expert knowledge allowed us to establish supervision rules to set up the top of the hierarchical architecture. Hence, the supervision level merges operational performance and expert decision-making knowledge. Three supervision rules (SR1, SR2, and SR3) have been created to work as a feed-back supervisory system to readjust the RSM criteria for an integrated control. These SR’s are designed to intensify treatment by modifying coagulant doses in the case of detecting high influent water values of turbidity and UV254, and readjusting pH when the proposed coagulant dose is above the maximum desired value.
The EDSS designed offers an innovative approach in terms of NOM tracking and implementing data/knowledge inside the enhanced coagulation EDSS to assess drinking water production. Because of the capacity to feed the EDSS with the online data acquired from the abovementioned full-scale DWTP facility, the final goal is to implement it as an open-loop system in the plant itself.

Author Contributions

Conceptualization, J.S., H.M., and L.G.-P.; data curation, J.S. and M.V. (Marta Verdaguer); formal analysis, J.S., L.G.-P., and M.J.M.; investigation, J.S. and H.M.; methodology, J.S., H.M., M.J.M., and M.V. (Meritxell Valentí); project administration, H.M., M.J.M., and M.P.; resources, H.M., M.J.M., and M.P.; software, J.S., M.J.M., and M.V. (Meritxell Valentí); validation H.M., M.J.M., and M.P.; visualization, J.S., L.G.-P., and H.M.; writing—original draft preparation, J.S.; writing—review and editing H.M., L.G.-P., and M.P. All authors have read and agreed to the published version of the manuscript.

Funding

This research was funded by Ministerio de Economía, Industria y Competitividad, Gobierno de España: Retos de la Sociedad Project (CTM2017-83598-R). In addition, this study was supported by the University of Girona with PhD student grants IFUdG2017-30 and IFUdG2018-69.

Acknowledgments

All authors would like to thank Aigües de Girona, Salt i Sarrià de Ter, Ens d’Abastament d’Aigües Ter-Llobregat (ATL) and especially Fernando Valero and Pere Emiliano from the ATL R&D department, for their cooperation and implication during this study.

Conflicts of Interest

The authors declare no conflict of interest.

References

  1. Arheimer, B.; Andréasson, J.; Fogelberg, S.; Johnsson, H.; Pers, C.B.; Persson, K. Climate change impact on water quality: Model results from southern Sweden. Ambio 2005, 34, 559–566. [Google Scholar] [CrossRef]
  2. Delpla, I.; Jung, A.V.; Baures, E.; Clement, M.; Thomas, O. Impacts of climate change on surface water quality in relation to drinking water production. Environ. Int. 2009, 35, 1225–1233. [Google Scholar] [CrossRef] [PubMed]
  3. Hejzlar, J.; Dubrovský, M.; Buchtele, J.; Růžička, M. The apparent and potential effects of climate change on the inferred concentration of dissolved organic matter in a temperate stream (the Malše River, South Bohemia). Sci. Total Environ. 2003, 310, 143–152. [Google Scholar] [CrossRef]
  4. Kampioti, A.A.; Stephanou, E.G. The impact of bromide on the formation of neutral and acidic disinfection by-products (DBPs) in Mediterranean chlorinated drinking water. Water Res. 2002, 36, 2596–2606. [Google Scholar] [CrossRef]
  5. Sorlini, S.; Rondi, L.; Gomez, A.P.; Collivignarelli, C. Appropriate technologies for drinking water treatment in Mediterranean countries. Environ. Eng. Manag. J. 2015, 14, 1721–1733. [Google Scholar] [CrossRef]
  6. Matilainen, A.; Vepsäläinen, M.; Sillanpää, M. Natural organic matter removal by coagulation during drinking water treatment: A review. Adv. Colloid Interface Sci. 2010, 159, 189–197. [Google Scholar] [CrossRef] [PubMed]
  7. Raseman, W.J.; Kasprzyk, J.R.; Rosario-Ortiz, F.L.; Stewart, J.R.; Livneh, B. Emerging investigators series: A critical review of decision support systems for water treatment: Making the case for incorporating climate change and climate extremes. Environ. Sci. Water Res. Technol. 2017, 3, 18–36. [Google Scholar] [CrossRef]
  8. 140/2003 Royal Decree 140/2003 of 7th February, Sanitary Criteria for the Quality of Water for Human Consumption; Ministerio de Asuntos Exteriores y de Cooperación: Madrid, Spain, 2003.
  9. Crozes, G.; White, P.; Marshall, M. Enhanced coagulation: Its effect on NOM removal and chemical costs. J. Am. Water Work. Assoc. 1995, 87, 78–89. [Google Scholar] [CrossRef]
  10. Liang, L.; Singer, P.C. Factors influencing the formation and relative distribution of haloacetic acids and trihalomethanes in drinking water. Environ. Sci. Technol. 2003, 37, 2920–2928. [Google Scholar] [CrossRef]
  11. Wang, X.; Zhang, H.; Zhang, Y.; Shi, Q.; Wang, J.; Yu, J.; Yang, M. New insights into trihalomethane and haloacetic acid formation potentials: Correlation with the molecular composition of natural organic matter in source water. Environ. Sci. Technol. 2017, 51, 2015–2021. [Google Scholar] [CrossRef]
  12. Godo-Pla, L.; Rodríguez, J.J.; Suquet, J.; Emiliano, P.; Valero, F.; Poch, M.; Monclús, H. Control of primary disinfection in a drinking water treatment plant based on a fuzzy inference system. Process Saf. Environ. Prot. 2020, in press. [Google Scholar] [CrossRef]
  13. Sanchez, N.P.; Skeriotis, A.T.; Miller, C.M. Assessment of dissolved organic matter fluorescence PARAFAC components before and after coagulation-filtration in a full scale water treatment plant. Water Res. 2013, 47, 1679–1690. [Google Scholar] [CrossRef] [PubMed]
  14. Volk, C.; Bell, K.; Ibrahim, E.; Verges, D.; Amy, G.; Lechevallier, M. Impact of enhanced and optimized coagulation on removal of organic matter and its biodegradable fraction in drinking water. Water Res. 2000, 34, 3247–3257. [Google Scholar] [CrossRef]
  15. Sharp, E.L.; Parsons, S.A.; Jefferson, B. The impact of seasonal variations in DOC arising from a moorland peat catchment on coagulation with iron and aluminium salts. Environ. Pollut. 2006, 140, 436–443. [Google Scholar] [CrossRef]
  16. Krzeminski, P.; Vogelsang, C.; Meyn, T.; Köhler, S.J.; Poutanen, H.; de Wit, H.A.; Uhl, W. Natural organic matter fractions and their removal in full-scale drinking water treatment under cold climate conditions in Nordic capitals. J. Environ. Manag. 2019, 241, 427–438. [Google Scholar] [CrossRef]
  17. Schulz, M.; Bünting, S.; Ernst, M. Impact of powdered activated carbon structural properties on removal of organic foulants in combined adsorption-ultrafiltration. Water 2017, 9, 580. [Google Scholar] [CrossRef] [Green Version]
  18. Fiksdal, L.; Leiknes, T.O. The effect of coagulation with MF/UF membrane filtration for the removal of virus in drinking water. J. Memb. Sci. 2006, 279, 364–371. [Google Scholar] [CrossRef]
  19. Liu, B.; Qu, F.; Guo, S.; Yu, H.; Li, G.; Liang, H.; Van der Bruggen, B. A pilot study of the sludge recycling enhanced coagulation-ultrafiltration process for drinking water: The effects of sludge recycling ratio and coagulation stirring strategy. Water 2017, 9, 183. [Google Scholar] [CrossRef] [Green Version]
  20. Meng, S.; Zhang, M.; Yao, M.; Qiu, Z.; Hong, Y.; Lan, W.; Xia, H.; Jin, X. Membrane fouling and performance of flat ceramic membranes in the application of drinking water purification. Water 2019, 11, 2606. [Google Scholar] [CrossRef] [Green Version]
  21. Sillanpää, M. Natural Organic Matter in Water: Characterization and Treatment Methods; Elsevier: Oxford, UK, 2015; ISBN 9780128017197. [Google Scholar]
  22. Pollice, A.; Brookes, A.; Jefferson, B.; Judd, S. Sub-critical flux fouling in membrane bioreactors—A review of recent literature. Desalination 2004, 174, 221–230. [Google Scholar] [CrossRef]
  23. Zularisam, A.W.; Ismail, A.F.; Salim, R. Behaviours of natural organic matter in membrane filtration for surface water treatment—A review. Desalination 2006, 194, 211–231. [Google Scholar] [CrossRef] [Green Version]
  24. Bu, F.; Gao, B.; Yue, Q.; Liu, C.; Wang, W.; Shen, X. The combination of coagulation and adsorption for controlling ultra-filtration membrane fouling in water treatment. Water (Switzerland) 2019, 11, 90. [Google Scholar] [CrossRef] [Green Version]
  25. Kimura, K.; Tanaka, K.; Watanabe, Y. Microfiltration of different surface waters with/without coagulation: Clear correlations between membrane fouling and hydrophilic biopolymers. Water Res. 2014, 49, 434–443. [Google Scholar] [CrossRef] [PubMed] [Green Version]
  26. Chen, F.; Peldszus, S.; Peiris, R.H.; Ruhl, A.S.; Mehrez, R.; Jekel, M.; Legge, R.L.; Huck, P.M. Pilot-scale investigation of drinking water ultrafiltration membrane fouling rates using advanced data analysis techniques. Water Res. 2014, 48, 508–518. [Google Scholar] [CrossRef] [PubMed]
  27. Shamsuddin, N.; Das, D.B.; Starov, V.M. Filtration of natural organic matter using ultrafiltration membranes for drinking water purposes: Circular cross-flow compared with stirred dead end flow. Chem. Eng. J. 2015, 276, 331–339. [Google Scholar] [CrossRef] [Green Version]
  28. Bridgeman, J.; Bieroza, M.; Baker, A. The application of fluorescence spectroscopy to organic matter characterisation in drinking water treatment. Rev. Environ. Sci. Biotechnol. 2011, 10, 277–290. [Google Scholar] [CrossRef]
  29. Poch, M.; Cortés, U.; Comas, J.; Rodriguez-Roda, I.; Sànchez-Marrè, M. Decisions on Urban Water Systems: Some Support; Universitat de Girona publicacions: Girona, Spain, 2012; ISBN 9788484583820. [Google Scholar]
  30. Godo-Pla, L.; Emiliano, P.; Valero, F.; Poch, M.; Sin, G.; Monclús, H. Predicting the oxidant demand in full-scale drinking water treatment using an artificial neural network: Uncertainty and sensitivity analysis. Process Saf. Environ. Prot. 2019, 125, 317–327. [Google Scholar] [CrossRef]
  31. Godo-pla, L.; Emiliano, P.; González, S.; Poch, M.; Valero, F.; Monclús, H. Implementation of an environmental decision support system for controlling the pre-oxidation step at a full-scale drinking water treatment plant. Water Sci. Technol. 2020. [Google Scholar] [CrossRef] [Green Version]
  32. Poch, M.; Comas, J.; Rodríguez-Roda, I.; Sànchez-Marrè, M.; Cortés, U. Designing and building real environmental decision support systems. Environ. Model. Softw. 2004, 19, 857–873. [Google Scholar] [CrossRef]
  33. Ferrero, G.; Monclús, H.; Sancho, L.; Garrido, J.M.; Comas, J.; Rodríguez-Roda, I. A knowledge-based control system for air-scour optimisation in membrane bioreactors. Water Sci. Technol. 2011, 63, 2025–2031. [Google Scholar] [CrossRef]
  34. Crittenden, J.C.; Trussell, R.; Hand, D.W.; Howe, K.J.; Tchobanoglous, G. MWH’s Water Treatment; John Wiley & Sons, Inc.: Hoboken, NJ, USA, 2012. [Google Scholar]
  35. Zainal-Abideen, M.; Aris, A.; Yusof, F.; Abdul-Majid, Z.; Selamat, A.; Omar, S.I. Optimizing the coagulation process in a drinking water treatment plant–Comparison between traditional and statistical experimental design jar tests. Water Sci. Technol. 2012, 65, 496–503. [Google Scholar] [CrossRef]
  36. Arruda, P.M.; Pereira-Filho, E.R.; Libânio, M.; Fagnani, E. Response surface methodology applied to tropical freshwater treatment. Environ. Technol. 2018, 1–11. [Google Scholar] [CrossRef]
  37. Ghafari, S.; Abdul, H.; Hasnain, M.; Akbar, A. Application of response surface methodology (RSM) to optimize coagulation—Flocculation treatment of leachate using poly-aluminum chloride (PAC) and alum. J. Hazard. Mater. 2009, 163, 650–656. [Google Scholar] [CrossRef] [PubMed]
  38. Li, N.; Hu, Y.; Lu, Y.Z.; Zeng, R.J.; Sheng, G.P. Multiple response optimization of the coagulation process for upgrading the quality of effluent from municipal wastewater treatment plant. Sci. Rep. 2016, 6, 1–13. [Google Scholar] [CrossRef] [PubMed]
  39. Liu, Z.; Wei, H.; Li, A.; Yang, H. Enhanced coagulation of low-turbidity micro-polluted surface water: Properties and optimization. J. Environ. Manage. 2019, 233, 739–747. [Google Scholar] [CrossRef] [PubMed]
  40. Espadaler, I.; Caixach, J.; Om, J.; Ventura, F.; Cortina, M.; Pauné, F.; Rivera, J. Identification of organic pollutants in Ter river and its system of reservoirs supplying water to Barcelona (Catalonia, Spain): A study by GC/MS and FAB/MS. Water Res. 1997, 31, 1996–2004. [Google Scholar] [CrossRef]
  41. Ates, N.; Kitis, M.; Yetis, U. Formation of chlorination by-products in waters with low SUVA-correlations with SUVA and differential UV spectroscopy. Water Res. 2007, 41, 4139–4148. [Google Scholar] [CrossRef]
  42. Le Clech, P.; Jefferson, B.; Chang, I.S.; Judd, S.J. Critical flux determination by the flux-step method in a submerged membrane bioreactor. J. Memb. Sci. 2003, 227, 81–93. [Google Scholar] [CrossRef]
  43. Monclús, H.; Ferrero, G.; Buttiglieri, G.; Comas, J.; Rodriguez-Roda, I. Online monitoring of membrane fouling in submerged MBRs. Desalination 2011, 277, 414–419. [Google Scholar] [CrossRef]
  44. Romero, J.R.; Imberger, J. Effect of a flood underflow on reservoir water quality: Data and three-dimensional modeling. Arch. Hydrobiol. 2003, 157, 1–25. [Google Scholar] [CrossRef]
  45. Eaton, A.D.; Clesceri, L.S.; Greenberg, A.E. Standard Method 5910B: Ultraviolet Absorption Method, 19th ed.; American Public Health Association: Washington, DC, USA, 1995. [Google Scholar]
  46. Trinh, T.K.; Kang, L.-S. Application of response surface method as an experimental design to optimize coagulation tests. Environ. Eng. Res. 2010, 15, 63–70. [Google Scholar] [CrossRef]
  47. Anderson, M.J.; Whitcomb, P.J. Practical aspects for designing statistically optimal experiments. J. Stat. Sci. Appl. 2014, 2, 85–92. [Google Scholar]
  48. Asrafuzzaman, M.; Fakhruddin, A.N.M.; Alamgir Hossain, M. Reduction of turbidity of water using locally available natural coagulants. ISRN Microbiol. 2011, 2011, 1. [Google Scholar] [CrossRef] [PubMed] [Green Version]
  49. Pernitsky, D.J.; Edzwald, J.K. Practical paper selection of alum and polyaluminum coagulants: Principles and applications. J. Water Supply Res. Technol. 2006, 55, 121–141. [Google Scholar] [CrossRef]
  50. Lee, S.; Aurelle, Y.; Roques, H. Concentration polarization, membrane fouling and cleaning in ultrafiltration of soluble oil. J. Memb. Sci. 1984, 19, 23–38. [Google Scholar] [CrossRef]
  51. Hessen, D.O.; Gjessing, E.T.; Knulst, J.; Fjeld, E. TOC fluctuations in a humic lake as related to catchment acidification, season and climate. Biogeochemistry 1997, 36, 139–151. [Google Scholar] [CrossRef]
  52. Lowe, J.; Hossain, M.M. Application of ultrafiltration membranes for removal of humic acid from drinking water. Desalination 2008, 218, 343–354. [Google Scholar] [CrossRef]
  53. Dragon, K.; Górski, J.; Kruć, R.; Drozdzyński, D.; Grischek, T. Removal of natural organic matter and organic micropollutants during riverbank filtration in Krajkowo, Poland. Water 2018, 10, 1457. [Google Scholar] [CrossRef] [Green Version]
Figure 1. Montfullà drinking water treatment plant (DWTP) geographical location and treatment flow diagram. HRT, hydraulic retention time; H, height; V, volume.
Water 12 02115 g001
Figure 2. Membrane filtration bench scale setup.
Water 12 02115 g002
Figure 3. Normal distribution of residuals (A) and residuals per run (B).
Water 12 02115 g003
Figure 4. Model design evaluation. (A) Fraction of design space (FDS) graph; (B) Response surface standard error (SE) representation.
Water 12 02115 g004
Figure 5. (A) Two-dimensional (2D) response surface plots and (B) three-dimensional (3D) response surface plots of turbidity, total organic carbon (TOC), and UV254 removal for the model factors, coagulant dose and pH. Dotted line in 5A corresponds to pH = 7.
Water 12 02115 g005
Figure 6. Responses overlay plots for turbidity, TOC, and UV254 % of removal at the Montfullà DWTP. Regions that fit with fixed optimization criteria appear shaded in grey. The yellow circle represents optimum feasible conditions to achieve NOM enhanced coagulation and the blue circle shows real DWTP operation removals.
Water 12 02115 g006
Figure 7. Evolution of permeability during UF experiments before (A) and after (B) flood.
Water 12 02115 g007
Figure 8. Architecture proposed for enhanced coagulation environmental decision support system (EDSS).
Water 12 02115 g008
Figure 9. Decision trees for supervision level rules (SR1, SR2, and SR3).
Water 12 02115 g009
Table 1. Main characteristics of the Montfullà DWTP raw water parameters (1 January 2014–31 December 2018).
ParameterUnitsMean10th Percentile90th Percentile
QRAWm3·s−10.56 ± 0.110.430.73
TempRAW°C13.11 ± 3.0610.218.62
pHRAW-7.80 ± 0.27.58
TOCRAWmg·L−12.56 ± 0.591.873.27
TurbRAWNTU1.08 ± 2.010.431.77
Table 2. Pearson’s correlations between influent raw water characterization and coagulant dose at the Montfullà DWTP (1 January 2014–31 December 2018).
TurbidityRAWTOCRAWpHRAWClO2DOSE
Coagulant dose0.460.200.160.03
Table 3. Summary of runs, factors, and responses of the model. Raw water characterization: Turbidity = 1.41 NTU, TOC = 3.16 mg·L−1, UV254 = 0.104 cm−1.
RunFactorsResponses (% of Removal)
pHCoagulant DoseTurbidityTOCUV254 X ¯
Units (mg·L−1)(NTU)(mg·L−1)(cm−1)(%)
17255110.227.229.5
272562.210.837.836.9
372564.97.33435.4
48.54065.16.834.635.5
55.51056.3823.429.2
65.51066.61736.239.9
78.51047.1ns1.2-
85.54070.936.341.849.7
98.51055.4ns1.9-
105.54067.329.842.346.5
118.54065.510.614.430.2
1272568.41720.835.4
1372567.521.81635.1
149.525ns11.219.5-
154.52577.523.249.350
167047.6nsns-
17750.162.135.322.740
1872567.720,422.136.7
ns, not significant; % of removal < 0.5.
Table 4. Enhanced coagulation model fitting at the Montfullà DWTP.
Coded EquationN SamplesR2
Turbidity removal (%) = +64.77 − 3.35A + 4.05B * + 3.19AB + 2.02A2 − 4.2B2 *N = 170.79
TOC removal (%) = +15.86 − 3.77A * + 0.08B − 6.54AB − 0.88A2 + 5.69B2 *N = 150.89
UV254 removal (%) = +24.39 − 10.4A * + 7.06B * + 0.62AB + 3.14A2 − 2.03B2N = 180.76
A, pH, and B, coagulant real dose. * Significant factors for each response.
Table 5. Chemical analyzed parameters for each UF experiment.
FloodSampleTurbidity (NTU)TOC (mg·L−1)UV254 (cm−1)KLost
BeforeRaw water1.973.720.075ns
DWTP post C.0.853.280.04630.3
Run 81.33.150.031ns
Run 170.93.430.039ns
AfterRaw water743.60.264ns
DWTP post C.0.853.280.04619.2
Run 81.33.150.03121.5
Run 170.93.430.03942.3
ns, not significant, and KLost value < 5.

