Behavior of Water Mass Beneath the Tsushima Warm Current in the Japan Sea
by
Xiaorong Fang
1,2,*, 
Yutaka Isoda
2,
Isao Kudo
2,
Takafumi Aramaki
3,
Keiri Imai
4 and
Naoto Ebuchi
5 1
Southern Marine Science and Engineering Guangdong Laboratory (Zhuhai), Zhuhai 519082, Guangdong, China
2
Faculty of Fisheries Sciences, Hokkaido University, Hakodate 041-8611, Hokkaido, Japan
3
Center for Global Environmental Research, National Institute for Environmental Studies, Tsukuba, Ibaraki 305-8506, Japan
4
School of Fisheries Sciences, Training Ship “Oshoro-maru”, Hokkaido University, Hakodate 041-8611, Hokkaido, Japan
5
Institute of Low Temperature Science, Hokkaido University, Sapporo 060-0819, Japan
*
Author to whom correspondence should be addressed.
Water 2020, 12(8), 2184; https://doi.org/10.3390/w12082184
Submission received: 7 July 2020
/
Revised: 27 July 2020
/
Accepted: 29 July 2020
/
Published: 3 August 2020
Abstract
:To better understand the behavior of water mass beneath the Tsushima Warm Current (TWC), we use the vertical cross-sections of potential temperature, salinity and dissolved oxygen in the Japan Sea obtained by the T/V Oshoro Maru of the Hokkaido University during 8–29 June in 2011 to analyze its origins and variations. The results show that the potential temperature and salinity beneath the TWC varies little, but the dissolved oxygen varies largely with the geographical location. There are two deep water masses with different dissolved oxygen content below the TWC. One is on the coastal side with the low dissolved oxygen, and the other is on the offshore side with the high dissolved oxygen. It is inferred that the former one is relatively old water and the latter is the new water. By using the phosphate (PO4) and the apparent oxygen utilization (AOU) relationship, we calculate the PO40 (preformed PO4) as a water mass tracer. These results suggest that the water masses beneath the TWC with high and low dissolved oxygen originate from the same surface water mass in the central Japan Sea.
1. Introduction
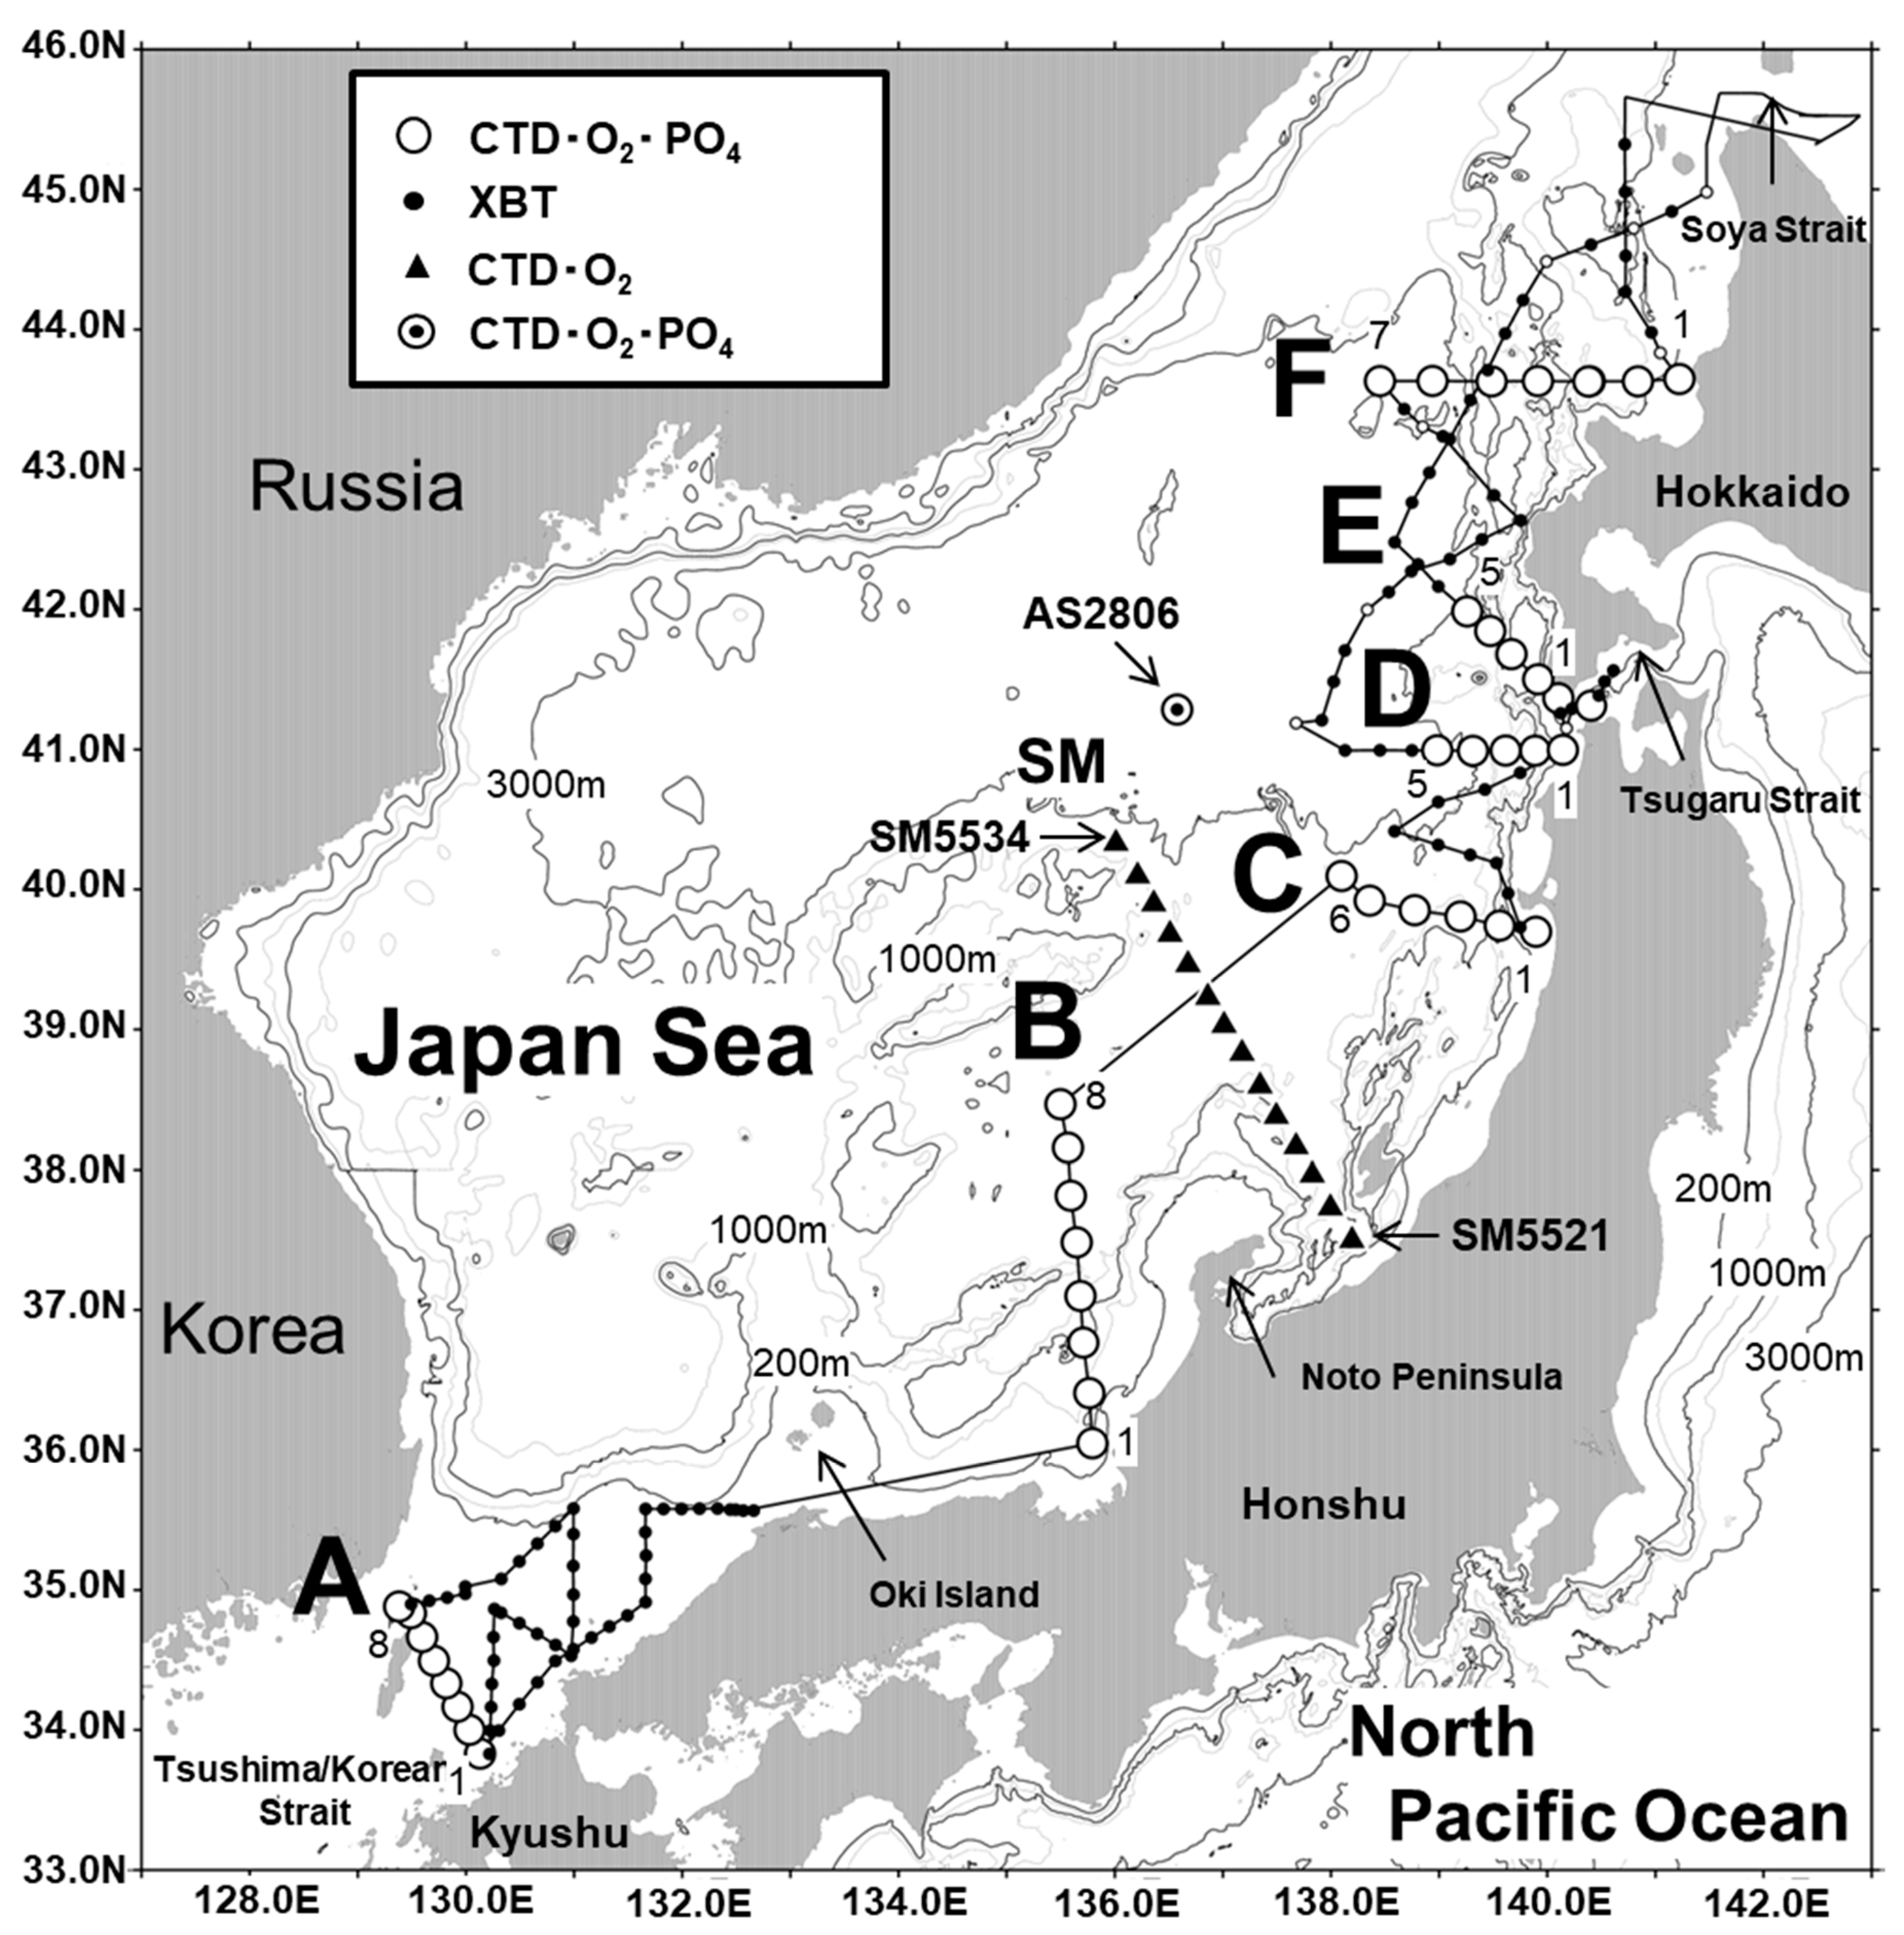
The Japan Sea is one of the marginal seas in East Asia, which can significantly impact on regional oceanic general circulation and climate equilibrium. Mixed with the seawater in the East China Sea, the high-temperature and high-salinity water originating from the Kuroshio enters the Japan Sea through the Tsushima/Korean Strait at the depth less than about 200 m. After that, this warm water of the Tsushima Warm Current (TWC) flows northeastward and its northern boundary near 40 °N is called as a polar front. Most of TWC waters flow into the North Pacific through the Tsugaru Strait shallower than 100–150 m, and the rest of them enter the Okhotsk Sea through the Soya Strait (Figure 1). As the mean depth of the Japan Sea is over 1000 m, the water in other seas (the North Pacific and the Okhotsk Sea) cannot exchange with the deep water in the Japan Sea. It is well known that the surface water in the Japan Sea is affected by strong winter cooling in the northern Japan Sea, so that the dense cold water sinks into the deep ocean through vertical convections. Therefore, the seawater in the Japan Sea at the depth of 500–3500 m has many unique characteristics, and that’s why it is named “Japan Sea Proper Water (JSPW)” [1]. The temperature and salinity of the deep seawater in the Japan Sea vary little, which range from 0 to 1 °C and from 34.06 to 34.08, respectively. In addition, the concentration of dissolved oxygen (O2) in the deep sea is more than 4.5 mL L−1, which is much higher than those in the North Pacific deep waters.
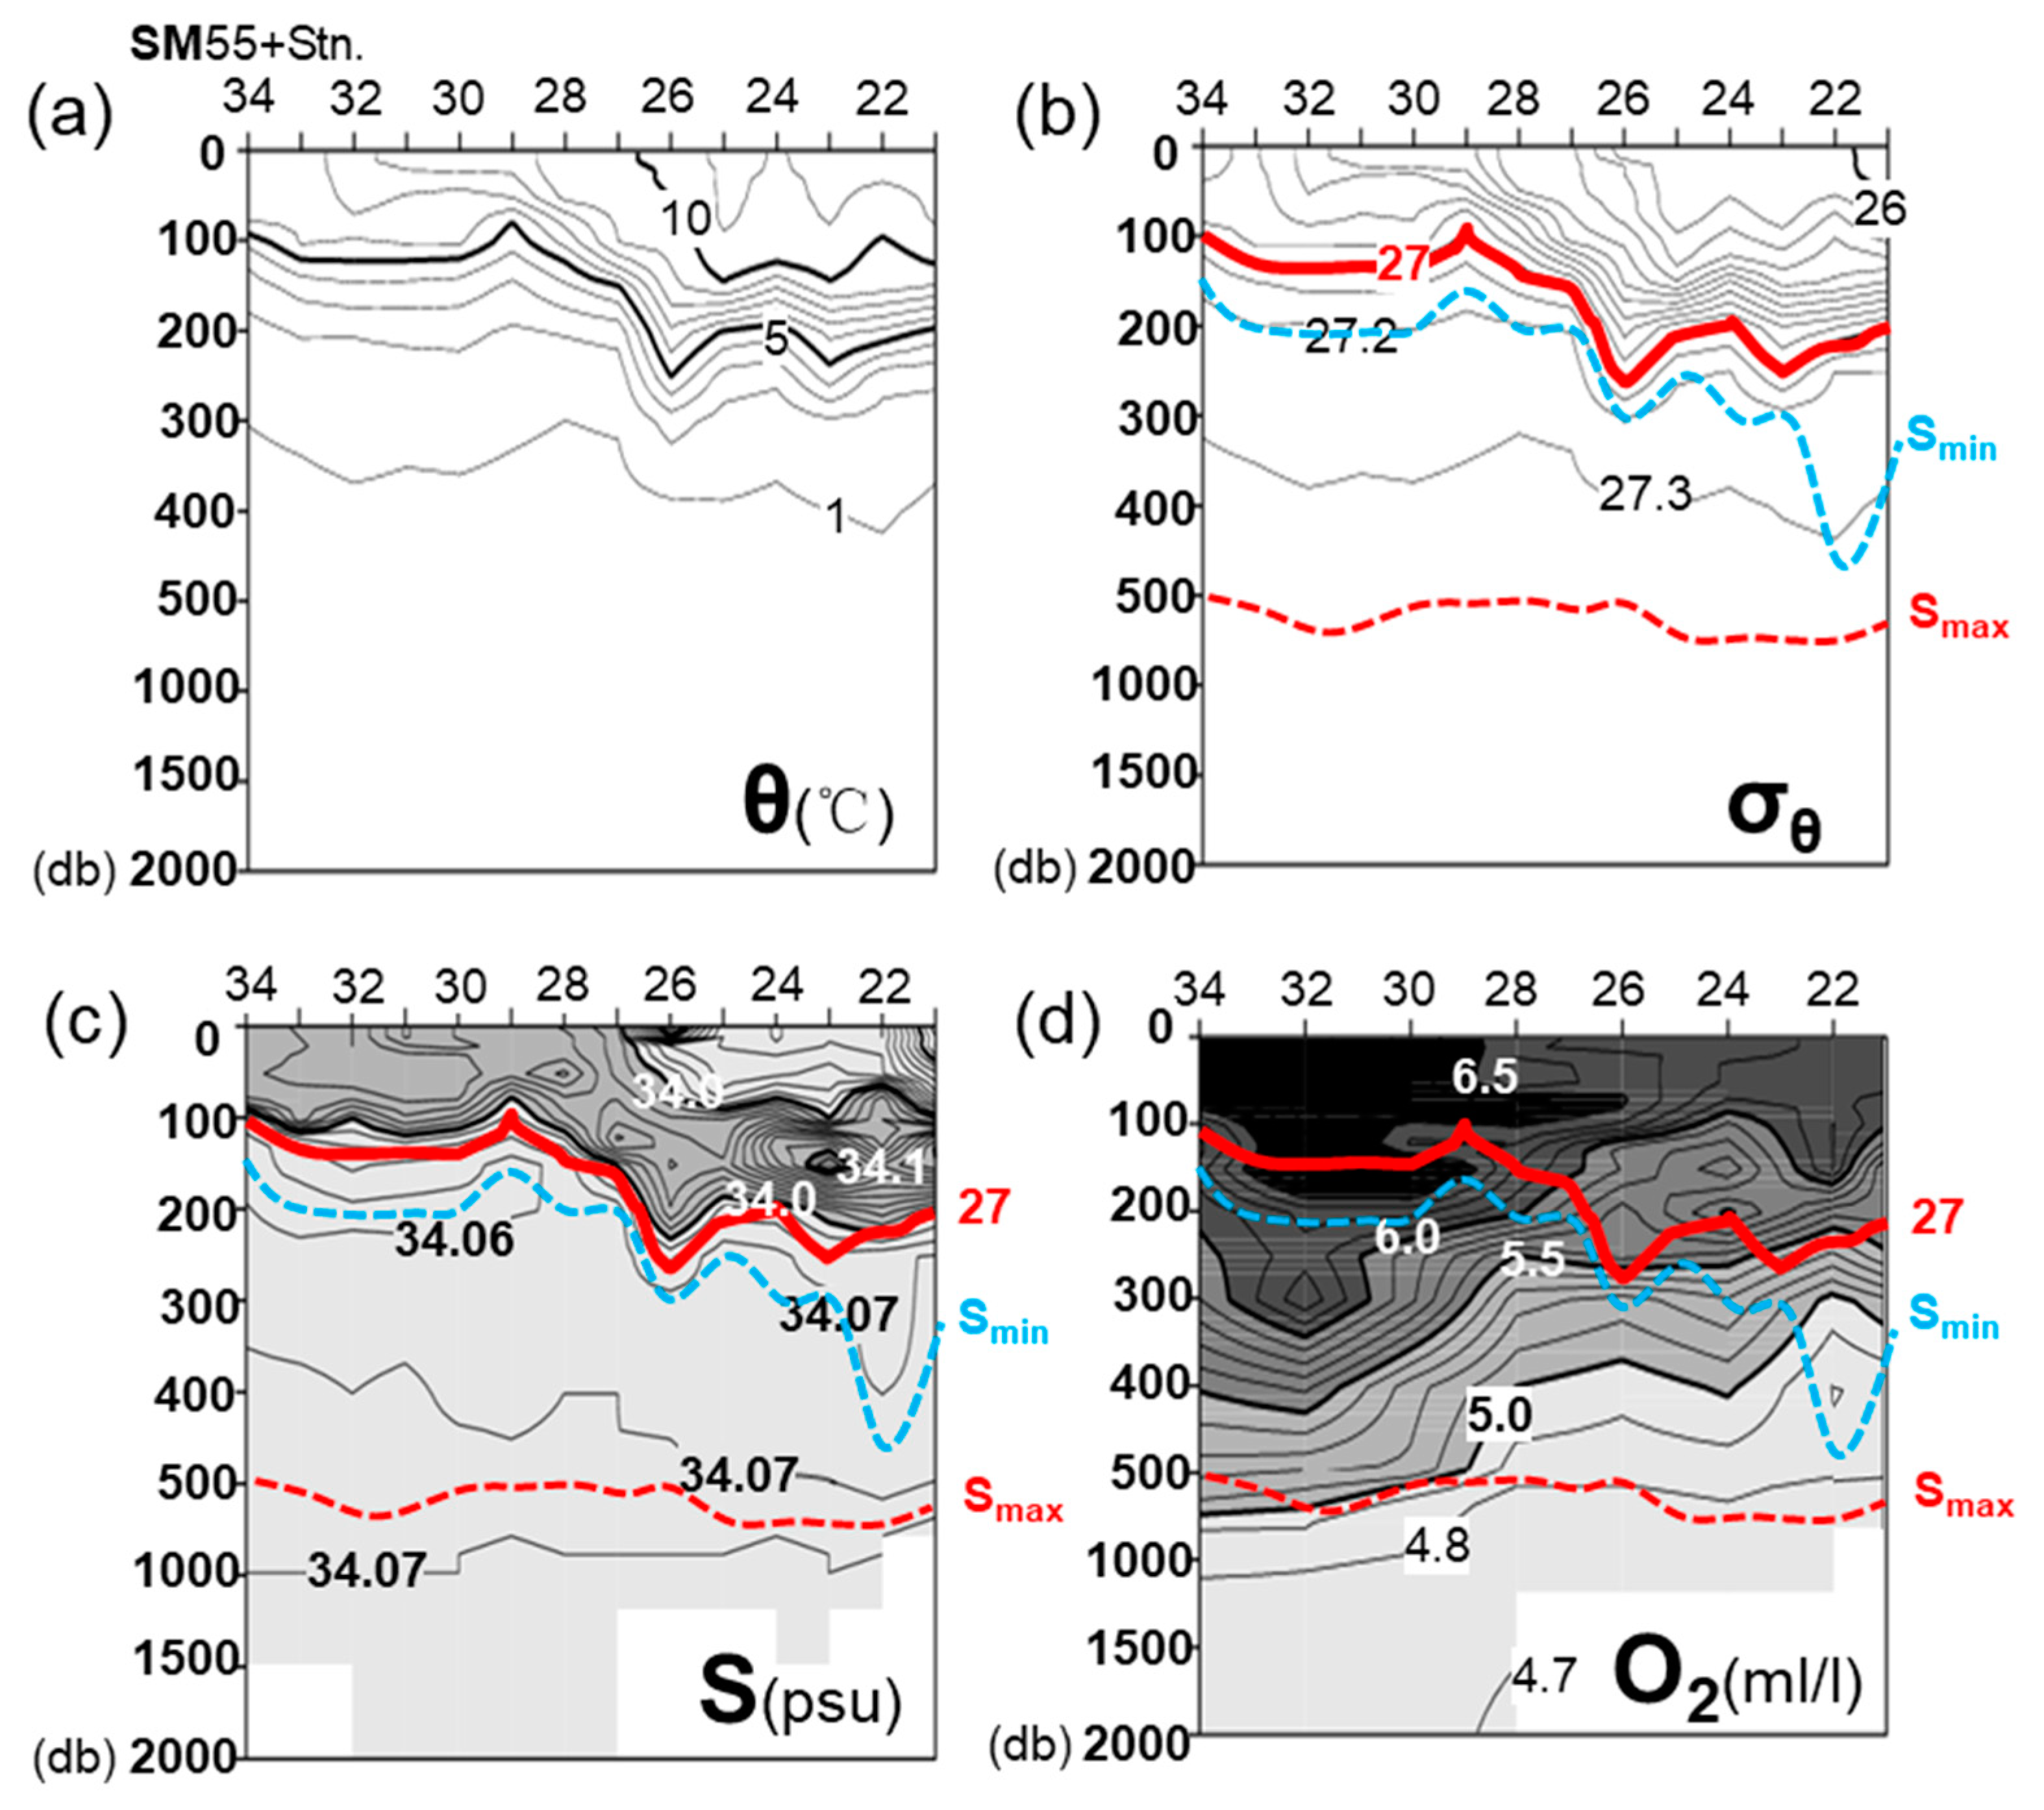
In this study, we focus on the intermediate water beneath the Tsushima Warm Water (TWW). The distributions of salinity and O2 around the intermediate water have very special features, Talley et al. (2006) [2] reviewed the water mass classification and its origin (Table 1) based on the salinity distribution from the ocean observations in the Japan Sea in summer, 1999. Their study demonstrates that the TWW flows from the Tsushima Strait with a salinity maximum (Smax) at a depth of 150 m. The Japan Sea Intermediate Water (JSIW) appears in the lower part of TWW with the salinity minimum (Smin). Its origin is from the surface low salinity water in the subarctic region (north of the polar front). Below the JSIW, there is a Smax called “High-Salinity Intermediate Water (HSIW)” (also called “Upper Japan Sea Proper Water”) [3] near the depth of 500m. Figure 2a–d show the typical example for vertical cross-sections of potential temperature (θ), potential density (σθ), salinity (S) and dissolved oxygen (O2) along the regular observation line SM by the Maizuru Observatory in January of 2011 (the locations are shown by symbol ▲ in Figure 1). Red solid line, red broken line and blue broken line denote σθ of 27.0, Smax and Smin, respectively. The TWW with high temperature and high salinity (>5 °C and >34 psu, respectively) occupies the surface layer as the coastal-trapped density-driven flow. So, the Smin layer gradually deepens from the offshore side to the coast along the bottom boundary of the TWW, while a Smax of HSIW exists near 500m. Such distributions of the Smin and Smax layers suggest the existence of intermediate intrusion flow, while the distribution of dissolved O2 suggests the costal upwelling flow driven by deep water with low dissolved O2.
The water mass beneath the Tsushima Warm Current referring to the JPIW (characterized by Smin) and the slightly deeper water under JPIW is the water mass of interest in this study. In earlier researches, the intermediate sea water of the Japan Sea seemed to be an uniform cold water with the constant temperature/salinity of 1 °C/34.1. But the recent high-precision CTD (Conductivity, Temperature, and Depth) observations have already revealed that the water beneath the TWC is formed by multiple water masses from different origins. Some previous studies [4,5] estimated the origin of the intermediate water mass beneath the TWC by using observed temperature, salinity and density data or numerical simulations. However, these results are inconsistent and the origin of the water mass beneath the TWC formed by winter sea surface cooling is still undetermined.
On the other hand, many studies [6,7,8] used chemical tracers such as the preformed phosphate (PO40) to deduce the origin of water mass. Since PO40 is of the conservative property, it can be widely used as a water mass tracer, especially in the sea areas where the T and S changes slightly, such as the intermediate water of the Japan Sea. Therefore, the purpose of this study is to clarify the behavior of water mass beneath the TWC based on the discussion of original water by using the performed PO4 data in the Japan Sea for the first time. The main conclusions of this study can help to further understand the behavior of water mass beneath the TWC and provide some observation evidences for developing corresponding parameterization schemes in ocean models.
The remaining part of this paper is organized as follows. The data and method are described in Section 2. The path of TWC in June of 2011, the relationships among T, S and O2 and the PO4 regeneration with reference to AOU are shown in Section 3. Finally, the discussions and summary are given in Section 4 and Section 5.
2. Data and Method
2.1. CTD, XBT, O2 and PO4 Observations
Comprehensive hydrographic observations by T/V Oshoro Maru of the Hokkaido University were carried out in the Japan Sea during the period of June 8–29, 2011. We selected a total of six observation lines crossing the northeastward flow of the TWC shown in Figure 1. These lines are consisted of several CTD surveys denoted by open circles. The figure in all lines shows the serial numbers of the observations from the Japanese coast to the offshore area (for example, the first observation point in line A is named A1). Line A can get the inflow structure of the TWC through the Tsushima/Korean Strait. Lines B and C can show the coastal-trapped density-driven flow of TWC. Lines D and E respectively locate south and north of the Tsugaru Strait, which is one of the outflows exits of the TWC. Line F is set to capture the seasonally transient flow of the TWC during early summer. The solid circles between observation lines are XBT (Expendable Bathy Thermograph) observation points to examine the spatial distribution of the TWC. In addition, the regular observation data from the Japan Meteorological Agency (JMA, Tokyo, Japan) are also used (https://www.data.jma.go.jp/gmd/kaiyou/db/vessel_obs/data-report/html/ship/ship.php.) As mentioned in the introduction, line SM (Syunpu Maru ship) consisted of 14 CTD points (closed triangles) were carried out in January of 2011. To take PO4 value of deep water mass for reference, AS2806 (double circle, a ship number) data at the abyssal bottom of the Japan Sea in December of 2011 was selected.
The vertical distributions of θ, S and dissolved O2 down to the maximum depth of 300 db were measured with the CTD system. The dissolved O2 and PO4 data were calibrated by using water-sample data taken at all standard depths (0, 10, 20, 30, 50, 75, 100, 125, 150, 200, 250 and 300 db) of CTD stations.
2.2. AOU and OUR Analyses
Water masses are often identified by their temperature, salinity and density. However, it is very difficult for the water beneath the TWC with nearly uniform temperature/salinity of 1 °C/34.1. Thus, we need other stable conservative tracers such as nutrients or oxygen content to clarify the mixing behavior of different water masses. Many previous studies have used the relationship of PO40-AOU to re-build the oceanic general circulation or infer the mixing water masses from different origins. Since PO40 is the conservative property and thus it can be used as a water mass tracer. In general, the decomposition and regeneration process of PO4 consumes the dissolved O2 in seawater. This degree of consumption is expressed by the AOU or O2% (degree of oxygen saturation), which are respectively defined as follows:
where O2 is observed by a CTD equipped O2 sensor and O2* (saturation value) is calculated from given T and S (see Appendix A). Here, the unit of AOU is converted from mL L−1 to μM (1 mL L−1 = 103/22.391 = 44.661 μM) for the convenience of the following description of AOU-PO4 relationship.
AOU = O2* − O2
O2% = 100 × O2 / O2*
Since the low O2 water is formed by the decomposition of particulate organic matter, particularly in the spring season when primary production is high in the surface layer, the waters a few weeks ago may become old and anoxic. Not such a short-term transition process, the steady state of oxygen concentration in the ocean would be maintained by the balance of oxygen supply and consumption. The supply to the intermediate and the deep layers of the Japan Sea (water depth from 500 to 3500 m) comes from the low temperature (0 to 1 °C) water masses formed by active vertical mixing of the northern sea surface in winter before the spring bloom. Therefore, it can be easily assumed that the O2 supplied to the intermediate and deep layer water masses is almost the same as the saturated oxygen content (O2*) determined by the TS (temperature and salinity) value in the surface mixed layer. Thus, the downwelling water preserving the TS value at the time of mixing sinks into the intermediate and the deep layers of the Japan Sea. Due to organic matter decomposition, the oxygen gradually goes down as respiration proceeds in the subsurface layers. The OUR (oxygen utilization rate) is usually considered to represent the subsurface oxygen consumption [9,10]. The OUR in the subsurface water is estimated by dividing the change in AOU along a given distance on an isopycnal surface by the change in water age (see Equation (3)).
The water age (t in Equation (3)) is the time elapsed since the oxygen concentration at equilibrium with air when age is set to zero. In this paper, based on the assumption of that the OUR in the intermediate and deep layer of the Japan Sea, i.e., below the photic layer, is a constant; we can discuss the seawater age and estimate the preformed PO4 by O2 and AOU.
OUR = dAOU/dt = d(O2* − O2)/dt
2.3. Preformed PO4 Analyses
Redfield et al. (1963) [11] established the stoichiometric equation for average phytoplankton composition and its respiratory decomposition as follows:
The excess PO4 originates from PO4 in the surface water assuming to be saturated with oxygen. Redfield et al. (1963) [11] defined this excess PO4 as “preformed PO4 (PO40)”. This PO40 can be calculated by the following equation.
where PO4m denotes the measured PO4 concentration and all units are μM. We can discuss the origin of water masses with different dissolved O2, based on the relationship between PO40 and dissolved O2 (or AOU). Considering on a global scale, due to the subsidence of seawater in the polar region where the water temperature is relatively low, PO4 before subsidence (preformed PO4) is indeed a function of water temperature, i.e., lower water temperature tends to have higher PO4. However, the scale of the Japan Sea is much smaller than that of the ocean and the deep water of the Japan Sea is almost uniform seawater (JSPW) with a water temperature of less than 1 °C (salinity is almost indistinguishable), as mentioned in the introduction. Hence, it is very difficult to discuss the origin of the water mass by using TS data as a tracer. As shown in this study, the estimated preformed PO4 is particularly effective in the case of the Japan Sea to speculate the advection and the mixing process beneath the Tsushima Warm waters.
(CH2O)106(NH3)16H3PO4 + 138O2→106CO2 + 16HNO3 + H3PO4 + 122H2O
PO40 = PO4m − AOU/138
Besides, we noticed that from some previous studies [11,12,13], the Redfield [11] ratio is sensitive to observations in sea area and water depth (see Appendix B). Deviation of the P/O2 ratio from the Redfield ratio may affect the estimated PO40 value. However, if a certain P/O2 ratio different from the traditional Redfield ratio is maintained in the sea area, it is considered that PO40 can be treated as an absolute value (conservative component) with a certain bias.
3. Results
3.1. The Path of TWC in June, 2011
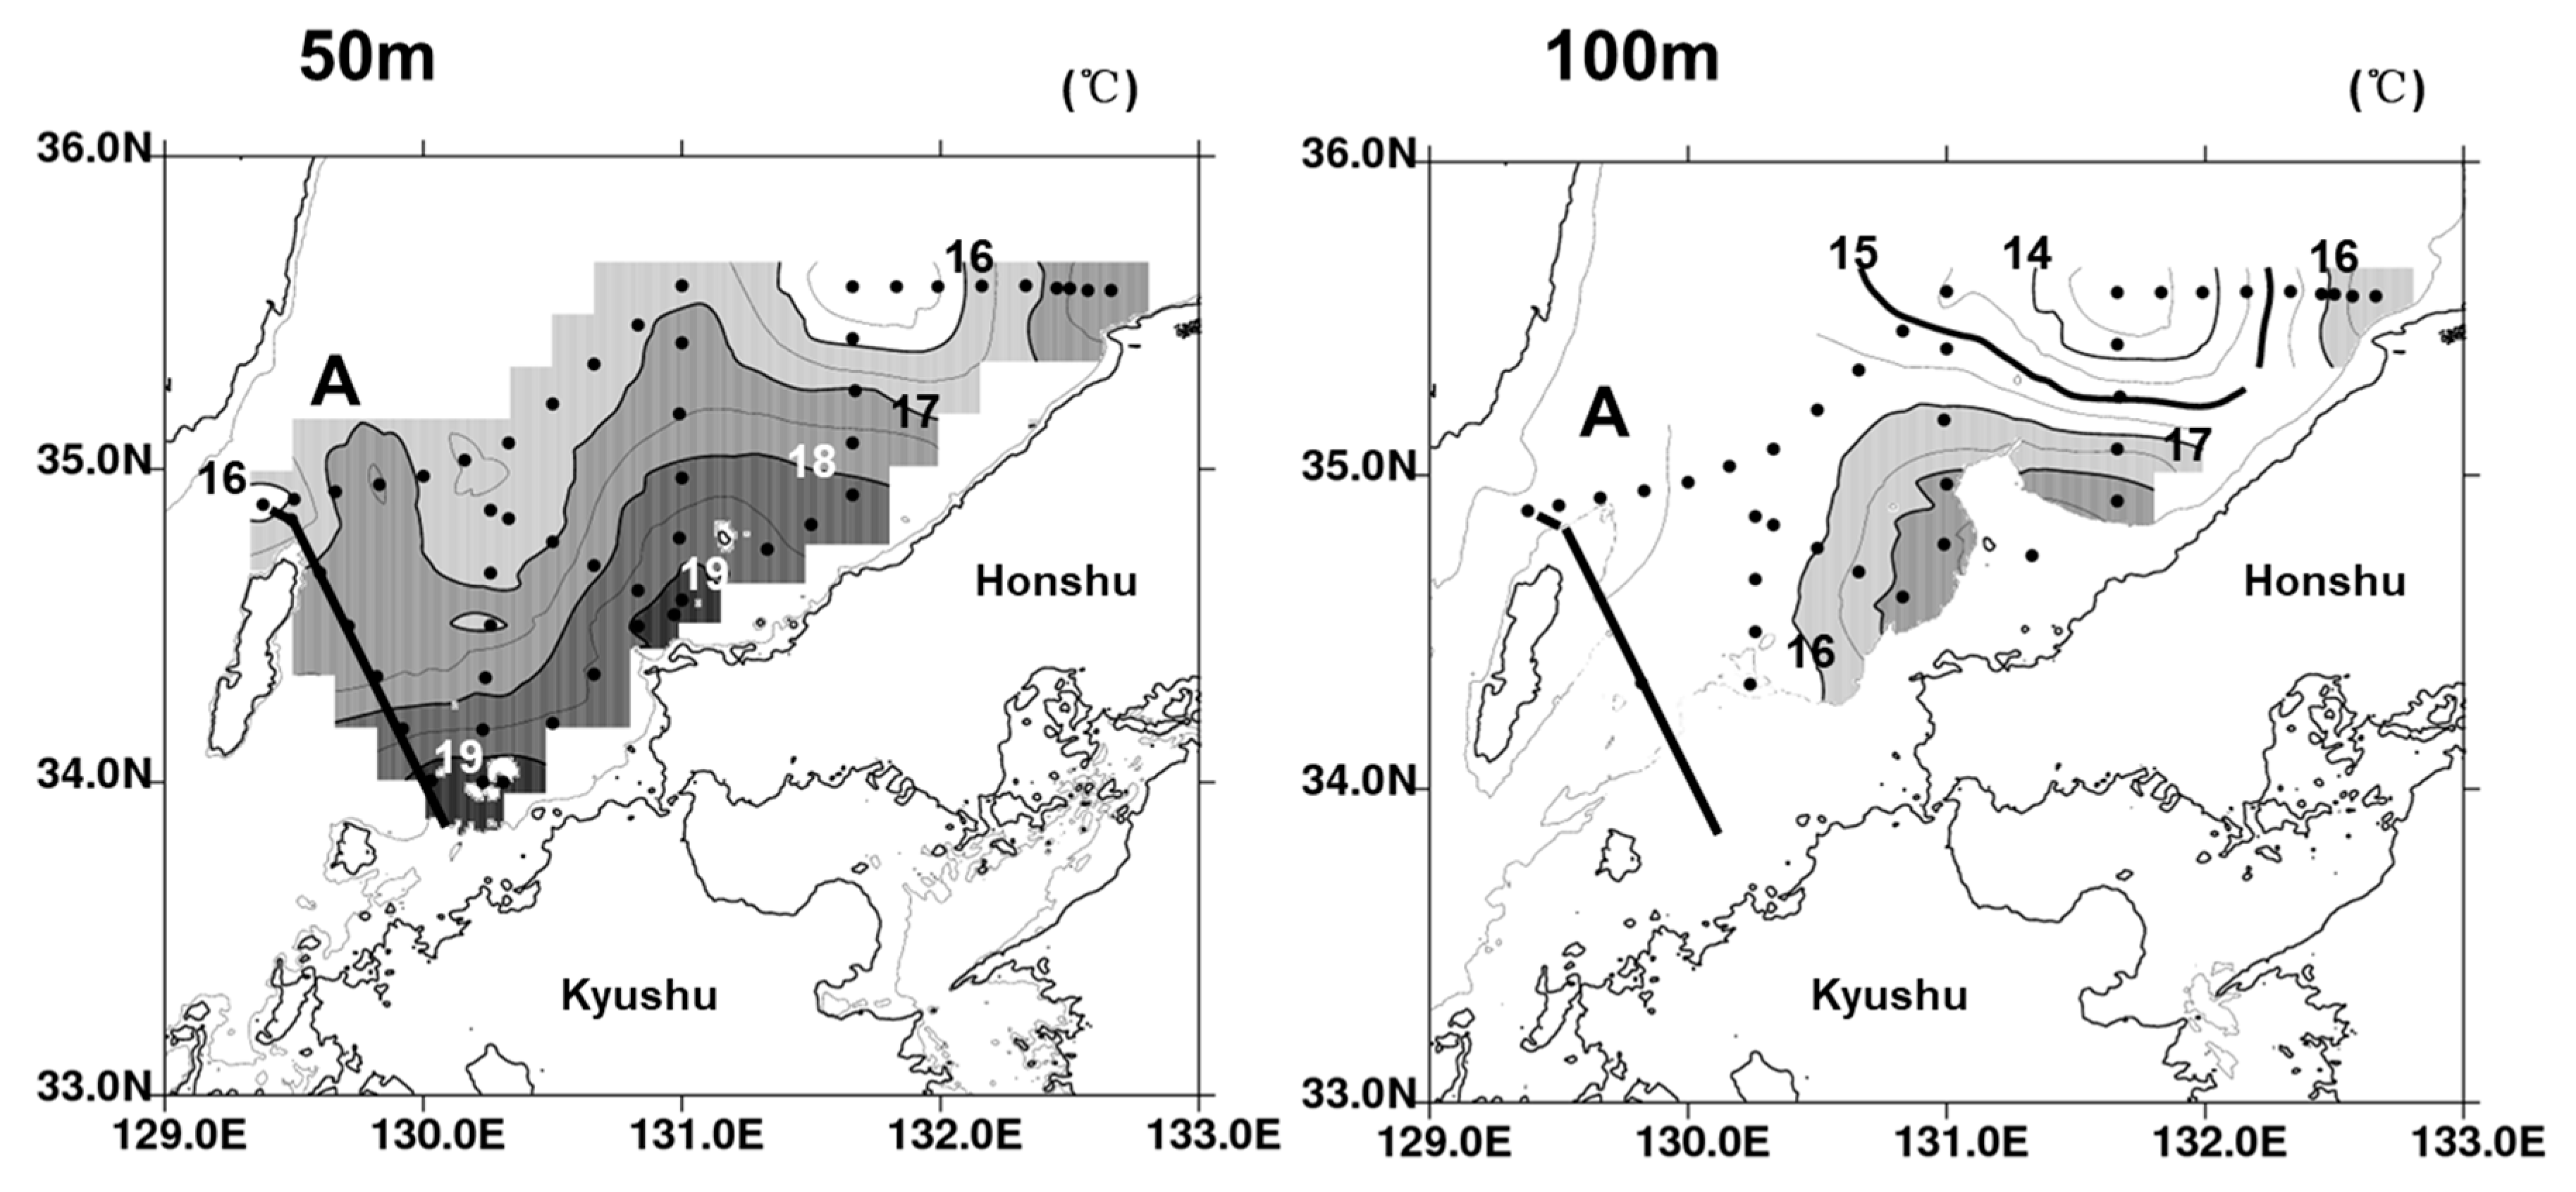
The TWC has a complex flow path and discontinuous shape. However, in the flow path of the Tsushima/Korean Strait and near the Tsugaru Strait is relatively stable. CTD and XBT observation data are used to show the horizontal distributions of temperature in Figure 3 and Figure 4. The Straight lines represent the CTD observation lines of A-F, and the rests of black dot are XBT observations.
Figure 3 shows the horizontal distributions of temperature around the Tsushima/Korean Strait at the depths of 50 m and 100 m. In this map we can only see the isotherm from the Tsushima/Korean Strait to the Oki Islands waters, because the east Korean Peninsula water has not been measured. We can see the meandering path of TWC on the shelf (the depth less than 200 m). The meandering wave-length is about 200 km and a significant cold eddy lies to the west of the Oki Islands.
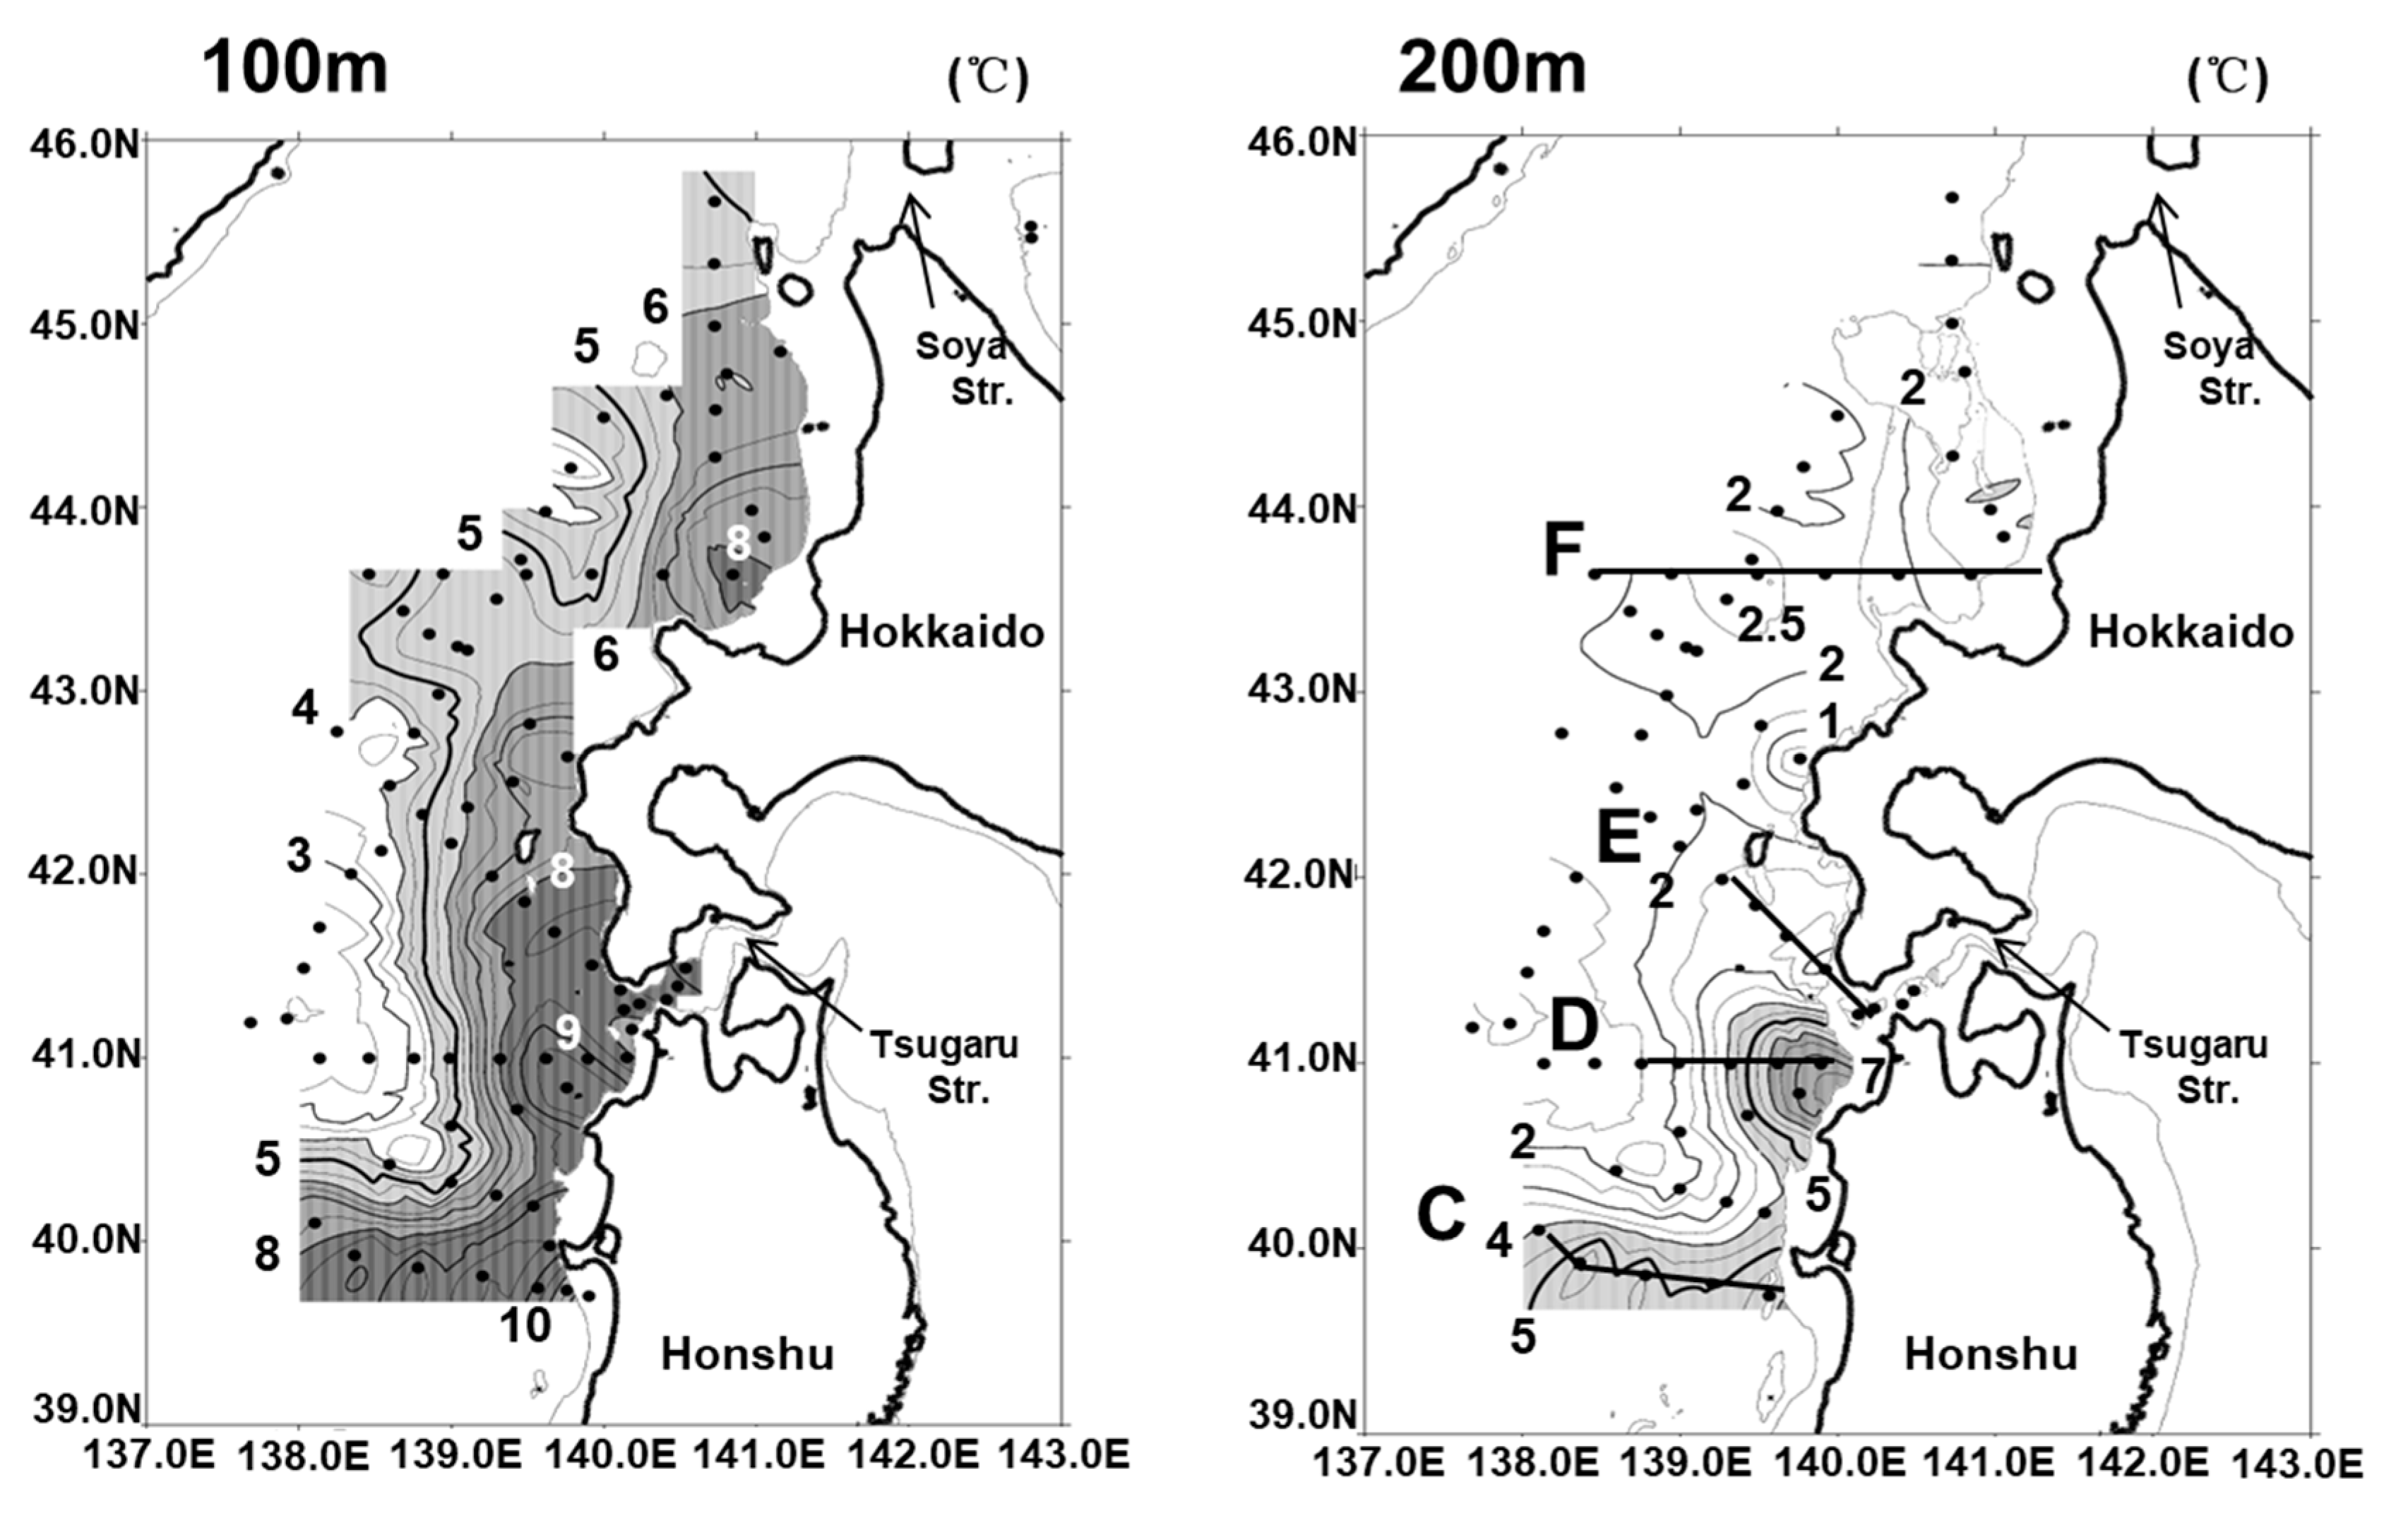
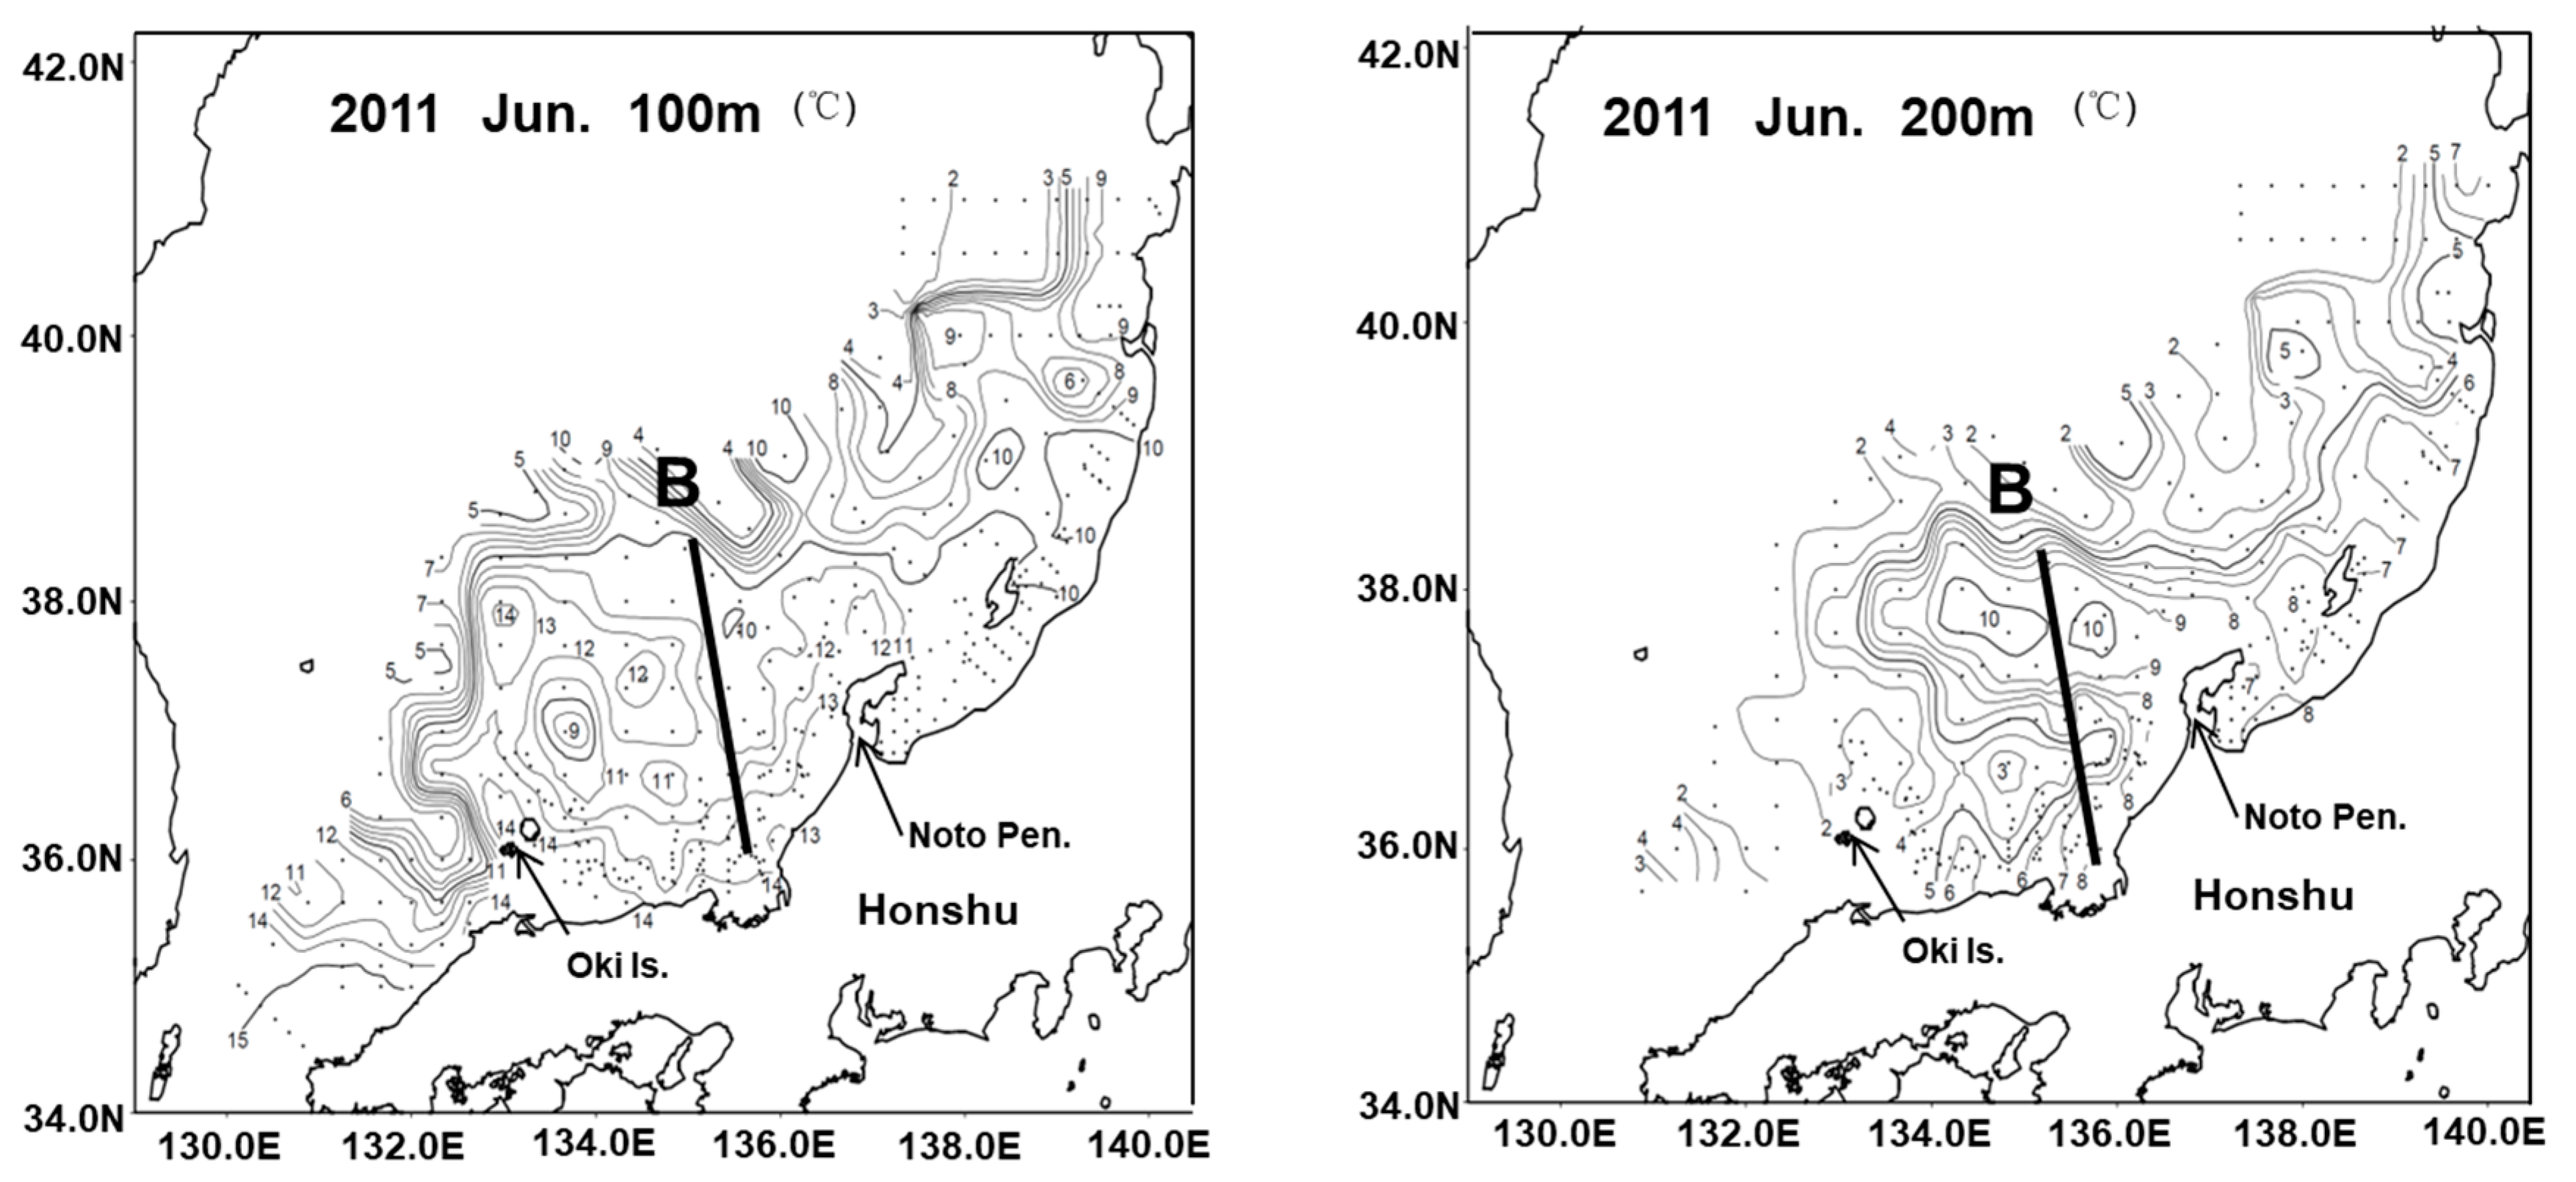
Figure 4 shows the horizontal distributions of temperature at the depths of 100 m and 200 m in the sea area from the Tsugaru Strait to the west of Hokkaido. The TWC structure is broken at the depth of 200 m around the Tsugaru Strait. Isotherms in the sea near the 138° E, 40° N is very intensive, the horizontal temperature gradient of the north-south water corresponds to the pole front. A strong flow exits at the high water temperature region along the right side of the isotherm. This implies that the main waters of TWC flow out to the North Pacific through Tsugaru Strait. The rest of them seem to flow northward as the shallower TWC, and then a small meandering path is formed west of Hokkaido.
Figure 5 shows the horizontal distribution of temperature at the depths of 100 m and 200 m in June of 2011, referred to the quick maps from Japan Sea National Fisheries Research Institute (http://jsnfri.fra.affrc.go.jp/, Yokohama, Japan). First, many eddies and the large meander of TWC can be seen from Figure 5. Moreover, a small meander can be seen on the horizontal distribution of temperature at the depth of 100 m, and there is a cold eddy west of the Oki islands. A significant offshore TWC is found flowing from the north of the Oki islands to the west of the Tsugaru Strait, forming a large s-shaped path west of the Noto peninsula. This meander includes a noticeable warm eddy, which can be captured by our observation of line B.
3.2. Relationships Among θ, S and O2
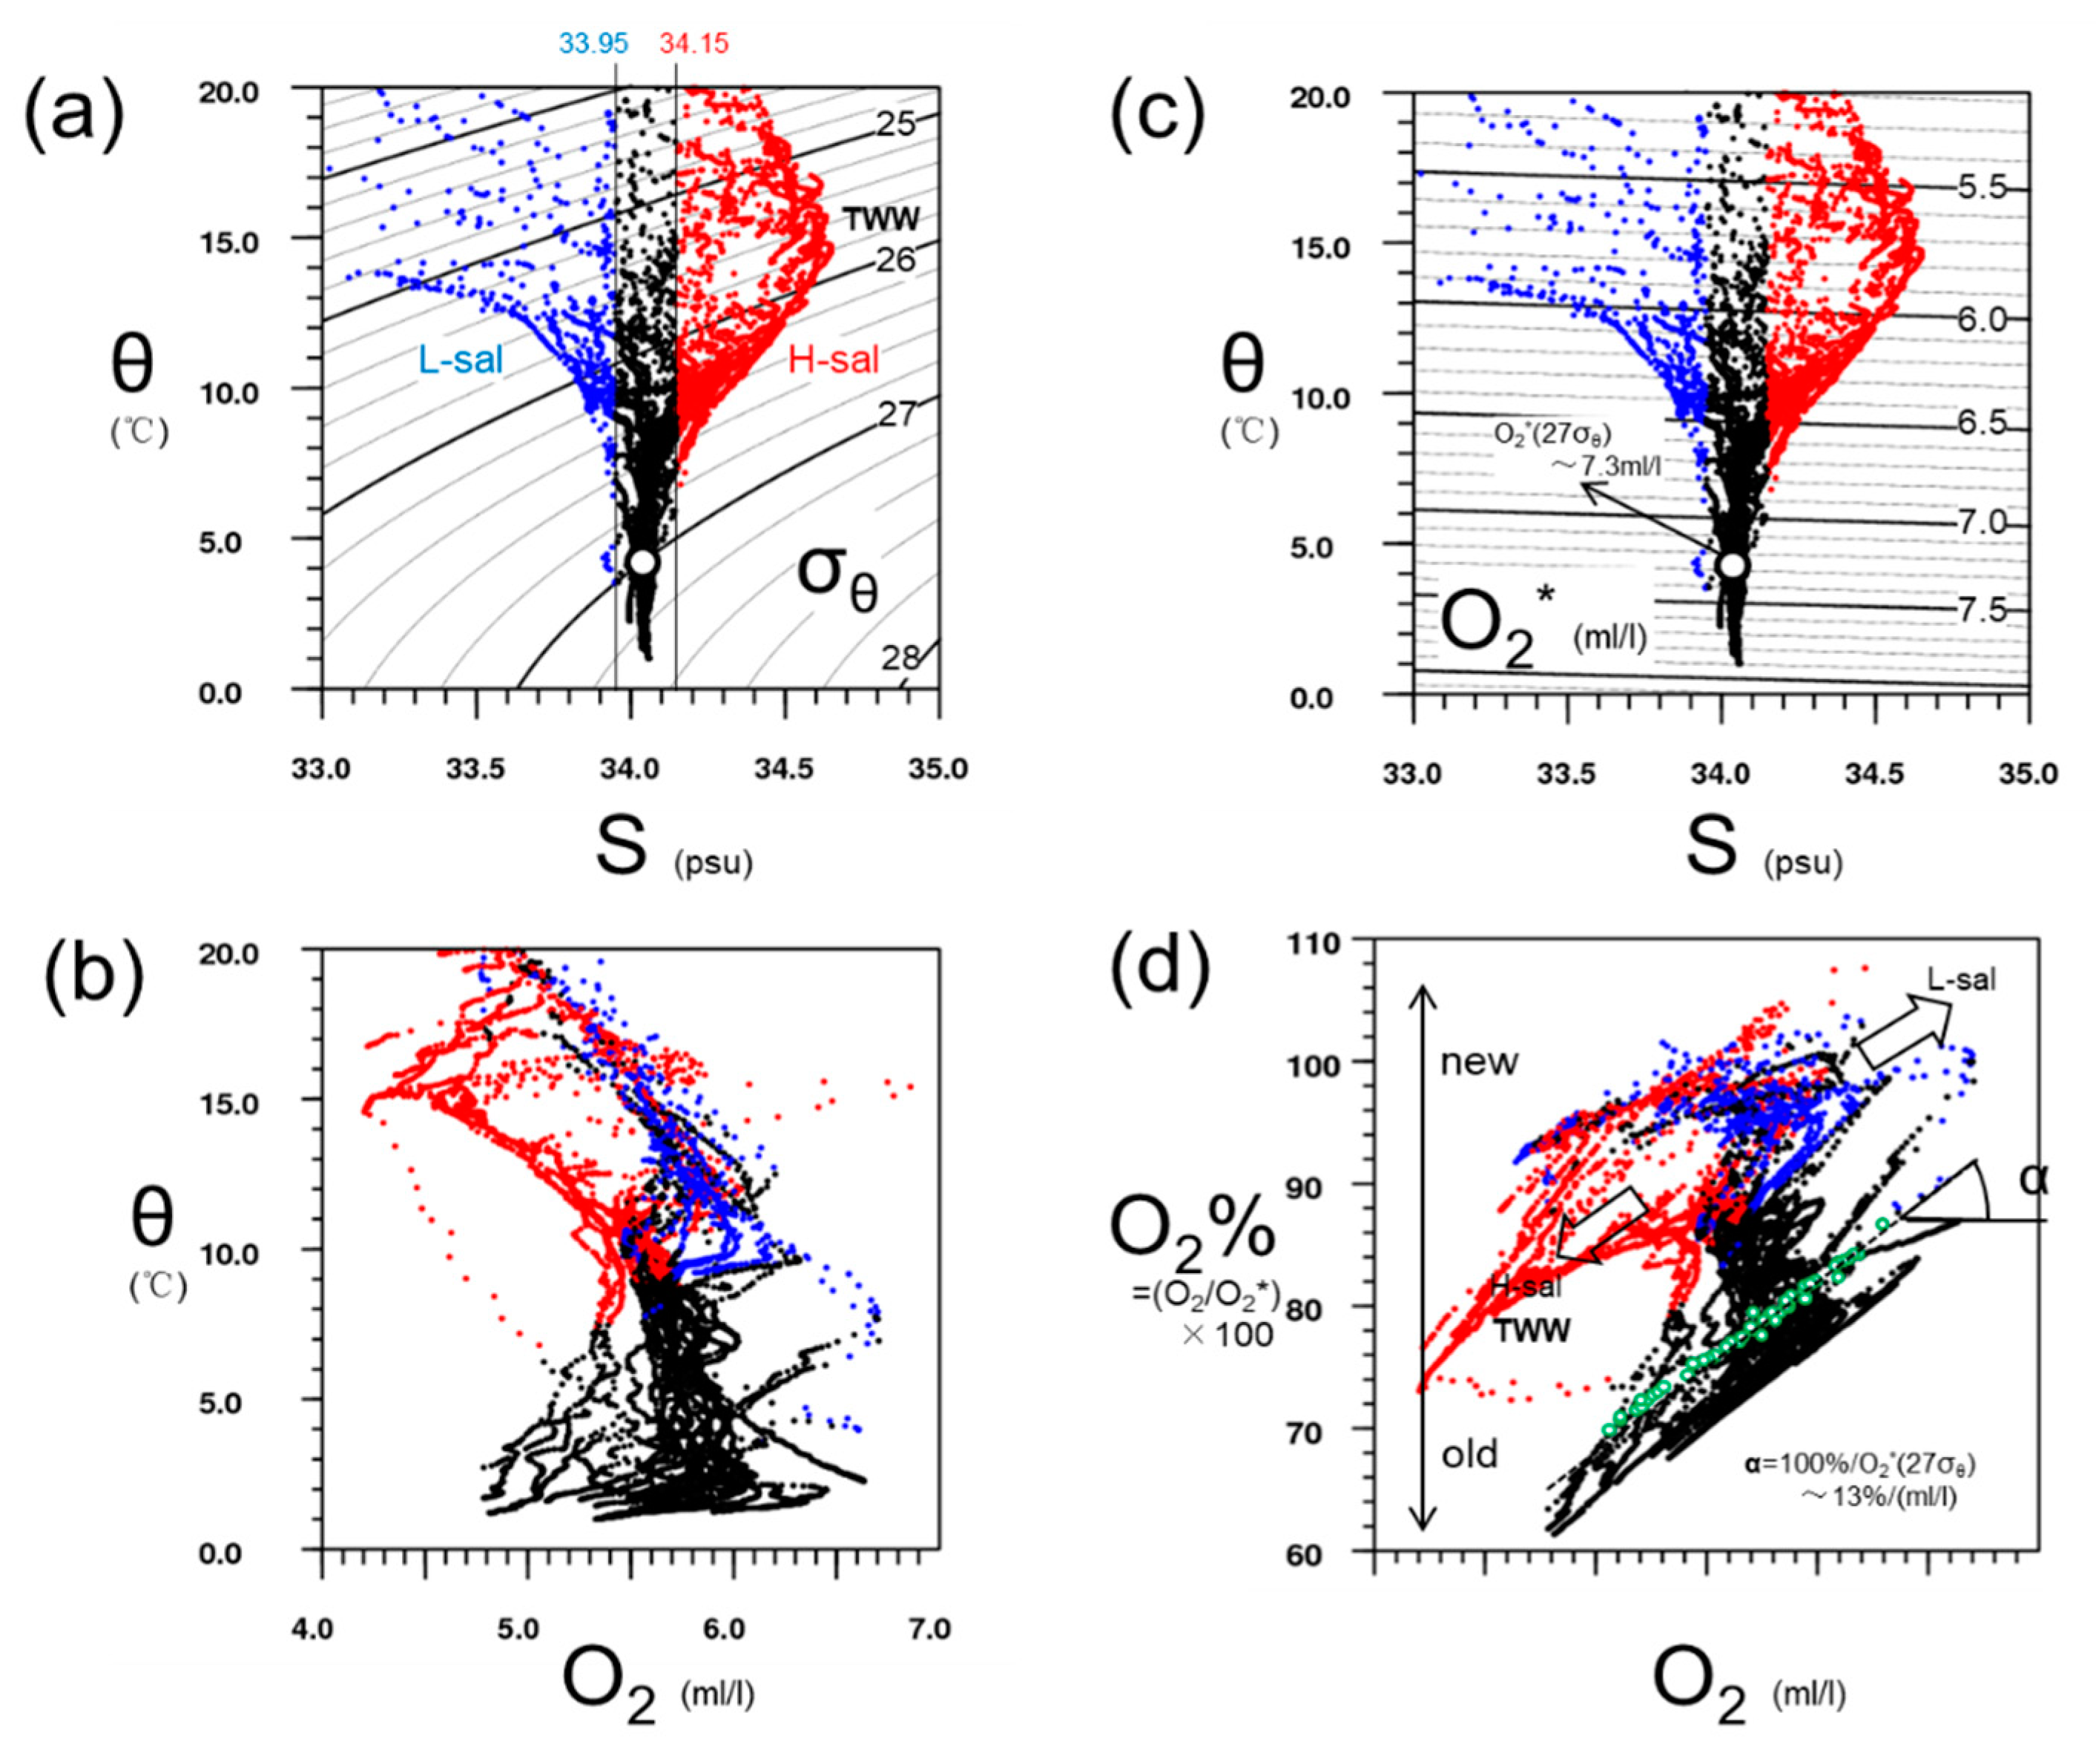
Before the description for the vertical distributions of θ, S and dissolved O2, the relationships among them are analyzed by using all CTD data obtained in our cruise. Dissolved Oxygen versus salinity and potential temperature relations (Figure 6) for all CTD observations taken in summer of 2011 are examined because dissolved oxygen plays an important role in identifying water masses in the Japan Sea.
Figure 6a,c are the θ-S diagrams as the function of potential density σθ and O2%. Figure 6b,d show the relationship between θ and O2 and that between O2% and O2, respectively. When the density is greater than 27.0, i.e., the water beneath the TWC, O2* varies in a small range of 7.3–8.0 mL L−1, and the S is nearly constant around 34.0 psu (Figure 6a,c). On the other hand, the TWC water with the density lower than 27.0 shows the S with a wide range from 33.0 to 34.6 psu (Figure 6a). For convenience, water masses are divided into three categories with S-values of 34.15 and 33.95 psu. In each figure, high-S (more than 34.15 psu, the TWC core water), low-S (less than 33.95 psu, diluted surface water) and mid-S (water beneath the TWC) are drawn by red, blue and black dots, respectively.
Comparing the θ-S diagram (Figure 6a) with the θ-O2 diagram (Figure 6b), the warm waters with high-S and low-S correspond to low-O2 and high-O2, respectively. The cold waters beneath the TWC (σθ >27.1) with almost constant S-value (34.0–34.1) show O2 with a wide range (4.8–6.7 mL L−1). Distinguish different water masses beneath the TWC by S will be very difficult. So, it would be better to use O2 data rather than S data in order to investigate the behaviors of the water mass beneath the TWC. The O2%-O2 diagram (Figure 6d) shows that O2 increases in proportion to O2%, and with such a relationship the upper-level and lower-level water masses can be clearly divided. The O2% of lower-level water mass is relatively low (60–80%) in comparison with that of upper-level water (80–100%). The upper blue and red dots stand for low salinity and high salt salinity water of Tsushima Warm Current. The black dots show an expansion of dissolved oxygen, and the green circle indicates water of 27.0 of density. The dashed line indicates its slope. That is to say, there exists a linear relationship between dissolved oxygen saturation and dissolved oxygen concentration when the density is near 27.0. Its linear gradient α is about 13%/(mL L−1):
therefore, we infer that the new or old water mass beneath the TWC can be easily detected with dissolved O2 distributions.
slope-α = (100%)/(7.3 mL L−1) ~13%/(mL L−1)
3.3. Vertical Cross-Sections of Water Properties Along Lines A to F
The vertical cross-sections of θ, σθ, S, O2 and O2% along lines A to F are shown in Figure 7 and Figure 8. The right side in each diagram is the Japanese coast. As for line A, the vertical profiles of each property at Stn. A8 (thick solid line) are also drawn to show a more detailed structure of the bottom water intruding from the Japan Sea to the Tsushima/Korean Strait.
The vertical homogeneity with high S and low dissolved O2 at the mid-depths of 50–140 db at Stn. A8 shows the characteristic of TWW (Figure 7A). The TWW extends to the bottom layer in the shallower eastern Strait, but its homogeneity becomes somewhat weaker. The other homogeneous water is found at the bottom layer below the TWW at Stn. A8. It has been considered that the origin of this bottom water is the JSPW, and hence the existence of vertical circulation like the estuarine circulation has been inferred on the Korean side of the Strait. In comparison with the TWW, the bottom water mass is colder (3.4 °C) with lower S (34.03 psu) and higher dissolved O2 (5.7 mL L−1). Besides, O2% of the bottom water (77%) is slightly larger than that of the TWW (74–76%).
Line B captures a noticeable warm eddy at Stn. B4–B8. Its core water is warmer (10 °C), but with lower S (34.1 psu) and higher dissolved O2 (5.6 mL L−1), compared with the surrounding waters. Therefore, it is inferred that this warm eddy may be influenced by the vertical mixing due to the previous winter cooling. The TWW with warm temperature (>10 °C), high S (>34.3 psu) and low dissolved O2 (<5 mL L−1), which are the similar properties observed in line A, is confirmed at the depth of less than 200 m on the Japanese coastal side. Then, we can find another water with low dissolved O2 (<5 mL L−1) and low dissolved O2% (<74%) beneath the TWW.
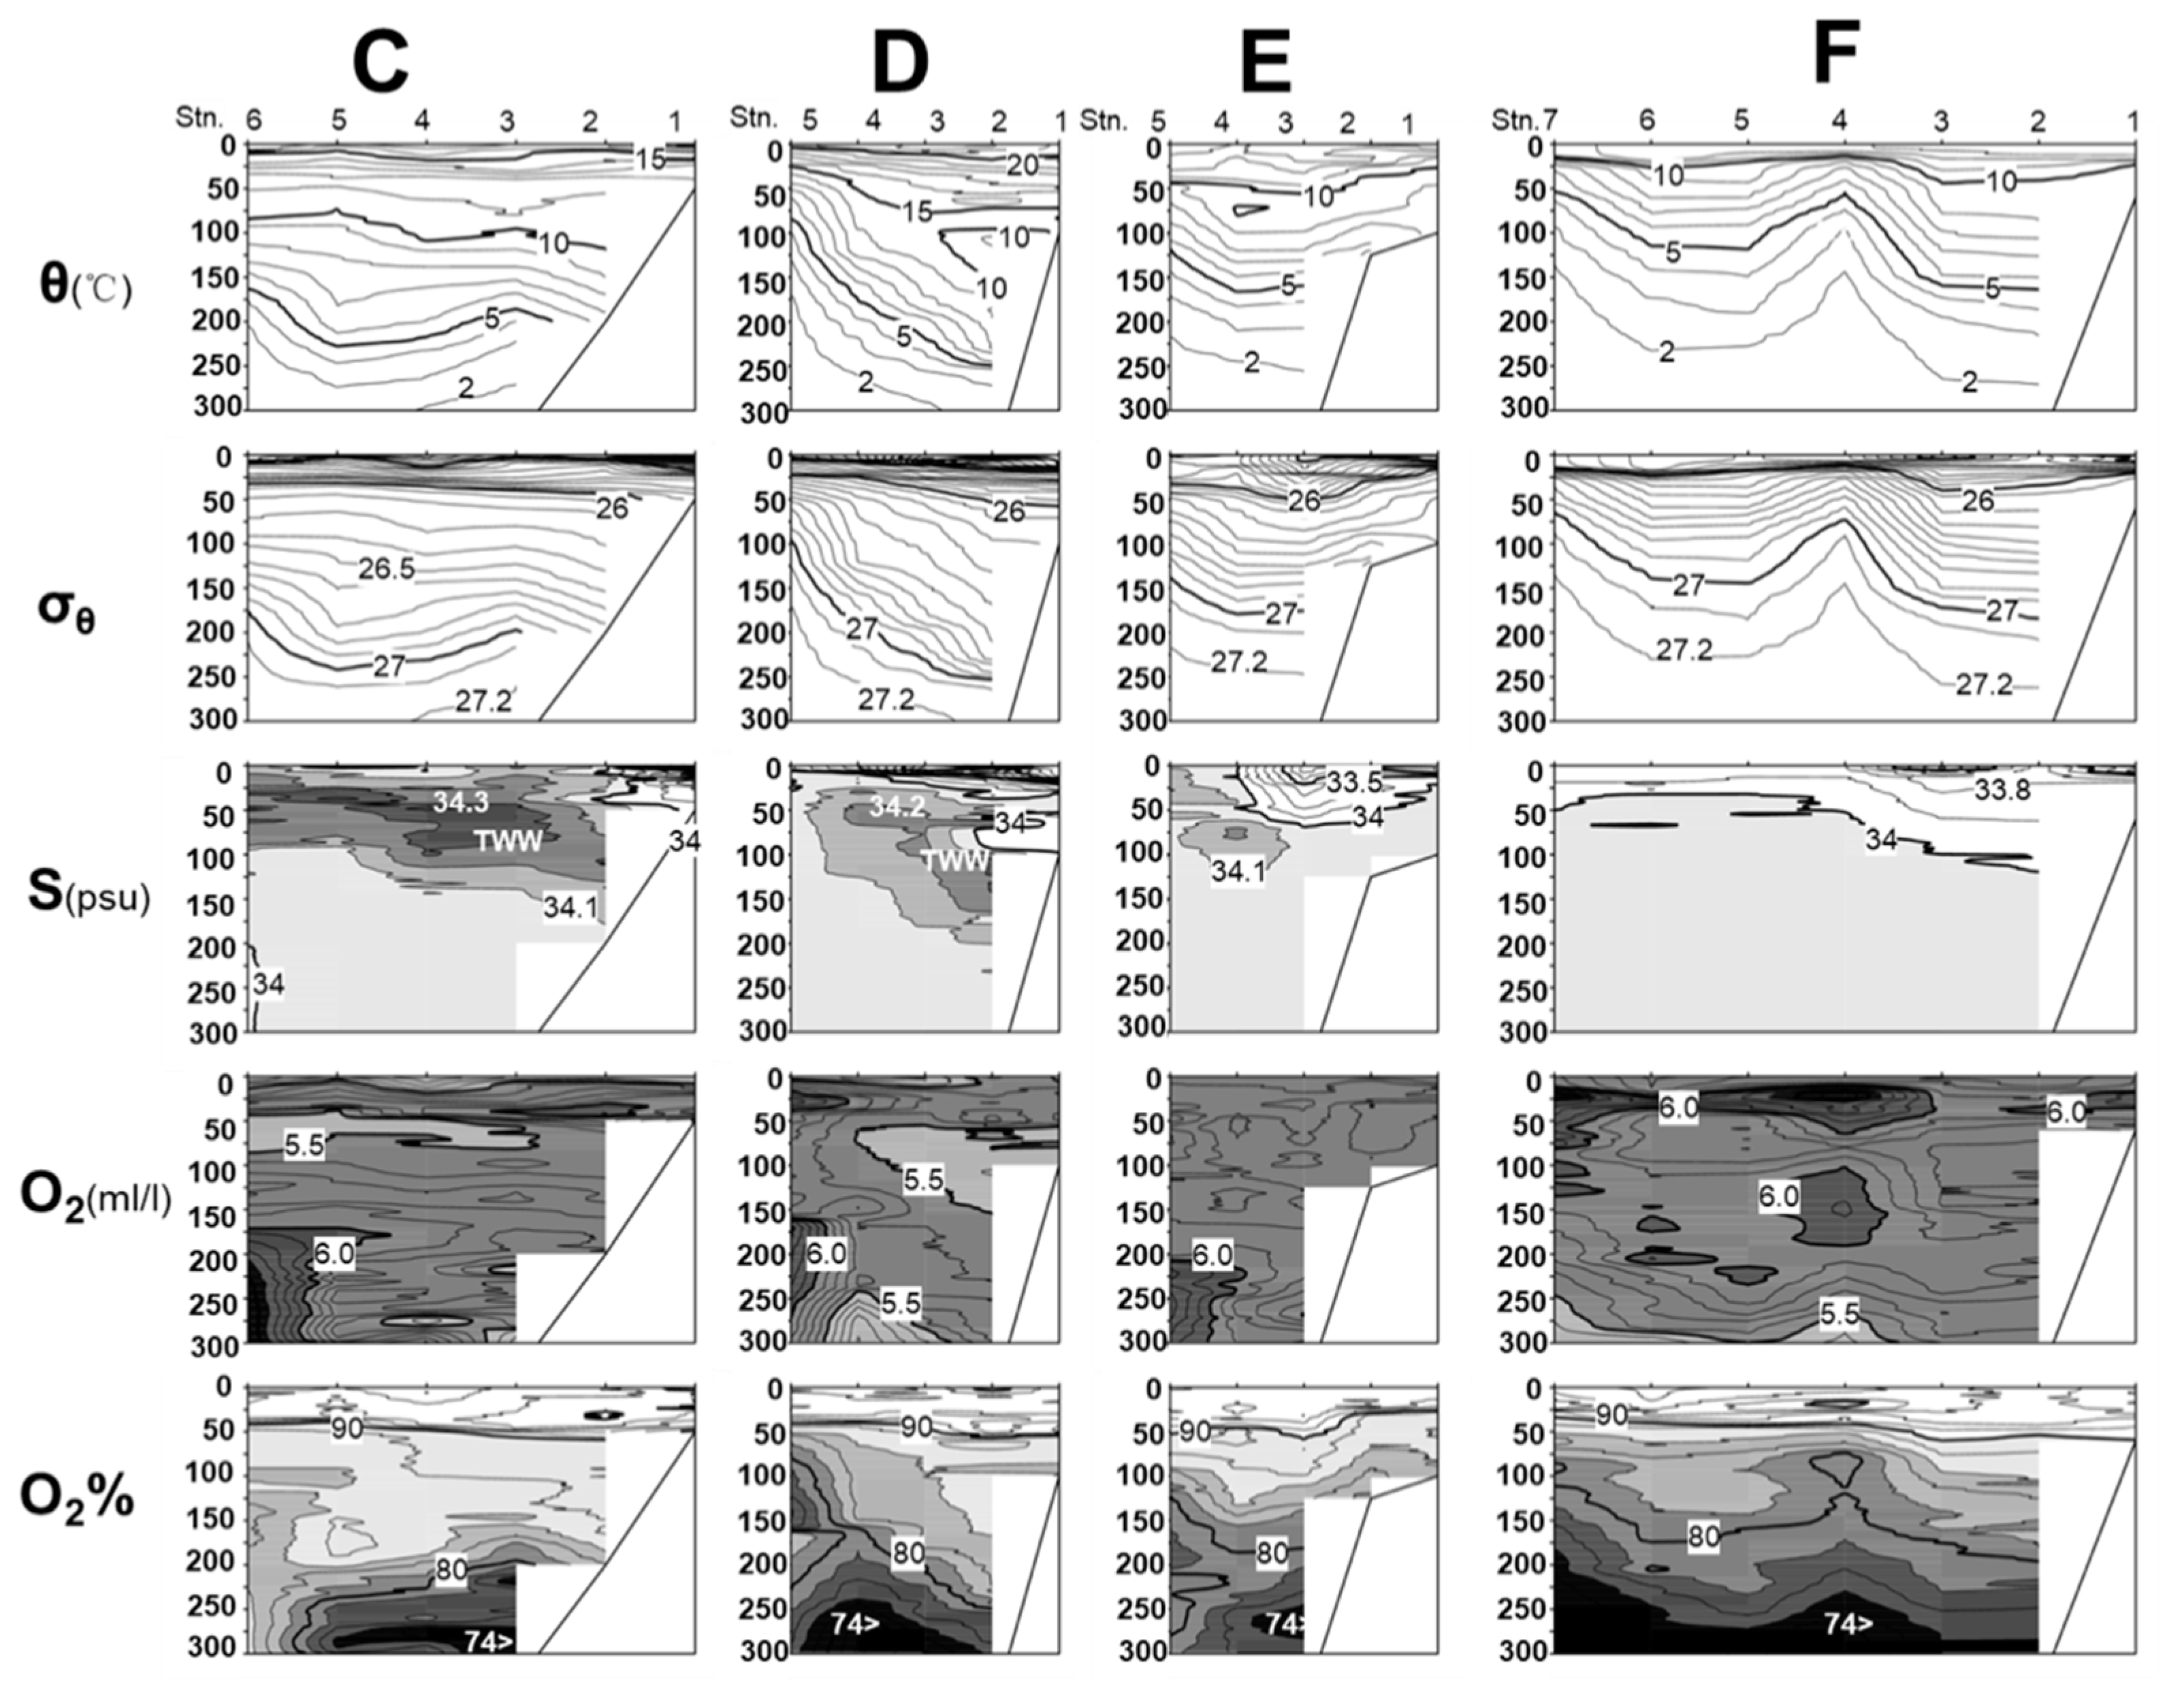
The vertical cross-sections of water properties along both lines C and D, located south of the Tsugaru Strait, have very similar characteristics. The TWW with warm temperature (>10 °C), high S (>34.2 psu) and low dissolved O2 (<5.5 mL L−1) is trapped to the Japanese coastal side. There are two deep water masses with different dissolved O2 and O2% beneath the TWW, although laterally they have the almost same values of θ (2–5 °C), σθ (27–27.2) and S (<34.1 psu). One is the water with relatively low dissolved O2 (<6 mL L−1) and low dissolved O2% (<80%) on the coastal side, the other is the water with high dissolved O2 and high dissolved O2% on the offshore side. Such geographical distribution of two water masses with different dissolved O2 is also seen in line E north of the Tsugaru Strait, but the TWW with high S (>34.1 psu) largely shifts to the offshore side (Stn. E4–E5).
In line F west of Hokkaido, the TWW with high S and low dissolved O2 is barely recognized. In comparison with all the southern lines of A–E, the thickness of warm water tends to be shallower. Then, a warm eddy (or a small meander) seen at Stn. F4–F7 can be only characterized by θ-structure, and the coastal trapped warm water seen at Stn. F1–F3 is with relative low S (<34.0 psu). Low dissolved O2 (<5.5 mL L−1) and low dissolved O2% (<74%), which corresponds to the coastal deep water observed in lines C–E and is uniformly distributed below the depth of 200–250 db.
In order to more closely examine the water mass distributions beneath the TWW, the vertical profiles of dissolved O2 and O2% along line A and the cross-sections along lines B to E where the depth is represented by σθ are shown in Figure 9. In the cross-sections from lines B to E, it is found that high dissolved O2 (high dissolved O2%) and low dissolved O2 (low dissolved O2%) patches stand side by side along the iso-pycnals of denser than 27.0. The bottom water with the σθ denser than 27.1 at Stn. A8 seems to have the middle values of these two patches. Such patches with the σθ denser than 27.0 in line F stand one behind another, and another patch with remarkable high dissolved O2 (>6 mL L−1) and high dissolved O2% (>90%) also appears in a layer with the σθ of 27–26.5. This suggests that the vertical mixing of shallower subsurface layer had considerably occurred during the previous winter time.
3.4. Inference of Original Waters Beneath the TWC Using the Preformed PO4
It is well known that chemical elements, e.g., NO3, NO2, NH3, PO4, SiO2, Cd and so on, can be used as an indicator to trace the ocean circulation. Among these elements, PO4 is considered to have a good correlation with the seawater AOU, because the ratio of PO4/O2 well satisfies Redfield’s equation (PO4:AOU = 1:138). Therefore, if there is no mixing among the water masses, the PO4 value of original water, i.e., preformed PO4 (PO40), can be estimated from Equation (4) by using the measured PO4 (PO4m) and AOU. Actually, lots of related researches apply this PO4-AOU relationship in the Pacific Ocean to reconstruct the ocean circulation pattern and to infer a consequence of mixing between two water masses with different original ratios of PO4-AOU [6,7,8]. Chen et al. (1996) [13] firstly calculated the preformed PO4 in the Japan Sea and explained that the preformed PO4 is a function of potential temperature. The present analysis using PO4 -AOU relationship in the Japan Sea is the first time to understand the behavior of the water mass beneath the TWC.
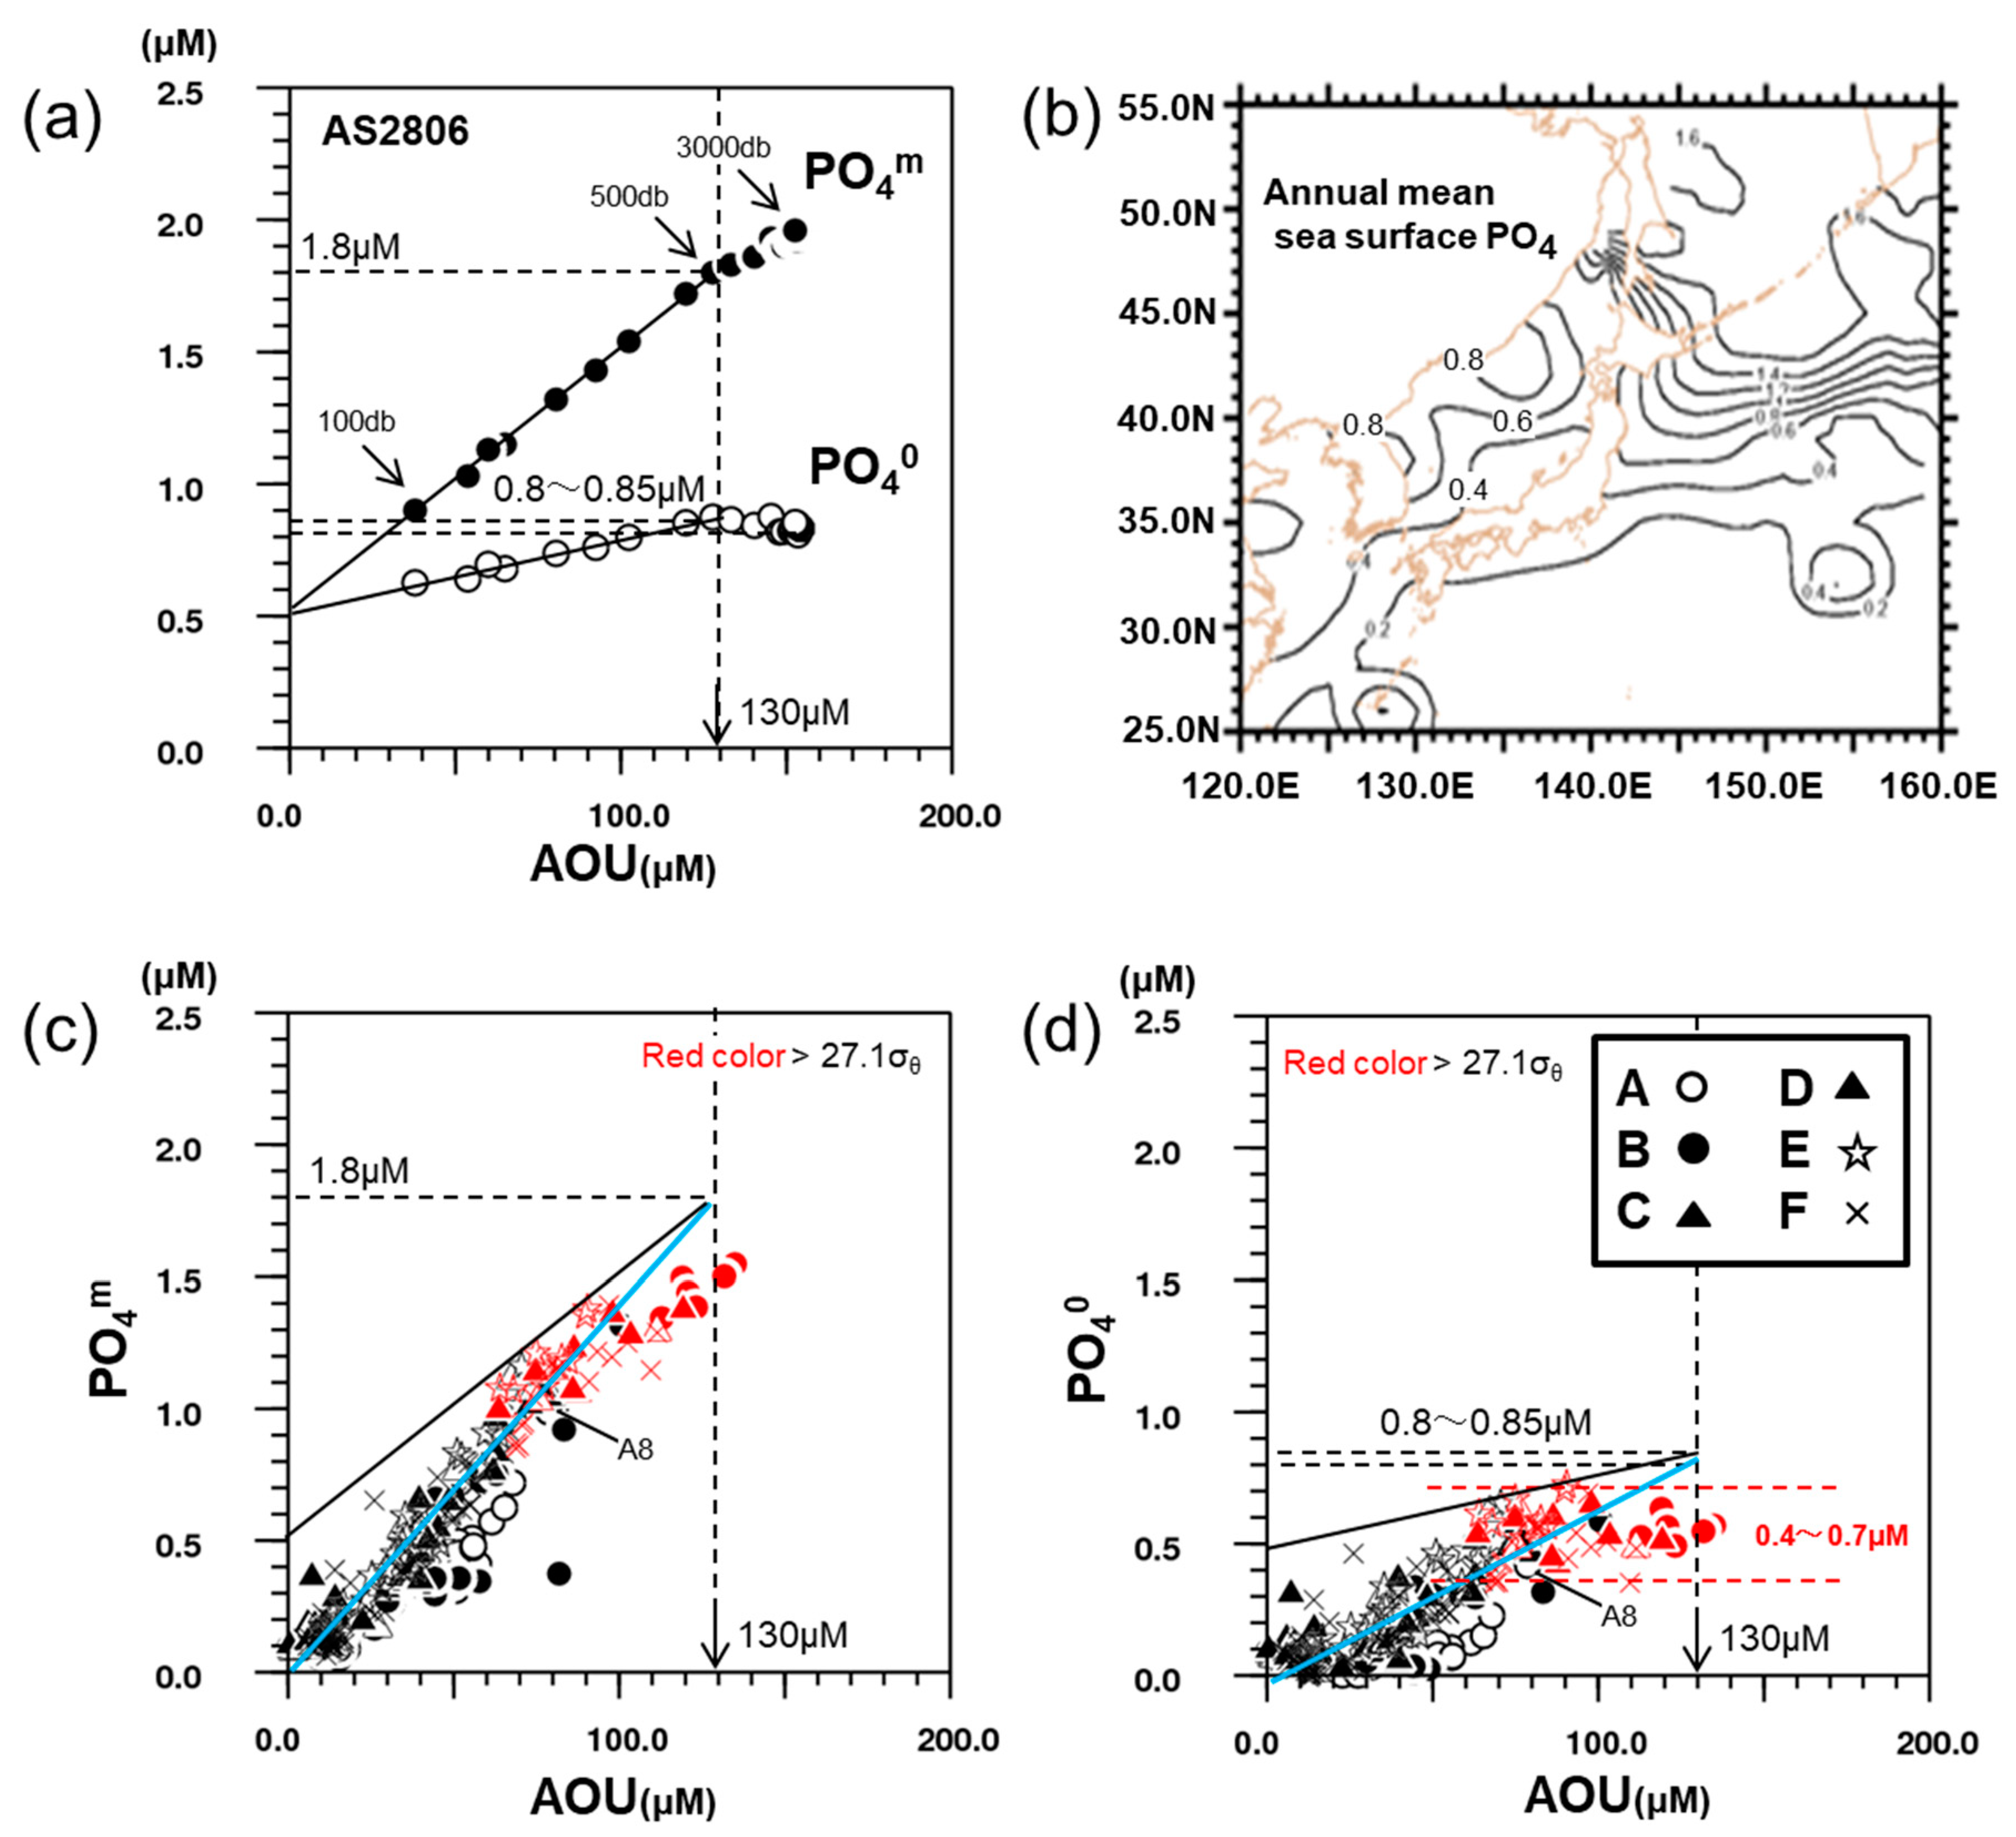
At first, let’s present the standard PO4-AOU relationship unaffected by the TWC. Figure 10a shows the PO4m-AOU and PO40-AOU plots for all samples from subsurface (100 db) to bottom (3000 db) at AS2806 in December of 2011. This observation point locates in the deepest basin in the Japan Sea (Japan Basin) and north of the TWC’s northern boundary (polar front). Higher-AOU (>130 μM) region in the deep layer (>500 db) shows a slope of PO4m -AOU almost equal to the Redfield ratio (1:138) and a zero-slope of PO40 -AOU (the constant value of 0.8–0.85 μM), while lower-AOU region in the upper layer (<500 db) shows a steeper PO4m -AOU slope (1:100) than the slope of deeper water (>500 db). Both of PO4m and PO40 for the upper layer, however, clearly exhibit a good linear correlation with AOU, and the same intercept of about 0.5 μM at AOU = 0 μM. These relations imply that the deep layer with the constant PO40 is related with the JSPW, and the gradual increase of PO40 (or PO4m) would be produced by the apparent conservative mixing of two water masses—the in-situ surface water with PO4 of 0.5 μM and the JSPW with high PO40 of 0.8–0.85 μM.
These end-members can be found in the annual-mean distribution map of sea surface PO4 in the Japan Sea (Figure 10b), which is referred from the report of [14]. Generally, the surface PO4 in the northern half region of the Japan Sea is higher than that in the southern TWC region. And the PO40 = 0.8–0.85 μM of JSPW agrees with the surface PO4 > 0.8 μM in the northern coastal area of the Japan Sea. Such a distribution is consistent with the origin of JSPW, which is formed by the sinking of northern surface cooling water in winter. The site location of AS2806 is between the contour lines of 0.4 μM and 0.6 μM on this map. This value is not contradictory to the estimated PO4 of 0.5 μM for the surface water at AS2806.
The PO4-AOU relationship in the TWC region is discussed on the basis of the above information for original water of JSPW. Figure 10c,d show the PO4m-AOU and PO40-AOU plots for the upper layer (<300 db) including all samples in lines A to F, respectively. Different symbols are used to represent the points in different lines, and the PO4-AOU relationship with the water mass beneath the TWC (σθ > 27.1) is in red color. Our observations in June were carried out after the spring bloom, so both of surface PO4 and AOU at all stations show nearly zero value. For comparison, a linear line is given to assume the vertical mixing between the surface water (PO4 = AOU = 0 μM) and the JSPW (PO4m = 1.8 μM and PO40 = 0.8–0.85 μM at AOU = 130 μM) by blue color.
Although the data is scattered, the ratio of PO4/AOU for the upper layer (σθ < 27.1) almost coincide with the blue line which suggests the vertical mixing (Figure 10c,d). The data in upstream lines (lines A and B with symbols of ○ and ●, respectively) seem to be more scattered. Probably, these waters near the Tsushima Strait may be influenced by the lateral advection of different water masses from the East China Sea. These upstream waters (Lines A,B) are mixed with the TWC, the North Korea Cold Current and the water from East China Sea, so a two end-member mixing liner line between the surface water and the JSPW cannot coincide its variations. On the other hand, PO40 of waters beneath the TWC (σθ > 27.1) shows an almost constant value of 0.4–0.7 μM at all the stations (Figure 10d), i.e., the PO4m/AOU ratio exhibits nearly equal to the Redfield ratio (Figure 10c). It is found that the sea surface water with PO40 of 0.4–0.7 μM is distributed around the central sea area north of the TWC (Figure 10b). These results suggest that the origin of water beneath the TWC is the same water mass. The water mass is probably formed at somewhere sea surface area between northern coastal area and the north of the TWC, and gradually intrudes beneath the TWC from the offshore side.
4. Discussions
To further discuss and elucidate the dynamic mechanism of the water mass beneath the TWC, the schematic diagram for the behavior of water mass along the north-south cross-section in the Japan Sea is shown in Figure 11. The upper layer water and deep water mixing occurs at intermediate depth (between Smax layer and Smin layer) and bottom (about 3000 db), respectively. In this figure, the depth about 500 db corresponds to the salinity-maximum layer and also the upper-limit depth of JSPW with almost constant PO40 (0.8–0.85 μM). The JSPW originates from the sinking surface water with PO4 > 0.8 μM. The upper and lower limits of the intruding intermediate water beneath the TWC are characterized by the Smin and Smax layers, respectively. We infer that the intermediate waters with different dissolved O2 are consisted of the same water mass originating from the sinking surface water with PO4 of 0.4–0.7 μM, which seems to form at somewhere north of the TWC.
The distribution of dissolved oxygen denotes that seawater mixing occurs in the middle depth. As the seawater flowing to the shore side, the dissolved O2 of this intermediate water is gradually consumed due to the plankton respiration during the intrusion, and hence the water with high/low dissolved O2 appears on the offshore/coastal side, respectively. Such behavior of the intruding water accompanied with the dissolved-O2 consumption can explain the reason why the “falsehood” coastal upwelling of the deep water with low dissolved O2 is seen in Figure 2d: In the intermediate water, there is a new water of high dissolved oxygen on the offshore side, and an old water of low dissolved oxygen on the inshore side, simultaneously. The “falsehood” upwelling of the low dissolved oxygen along the coast, which is actually caused by the consumption of dissolved oxygen during the lateral advection of the water mass beneath the TWC.
In this investigation, the main finding is that we successfully deduce the origin of the water beneath the TWC using the PO40 as a biogeochemical tracer, especially for the intermediate water of the Japan Sea where the T and S changes are very small. However, the primary shortage is that the annual-mean distribution map of sea surface PO4 in the Japan Sea may impact on our results. In the future, the efforts should be made to obtain more precise observations of annual-mean distribution of sea surface PO4 for exploring this issue.
5. Summary
The objective of this study is to examine the behavior of water mass beneath the TWC through the spatial distributions of observed dissolved O2 and PO4 in the Japan Sea. The precise PO4-AOU relationship is a useful tool to better understand the original water and the mixing process between two water masses. Because the PO40 is the conservative property or constant for different water masses, which is widely used as a tracer for studying water mass movement. Thus, it was examined in the Japan Sea for both the upper layer and deep layer to provide a better understanding of the water behaviors beneath the TWW. A previous linearity in the relationship was plotted in these figures. The intercept of the vertical axis indicates measured phosphate or preformed phosphate, the line correspond to the ratio of PO4/AOU. Kudo et al. (1996) [7] explain that the defined preformed fractions between surface and deep water were shown as a result of the physical mixing of these water masses. It can be inferred that PO4 in intermediate water was originated from the central surface waters in the Japan Sea, and the PO4 in bottom water was generated from the Japan Sea surface northern waters.
In the future, we hope to further explore this behavior of water mass beneath of the TWC in ocean dynamics. Also we will simulate this behavior using some advanced numerical models.
Author Contributions
Conceptualization, Y.I.; methodology, Y.I., I.K.; software, X.F.; validation, X.F. and I.K.; formal analysis, Y.I., I.K.; investigation, X.F., K.I., Y.I., I.K., and T.A.; resources, Y.I., N.E., I.K., T.A.; data curation, X.F.; writing—original draft preparation, X.F.; writing—review and editing, Y.I.; visualization, X.F.; supervision, Y.I.; project administration, Y.I., I.K.; funding acquisition, Y.I., X.F. All authors have read and agreed to the published version of the manuscript.
Funding
A part of this work was supported by the Environment Research
and Technology Development Fund of the Ministry of the Environment,
Japan (A-1002).
Acknowledgments
The data used in the study were obtained from the
observations by T/V Oshoro Maru of the Hokkaido University. We wish to
thank all the crew members on the T/V Oshoro Maru for their hard works.
We would also like to thank the reviewers for their thoughtful suggestions.
Conflicts of Interest
The authors declare no conflict of interest.
Appendix A
The saturation of dissolved oxygen (O2*) is calculated with the potential temperature T and salinity S as follows:
where T is the absolute temperature (T = 273.15 + t (°C), Kelvin) and S is salinity. The coefficients A and B are listed in Table A1.

Table A1.
Coefficients A and B for calculating the dissolved oxygen saturation.
| Coefficient A (mL L−1) | Coefficient B (mL L−1) |
| A1 = −173.4292 A2 = 249.6339 A3 = 143.3483 A4 = −21.8492 | B1 = −0.033096 B2 = 0.014259 B3 = −0.001700 |
Appendix B
The Redfield et al. (1963) [11] equation for the production (or respiration) of average marine plankton has been used in oceanography for deriving dynamically passive conservative tracers (e.g., ‘NO’ and ‘PO’ [15,16]). The traditional P/O2 Redfield ratio of 1:138, based on planktonic decomposition studies [17], was inferred by effectively assuming an organic matter stoichiometric composition. However, recent studies have shown different ratios of this traditional value (Table A2).
Takahashi et al. (1985) [18] examined the correlated changes in nutrients on isopycnals in the thermocline and concluded that the actual P/O2 ratio there was at a higher value of 172. Broecker et al. (1985) [16] and Peng and Broecker (1987) [19] extended this finding by asserting that the P/O2 ratio was near 175 not only in the thermocline, but at all depths throughout the entire world ocean. In contrast, Minster and Boulahdid (1987) [20] and Boulahdid and Minster (1989) [21], using the same data, suggested that the P/O2 ratio was near 172 in the thermocline, and decreased with depth to approximately 115 in all oceans. Chen et al. (1996) [22] firstly calculated the preformed PO4 in the Japan Sea and reported that the Redfield P/O2 ratio in the East Asian Marginal Sea (including the Japan Sea) was approximately 1:121 ± 7.
As each study contradicts to a previous one, we feel that the Redfield ratio is sensitive to observations in sea area and water depth. As Chen (1996) [13] pointed out, deviation of the P/O2 ratio from the Redfield ratio may affect the estimated PO40 value. However, if a certain P/O2 ratio different from the traditional Redfield ratio was maintained in the sea area, it is considered that PO40 can be treated as an absolute value (conservative component) with a certain bias. In a word, according to these different ratios, we think this ratio is a fixed value with a certain bias from the traditional ratios. Thus, we use an averaged traditional ratio of 1:138 to estimate PO40 as a tracer in this study.
Table A2.
Stoichiometric Redfield ratios for consumption of O2 and production of P during respiration in the ocean. All values are relative to a phosphorus value of 1.0.
Table A2.
Stoichiometric Redfield ratios for consumption of O2 and production of P during respiration in the ocean. All values are relative to a phosphorus value of 1.0.
| Source | P | O2 | Area | Depth |
|---|---|---|---|---|
| Redfield et al., 1963 [11] | 1.0 | 138 | Atlantic Ocean | in ocean deep waters |
| Takahashi et al., 1985 [18] | 1.0 | 172 | Atlantic and Indian ocean | in the deep ocean |
| Broecker et al., 1985 [16]; Peng and Broecker, 1987 [19] | 1.0 | 175 | entire world ocean | all depths |
| Minster and Boulahdid, 1987 [20]; Boulahdid and Minster, 1989 [21] | 1.0 | 172 | in all oceans | decreased with depth to approximately 115 |
| Anderson and Sarmiento, 1994 [12] | 1.0 | 170 ± 10 | Pacific basins | between 400 and 4000 m depth |
| Anderson, 1995 [23] | 1.0 | 140 − 160 | ||
| Chen et al., 1996 [22] | 1.0 | 196 ± 27 | marginal seas of the northwest Pacific | |
| Chen et al., 1996, GRL [13] | 1.0 | 121 ± 7 | beneath the thermocline in Japan Sea | 1:125 ± 5 for waters deeper than 2000 m |
| Kortzinger et al., 2001 [24] | 1.0 | 165 ± 15 | surface ocean | surface ocean |
| Hedges et al., 2002 [25] | 1.0 | 154 | global ocean |
References
- Uda, M. The results of simultaneous oceanographic investigations in the Japan Sea and its adjacent waters in May and June. J. Imp. Fish. Exp. Sta. 1934, 5, 57–190. (In Japanese) [Google Scholar]
- Talley, L.; Min, D.-H.; Lobanov, V.; Luchin, V.; Ponomarev, V.; Salyuk, A.; Shcherbina, A.; Tishchenko, P.; Zhabin, I. Japan/East Sea water masses and their relation to the sea’s circulation. Oceanography 2006, 19, 32–49. [Google Scholar] [CrossRef] [Green Version]
- Senjyu, T.; Sudo, H. Interannual variation of the upper portion of the Japan Sea Proper Water and its probable cause. J. Oceanogr. 1996, 52, 27–42. [Google Scholar] [CrossRef] [Green Version]
- Watanabe, T.; Hirai, M.; Yamada, H. High-Salinity intermediate water of the Japan Sea in the eastern Japan Basin. J. Geophy. Res. 2001, 106, 11437–11450. [Google Scholar] [CrossRef]
- Yoshikawa, Y.; Awaji, T.; Akimoto, K. Formation and circulation processes of intermediate water in the Japan sea. J. Phys. Oceanogr. 1999, 29, 1701–1722. [Google Scholar] [CrossRef]
- Boyle, E.A. Cadmium: Chemical tracer of deep water paleoceanography. Paleoceanogr. Paleoclimatol. 1988, 3, 471–489. [Google Scholar] [CrossRef]
- Kudo, I.; Kokubun, H.; Matsunaga, K. Cadmium in the southwest Pacific Ocean two factors significantly affecting the Cd-PO4 relationship in the ocean. Mar. Chem. 1996, 54, 55–67. [Google Scholar] [CrossRef]
- Morel, F.M.M.; Hudson, R.J.M. The geobiological cycles of trace elements in aquatic systems: Redfield revisited. In Chemical Processes in Lakes; Stumm, W., Ed.; Interscience Publishers: New York, NY, USA, 1985; pp. 251–281. [Google Scholar]
- Gruber, N.; Sarmiento, J.L.; Jin, X.; Dunne, J.P.; Armstrong, R.A. Diagnosing the contribution of phytoplankton functional groups to the production and export of particulate organic carbon, CaCO3, and opal from global nutrient alkalinity distributions. Glob. Biogeochem. Cycles 2006, 20, GB2015. [Google Scholar] [CrossRef] [Green Version]
- Emerson, S.; Hedges, J.H. Chemical Oceanography and the Carbon Cycle; Cambridge University Press: Cambridge, UK, 2008. [Google Scholar] [CrossRef]
- Redfield, A.C.; Ketchum, B.H.; Richards, F.A. The influence of organisims on the composition of seawater. In The Sea: Ideas and Observations on Progress in the Study of the Seas; Hill, M.N., Ed.; Interscience Publishers: New York, NY, USA, 1963; Volume 2, pp. 26–77. [Google Scholar]
- Anderson, L.A.; Sarmiento, J.L. Redfield ratios of remineralization determined by nutrient data analysis. Glob. Biogeochem. Cycles 1994, 8, 65–80. [Google Scholar] [CrossRef]
- Chen, C.-T.A.; Gong, G.-C.; Wang, S.-L.; Bychkov, A.S. Redfield ratios and regeneration rates of particulate matter in the Sea of Japan as a model of closed system. Geophys. Res. Lett. 1996, 23, 1785–1788. [Google Scholar] [CrossRef]
- Oguma, S.; Usui, T. Guide for Data Quality Control of Oceanic CO2-Related Data. Available online: https://www.jodc.go.jp/jodc_pub/manual/Ocean_CO2_QC.pdf (accessed on 30 July 2020).
- Broecker, W.S. “NO”, a conservative water-mass tracer. Earth Planet. Sci. Lett. 1974, 23, 100–107. [Google Scholar] [CrossRef]
- Broecker, W.S.; Takahashi, T.; Takahashi, T. Sources and flows patterns of deep-ocean waters as deduced from potential temperature, salinity, an initial phosphate concentration. J. Geophys. Res. 1985, 90, 6925–6939. [Google Scholar] [CrossRef]
- Fleming, R.H. The composition of plankton and units for reporting population and production. In Proceedings of the Sixth Pacific Science Congress, Berkeley, CA, USA, 17 November 1939; University of California Press: Berkeley, CA, USA, 1940; pp. 535–540. [Google Scholar]
- Takahashi, T.; Broecker, W.S.; Langer, S. Redfield ratio based on chemical data from isopycnal surfaces. J. Geophys. Res. Space Phys. 1985, 90, 6907. [Google Scholar] [CrossRef]
- Peng, T.-H.; Broecker, W.S. C/P ratios in marine detritus. Glob. Biogeochem. Cycles 1987, 1, 155–161. [Google Scholar] [CrossRef]
- Minster, J.-F.; Boulahdid, M. Redfield ratios along isopycnal surfaces—A complementary study. Deep Sea Res. 1987, 34, 1981–2003. [Google Scholar] [CrossRef]
- Boulahdid, M.; Minster, J. Oxygen consumption and nutrient regeneration ratios along isopycnal horizons in the Pacific Ocean. Mar. Chem. 1989, 26, 133–153. [Google Scholar] [CrossRef]
- Chen, C.-T.A.; Lin, C.-M.; Huang, B.-T.; Chang, L.-F. Stoichiometry of carbon, hydrogen, nitrogen, sulfur and oxygen in the particulate matter of the western North Pacific marginal seas. Mar. Chem. 1996, 54, 179–190. [Google Scholar] [CrossRef]
- Anderson, L.A. On the hydrogen and oxygen content of marine phytoplankton. Deep Sea Res. 1995, 42, 1675–1680. [Google Scholar] [CrossRef]
- Körtzinger, A.; Koeve, W.; Kähler, P.; Mintrop, L. C:N ratios in the mixed layer during the productive season in the northeast Atlantic Ocean. Deep Sea Res. 2001, 48, 661–688. [Google Scholar] [CrossRef]
- Hedges, J.; Baldock, J.; Gélinas, Y.; Lee, C.; Peterson, M.; Wakeham, S. The biochemical and elemental compositions of marine plankton: A NMR perspective. Mar. Chem. 2002, 78, 47–63. [Google Scholar] [CrossRef]
Figure 1.
Bottom topography and hydrographic stations used in the study.

Figure 2.
Vertical cross-sections of (a) potential temperature(θ), (b) potential density (σθ), (c) salinity (S), (d) dissolved oxygen (O2) in the Japan Sea along line SM. Red solid line, red broken line and blue broken line indicate σθ of 27.0, salinity maximum (Smax) and minimum (Smin).
Figure 2.
Vertical cross-sections of (a) potential temperature(θ), (b) potential density (σθ), (c) salinity (S), (d) dissolved oxygen (O2) in the Japan Sea along line SM. Red solid line, red broken line and blue broken line indicate σθ of 27.0, salinity maximum (Smax) and minimum (Smin).

Figure 3.
Horizontal distributions of temperature around the Tsushima/Korean Strait, at the depths of 50 m and 100 m.
Figure 3.
Horizontal distributions of temperature around the Tsushima/Korean Strait, at the depths of 50 m and 100 m.

Figure 4.
The Horizontal distributions of temperature at the depths of 100 m and 200 min the sea area from the Tsugaru Strait to the west of Hokkaido.
Figure 4.
The Horizontal distributions of temperature at the depths of 100 m and 200 min the sea area from the Tsugaru Strait to the west of Hokkaido.

Figure 5.
A quick map of the horizontal distributions of temperature at the depths of 100 m and 200 m.
Figure 5.
A quick map of the horizontal distributions of temperature at the depths of 100 m and 200 m.

Figure 6.
Relationships of (a,c) θ-S, (b) O2-θ and (d) O2-O2%. Slashes in Figure 6a,c are potential density σθ and O2%, respectively.
Figure 6.
Relationships of (a,c) θ-S, (b) O2-θ and (d) O2-O2%. Slashes in Figure 6a,c are potential density σθ and O2%, respectively.

Figure 7.
Vertical cross-sections of θ, σθ, S, O2 and O2% along line A and B in June 2011.

Figure 8.
Vertical cross-sections of θ, σθ, S, O2 and O2% along lines C to F in June 2011.

Figure 9.
The vertical profile of O2 and O2% along line A, and the vertical cross-sections of O2 and O2% along lines B to F where the depth is represented by σθ.
Figure 9.
The vertical profile of O2 and O2% along line A, and the vertical cross-sections of O2 and O2% along lines B to F where the depth is represented by σθ.

Figure 10.
(a) The PO4m-AOU and PO40-AOU plots for all samples from subsurface (100 db) to bottom (3000 db) at AS2806 in December of 2011; (b) the annual mean distribution map of sea surface PO4 in the Japan Sea; (c,d) the PO4m-AOU and PO40-AOU plots for the upper layer (<300 db), including all samples in lines A to F.

Figure 11.
Schematic diagram for the behavior of the water mass beneath the TWC.

Table 1.
Water Masses and Structures, Identifying Characteristics, and Source.
| Water Mass | Distinguishing Characteristic | Source |
|---|---|---|
| Tsushima Warm Water (TWW) | Vertical salinity maximum in upper 150 m | Tsushima Strait inflow, local evaporation and subduction |
| Japan/East Sea Intermediate Water (JSIW) | Vertical salinity minimum in upper ocean | Subduction of fresh subpolar water southward across the Subpolar Front |
| High-Salinity Intermediate Water (HSIW, Upper Japan Sea Proper Water, UJSPW) | Vertical salinity maximum between 200–500 m | Convective cooling of Tsushima Warm Water in the northeast subpolar gyre |
| Japan Sea Proper Water | Vertically homogeneous water between the salinity maximum and bottom layer | Convective cooling of water in the northern subpolar gyre |
© 2020 by the authors. Licensee MDPI, Basel, Switzerland. This article is an open access article distributed under the terms and conditions of the Creative Commons Attribution (CC BY) license (http://creativecommons.org/licenses/by/4.0/).
Share and Cite
MDPI and ACS Style
Fang, X.; Isoda, Y.; Kudo, I.; Aramaki, T.; Imai, K.; Ebuchi, N. Behavior of Water Mass Beneath the Tsushima Warm Current in the Japan Sea. Water 2020, 12, 2184. https://doi.org/10.3390/w12082184
AMA Style
Fang X, Isoda Y, Kudo I, Aramaki T, Imai K, Ebuchi N. Behavior of Water Mass Beneath the Tsushima Warm Current in the Japan Sea. Water. 2020; 12(8):2184. https://doi.org/10.3390/w12082184
Chicago/Turabian StyleFang, Xiaorong, Yutaka Isoda, Isao Kudo, Takafumi Aramaki, Keiri Imai, and Naoto Ebuchi. 2020. "Behavior of Water Mass Beneath the Tsushima Warm Current in the Japan Sea" Water 12, no. 8: 2184. https://doi.org/10.3390/w12082184
Note that from the first issue of 2016, this journal uses article numbers instead of page numbers. See further details here.