The State of HiPco Single-Walled Carbon Nanotubes in 2019
by
 , , ,
, , ,
Varun Shenoy Gangoli
1,* ,
,
M. Anto Godwin
2,
Gadhadar Reddy
2,
Robert Kelley Bradley
2,3 and
Andrew R. Barron
1,4,5,*
1
Department of Chemistry, Rice University, Houston, TX 77005, USA
2
NoPo Nanotechnologies India Private Limited, Bangalore, Karnataka 560100, India
3
Department of Industrial Engineering, Lamar University, Beaumont, TX 77705, USA
4
Department of Materials Science and Nanotechnology, Rice University, Houston, TX 77005, USA
5
Energy Safety Research Institute, Swansea University Bay Campus, Swansea SA1 8EN, UK
*
Authors to whom correspondence should be addressed.
C 2019, 5(4), 65; https://doi.org/10.3390/c5040065
Submission received: 25 September 2019
/
Revised: 22 October 2019
/
Accepted: 23 October 2019
/
Published: 28 October 2019
(This article belongs to the Collection Carbon in the Circular Economy)
Abstract
:High-pressure carbon monoxide (HiPco)-synthesized single-walled carbon nanotubes (SWCNTs) have been a widely studied carbon nanomaterial for nearly two decades. It has been the de facto standard for SWCNT research, be it functionalization, separation and purification, or composites, as a result of the consistent, high-quality material that was made available at an affordable price to researchers worldwide. The recent shutdown of the HiPco reactor at Rice University has resulted in a scarcity of HiPco material available to the research community, and a new source of similar SWCNTs is desperately needed. Continued research and development on the design, materials used, and the overall process have led to a new HiPco material, referred to as NoPo HiPCO®, as an alternative to the erstwhile Rice HiPco SWCNTs. In this work, we have compared the two HiPco materials, and aim to provide more clarity for researchers globally on the state of HiPco SWCNTs for research and applications alike in 2019.
1. Introduction
Carbon nanotubes have been at the forefront of materials research for the better part of three decades now, with single-walled carbon nanotubes (SWCNTs) taking precedence over their multi-walled variants. Indeed, a major part of this interest has been due to the unique electronic properties possessed by SWCNTs, dictated by the chirality of the individual carbon nanotube [1,2], that has led to potential applications including solar power [3], fuel cells [4], water filtration [5], and thin-film transistors [6]. As-synthesized SWCNTs have also been further analyzed via various methods of separation to develop enriched ensembles of metallic- and semiconducting-SWCNTs [7], to further facilitate research and a move from the lab to the retail market. Synthesis of SWCNTs has thus always been key in progressing this field of research, with various techniques having been developed for this, including arc discharge [8,9], laser ablation [10,11], and chemical vapor deposition (CVD) [12,13,14].
All three of these processes have been successfully used for commercial SWCNT synthesis; however, CVD offers the most control over the final product when it comes to chirality and diameter alike. One specific approach of the CVD process was the high-pressure carbon monoxide (HiPco) gas-phase synthesis of SWCNTs developed at Rice University in Houston, TX in the early 2000s [15]. This method, resulting in the catalytic production of SWCNTs via the decomposition of Fe(CO)5 in the presence of a continuous flow of carbon monoxide at high temperature and pressure, has been synonymous with SWCNT research due to the university providing a stable, inexpensive supply of consistent, high-quality SWCNTs for researchers and companies around the world.
HiPco SWCNTs continue to be the de-factor standard even in 2019; however, things are quickly turning as a result of the reactor, associated IP, and all remaining stock of HiPco SWCNTs being sold by Rice University to Atom OptoElectronics, Inc. [16] as the sole-supplier of the remaining materials (at $899/g compared to the $150–250 when available directly from Rice University). The expiration of the core patents for the HiPco process combined with a typical 25–30 wt% residual metal catalyst impurity [17], create the potential for a new source of less expensive, high-quality HiPco SWCNTs available globally.
Erstwhile members of the Smalley group at Rice University, which developed the original HiPco process, helped create a new entity (NoPo Nanotechnologies, India), which aims to update the HiPco process using information developed over the last decade, and produce what they call NoPo HiPCO® SWCNTs, which are herein termed NoPo HiPco SWCNTs for consistency of naming. Since variability in SWCNT sources can make a change in research results (due to catalyst residue content, diameter and chirality distribution, and length), making back-to-back comparisons between batches is critical for researchers to obtain reproducible results, it is in the interest to all researchers to understand how the presently available NoPo HiPco SWCNTs compare to historically available Rice HiPco SWCNTs that have been the subject of a great range of academic studies. Here, we report a detailed comparison of the two HiPco materials to provide a baseline for researchers.
2. Experimental Section
2.1. Materials
Raw HiPco SWCNTs were obtained from Atom Optoelectronics, Inc. (HPR 194.3, formerly a collective batch synthesized at Rice University, Houston, TX, USA) and used as such without further modification. A sample set of NoPo HiPco SWCNTs (Batch Dec 2017) was provided by NoPo Nanotechnologies India (Bangalore, Karnataka, India) and used as such without further modification. All SWCNT nanomaterials were handled in a safe manner as described previously [18].
2.2. NoPo HiPco Growth
The modified NoPo HiPco reactor was designed to be the first all-metal HiPco reactor (the reaction zone is also made of metals), which operates at a high pressure (30–50 atm) and temperature (900–1100 °C). Carbon monoxide was used as the carbon source for the process. Iron and/or nickel carbonyl was used as the catalyst precursor such that, when the catalyst is introduced to the high temperature, it starts to decompose and forms the metal catalyst particles. The metal catalyst acts as the SWCNT seed via the Boudouard reaction, which led to the growth of nanotubes via disproportionation [19].
Since both the catalyst and source are in the gas phase, the reactor can be run continuously for long periods of time, which helps in industrial scale production on the order of 0.5 g-SWCNT/hour/reactor, with scaling coming in the form of multiple such reactors running in parallel as needed.
2.3. Preparing Surfactant-Stabilized Dispersions
While the two HiPco SWCNT samples were characterized as-is in solid form, knowing the chiral distribution of the SWCNTs without the CNT bundles, amorphous carbon, and residual catalyst interference is also of critical importance in the scope of this work. As such, surfactant-stabilized aqueous dispersions of both were prepared using a previously described method [7]. Specifically, 20 mg of each of the two SWCNT samples was separately dispersed in a 2 wt% SDS aqueous solution (20 mL) at an initial SWCNT concentration of 1 g—SWCNT/L—solution. Bath sonication using a Cole-Palmer (Vernon Hills, IL, USA) 60W ultrasonic cleaner (Model #08849-00) for 30 min was followed by probe sonication for 2 h using a Cole-Palmer 500 W ultrasonic processor (Model #CPX-600, ¼” probe, 35% amplitude) at a water bath temperature of 15 °C. A sample of the resulting suspension (10 mL) was ultracentrifuged in a PN 7030 centrifuge tube from Seton Scientific for 2 h at 208,400 G (average) using a Sorvall Discovery 100SE ultracentrifuge (now part of ThermoFisher Scientific, MA, USA) with a TH-641 swinging-bucket-type titanium rotor, which removed large SWCNT bundles and SWCNT impurities. The upper 7.5 mL of the supernatant was used as the stock SWCNT suspension for characterization.
2.4. Characterization
Atomic force microscopy was conducted on the as-produced HiPco SWCNT samples using a Bruker Multimode 8 in tapping mode (semi-contact). The samples were dispersed on a piece of plasma-etched silica (WaferWorld, FL, USA), and several 2 × 2 um scans were conducted with height analysis performed using Nanoscope Analysis version 1.50 for a statistical measurement of CNT diameter using a minimum of 500 individual CNTs per sample. The samples were then deposited onto C-Flat™ carbon grids (Electron Microscopy Sciences, Inc., Hatfield, Pennsylvania) by making physical contact at a random point in the carbon nanomaterial, and imaged using a cold cathode JEOL (Peabody, MA, USA) 2100F TEM operated at 200 KV. Scanning electron microscopy (SEM) energy-dispersive X-ray spectra (EDS) were collected using an FEI Quanta 400 ESEM (now part of ThermoFisher Scientific, MA, USA) equipped with an EDAX™ spectrometer. Elemental quantification was obtained using the ZAF (standard-less) method available in the EDAX Genesis™ application. Thermogravimetric analysis (TGA) was conducted on a TA Instrument SDT Q600 (MA, USA). The samples (5 mg each) were run in an open alumina crucible under continuous air flow of 50 mL/min with a heating ramp rate of 10 °C/min from room temperature (25 °C) to 800 °C. Raman spectra were collected using a Renishaw inVia™ Raman microscope (Wotton-under-Edge, UK) equipped with 514, 633, and 785 nm lasers and a Leica (Leica Microsystems, Buffalo Grove, IL, USA) PL Fluortar L50 × 0.55 long working distance objective lens. Raman laser excitation powers were determined by increasing laser irradiance until the spectral transition from baseline noise to a weak signal-to-noise ratio of ~3 at ca. 1600 cm−1 Raman shift was observed. The as-produced samples were placed on a transparent microscopy glass slide, and at least three measurements were performed for each distinct sample at room temperature and atmospheric pressure, with an exposure time of 60 s with each measurement collected across 15 accumulations in a spectral range of 100–3200 cm−1. UV-vis-NIR absorption spectroscopy of the liquid dispersion samples was performed using a Shimadzu UV-3101PC double-beam-scanning spectrophotometer (Houston, TX, USA) in the range of 400–1350 nm with 1 nm interval and a quartz cuvette (10 mm path length).
3. Results and Discussion
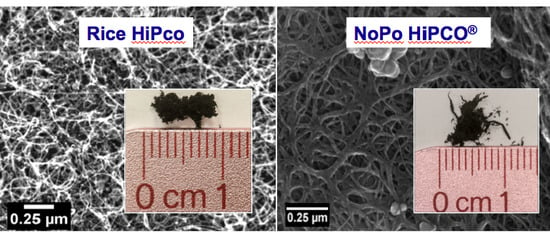
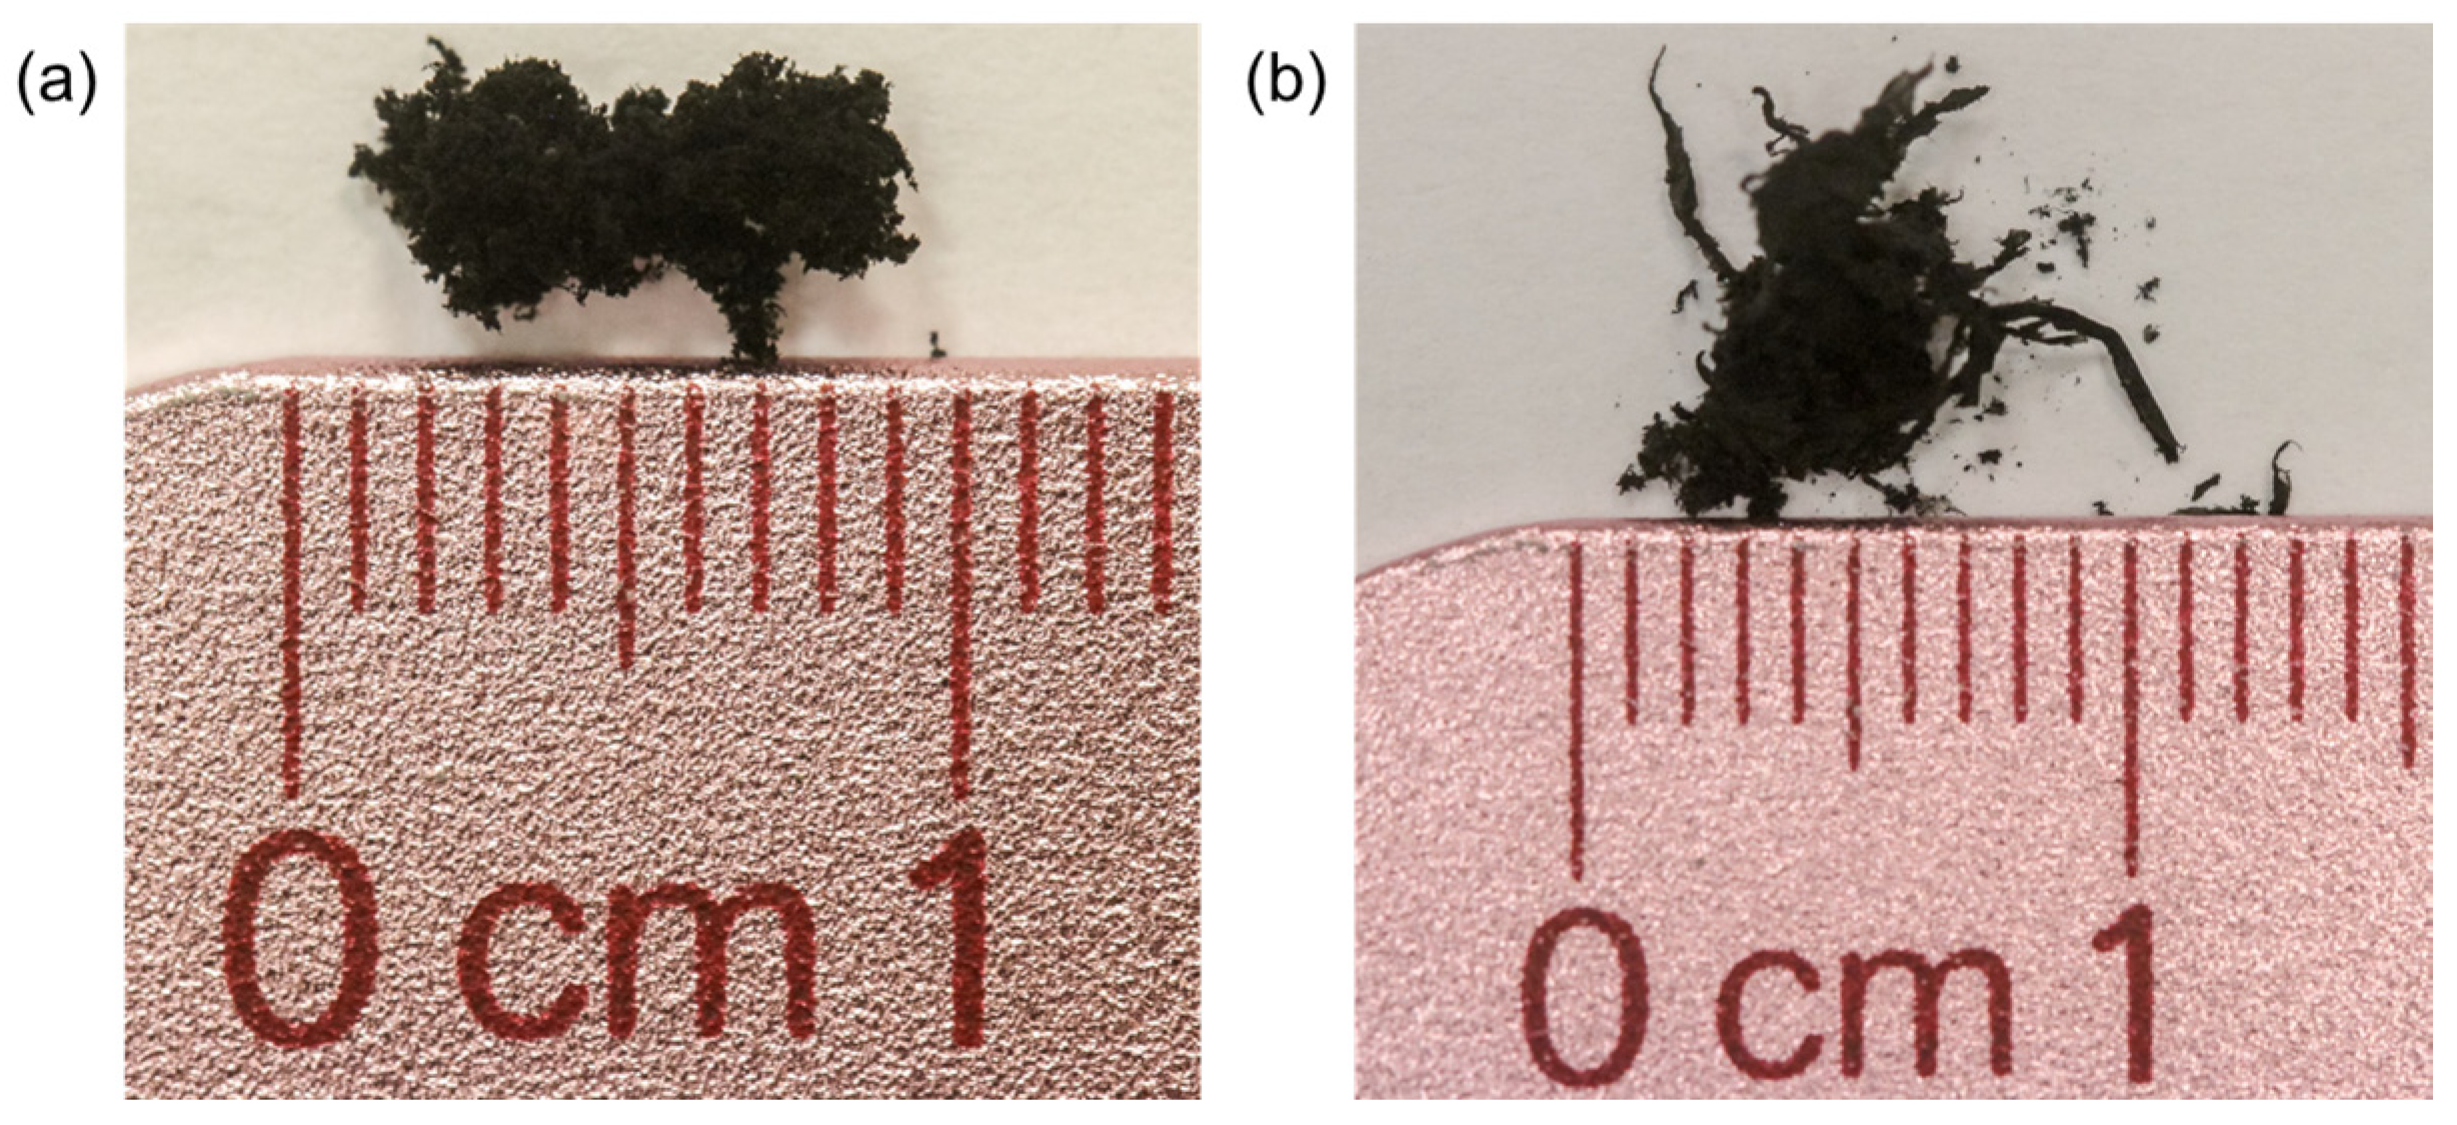
A photograph of the as-prepared NoPo HiPco SWCNTs is shown in Figure 1 in comparison to the Rice HiPco SWCNTs. The as-received physical appearance is of importance with regard to handling and as may be seen, they are both bulk low-density nanomaterials. However, the Rice HiPco SWCNTs come available in a more porous and powder-nature, with a measured average bulk density of 0.09 g/cm3 which made it fluffier and harder to handle relative to the NoPo HiPco SWCNTs that have an average bulk density of 0.11 g/cm3 and also a longer, Bucky paper-like consistency for most of the product. It is still suggested that the handling precautions for the NoPo HiPco SWCNTs should be considered similar to the Rice SWCNTs [18].
Tapping-mode atomic force microscopy (AFM) analysis of ca. 500 nanotubes of each HiPco sample was used to determine the diameter distribution, revealing the predominant presence of SWCNTs in both samples. A typical example of the analysis done for both samples is shown in Figure 2. The NoPo sample had an average diameter of 0.86 ± 0.1 nm, while Rice University’s sample (batch HPR 194.3) had a slightly larger average diameter, 0.97 ± 0.1 nm.
TEM imaging, with some examples shown in Figure 3, supports the AFM measurements, with the NoPo HiPco samples having smaller diameter SWCNTs (0.88 ± 0.1 nm across ca. 50 CNTs) relative to those from Rice University (0.96 ± 0.09 nm across ca. 50 CNTs). SEM images collected during EDS analysis (Figure 4) also showed a thick net of CNTs in both samples, with the NoPo HiPco sample showing thicker bundles and more pristine, individual SWCNTs with residual metal catalyst showing up as large, more discrete chunks instead.
EDS elemental analysis for both samples (Table 1) showed a typical SWCNT composition with a majority of carbon, as expected, followed by residual iron catalyst and oxygen associated with both the CNT side walls and catalyst alike [20,21]. The Rice HiPco sample (HPR 194.3) typically had a higher fraction of residual catalyst as compared to the NoPo HiPco sample. We note that certain “starved-catalyst” batches prepared as research experiments with the Rice HiPco reactor have had much lower iron content (~10 wt%). These batches were never sold as a retail product, however, and the use of HPR 194.3 was deliberately chosen to help represent the average Rice University HiPco product used by a wider group of researchers.
Thermogravimetric analysis (TGA, Figure 5) corroborated the results from EDS elemental analysis, with a final residue of 30 wt% and 18.4 wt% for the Rice University and NoPo HiPco samples, respectively. Given that the TGA was performed in air, these numbers account for the formation of iron oxides during heating [17,22], and the actual iron content in both samples are on the order of 21 wt% and 12.9 wt%, respectively, which is in good agreement with the EDS analysis (Table 1). The nature of the weight loss plot for the two samples was also different, which also helps describe the carbon content in the samples. Amorphous carbon burns off prior to SWCNTs in air, and the Rice sample appeared to have more amorphous carbon impurity relative to the NoPo sample. The relatively lower oxidation temperature for the CNTs in the NoPo sample can be attributed to the lower average SWCNT diameter here, and the lower residual metal content in the NoPo sample can also be an explanation in the delayed catalyzed thermal decomposition of amorphous and graphitic carbon relative to Rice HiPco [10].
Raman spectroscopy of the two as-produced HiPco SWCNT samples revealed a mixed bag of information, but again, it must be noted that the slightly lower average diameter for the NoPo SWCNTs compared to those from Rice University would play a role in resonance. This, combined with bundle interference of a detailed analysis of the radial breathing modes (RBMs) in the absence of a liquid Raman spectroscopy holder, also meant it is prudent to limit discussions on the nature of the carbon content and the diameter distribution, rather than chirality distribution.
At an excitation wavelength of 514 nm, as seen in Figure 6, smaller-diameter metallic-SWCNTs (for SWCNTs of average diameter 1 nm) tend to resonate [7] and evidence of a more pronounced activity was observed in the NoPo sample in the RBM range (Figure 6b). The higher-intensity peaks at a higher Raman shift for this sample also were indicative of a relatively lower average diameter compared to the Rice University sample (Figure 6a). At 633 nm, larger-diameter metals and smaller-diameter semiconducting-SWCNTs tend to resonate for an ensemble of average 1 nm diameter. This is where the majority of SWCNTs in the two samples would be expected to resonate (Figure 6c,d). Excitation at 785 nm (Figure 6e,f) is where larger-diameter semiconductors tend to resonate for a SWCNT ensemble of average diameter 1 nm.
A common figure of merit IG/ID (degree of order) was employed for the purposes of evaluating the defect density across different diameters [23]. We have previously reported that in order for meaningful IG/ID values, a number of measurements need to be made across a sample [17]. Table 2 gives the IG/ID value (with associated error) for both samples as a function of the excitation wavelength. The IG/ID value was found to be lower for the NoPo sample at 514 nm, suggesting greater defects for smaller-diameter metallic-SWCNTs. In contrast, for excitation at 633 nm and 785 nm, the NoPo SWCNTs now having higher IG/ID ratios (Figure 7), suggesting lower defects for larger-diameter metals and both smaller- and larger-diameter semiconducting-SWCNTs [7].
The availability of a UV-vis-NIR spectrometer and expertise in usage of the same meant that we were able to prepare surfactant-stabilized aqueous dispersions of both, as described in the experimental section. Once again, it must be noted that the slightly lower average diameter for the NoPo HiPco SWCNTs relative to those from Rice University would make assignment of individual (n,m) chiralities a non-trivial matter, but there is still useful information to be gained from Figure 7, which covers the entire collected spectrum for both dispersions. The procedure used to generate this data has been described previously [7], and we can see that once the CNT bundles and impurities are removed, the individual SWCNTs in both ensembles generally had a similar chirality distribution in the three electronic transitions we see in this range for SWCNTs in the ~1 nm average diameter: M11 for the first metallic transition that would show peaks corresponding to the metallic-SWCNTs, as well as the first (S11) and second (S22) semiconducting transitions for the semiconducting-SWCNTs. There is a small overlap between M11 and S22 for HiPco SWCNTs, which further makes it hard to assign individual peaks completely even for an entirely homogenous sample. It can be noted that there was a small shift towards chiralities favoring smaller diameters for both metallic- and semiconducting-SWCNTs for the NoPo HiPco sample relative to Rice University’s HPR 194.3, and this too agreed with all the characterization data obtained so far.
4. Conclusions
A back-to-back analysis of typical Rice University and NoPo HiPco SWCNT samples has been performed using AFM, TEM, SEM/EDS, Raman spectroscopy, and UV-vis-NIR spectrometer. Although the samples are similar, the NoPo sample comprised smaller average diameter SWCNTs, lower catalyst content, and lower amorphous carbon content. Furthermore, the Raman IG/ID ratio suggested that NoPo samples have fewer defects overall for the smaller-diameter metallic-SWCNTs. The overall result is that, as far as the further use or functionalization of NoPo SWCNTs in comparison to previously published work with Rice HiPco SWCNTs, the former represents a suitable replacement for the latter.
Author Contributions
V.S.G. performed the majority of the characterization and wrote the manuscript. M.A.G., G.R., and R.K.B. helped provide information about the operation of the NoPo reactor and their HiPco SWCNT products and reviewed the manuscript. A.R.B. provided guidance to the experiments and helped write the manuscript.
Funding
This work was funded by the Office of Naval Research (N00014-2717), and the Welsh Government Sêr Cymru National Research Network in Advanced Engineering and Materials (NRN-150).
Acknowledgments
The authors also acknowledge Bruce E. Brinson and W. Wade Adams for useful discussions pertaining to this work.
Conflicts of Interest
V.S.G. and A.R.B. declare no conflict of interest, while M.A.G., G.R., and R.K.B. declare their employment with NoPo Nanotechnologies India Private Limited, India. The founding sponsors had no role in the design of the study; in the collection, analyses, or interpretation of data; in the writing of the manuscript, and in the decision to publish the results”.
References
- Park, S.; Vosguerichian, M.; Bao, Z. A review of fabrication and applications of carbon nanotube film-based flexible electronics. Nanoscale 2013, 5, 1727–1752. [Google Scholar] [CrossRef] [PubMed]
- Eatemadi, A.; Daraee, H.; Karimkhanloo, H.; Kouhi, M.; Zarghami, N.; Akbarzadeh, A.; Abasi, M.; Hanifehpour, Y.; Joo, S.W. Carbon nanotubes: Properties, synthesis, purification, and medical applications. Nanoscale Res. Lett. 2014, 9, 393. [Google Scholar] [CrossRef] [PubMed]
- Kumar, U.; Sikarwar, S.; Sonker, R.K.; Yadav, B.C. Carbon nanotube: Synthesis and application in solar cell. J. Inorg. Organomet. Polym. Mater. 2016, 26, 1231–1242. [Google Scholar] [CrossRef]
- Luo, C.; Xie, H.; Wang, Q.; Luo, G.; Liu, C. A review of the application and performance of carbon nanotubes in fuel cells. J. Nanomater. 2015, 2015, 560392. [Google Scholar] [CrossRef]
- Das, R.; Ali, M.E.; Hamid, S.B.A.; Ramakrishna, S.; Chowdhury, Z.Z. Carbon nanotube membranes for water purification: A bright future in water desalination. Desalination 2014, 336, 97–109. [Google Scholar] [CrossRef]
- Lee, D.; Yoon, J.; Lee, J.; Lee, B.-H.; Seol, M.-L.; Bae, H.; Jeon, S.-B.; Seong, H.; Im, S.G.; Choi, S.-J.; et al. Logic circuits composed of flexible carbon nanotube thin-film transistor and ultra-thin polymer gate dielectric. Sci. Rep. 2016, 6, 26121. [Google Scholar] [CrossRef] [Green Version]
- Gangoli, V.S.; Azhang, J.; Willett, T.T.; Gelwick, S.A.; Haroz, E.H.; Kono, J.; Hauge, R.H.; Wong, M.S. Using nonionic surfactants for production of semiconductor-type carbon nanotubes by gel-based affinity chromatography. Nanomat. Nanotechnol. 2014, 4, 19. [Google Scholar] [CrossRef]
- Hornbostel, B.; Haluska, M.; Cech, J.; Dettlaff, U.; Roth, S. Arc discharge and laser ablation synthesis of singlewalled carbon nanotubes. In Carbon Nanotubes; Springer: Dordrecht, The Netherlands, 2006; pp. 1–18. [Google Scholar]
- Sharma, R.; Sharma, A.K.; Sharma, V. Synthesis of carbon nanotubes by arc-discharge and chemical vapor deposition method with analysis of its morphology, dispersion and functionalization characteristics. Cogent. Eng. 2015, 2, 1094017. [Google Scholar] [CrossRef]
- Arepalli, S. Laser ablation process for single-walled carbon nanotube production. J. Nanosci. Nanotechnol. 2004, 4, 317–325. [Google Scholar] [CrossRef]
- Chrzanowska, J.; Hoffman, J.; Małolepszy, A.; Mazurkiewicz, M.; Kowalewski, T.A.; Szymanski, Z.; Stobinski, L. Synthesis of carbon nanotubes by the laser ablation method: Effect of laser wavelength. Phys. Status Solidi B 2015, 252, 1860–1867. [Google Scholar] [CrossRef] [Green Version]
- Che, G.; Lakshmi, B.B.; Martin, C.R.; Fisher, E.R.; Ruoff, R.S. Chemical vapor deposition based synthesis of carbon nanotubes and nanofibers using a template method. Chem. Mater. 1998, 10, 260–267. [Google Scholar] [CrossRef]
- Cantoro, M.; Hofmann, S.; Pisana, S.; Scardaci, V.; Parvez, A.; Ducati, C.; Ferrari, A.C.; Blackburn, A.M.; Wang, K.-Y.; Robertson, J. Catalytic chemical vapor deposition of single-wall carbon nanotubes at low temperatures. Nano Lett. 2006, 6, 1107–1112. [Google Scholar] [CrossRef] [PubMed]
- Orbaek, A.W.; Aggarwal, N.; Barron, A.R. The development of a ‘process map’ for the growth of carbon nanomaterials from ferrocene by injection CVD. J. Mater. Chem. A 2013, 1, 14122–14132. [Google Scholar] [CrossRef]
- Bronikowski, M.J.; Willis, P.A.; Colbert, D.T.; Smith, K.A.; Smalley, R.E. Gas-phase production of carbon single-walled nanotubes from carbon monoxide via the HiPco process: A parametric study. J. Vac. Sci. Technol. A 2001, 19, 1800. [Google Scholar] [CrossRef]
- Atom Optoelectronics, Inc. Available online: http://www.atomoe.com/hipco.html (accessed on 24 October 2019).
- Zhang, K.S.; Pham, D.; Lawal, O.; Ghosh, S.; Gangoli, V.S.; Smalley, P.; Kennedy, K.; Brinson, B.; Billups, W.E.; Hauge, R.; et al. Overcoming catalyst residue inhibition of the functionalization of single-walled carbon nanotubes via the Billups-Birch reduction. ACS Appl. Mater. Interfaces 2017, 9, 37972–37980. [Google Scholar] [CrossRef]
- Gangoli, V.S.; Raja, P.M.V.; Esquenazi, G.L.; Barron, A.R. The safe handling of bulk low-density nanomaterials. SN Appl. Sci. 2019, 1, 644. [Google Scholar] [CrossRef] [Green Version]
- Hunt, J.; Ferrari, A.; Lita, A.; Crosswhite, M.; Ashley, B.; Stiegman, A.E. Microwave-specific enhancement of the carbon–carbon dioxide (Boudouard) reaction. J. Phys. Chem. C 2013, 117, 26871–26880. [Google Scholar] [CrossRef]
- Ogrin, D.; Chattopadhyay, J.; Sadana, A.K.; Billups, E.; Barron, A.R. Epoxidation and deepoxidation of single-walled carbon nanotubes: Quantification of epoxide defects. J. Am. Chem. Soc. 2006, 128, 11322–11323. [Google Scholar] [CrossRef]
- Wright, K.D.; Barron, A.R. Catalyst residue and oxygen species inhibition of the formation of hexahapto-metal complexes of group 6 metals on single-walled carbon nanotubes. C 2017, 3, 17. [Google Scholar] [CrossRef]
- Pham, D.; Zhang, K.S.; Lawal, O.; Ghosh, S.; Gangoli, V.S.; Ainscough, T.; Hauge, R.H.; Adams, W.W.; Barron, A.R. Apparatus for scalable functionalization of single-walled carbon nanotubes via the billups-birch reduction. C 2017, 3, 19. [Google Scholar] [CrossRef]
- Dresselhaus, M.S.; Dresselhaus, G.; Jorio, A. raman spectroscopy of carbon nanotubes in 1997 and 2007. J. Phys. Chem. C 2007, 111, 17887–17893. [Google Scholar] [CrossRef]
Figure 1.
Photographs of as-produced (a) Rice HiPco SWCNTs and (b) NoPo HiPco SWCNTs.

Figure 2.
A randomly chosen (a) atomic force microscopy (AFM) image and the (b) associated height profiles, at three measurement lines for as-produced HiPco SWCNTs in tapping mode. A minimum of 500 nanotubes was analyzed per sample to generate a diameter distribution.
Figure 2.
A randomly chosen (a) atomic force microscopy (AFM) image and the (b) associated height profiles, at three measurement lines for as-produced HiPco SWCNTs in tapping mode. A minimum of 500 nanotubes was analyzed per sample to generate a diameter distribution.

Figure 3.
Example TEM images of as-produced (a) Rice University HiPco and (b) NoPo HiPco CNTs. The average diameters match the numbers obtained from AFM. Scale bar = 5 nm.
Figure 3.
Example TEM images of as-produced (a) Rice University HiPco and (b) NoPo HiPco CNTs. The average diameters match the numbers obtained from AFM. Scale bar = 5 nm.

Figure 4.
Example SEM image of as-produced (a) Rice University HiPco and (b) NoPo HiPco CNTs. Scale bar = 0.25 μm.
Figure 4.
Example SEM image of as-produced (a) Rice University HiPco and (b) NoPo HiPco CNTs. Scale bar = 0.25 μm.

Figure 5.
TGA of the two HiPco samples showing a higher impurity content (residual metal catalyst) in a typical Rice HiPco batch relative to that from NoPo sample.
Figure 5.
TGA of the two HiPco samples showing a higher impurity content (residual metal catalyst) in a typical Rice HiPco batch relative to that from NoPo sample.

Figure 6.
Representative resonant Raman spectra of as-produced (a,c,e) Rice University HiPco, and (b,d,f) NoPo HiPco SWCNTs at an excitation wavelength of (a,b) 514 nm, (c,d) 633 nm, and (e,f) 785 nm.
Figure 6.
Representative resonant Raman spectra of as-produced (a,c,e) Rice University HiPco, and (b,d,f) NoPo HiPco SWCNTs at an excitation wavelength of (a,b) 514 nm, (c,d) 633 nm, and (e,f) 785 nm.

Figure 7.
UV-vis-NIR spectroscopy of surfactant-stabilized aqueous dispersions of the two HiPco SWCNT samples. The relatively smaller average diameter for the NoPo SWCNTs results in a small shift of (n,m) chiralities towards the smaller-diameter metallic- and semiconducting-SWCNTs, but generally, both ensembles have a similar distribution.


Table 1.
EDS elemental analysis (wt%) of Rice University (HPR 194.3) and NoPo HiPco SWCNTs.
| Element | Rice University | NoPo |
|---|---|---|
| C | 64 ± 5.5 | 78 ± 5.3 |
| Fe | 24 ± 3.2 | 12 ± 2.6 |
| O | 10 ± 2.2 | 9 ± 2.2 |
| other | 2 ± 0.5 | 1 ± 0.25 |
Table 2.
Raman spectral analysis of Rice University (HPR 194.3) and NoPo HiPco SWCNTs.
| Excitation Wavelength (nm) | Rice University | NoPo |
|---|---|---|
| 514 | 4.6 ± 0.5 | 9.5 ± 1.7 |
| 633 | 7.1 ± 0.9 | 15.4 ± 1.5 |
| 785 | 11.4 ± 3.1 | 17.8 ± 2.4 |
© 2019 by the authors. Licensee MDPI, Basel, Switzerland. This article is an open access article distributed under the terms and conditions of the Creative Commons Attribution (CC BY) license (http://creativecommons.org/licenses/by/4.0/).
Share and Cite
MDPI and ACS Style
Gangoli, V.S.; Godwin, M.A.; Reddy, G.; Bradley, R.K.; Barron, A.R. The State of HiPco Single-Walled Carbon Nanotubes in 2019. C 2019, 5, 65. https://doi.org/10.3390/c5040065
AMA Style
Gangoli VS, Godwin MA, Reddy G, Bradley RK, Barron AR. The State of HiPco Single-Walled Carbon Nanotubes in 2019. C. 2019; 5(4):65. https://doi.org/10.3390/c5040065
Chicago/Turabian StyleGangoli, Varun Shenoy, M. Anto Godwin, Gadhadar Reddy, Robert Kelley Bradley, and Andrew R. Barron. 2019. "The State of HiPco Single-Walled Carbon Nanotubes in 2019" C 5, no. 4: 65. https://doi.org/10.3390/c5040065
Note that from the first issue of 2016, this journal uses article numbers instead of page numbers. See further details here.